(edited 8/23/09 0710 CDT: Changed plots & revised text to reflect the fact that NCDC, not CRU, is apparently the source of the SST dataset; also add discussion of possible RFI interference in satellite measurements)
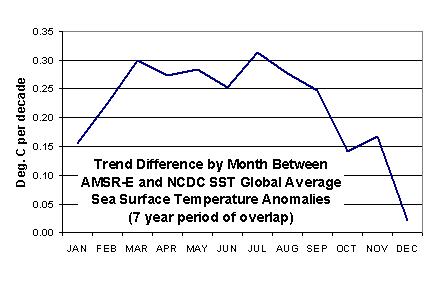
(edited 8/22/09 1415 CDT: added plot of trend differences by month at bottom)
In my previous blog posting I showed the satellite-based global-average monthly sea surface temperature (SST) variations since mid-2002, which was when the NASA Aqua satellite was launched carrying the Advanced Microwave Scanning Radiometer for EOS (AMSR-E). The AMSR-E instrument (which I serve as the U.S. Science Team Leader for) provides nearly all-weather SST measurements.
The plot I showed yesterday agreed with the NOAA announcement that July 2009 was unusually warm…NOAA claims it was even a new record for July based upon their 100+ year record of global SSTs.
But I didn’t know just HOW warm, since our satellite data extend back to only 2002. So, I decided to download the NOAA/NCDC SST data from their website — which do NOT include the AMSR-E measurements — to do a more quantitative comparison.
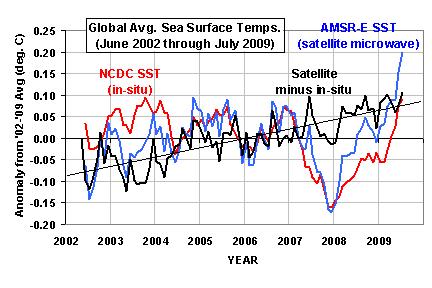
From the NOAA data, I computed monthly anomalies in exactly the same manner I computed them with the AMSR-E data, that is, relative to the June 2002 through July 2009 period of record. The results (shown below) were so surprising, I had to go to my office this Saturday morning to make sure I didn’t make a mistake in my processing of the AMSR-E data.
As can be seen, the satellite-based temperatures have been steadily rising relative to the conventional SST measurements, with a total linear increase of 0.15 deg C over the 7 year period of record versus the conventional SST measurements.
If the satellite data are correct, then this means that the July 2009 SSTs reached a considerably higher record temperature than NOAA has claimed. The discrepancy is huge in terms of climate measurements; the trend in the difference between the two datasets shown in the above figure is the same size as the anthropogenic global warming signal expected by the IPCC.
I have no idea what is going on here. Frank Wentz and Chelle Gentemann at Remote Sensing Systems have been very careful about tracking the accuracy of the AMSR-E SST retrievals with millions of buoy measurements. I checked their daily statistics they post at their website and I don’t see anything like what is shown in the above figure.
Is it possible that the NCDC SST temperature dataset has been understating recent warming? I don’t know…I’m mystified. Maybe Frank, Chelle, Phil Jones, or some enterprising blogger out there can figure this one out.
UPDATE #1 (8/22/09)
Here’s the trend differences between the satellite and in-situ data, broken out by calendar month. The problem seems to be mainly a Northern Hemisphere warm season phenomenon.
UPDATE#2 (8/23/09)
Anthony Watts has suggested that the radio frequency interference (RFI) that we see in the AMSR-E 6.9 GHz data over land might be gradually invading the ocean as more boats install various kinds of microwave transmitters. While it’s hard for me to believe such an effect could be this strong (we have never seen obvious evidence of oceanic RFI before), this is still an interesting hypothesis, so this week I will examine the daily 1/4 deg. grids of AMSR-E SST and compute a spatial “speckle” statistic to see if there is any evidence of this kind of interference increasing over time. I should note that we HAVE seen more RFI reflected off the ocean from geostationary TV communication satellites in the AMSR-E data in recent years.

 Home/Blog


