(UPDATED 8/26/09 at 13:30 CDT
Added a new plot comparing TMI and AMSR-E global monthly SSTs)
NOAA/NCDC recently announced that July 2009 set a new record high global sea surface temperature (SST) for the month of July, just edging out July 1998. This would be quite significant since July 1998 was very warm due to a strong El Nino, whereas last month (July, 2009) is just heading into an El Nino which has hardly gotten rolling yet.
If July was indeed a record, one might wonder if we are about to see a string of record warm months if a moderate or strong El Nino does sustain itself, with that natural warming being piled on top of the manmade global warming that the “scientific consensus” is so fond of.
I started out looking at the satellite microwave SSTs from the AMSR-E instrument on NASA’s Aqua satellite. Even though those data only extend back to 2002, I though it would provide a sanity check. My last post described a significant discrepancy I found between the NOAA/NCDC “ERSST” trend and the satellite microwave SST trend (from the AMSR-E instrument on Aqua) over the last 7 years…but with the AMSR-E giving a much warmer July 2009 anomaly than the NCDC claimed existed! The discrepancy was so large that my sanity-check turned into me going a little insane trying to figure it out.
So, since we have another satellite dataset with a longer record that would allow a direct comparison between 1998 and 2009, I decided to analyze the full record from the TRMM Microwave Imager (TMI). The TRMM satellite covers the latitudes between 40N and 40S, so a small amount of N. Hemisphere ocean is being missed, and a large chunk of the ocean around Antarctica will be missed as well. But since my analysis of the ERSST and AMSR-E SST data suggested the discrepancy between them was actually between these latitudes as well, I decided that the results should give a pretty good independent check on the NOAA numbers. All of the original data that went into the averaging came from the Remote Sensing Systems (RSS) website, SSMI.com. Anomalies were computed about the mean annual cycle from data over the whole period of record.
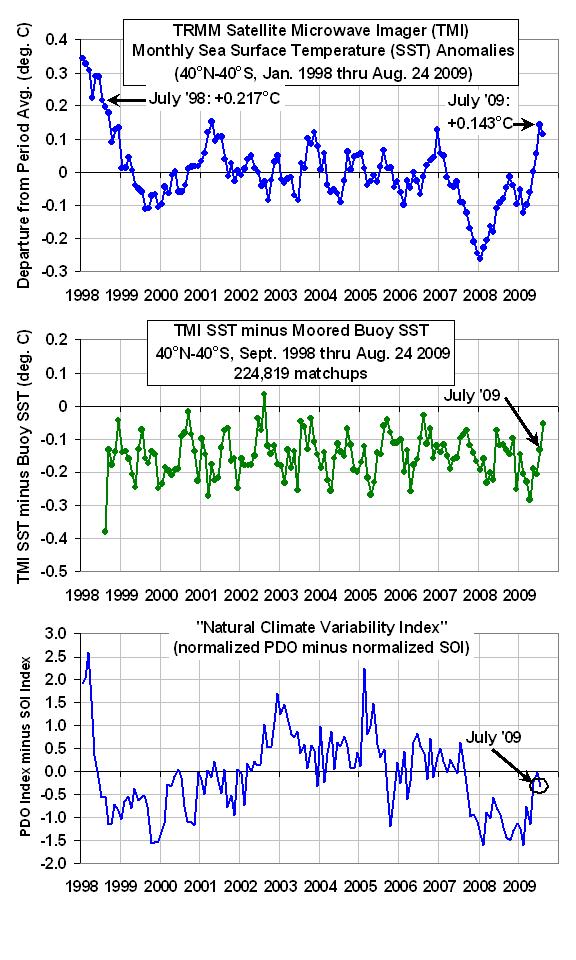
The results are shown in the following three panels. The first panel shows monthly SST anomalies since January 1998, and as can be seen July 2009 came in about 0.06 deg. C below July 1998. At face value, this suggests that July 2009 might not have been a record. And as you can see from the first 3 weeks of August data, it looks like this month will come in even cooler.

Now, if you are wondering how accurate these monthly anomalies are, the second panel shows the validation statistics that RSS archives in near-real time. Out of the 5 different classes of in situ validation data, I chose just the moored buoys due to their large volume of data (over 200,000 matchups between buoys and satellite observations), and a relatively fixed geographic coverage (unlike drifting buoys). As can be seen, the TMI SST record shows superb long-term stability. The 0.15 deg. C cool bias in the TMI measurements is from the “cool skin” effect, with water temperatures in the upper few millimeters being slightly cooler on average than the SSTs measured by the buoys, typically at a depth around 1 meter.
The third and final panel in the above figure shows that a substantial fraction of the monthly SST variability from year to year is due to the Southern Oscillation (El Nino/La Nina), and the Pacific Decadal Oscillation, PDO. Each of these indices have a correlation of 0.33 with SST for monthly averages over the 40N-40S latitude band, while their sum (taking the negative of the SOI first) is correlated at 0.39. I did not look at lag correlations, which might be higher, and it looks like some additional time averaging would increase the correlation.
I will post again when I have new information on my previously reported discrepancy between NOAA’s results and the AMSR-E results. That is still making me a little crazy.
8/26/09 13:30 CDT UPDATE
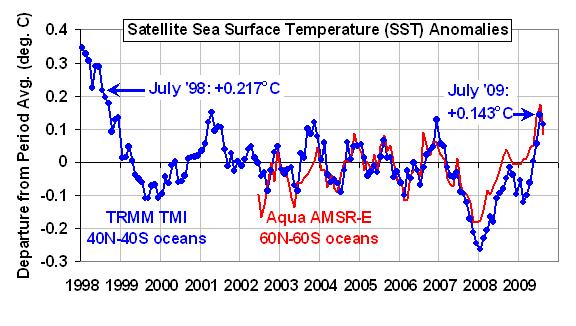
I computed the monthly global (60N to 60S latitudes) AMSR-E SST anomalies, adjusted them for the difference in annual cycles with the longer TMI record, and then plotted the AMSR-E and TMI SST anomalies together. Even though the TMI can not measure poleward of 40 deg. latitude (N or S), we see reasonable agreement between the two products.

None of this represents proof that July 2009 was not a record warm month in ocean surface temperatures, but it does cast significant doubt on the claim. But the focus on a single month misses the big picture: recent years have yet to reach the warmth of 1998. Only time will tell whether we get another year that approaches that unusual event.

 Home/Blog


