Archive for October, 2009

An Expensive Urban Legend

Saturday, October 24th, 2009

About.com describes an “urban legend” as an apocryphal (of questionable authenticity), secondhand story, told as true and just plausible enough to be believed, about some horrific…series of events….it’s likely to be framed as a cautionary tale. Whether factual or not, an urban legend is meant to be believed. In lieu of evidence, however, the teller of an urban legend is apt to rely on skillful storytelling and reference to putatively trustworthy sources.

I contend that the belief in human-caused global warming as a dangerous event, either now or in the future, has most of the characteristics of an urban legend. Like other urban legends, it is based upon an element of truth. Carbon dioxide is a greenhouse gas whose concentration in the atmosphere is increasing, and since greenhouse gases warm the lower atmosphere, more CO2 can be expected, at least theoretically, to result in some level of warming.

But skillful storytelling has elevated the danger from a theoretical one to one of near-certainty. The actual scientific basis for the plausible hypothesis that humans could be responsible for most recent warming is contained in the cautious scientific language of many scientific papers. Unfortunately, most of the uncertainties and caveats are then minimized with artfully designed prose contained in the Summary for Policymakers (SP) portion of the report of the UN’s Intergovernmental Panel on Climate Change (IPCC). This Summary was clearly meant to instill maximum alarm from a minimum amount of direct evidence.

Next, politicians seized upon the SP, further simplifying and extrapolating its claims to the level of a “climate crisis”. Other politicians embellished the tale even more by claiming they “saw” global warming in Greenland as if it was a sighting of Sasquatch, or that they felt it when they fly in airplanes.

Just as the tales of marauding colonies of alligators living in New York City sewers are based upon some kernel of truth, so too is the science behind anthropogenic global warming. But there is a big difference between reports of people finding pet alligators that have escaped their owners, versus city workers having their limbs torn off by roving colonies of subterranean monsters.

In the case of global warming, the “putatively trustworthy sources” would be the consensus of the world’s scientists. The scientific consensus, after all, says that global warming is…is what? Is happening? Is severe? Is manmade? Is going to burn the Earth up if we do not act? It turns out that those who claim consensus either do not explicitly state what that consensus is about, or they make up something that supports their preconceived notions.

If the consensus is that the presence of humans on Earth has some influence on the climate system, then I would have to even include myself in that consensus. After all, the same thing can be said of the presence of trees on Earth, and hopefully we have at least the same rights as trees do. But too often the consensus is some vague, fill-in-the-blank, implied assumption where the definition of “climate change” includes the phrase “humans are evil”.

It is a peculiar development that scientific truth is now decided through voting. A relatively recent survey of climate scientists who do climate research found that 97.4% agreed that humans have a “significant” effect on climate. But the way the survey question was phrased borders on meaninglessness. To a scientist, “significant” often means non-zero. The survey results would have been quite different if the question was, “Do you believe that natural cycles in the climate system have been sufficiently researched to exclude them as a potential cause of most of our recent warming?”

And it is also a good bet that 100% of those scientists surveyed were funded by the government only after they submitted research proposals which implicitly or explicitly stated they believed in anthropogenic global warming to begin with. If you submit a research proposal to look for alternative explanations for global warming (say, natural climate cycles), it is virtually guaranteed you will not get funded. Is it any wonder that scientists who are required to accept the current scientific orthodoxy in order to receive continued funding, then later agree with that orthodoxy when surveyed? Well, duh.

In my experience, the public has the mistaken impression that a lot of climate research has gone into the search for alternative explanations for warming. They are astounded when I tell them that virtually no research has been performed into the possibility that warming is just part of a natural cycle generated within the climate system itself.

Too often the consensus is implied to be that global warming is so serious that we must do something now in the form of public policy to avert global catastrophe. What? You don’t believe that there are alligators in New York City sewer system? How can you be so unconcerned about the welfare of city workers that have to risk their lives by going down there every day? What are you, some kind of Holocaust-denying, Neanderthal flat-Earther?

It makes complete sense that in this modern era of scientific advances and inventions that we would so readily embrace a compelling tale of global catastrophe resulting from our own excesses. It’s not a new genre of storytelling, of course, as there were many B-movies in the 1950s whose horror themes were influenced by scientists’ development of the atomic bomb.

Our modern equivalent is the 2004 movie, “Day After Tomorrow”, in which all kinds of physically impossible climatic events occur in a matter of days. In one scene, super-cold stratospheric air descends to the Earth’s surface, instantly freezing everything in its path. The meteorological truth, however, is just the opposite. If you were to bring stratospheric air down to the surface, heating by compression would make it warmer than the surrounding air, not colder.

I’m sure it is just coincidence that “Day After Tomorrow” was directed by Roland Emmerich, who also directed the 1996 movie “Independence Day,” in which an alien invasion nearly exterminates humanity. After all, what’s the difference? Aliens purposely killing off humans, or humans accidentally killing off humans? Either way, we all die.

But a global warming catastrophe is so much more believable. After all, climate change does happen, right? So why not claim that ALL climate change is now the result of human activity? And while we are at it, let’s re-write climate history so that we get rid of the Medieval Warm Period and the Little Ice age, with a new ingenious hockey stick-shaped reconstruction of past temperatures that makes it look like climate never changed until the 20th Century? How cool would that be?

The IPCC thought it was way cool…until it was debunked, after which it was quietly downgraded in the IPCC reports from the poster child for anthropogenic global warming, to one possible interpretation of past climate.

And let’s even go further and suppose that the climate system is so precariously balanced that our injection of a little bit of that evil plant food, carbon dioxide, pushes our world over the edge, past all kinds of imaginary tipping points, with the Greenland ice sheet melting away, and swarms of earthquakes being the price of our indiscretions.

In December, hundreds of bureaucrats from around the world will once again assemble, this time in Copenhagen, in their attempts to forge a new international agreement to reduce greenhouse gas emissions as a successor to the Kyoto Protocol. And as has been the case with every other UN meeting of its type, the participants simply assume that the urban legend is true. Indeed, these politicians and governmental representatives need it to be true. Their careers and political power now depend upon it.

And the fact that they hold their meetings in all of the best tourist destinations in the world, enjoying the finest exotic foods, suggests that they do not expect to ever have to be personally inconvenienced by whatever restrictions they try to impose on the rest of humanity.

If you present these people with evidence that the global warming crisis might well be a false alarm, you are rewarded with hostility and insults, rather than expressions of relief. The same can be said for most lay believers of the urban legend. I say “most” because I once encountered a true believer who said he hoped my research into the possibility that climate change is mostly natural will eventually be proved correct.

Unfortunately, just as we are irresistibly drawn to disasters – either real ones on the evening news, or ones we pay to watch in movie theaters – the urban legend of a climate crisis will persist, being believed by those whose politics and worldviews depend upon it. Only when they finally realize what a new treaty will cost them in loss of freedoms and standard of living will those who oppose our continuing use of carbon-based energy begin to lose their religion.


IPCC Crushes Scientific Objectivity, 91-0.

Sunday, October 18th, 2009

Unquestionably, the U.N. Intergovernmental Panel on Climate Change (IPCC) was formed to build the scientific case for humanity being the primary cause of global warming. Such a goal is fundamentally unscientific, as it is hostile to alternative hypotheses for the causes of climate change.

The most glaring example of this bias has been the lack of interest on the IPCC’s part in figuring out to what extent climate change is simply the result of natural, internal cycles in the climate system. In Chapter 9 of the latest (4th) IPCC report, entitled “Understanding and Attributing Climate Change”, you would think the issue of external versus internal forcing would be thoroughly addressed. But you would be wrong.

The IPCC is totally obsessed with external forcing, that is, energy imbalances imposed upon the climate system that are NOT the result of the natural, internal workings of the system. For instance, a search through Chapter 9 for the phrase “external forcing” yields a total of 91 uses of that term. A search for the phrase “internal forcing” yields…(wait for it)…zero uses. Can we really believe that the IPCC has ruled out natural sources of global warming when such a glaring blind spot exists?

Admittedly, we really do not understand internal sources of climate change. Weather AND climate involves chaotic processes, most of which we may never understand, let alone predict. While chaos in weather is exhibited on time scales of days to weeks, chaotic changes in the ocean circulation could have time scales as long as hundreds of years, and we know that cloud formation – providing the Earth’s natural sun shade – is strongly influenced by the ocean.

Thus, small changes in ocean circulation can lead to small changes in the Earth’s albedo (how much sunlight is reflected back to space), which in turn can lead to global warming or cooling. The IPCC’s view (which is never explicitly stated) that such changes in the climate system do not occur is little more than faith on their part.

The IPCC’s pundits like to claim that the published evidence for humanity causing warming greatly outweighs any published evidence against it. This appeal to majority opinion on their part is pretty selective, though. They had no trouble discarding hundreds of research papers supporting evidence for the Medieval Warm Period or the Little Ice Age when they so uncritically embraced the infamous “Hockey Stick” reconstructions of past temperature change.

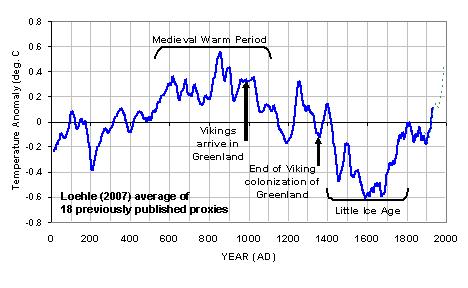
Despite a wide variety of previous temperature proxies gathered from around the world (see figure below) that so clearly showed that centuries with global warming and cooling are the rule, not the exception, the Hockey Stick was mostly based upon some cherry-picked tree rings combined with the assumption that significant warming is a uniquely modern phenomenon.
2000-years-Loehle

As such, they rejected the prevailing “scientific consensus” in favor of a minority view that supported their desired outcome. I suspect that they do not even recognize their own hypocrisy.

As I have discussed before, the IPCC’s neglect of natural variability in the climate system ends up leading to circular reasoning on their part. They ignore the effect of natural cloud variations when trying to diagnose feedback, which then leads to overestimates of climate sensitivity. This, in turn, causes them to conclude that increasing carbon dioxide concentrations alone are sufficient to explain global warming, and so no natural forcings of climate change need be found.

But all they have done is reasoned themselves in a circle. By ignoring natural variability, they can end up claiming that natural variability does not exist. Admittedly, their position is internally consistent. But then, so is all circular reasoning.

Our re-submitted paper to the Journal of Geophysical Research entitled “On the Diagnosis of Radiative Feedback in the Presence of Unknown Radiative Forcing” will hopefully lead to a little more diversity being permitted in the global warming debate.

I don’t think the IPCC scientists are as opposed to this as are their self-appointed spokespersons, like Al Gore and numerous environmental writers in the media who get to over-simplify the climate issue without ever being corrected by the IPCC. Natural climate change continues to be the 800 lb gorilla in the room, and I suspect that some within the IPCC are slowly becoming aware of its existence.


Global Average SST Update to October 14

Wednesday, October 14th, 2009

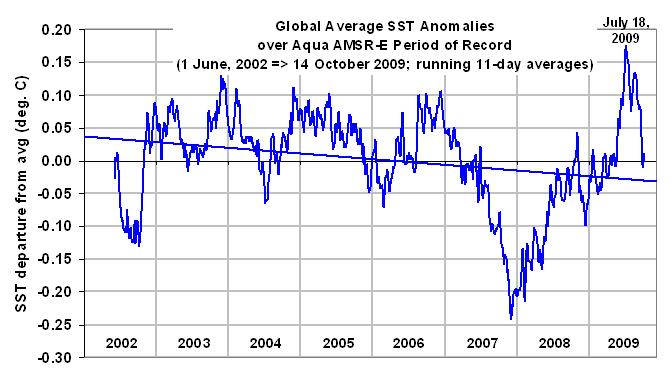
Since the global average sea surface temperature (SST) anomalies (departures from average) hit a peak a couple of months ago, I thought it would be a good time to see how they are progressing. Here’s a plot of running 11-day SST anomalies for the global oceans (60N to 60S latitude):
AMSR-E-SST-thru-10-14-09

As can be seen, at least for the time being, temperatures have returned to the long-term average. Of course, this says nothing about what will happen in the future. I have also plotted the linear trend line, which is for entertainment purposes only.

The SSTs come from the AMSR-E instrument on NASA’s Aqua satellite, and are computed and archived at Remote Sensing Systems (Frank Wentz). I believe them to be the most precise record of subtle SST changes available, albeit only since mid-2002.


Hotspots and Fingerprints

Sunday, October 11th, 2009

It is claimed by the IPCC that there are ‘fingerprints’ associated with global warming which can be tied to humanity’s greenhouse gas emissions, as if the signatures were somehow unique like real fingerprints.

But I have never been convinced that there is ANY fingerprint of anthropogenic warming. And the reason is that any sufficiently strong radiative warming influence – for instance, a small (even unmeasurable) decrease in cloud cover letting in slightly more sunlight starting back in the late 1970’s or 1980’s– would have had the same effect.

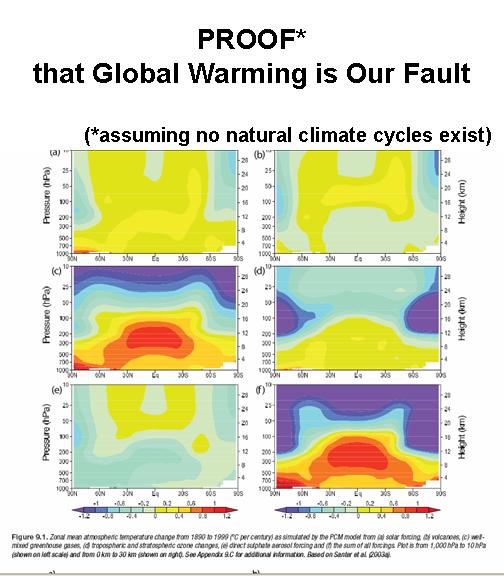
The intent of the following figure from Chapter 9 in the latest (AR4) version IPCC report is to convince the reader that greenhouse gas emissions have been tested against all other sources of warming, and that GHGs are the only agent that can cause substantial warming. (The snarky reference to “proof” is my addition.)
Hot-spot-proof

But all the figure demonstrates is that the warming influence of GHGs is stronger than that from a couple of other known external forcing mechanisms, specifically a very small increase in the sun’s output, and a change in ozone. It says absolutely nothing about the possibility that warming might have been simply part of a natural, internal fluctuation (cycle, if you wish) in the climate system.

For instance, the famous “hot spot” seen in the figure has become a hot topic in recent years since at least two satellite temperature datasets (including our UAH dataset), and most radiosonde data analyses suggest the tropical hotspot does not exist. Some have claimed that this somehow invalidates the hypothesis that anthropogenic greenhouse gas emissions are responsible for global warming.

But the hotspot is not a unique signature of manmade greenhouse gases. It simply reflects anomalous heating of the troposphere — no matter what its source. Anomalous heating gets spread throughout the depth of the troposphere by convection, and greater temperature rise in the upper troposphere than in the lower troposphere is because of latent heat release (rainfall formation) there.

For instance, a natural decrease in cloud cover would have had the same effect. It would lead to increased solar warming of the ocean, followed by warming and humidifying of the global atmosphere and an acceleration of the hydrologic cycle.

Thus, while possibly significant from the standpoint of indicating problems with feedbacks in climate models, the lack of a hotspot no more disproves manmade global warming than the existence of the hotspot would have proved manmade global warming. At most, it would be evidence that the warming influence of increasing GHGs in the models has been exaggerated, probably due to exaggerated positive feedback from water vapor.

The same is true of the supposed fingerprint of greater warming over land than over the ocean, of which there is some observational evidence. But this would also be caused by a slight decrease in cloud cover…even if that decrease only occurred over the ocean (Compo, G.P., and P. D. Sardeshmukh, 2009).

What you find in the AR4 report is artfully constructed prose about how patterns of warming are “consistent with” that expected from manmade greenhouse gases. But “consistent with” is not “proof of”.

The AR4 authors are careful to refer to “natural external factors” that have been ruled out as potential causes, like those seen in the above figure. I can only assume this is was deliberate attempt to cover themselves just in case most warming eventually gets traced to natural internal changes in the climate system, rather than to that exceedingly scarce atmospheric constituent that is necessary for life of Earth – carbon dioxide.


September 2009 UAH Global Temperature Update +0.42 deg. C

Wednesday, October 7th, 2009


YR MON GLOBE NH SH TROPICS
2009 1 +0.304 +0.443 +0.165 -0.036
2009 2 +0.347 +0.678 +0.016 +0.051
2009 3 +0.206 +0.310 +0.103 -0.149
2009 4 +0.090 +0.124 +0.056 -0.014
2009 5 +0.045 +0.046 +0.044 -0.166
2009 6 +0.003 +0.031 -0.025 -0.003
2009 7 +0.411 +0.212 +0.610 +0.427
2009 8 +0.229 +0.282 +0.177 +0.456
2009 9 +0.424 +0.554 +0.295 +0.516

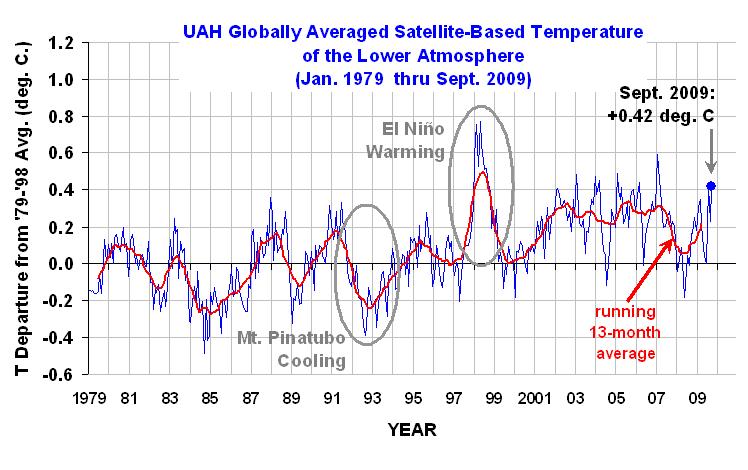
UAH_LT_1979_thru_Sept_09

The global-average lower tropospheric temperature anomaly in September 2009 rebounded again, from +0.23 deg. C in August to +0.42 deg. C in September. The tropics and Northern Hemisphere continue to dominate the signal.

NOTE: For those who are monitoring the daily progress of global-average temperatures here, we are still working on switching from NOAA-15 to Aqua AMSU, which will provide more accurate tracking on a daily basis. We will be including both our lower troposphere (LT) and mid-tropospheric (MT) pre-processing of the data. We have added the global sea surface temperature anomalies from the AMSR-E instrument on board the NASA Aqua satellite, computed from files at Remote Sensing Systems, although we are still not done adjusting the display range of those data.


The Search for a Short Term Marker of Long Term Climate Sensitivity

Sunday, October 4th, 2009

[This is an update on research progress we have made into determining just how sensitive the climate system is to increasing atmospheric greenhouse gas concentrations.]

While published studies are beginning to suggest that net feedbacks in the climate system could be negative for year-to-year variations (e.g., our 2007 paper, and the new study by Lindzen and Choi, 2009), there remains the question of whether the same can be said of long-term climate sensitivity (and therefore, of the strength of future global warming).

Even if we find observational evidence of an insensitive climate system for year-to-year fluctuations in the climate system, it could be that the system’s long term response to more carbon dioxide is very sensitive. I’m not saying I believe that is the case – I don’t – but it is possible. This question of a potentially large difference in short-term and long-term responses of the climate system has been bothering me for many months.

Significantly, as far as I know, the climate modelers have not yet demonstrated that there is any short-term behavior in their models which is also a good predictor of how much global warming those models project for our future. It needs to be something we can measure, something we can test with real observations. Just because all of the models behave more-or-less like the real climate system does not mean the range of warming they produce encompasses the truth.

For instance, computing feedback parameters (a measure of how much the radiative balance of the Earth changes in response to a temperature change) would be the most obvious test. But I’ve diagnosed feedback parameters from 7- to 10-year subsets of the models’ long-term global warming simulations, and they have virtually no correlation with those models known long-term feedbacks. (I am quite sure I know the reason for this…which is the subject of our JGR paper now being revised…I just don’t know a good way around it).

But I refuse to give up searching. This is because the most important feedbacks in the climate system – clouds and water vapor – have inherently short time scales…minutes for individual clouds, to days or weeks for large regional cloud systems and changes in free-tropospheric water vapor. So, I still believe that there MUST be one or more short term “markers” of long term climate sensitivity.

Well, this past week I think I finally found one. I’m going to be a little evasive about exactly what that marker is because, in this case, the finding is too important to give away to another researcher who will beat me to publishing it (insert smiley here).

What I will say is that the marker ‘index’ is related to how the climate models behave during sudden warming events and the cooling that follows them. In the IPCC climate models, these warming/cooling events typically have time scales of several months, and are self-generated as ‘natural variability’ within the models. (I’m not concerned that I’ve given it away, since the marker is not obvious…as my associate Danny Braswell asked, “What made you think of that?”)

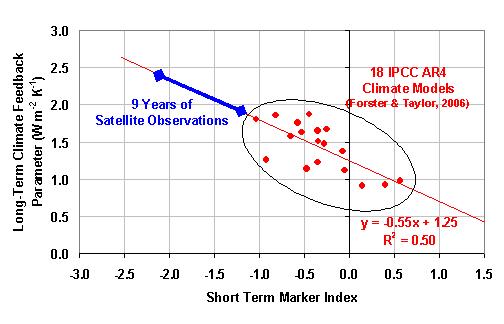
The following plot shows how this ‘mystery index’ is related to the net feedback parameters diagnosed in those 18 climate models by Forster and Taylor (2006). As can be seen, it explains 50% of the variance among the different models. The best I have been able to do up to this point is less than 10% explained variance, which for a sample size of 18 models might as well be zero.
Short-term-marker-of-climate-sensitivity

Also plotted is the range of values of this index from 9 years of CERES satellite measurements computed in the same manner as with the models’ output. As can be seen, the satellite data support lower climate sensitivity (larger feedback parameter) than any of the climate models…but not nearly as low as the 6 Watts per sq. meter per degree found for tropical climate variations by us and others.

For a doubling of atmospheric carbon dioxide, the satellite measurements would correspond to about 1.6 to 2.0 deg. C of warming, compared to the 18 IPCC models’ range shown, which corresponds to warming of from about 2.0 to 4.2 deg. C.

The relatively short length of record of our best satellite data (9 years) appears to be the limiting factor in this analysis. The model results shown in the above figure come from 50 years of output from each of the 18 models, while the satellite range of results comes from only 9 years of CERES data (March 2000 through December 2008). The index needs to be computed from as many strong warming events as can be found, because the marker only emerges when a number of them are averaged together.

Despite this drawback, the finding of this short-term marker of long-term climate sensitivity is at least a step in the right direction. I will post progress on this issue as the evidence unfolds. Hopefully, more robust markers can be found that show even a stronger relationship to long-term warming in the models, and which will produce greater confidence when tested with relatively short periods of satellite data.