I am still receiving questions about the method by which the satellite microwave measurements are calibrated to get atmospheric temperatures. The confusion seems to have arisen because Christopher Monckton has claimed that our satellite data must be tied to the surface thermometer data, and after Climategate (as well all know) those traditional measurements have become suspect. So, time for a little tutorial.
NASA’S AQUA SATELLITE
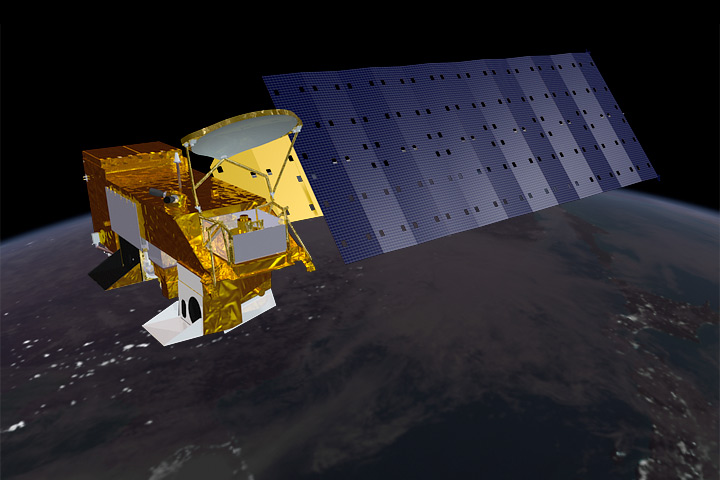
The UAH global temperatures currently being produced come from the Advanced Microwave Sounding Unit (AMSU) flying on NASA’s Aqua satellite. AMSU is located on the bottom of the spacecraft (seen below); the AMSR-E instrument that I serve as the U.S. Science Team Leader for is the one on top of the satellite with the big dish.

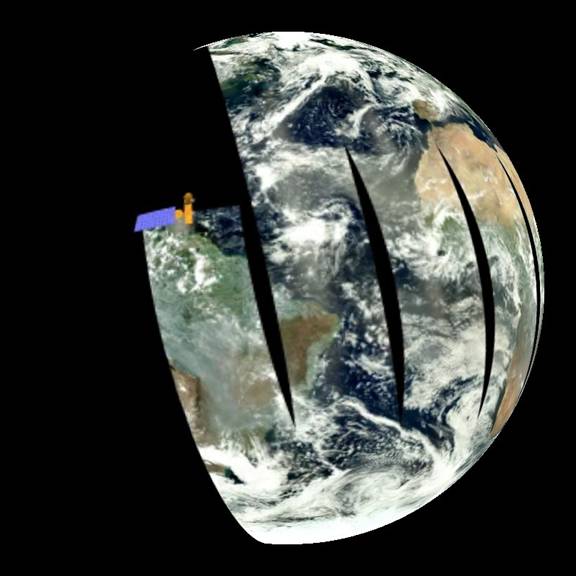
Aqua has been operational since mid-2002, and is in a sun-synchronous orbit that crosses the equator at about 1:30 am and pm local solar time. The following image illustrates how AMSU, a cross-track scanner, continuously paints out an image below the spacecraft (actually, this image comes from the MODIS visible and infrared imager on Aqua, but the scanning geometry is basically the same):

HOW MICROWAVE RADIOMETERS WORK
Microwave temperature sounders like AMSU measure the very low levels of thermal microwave radiation emitted by molecular oxygen in the 50 to 60 GHz oxygen absorption complex. This is somewhat analogous to infrared temperature sounders (for instance, the Atmospheric InfraRed Sounder, AIRS, also on Aqua) which measure thermal emission by carbon dioxide in the atmosphere.
As the instrument scans across the subtrack of the satellite, the radiometer’s antenna views thirty separate ‘footprints’, nominally 50 km in diameter, each over over a 50 millisecond ‘integration time’. At these microwave frequencies, the intensity of thermally-emitted radiation measured by the instrument is directly proportional to the temperature of the oxygen molecules. The instrument actually measures a voltage, which is digitized by the radiometer and recorded as a certain number of digital counts. It is those digital counts which are recorded on board the spacecraft and then downlinked to satellite tracking stations in the Arctic.
HOW THE DATA ARE CALIBRATED TO TEMPERATURES
Now for the important part: How are these instrument digitized voltages calibrated in terms of temperature?
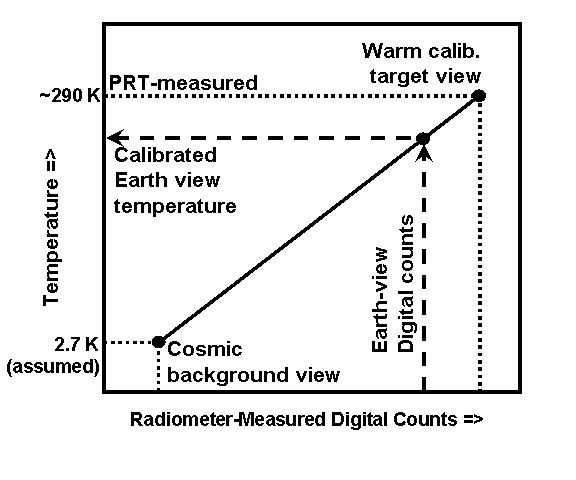
Once every Earth scan, the radiometer antenna looks at a “warm calibration target” inside the instrument whose temperature is continuously monitored with several platinum resistance thermometers (PRTs). PRTs work somewhat like a thermistor, but are more accurate and more stable. Each PRT has its own calibration curve based upon laboratory tests.
The temperature of the warm calibration target is allowed to float with the rest of the instrument, and it typically changes by several degrees during a single orbit, as the satellite travels in and out of sunlight. While this warm calibration point provides a radiometer digitized voltage measurement and the temperature that goes along with it, how do we use that information to determine what temperatures corresponds to the radiometer measurements when looking at the Earth?
A second calibration point is needed, at the cold end of the temperature scale. For that, the radiometer antenna is pointed at the cosmic background, which is assumed to radiate at 2.7 Kelvin degrees. These two calibration points are then used to interpolate to the Earth-viewing measurements, which then provides the calibrated “brightness temperatures”. This is illustrated in the following graph:

The response of the AMSU is slightly non-linear, so the calibration curve in the above graph actually has slight curvature to it. Back when all we had were Microwave Sounding Units (MSU), we had to assume the instruments were linear due to a lack of sufficient pre-launch test data to determine their nonlinearity. Because of various radiometer-related and antenna-related factors, the absolute accuracy of the calibrated Earth-viewing temperatures are probably not much better than 1 deg. C. While this sounds like it would be unusable for climate monitoring, the important thing is that the instruments be very stable over time; an absolute accuracy error of this size is irrelevant for climate monitoring, as long as sufficient data are available from successive satellites so that the newer satellites can be calibrated to the older satellites’ measurements.
WHAT LAYERS OF THE ATMOSPHERE ARE MEASURED?
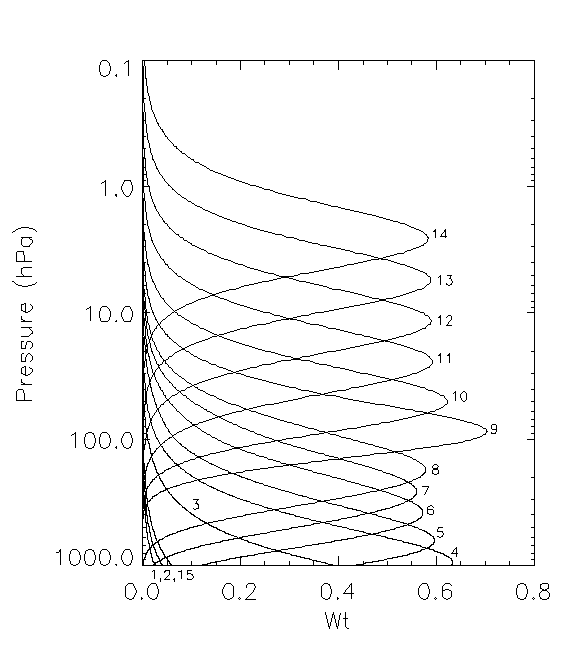
For AMSU channel 5 that we use for tropospheric temperature monitoring, that brightness temperature is very close to the vertically-averaged temperature through a fairly deep layer of the atmosphere. The vertical profiles of each channel’s relative sensitivity to temperature (‘weighting functions’) are shown in the following plot:

These weighting functions are for the nadir (straight-down) views of the instrument, and all increase in altitude as the instrument scans farther away from nadir. AMSU channel 5 is used for our middle tropospheric temperature (MT) estimate; we use a weighted difference between the various view angles of channel 5 to probe lower in the atmosphere, which a fairly sharp weighting function which is for our lower-tropospheric (LT) temperature estimate. We use AMSU channel 9 for monitoring of lower stratospheric (LS) temperatures.
For those channels whose weighting functions intersect the surface, a portion of the total measured microwave thermal emission signal comes from the surface. AMSU channels 1, 2, and 15 are considered “window” channels because the atmosphere is essentially clear, so virtually all of the measured microwave radiation comes from the surface. While this sounds like a good way to measure surface temperature, it turns out that the microwave ’emissivity’ of the surface (it’s ability to emit microwave energy) is so variable that it is difficult to accurately measure surface temperatures using such measurements. The variable emissivity problem is the smallest for well-vegetated surfaces, and largest for snow-covered surfaces. While the microwave emissivity of the ocean surfaces around 50 GHz is more stable, it just happens to have a temperature dependence which almost exactly cancels out any sensitivity to surface temperature.
POST-PROCESSING OF DATA AT UAH
The millions of calibrated brightness temperature measurements are averaged in space and time, for instance monthly averages in 2.5 degree latitude bands. I have FORTRAN programs I have written to do this. I then pass the averages to John Christy, who inter-calibrates the different satellites’ AMSUs during periods when two or more satellites are operating (which is always the case).
The biggest problems we have had creating a data record with long-term stability is orbit decay of the satellites carrying the MSU and AMSU instruments. Before the Aqua satellite was launched in 2002, all other satellites carrying MSUs or AMSUs had orbits which decayed over time. The decay results from the fact that there is a small amount of atmospheric drag on the satellites, so they very slowly fall in altitude over time. This leads to 3 problems for obtaining a stable long-term record of temperature.
(1) Orbit Altitude Effect on LT The first is a spurious cooling signal in our lower tropospheric (LT) temperature product, which depends upon differencing measurements at different view angles. As the satellite falls, the angle at which the instrument views the surface changes slightly. The correction for this is fairly straightforward, and is applied to both our dataset and to the similar datasets produced by Frank Wentz and Carl Mears at Remote Sensing Systems (RSS). This adjustment is not needed for the Aqua satellite since it carries extra fuel which is used to maintain the orbit.
(2) Diurnal Drift Effect The second problem caused by orbit decay is that the nominal local observation time begins to drift. As a result, the measurements can increasingly be from a warmer or cooler time of day after a few years on-orbit. Luckily, this almost always happened when another satellite operating at the same time had a relatively stable observation time, allowing us to quantify the effect. Nevertheless, the correction isn’t perfect, and so leads to some uncertainty. [Instead of this empirical correction we make to the UAH products, RSS uses the day-night cycle of temperatures created by a climate model to do the adjustment for time-of-day.] This adjustment is not necessary for the Aqua AMSU.
(3) Instrument Body Temperature Effect. As the satellite orbit decays, the solar illumination of the spacecraft changes, which then can alter the physical temperature of the instrument itself. For some unknown reason, it turns out that most of the microwave radiometers’ calibrated Earth-viewing temperatures are slightly influenced by the temperature of the instrument itself…which should not be the case. One possibility is that the exact microwave frequency band which the instrument observes at changes slightly as the instrument warms or cools, which then leads to weighting functions that move up and down in the atmosphere with instrument temperature. Since tropospheric temperature falls off by about 7 deg. C for every 1 km in altitude, it is important for the ‘local oscillators’ governing the frequency band sensed to be very stable, so that the altitude of the layer sensed does not change over time. This effect is, once again, empirically removed based upon comparisons to another satellite whose instrument shows little or no instrument temperature effect. The biggest concern is the long-term changes in instrument temperature, not the changes within an orbit. Since the Aqua satellite does not drift, the solar illumination does not change and and so there is no long-term change in the instrument’s temperature to correct for.
One can imagine all kinds of lesser issues that might affect the long-term stability of the satellite record. For instance, since there have been ten successive satellites, most of which had to be calibrated to the one before it with some non-zero error, there is the possibility of a small ‘random walk’ component to the 30+ year data record. Fortunately, John Christy has spent a lot of time comparing our datasets to radiosonde (weather balloon) datasets, and finds very good long-term agreement.

 Home/Blog


