Archive for October, 2010

Bottom Falling Out of Global Ocean Surface Temperatures?

Thursday, October 28th, 2010

Having just returned from another New Orleans meeting – this time, a NASA A-Train satellite constellation symposium — I thought I would check the latest sea surface temperatures from our AMSR-E instrument.

The following image shows data updated through yesterday (October 27). Needless to say, there is no end in sight to the cooling. (Click on image for the full-size version).

Since these SST measurements are mostly unaffected by cloud cover like the traditional infrared measurements are, I consider this to be the most accurate high-time resolution SST record available…albeit only since mid-2002, when the Aqua satellite was launched.

I won’t make any predictions about whether SSTs will go as low as the 2007-08 La Nina event. I’ll leave that to others.

WeatherShop.com Gifts, gadgets, weather stations, software and more...click here!

Does CO2 Drive the Earth’s Climate System? Comments on the Latest NASA GISS Paper

Saturday, October 16th, 2010

(edited for clarity at 2:45 p.m.)

There was a very clever paper published in Science this past week by Lacis, Schmidt, Rind, and Ruedy that uses the GISS climate model (ModelE) in an attempt to prove that carbon dioxide is the main driver of the climate system.

This paper admits that its goal is to counter the oft-quoted claim that water vapor is the main greenhouse gas in our atmosphere. (They provide a 1991 Lindzen reference as an example of that claim).

Through a series of computations and arguments, the authors claim that is actually the CO2, not water vapor, that sustains the warmth of our climate system.

I suspect this paper will result in as many opinions in the skeptic community as there are skeptics giving opinions. But unless one is very careful in reading this paper and knows exactly what the authors are talking about, it is easy to get distracted by superfluous details and miss the main point.

For instance, their table comparing the atmospheres of the Earth, Venus, and Mars does nothing to refute the importance of water vapor to the Earth’s average temperature. While they show that the atmosphere of Mars is very thin, they fail to point out the Martian atmosphere actually has more CO2 than our atmosphere does.

I do not have a problem with the authors’ calculations or their climate model experiment per se. There is not much new here, and their model run produces about what I would expect. It is an interesting exercise that has value by itself.

It is instead their line of reasoning I object to — what they claim their model results mean in terms of causation– in their obvious attempt to relegate the role of water vapor in the atmosphere to that of a passive component that merely responds to the warming effect of CO2…the real driver (they claim) of the climate system.

OUR ASSUMPTIONS DETERMINE OUR CONCLUSIONS

From what I can tell reading the paper, their claim is that, since our primary greenhouse gas water vapor (and clouds, which constitute a portion of the greenhouse effect) respond quickly to temperature change, vapor and clouds should only be considered “feedbacks” upon temperature change — not “forcings” that cause the average surface temperature of the atmosphere to be what it is in the first place.

Though not obvious, this claim is central to the tenet of the paper, and is an example of the cause-versus-effect issue I repeatedly refer to in the past when discussing some of the most fundamental errors made in the scientific ‘consensus’ on climate change.

It is a subtle attempt to remove water vapor from the discussion of “control” over the climate system — by definition. Only those of us who know enough of the details of forcing-feedback theory within the context of climate change theory will likely realize this, through.

Just because water vapor responds quickly to temperature change does not mean that there are no long-term water vapor changes (or cloud changes) — not due to temperature — that cause climate change. Asserting so is a non sequitur, and just leads to circular reasoning.

I am not claiming the authors are being deceptive. I think I understand why so many scientists go down this path of reasoning. They view the climate system as a self-contained, self-controlled complex of physically intertwined processes that would forever remain unchanged until some “external” influence (forcing) enters the picture and alters the rules by which the climate system operates.

Of course, increasing CO2 is the currently fashionable forcing in this climatological worldview.

But I cannot overemphasize the central important of this paradigm (or construct) of climate change theory to the eventual conclusions the climate researcher will inevitably make.

If one assumes from the outset that the climate system can only vary through changes imposed external to the normal operation of the climate system, one then removes natural, internal climate cycles from the list of potential causes of global warming. And natural changes in water vapor (or more likely, clouds) are one potential source of internally-driven change. There are influences on cloud and water vapor other than temperature which in turn help to determine the average temperature state of the climate system.

After assuming clouds and water vapor are no more than feedbacks upon temperature, the Lacis et al. paper then uses a climate model experiment to ‘prove’ their paradigm that CO2 drives climate — by forcing the model with a CO2 change, resulting in a large temperature response!

Well, DUH. If they had forced the model with a water vapor change, it would have done the same thing. Or a cloud change. But they had already assumed water vapor and clouds cannot be climate drivers.

Specifically, they ran a climate model experiment in which they instantaneously removed all of the atmospheric greenhouse gases except water vapor, and they got rapid cooling “plunging the climate into an icebound Earth state”. The result after 7 years of model integration time is shown in the next image.

Such a result is not unexpected for the GISS model. But while this is indeed an interesting theoretical exercise, we must be very careful about what we deduce from it about the central question we are ultimately interested in: “How much will the climate system warm from humanity adding carbon dioxide to it?” We can’t lose sight of why we are discussing all of this in the first place.

As I have already pointed out, the authors have predetermined what they would find. They assert water vapor (as well as cloud cover) is a passive follower of a climate system driven by CO2. They run a model experiment that then “proves” what they already assumed at the outset.

But we also need to recognize that their experiment is misleading in other ways, too.

First, the instantaneous removal of 100% of the greenhouse gases in the atmosphere except for water vapor causes about 8 times the radiative forcing (over 30 Watts per sq. meter) as does a 100% increase in CO2 (2XCO2, causing less than 4 Watts per sq. meter), something that will not occur until late this century — if ever.

This is the so-called ‘logarithmic effect’…adding more and more CO2 has a progressively weaker radiative forcing response.

Currently, we are about 40% of the way to that doubling. Thus, their experiment involves 20 times (!) the radiative forcing we are now experiencing (theoretically, at least) from over a century of carbon dioxide emissions.

So are we to assume that this dramatic theoretical example should influence our views of the causes and future path of global warming, when their no-CO2 experiment involves ~20 times the radiative forcing of what has occurred to date from adding more CO2 to the atmosphere?

Furthermore, the cloud feedbacks in their climate model are positive, which further amplifies the model’s temperature response to forcing. As readers here are aware, our research suggests that cloud feedbacks in the real climate system might be so strongly negative that they could more than negate any positive water vapor feedback.

In fact, this is where the authors have made a logical stumble. Everyone agrees that the net effect of clouds is to cool the climate system on average. But the climate models suggest that the cloud feedback response to the addition of CO2 to our current climate system will be just the opposite, with cloud changes acting to amplify the warming.

What the authors didn’t realize is that when they decided to relegate the role of clouds in the average state of the climate system to one of “feedback”, their model’s positive cloud feedback actually contradicts the known negative “feedback” effect of clouds on the climate’s normal state.

Oops.

(In retrospect, I suppose they could claim that cloud feedbacks switched from negative at the low temperatures of an icebound Earth, to being positive at the higher temperatures of the real climate system. But that might mess up Jim Hansen’s claim of strongly positive feedbacks during the Ice Ages).

CONCLUSION
Taken together, the series of computations and claims made by Lacis et al. might lead the casual reader to think, “Wow, carbon dioxide really does have a strong effect on the Earth’s climate system!” And, in my view, it does. But the paper really tells us nothing new about (1) how much warming we can expect from adding more CO2 to the atmosphere, or (2) how much of recent warming was caused by CO2.

The paper implies that it presents new understanding, but all it does is get more explicit about the conceptual hoops one must jump through in order to claim that CO2 is the main driver of the climate system. From that standpoint alone, I find the paper quite revealing.

Unfortunately, what I present here is just a blog posting. It would take another peer-reviewed paper that follows an alternative path, to effectively counter the Lacis paper, and show that it merely concludes what it assumes at the outset. I am only outlining here what I see as the main issues.

Of course, the chance of editors at Science allowing such a response paper to get published is virtually zero. The editors at Science choose which scientists will be asked to provide peer review, and they already know who they can count on to reject a skeptic’s paper.

Many of us have already been there, done that.

WeatherShop.com Gifts, gadgets, weather stations, software and more...click here!

Meanwhile, Sea Surface Temperatures Continue to Fall

Tuesday, October 5th, 2010

Since I just provided the September 2010 global tropospheric temperature update, I decided it was time to update the global SST data record from the AMSR-E instrument flying on Aqua.

The following plot, updated through yesterday (October 4, 2010) shows that both the global average SST, and the Nino3.4 region average from the tropical E. Pacific, continue to cool.

(click on the plot for the full-size, undistorted version. Note that the global values have been multiplied by 10 for easier intercomparison with Nino3.4)

Past experience (and radiative-convective equilibrium) dictates that the global tropospheric temperature, still riding high at +0.60 deg. C for September, must cool in response to the cool ocean conditions.

But given Mother Nature’s sense of humor, I’ve given up predicting when that might occur. 🙂

WeatherShop.com Gifts, gadgets, weather stations, software and more...click here!

September 2010 UAH Global Temperature Update: +0.60 deg. C

Tuesday, October 5th, 2010


YR MON GLOBE NH SH TROPICS
2009 1 0.251 0.472 0.030 -0.068
2009 2 0.247 0.565 -0.071 -0.045
2009 3 0.191 0.324 0.058 -0.159
2009 4 0.162 0.315 0.008 0.012
2009 5 0.139 0.161 0.118 -0.059
2009 6 0.041 -0.021 0.103 0.105
2009 7 0.429 0.190 0.668 0.506
2009 8 0.242 0.236 0.248 0.406
2009 9 0.505 0.597 0.413 0.594
2009 10 0.362 0.332 0.393 0.383
2009 11 0.498 0.453 0.543 0.479
2009 12 0.284 0.358 0.211 0.506
2010 1 0.648 0.860 0.436 0.681
2010 2 0.603 0.720 0.486 0.791
2010 3 0.653 0.850 0.455 0.726
2010 4 0.501 0.799 0.203 0.633
2010 5 0.534 0.775 0.292 0.708
2010 6 0.436 0.550 0.323 0.476
2010 7 0.489 0.635 0.342 0.420
2010 8 0.511 0.674 0.347 0.364
2010 9 0.603 0.556 0.651 0.284

UAH_LT_1979_thru_Sept_10

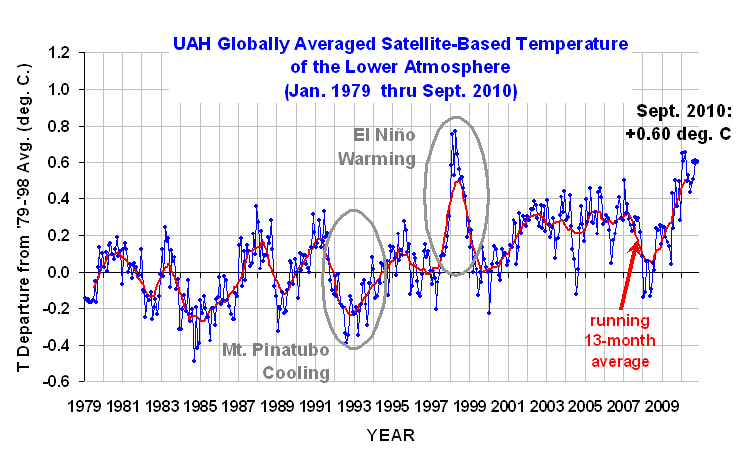
Despite cooling in the tropics, the global average lower tropospheric temperature anomaly has stubbornly refused to follow suit: +0.60 deg. C for September, 2010.

Since the daily global average sea surface temperature anomalies on our NASA Discover web page have now cooled to well below the 2002-2010 average, there remains a rather large discrepancy between these two measures. Without digging into the regional differences in the two datasets, I currently have no explanation for this.

For those following the race for warmest year in the satellite tropospheric temperature record (which began in 1979), 2010 is slowly approaching the record warm year of 1998. Here are the 1998 and 2010 averages for Julian Days 1 through 273:

1998 +0.590
2010 +0.553

[NOTE: These satellite measurements are not calibrated to surface thermometer data in any way, but instead use on-board redundant precision platinum resistance thermometers (PRTs) carried on the satellite radiometers. The PRT’s are individually calibrated in a laboratory before being installed in the instruments.]

WeatherShop.com Gifts, gadgets, weather stations, software and more...click here!

A Mock Global Warming Trial in the Big Easy

Monday, October 4th, 2010


I’ve been out of pocket for a while, partly because I have been preparing to provide expert testimony in a mock global warming trial.

The mock trial was the final event at the ABA Section of Environment, Energy, and Resources Law Summit held at the Sheraton New Orleans this past week. We had a good turnout, with approximately 200 attorneys there to watch the show.

The mock trial was patterned after the Comer vs. Murphy Oil lawsuit, in which the plaintiffs claim that the greenhouse gas emissions of energy companies in the U.S. made Hurricane Katrina worse.

I was the testifying expert for the evil, GHG-spewing industry side, while a PhD ecologist, Mark Laska, represented the IPCC “scientific consensus” side.

We were fortunate to have U.S. District Court Judge Eldon E. Fallon (of Vioxx and Chinese drywall litigation fame) presiding. Judge Fallon provided advice and insights as the mock trial progressed, not so much for the participants’ benefit, but for the audience of attorneys, some of whom anticipate being involved in future climate-related litigation.

I must confess, I had fun. Mike Freeman, of Balch & Bingham, LLP, the defense attorney on my side of the case, did an excellent job with his opening remarks and cross examination of Dr. Laska. Over the last few weeks, Mike quickly developed a good understanding of the key science shortcomings of global warming theory (as I see them, anyway), and was able to turn that knowledge into effective lines of questioning.

In fact, many of us ‘skeptical’ scientists have been waiting for years to see the science of global warming exposed in a trial setting. People like Al Gore can no longer hide behind claims of supposed scientific consensus and appeals to authority.

It’s time to put up, or shut up.

Even though this wasn’t the real thing, I was able to find out how an experienced trial lawyer (Allan Kanner) would handle such a case with his opening statement, direct examination of Dr. Laska, and cross-examination of me.

Without going into a blow-by-blow account of what transpired at the mock trial, I do want to briefly address what I now recognize will be a central problem with the expert testimony in any future climate-related litigation.

There will be no end to the amount of irrelevant climate science which can be used to hoodwink a jury

In our very brief academic exercise, it became immediately apparent to me that one tactic will be the attempt to claim the scientific high ground.

For example, Mr. Kanner and Dr. Laska spent an inordinate amount of time describing the scientific method. You know, forming hypotheses, testing those hypotheses with observational data, modifying the hypotheses accordingly, etc.

This totally irrelevant exercise was an apparent attempt to imply that our side does NOT employ the scientific method. At least I think that’s what they were attempting….it never was clear exactly why they went down this Mom-and-apple-pie road.

What is really ironic about this tactic is that it is the IPCC scientific consensus side that has abandoned a cornerstone of scientific investigation — exploring alternative hypotheses for global warming. As I have previously discussed ad nauseum, there has never been a serious research effort directed toward exploring the role of natural, internal climate cycles as a potential cause of most of the recent warming we have measured.

I have also noticed over the years that it is those who do not actually perform climate research who tend to clothe themselves in the scientific method as some sort of shiny coat of armor which they hope will make them impervious to criticism. Sheesh.

During Mr. Kanner’s cross examination of me, he invoked the Tragedy of the Commons in an apparent attempt to get me to agree that, even though the defendants’ greenhouse gas emissions are a small portion of global emissions, the defendants are still just as responsible for climate change (and, presumably, the intensification of Hurricane Katrina) as everyone else is.

But I refused to accept the premise that there is even a ‘tragedy in the commons’ when it comes to global warming. In my view, none of the participants in the emission of greenhouse gases have caused a tragedy. If you’ve got a problem with Hurricane Katrina and what it did, take it up with Mother Nature.

After all, the vast majority of the most intense hurricanes to hit the U.S. occurred before 1970, and so occurred before the main period of “global warming”. Yes, Katrina was a tragedy. But a hurricane disaster has been predicted for New Orleans long before global warming ever became fashionable.

And as we now close out the 5th Atlantic hurricane season since Katrina, it looks like this will be the first 5 year period without a Cat 3 or stronger hurricane hitting the mainland since 1910-1914! What a difference five years can make to scientific ‘truth’.

In fact, if one surveys the recent literature, it is no longer obvious that warming has led to more intense hurricanes — let alone warming being the fault of mankind.

Mr. Kanner also alluded to the alleged cover-up of global warming science by executives in the petroleum or coal industry. I assume that we are supposed to equate any such behavior to the tobacco industry. Exactly how anyone could hush Al Gore or NASA’s James Hansen, I don’t know.

Every grade school student has heard of the 37 different ways we are all going to die from global warming. Has Exxon Mobil managed to cover up the 38th way we will die? Gasp!

But I do know that anything that energy industry executives did or didn’t do is totally irrelevant to the issue at hand: Have mankind’s greenhouse gas emissions caused any measurable change in the climate system or weather systems?

And I suppose this will be the Achilles’ heel of climate-related litigation: Causation. The case for mankind (versus Mother Nature) causing climate change is so weak, that only through scientific incompetence (or a jury’s bias against big business) should the plaintiffs prevail in these lawsuits.

To me, I don’t care whether another climate expert is the equivalent of Mother Theresa, or a member of the Nazi Party. All I care about is what they can demonstrate scientifically.

I don’t know much about legal issues or the law, so maybe my views are naive. But I do know that it will be essential for judges and lawyers to be able to separate the wheat from the chaff in expert testimony.

This is no small task, since most of the experts in this field are rather muddled in their own thinking on the subject anyway. Climate change science covers a wide range of complex and interrelated sub-disciplines, and the challenge will be to separate the 95% of the science that supports the theory of anthropogenic global warming from the 5% that can trump all the rest, potentially causing the IPCC’s house of cards to collapse.

WeatherShop.com Gifts, gadgets, weather stations, software and more...click here!