Archive for June, 2012

U.S. Temperature Update for May 2012: +1.26 deg. C

Friday, June 8th, 2012

The U.S. lower-48 surface temperature anomaly from my population density-adjusted (PDAT) dataset was 1.26 deg. C above the 1973-2012 average for May 2012, with a 1973-2012 linear warming trend of +0.14 deg. C/decade (click for full-size version):
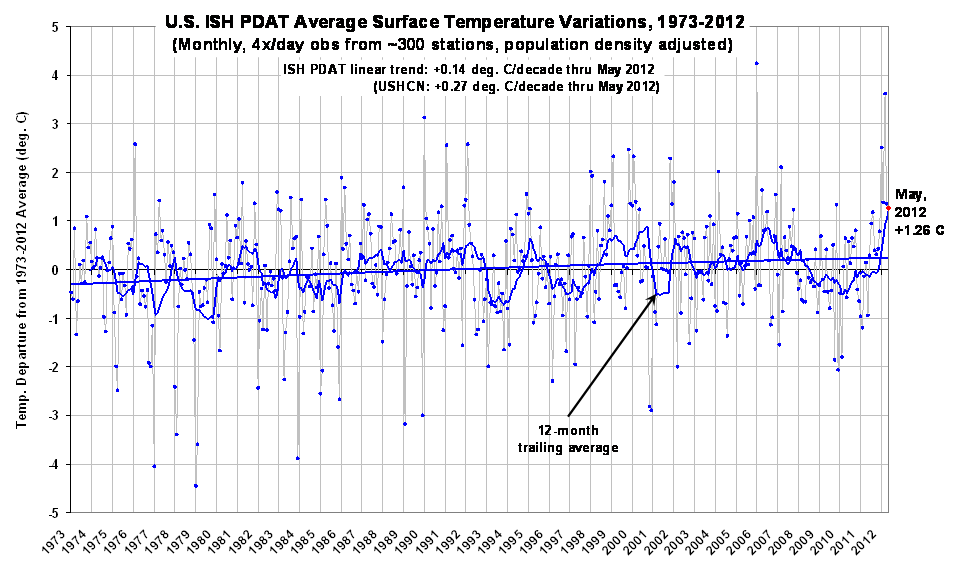
The corresponding USHCN anomaly computed relative to the same base period was +1.65 deg. C, with nearly double my warming trend (+0.27 deg. C/decade). The warming of the USHCN relative to my dataset shows that most of the discrepancy arises during the 1996-98 period:
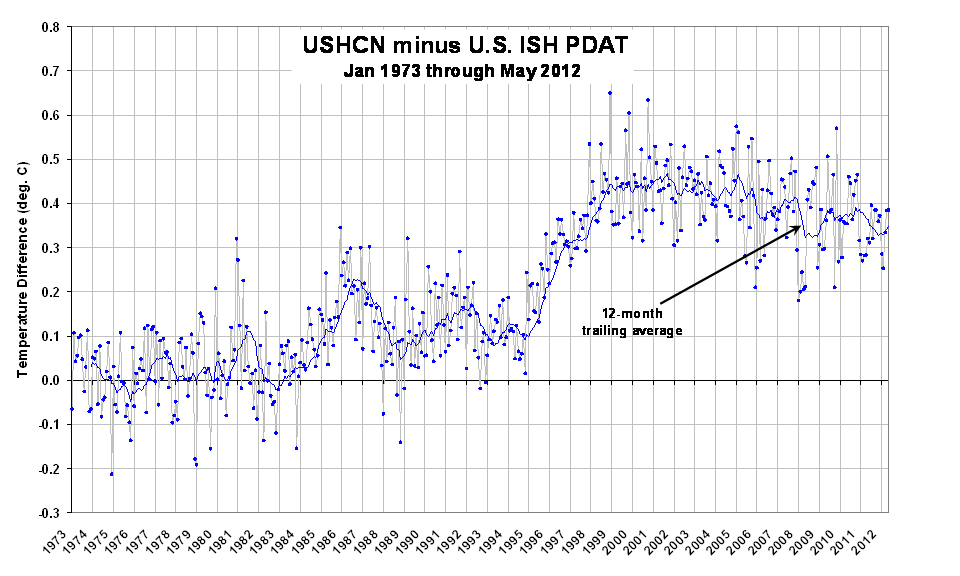
Despite the weaker warming trend in my dataset, Spring 2012 still ranks as the warmest spring since the beginning of my record (1973). The 12-month period ending in May 2012 is also the warmest 12-month period in the record.

Due to a lack of station data and uncertainties regarding urban heat island (UHI) effects, I have no opinion on how the recent warmth compares to, say, the 1930s. There is also no guarantee that my method for UHI adjustment since 1973 has done a sufficient job of removing UHI effects. A short description of the final procedure I settled on for population density adjustment of the surface temperatures can be found here.

UAH Global Temperature Update for May 2012: +0.29°C

Monday, June 4th, 2012

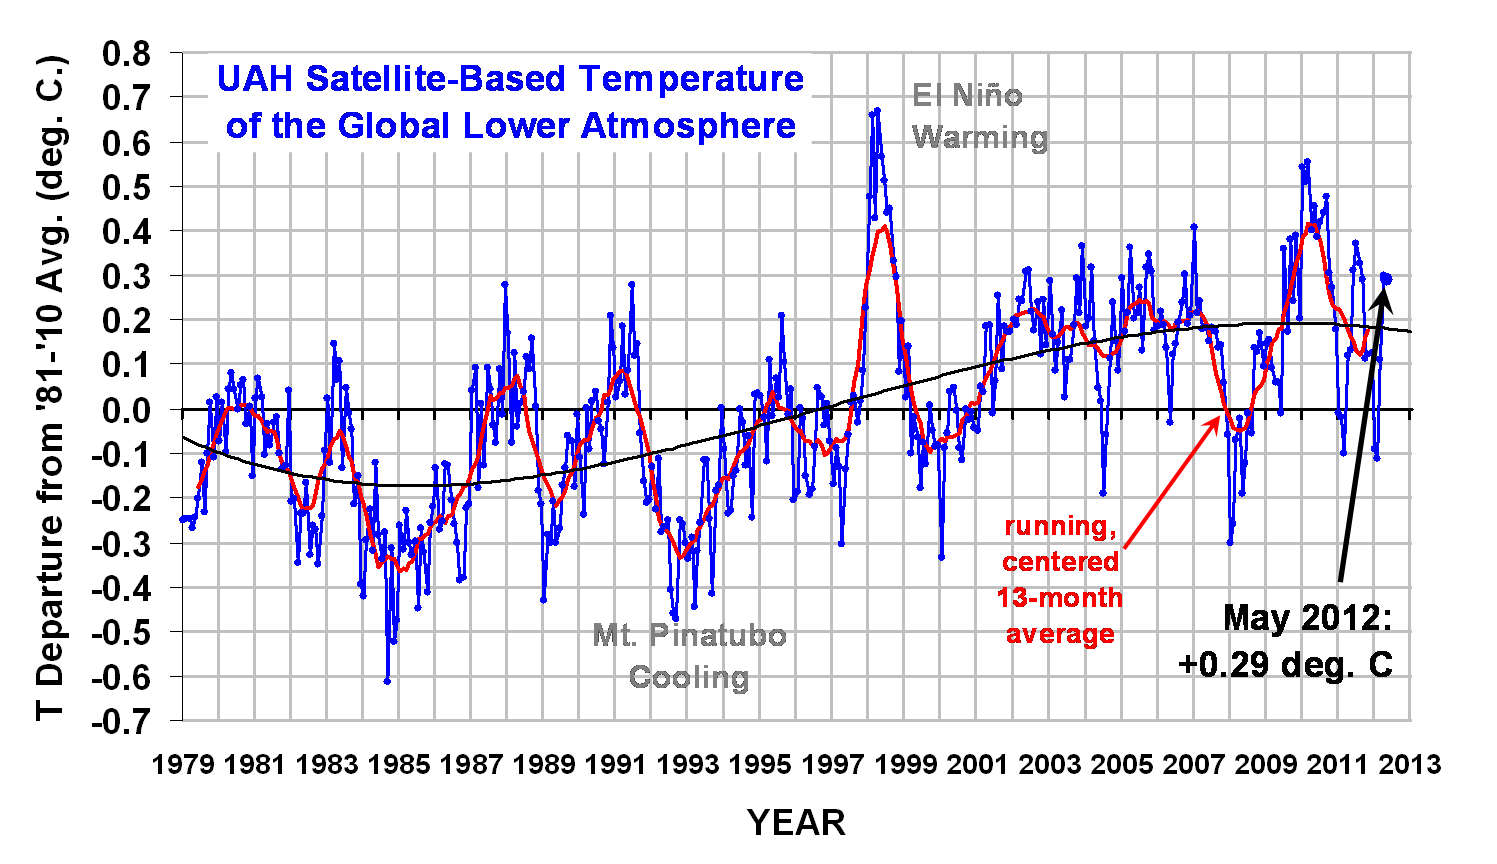
The global average lower tropospheric temperature anomaly for May 2012 (+0.29 °C) changed little from April (+0.30 °C), with some warming to near-average temperatures in the tropics being balanced by a little cooling in the Southern Hemisphere (click on the image for the full-size version):

The 4th order polynomial fit to the data (courtesy of Excel) is for entertainment purposes only, and should not be construed as having any predictive value whatsoever.

Here are the monthly stats:

YR MON GLOBAL NH SH TROPICS
2011 01 -0.010 -0.055 +0.036 -0.372
2011 02 -0.020 -0.042 +0.002 -0.348
2011 03 -0.101 -0.073 -0.128 -0.342
2011 04 +0.117 +0.195 +0.039 -0.229
2011 05 +0.133 +0.145 +0.121 -0.043
2011 06 +0.315 +0.379 +0.250 +0.233
2011 07 +0.374 +0.344 +0.404 +0.204
2011 08 +0.327 +0.321 +0.332 +0.155
2011 09 +0.289 +0.304 +0.274 +0.178
2011 10 +0.116 +0.169 +0.062 -0.054
2011 11 +0.123 +0.075 +0.170 +0.024
2011 12 +0.126 +0.197 +0.055 +0.041
2012 1 -0.089 -0.058 -0.120 -0.137
2012 2 -0.111 -0.014 -0.209 -0.276
2012 3 +0.111 +0.129 +0.094 -0.106
2012 4 +0.299 +0.413 +0.185 -0.117
2012 5 +0.289 +0.439 +0.139 +0.033

As a reminder, the most common reason for large month-to-month swings in global average temperature is small fluctuations in the rate of convective overturning of the troposphere, discussed here.