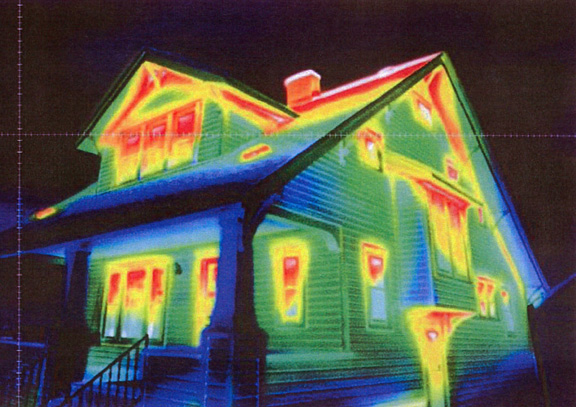
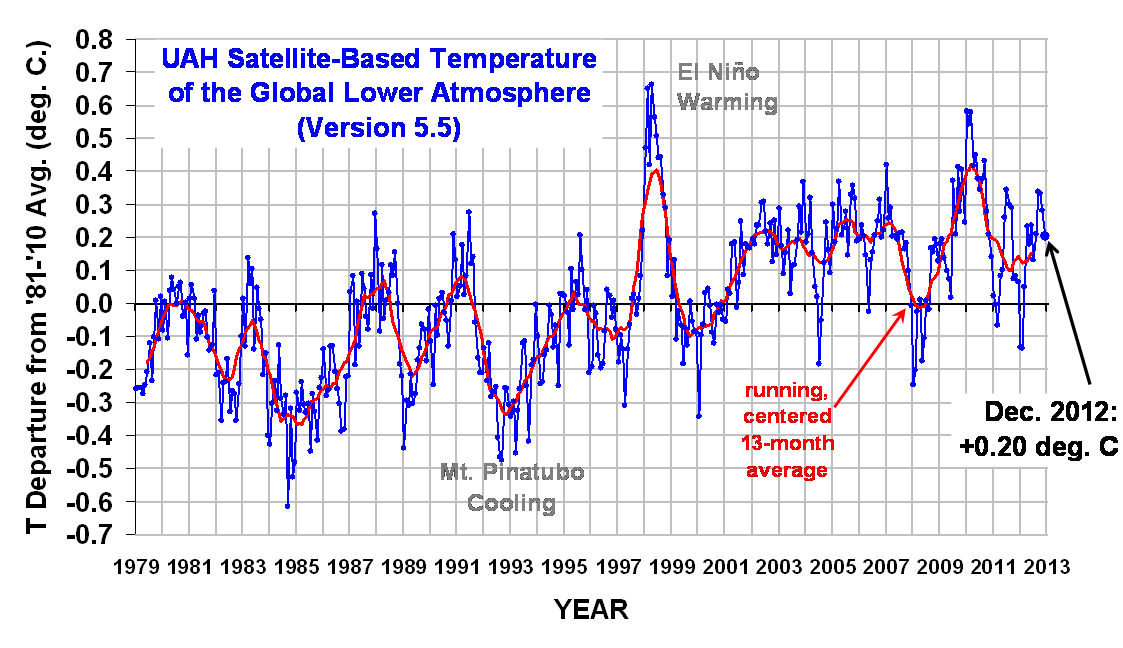
 I sometimes get asked about the possible contribution of our daily energy consumption to warming in the U.S. With the recent announcement that the U.S. experienced the warmest year on record in 2012 (in the surface temperature data), I thought I would revisit this issue.
Many authors have analyzed the problem, starting in the 1960’s. Jill Jager’s 1983 book Climate and Energy Systems; A Reviews of their Interactions is little known, but is very good on this subject.
I have never looked into the problem very deeply, and have always assumed that the heat generated through our use of electricity and various fuels was, compared to the radiative forcing from increasing CO2, negligibly small. I have assumed that most of the urban heat island effect is “passive”, due to replacing the cooling effects of vegetation with buildings, streets. etc, which warm up more in the sun.
Now I’m not so sure….at least for industrialized and economically active countries like the U.S., it looks like waste heat production from our energy use could be a major player.
If similar calculations to those below have been posted elsewhere, my apologies…just consider this an independent estimate. Again, what I am discussing here is separate from, and in addition to, the passive change in the land energy budget from replacing vegetation with manmade structures (parking lots, etc.).
U.S. Energy Consumption
It 2006, total U.S. energy consumption was estimated (according to DOE/EIA) to be 97.1 quadrillion BTUs, which when converted to “watts” type measurements is equivalent to 3.25 x 10¹² watts generated continuously over the course of a year.
If we divide that by the surface area of the U.S. in meters, we get 0.33 watts per sq. meter.
Now, compare that the the total radiative forcing from increasing greenhouse gas concentrations supposedly operating today, which (according to the IPCC) is somewhere around 1.6 W/m2.
At this point, we might conclude that the waste heat generation (0.33 W/m2) is only about 20% of the radiative forcing from increasing CO2 (1.6 W/m2).
But there are at least 2 issues we would be neglecting.
1) Radiative Forcing is Alleviated After Warming…Waste Heat Forcing Is Not
The actual residual radiative imbalance from increasing CO2 in 2006 was (according to Jim Hansen or the IPCC) more like 0.6 watts per sq. meter, since warming has alleviated some of the radiative forcing caused by increasing CO2.
In contrast, waste heat from our use of energy keeps getting generated, no matter how much our surroundings have warmed. So, with this correction, we now see that waste heat generation (0.33) becomes more like 50% of the remaining radiative imbalance (0.6) from anthropogenic GHG production.
2) Waste Heat is Mostly Released in the Lowest 10% of the Atmosphere
The second point we would be missing is that, whereas radiative forcing from GHGs is distributed throughout the atmosphere, most waste heat (except for jet traffic) is concentrated close to the ground…in the lowest few hundred meters. And the smaller the mass of air heated by the same energy input, the greater the temperature rise will be.
Of course, the extra warmth is then dispersed upward from convection and IR cooling, but it still is first expressed as concentrated warming of the air in the lowest atmosphere. (I need to check into the increase in radiative forcing in the lower atmosphere from increasing CO2, to make this a fair comparison).
So, What is the Contribution of Waste Heat to Measured Warming?
This would not be an easy question to answer. I’ve assumed that the waste heat generated in the U.S. is spread evenly across the U.S., whereas it is actually much more concentrated where people are. Of course, thermometers are also placed where people are, so they are more apt to measure the effects of this waste heat.
Even the Climate Reference Network of “well-sited” thermometers are, for the most part, not that far from local economic activity…especially in the eastern U.S. I’ve looked at every one of the 100+ sites in Google Earth (most of are actually visible, with their distinctive trio of bright white thermometer solar shields), and relatively few of them are what you would call “remote”.
Unless I have made a serious error in my back-of-the-printer-paper calculations (which wouldn’t be the first time), I would say that humanity’s generation of waste heat can’t be ignored in the discussion of observed land surface warming trends.
This reminds me of the 2007 paper by McKitrick and Michaels who found that regional surface warming was statistically related to the level of economic activity. What I have provided here is instead a simpler comparison of the levels of energy input from waste heat production versus radiative forcing from GHGs.
(And if you want to bring in the observed warming of the oceans, where virtually no one lives, I will point out that the slight warming of the oceans in the last 50 years is equivalent to only 0.2 watts per sq. meter of net energy input (according to Levitus) into the upper half of the ocean. This value is so small and uncertain, dependent upon the measurement accuracy of hundredths of a degree change hundreds of meters deep, and with the uncertain nature of potential changes in deep ocean mixing, that I don’t think we can say anything definitive about the cause(s) of slight warming in the upper half of the ocean.)

 Home/Blog


