
 Home/Blog
Courtesy of John Christy, a comparison between 73 CMIP5 models (archived at the KNMI Climate Explorer website) and observations for the tropical bulk tropospheric temperature (aka “MT”) since 1979 (click for large version):
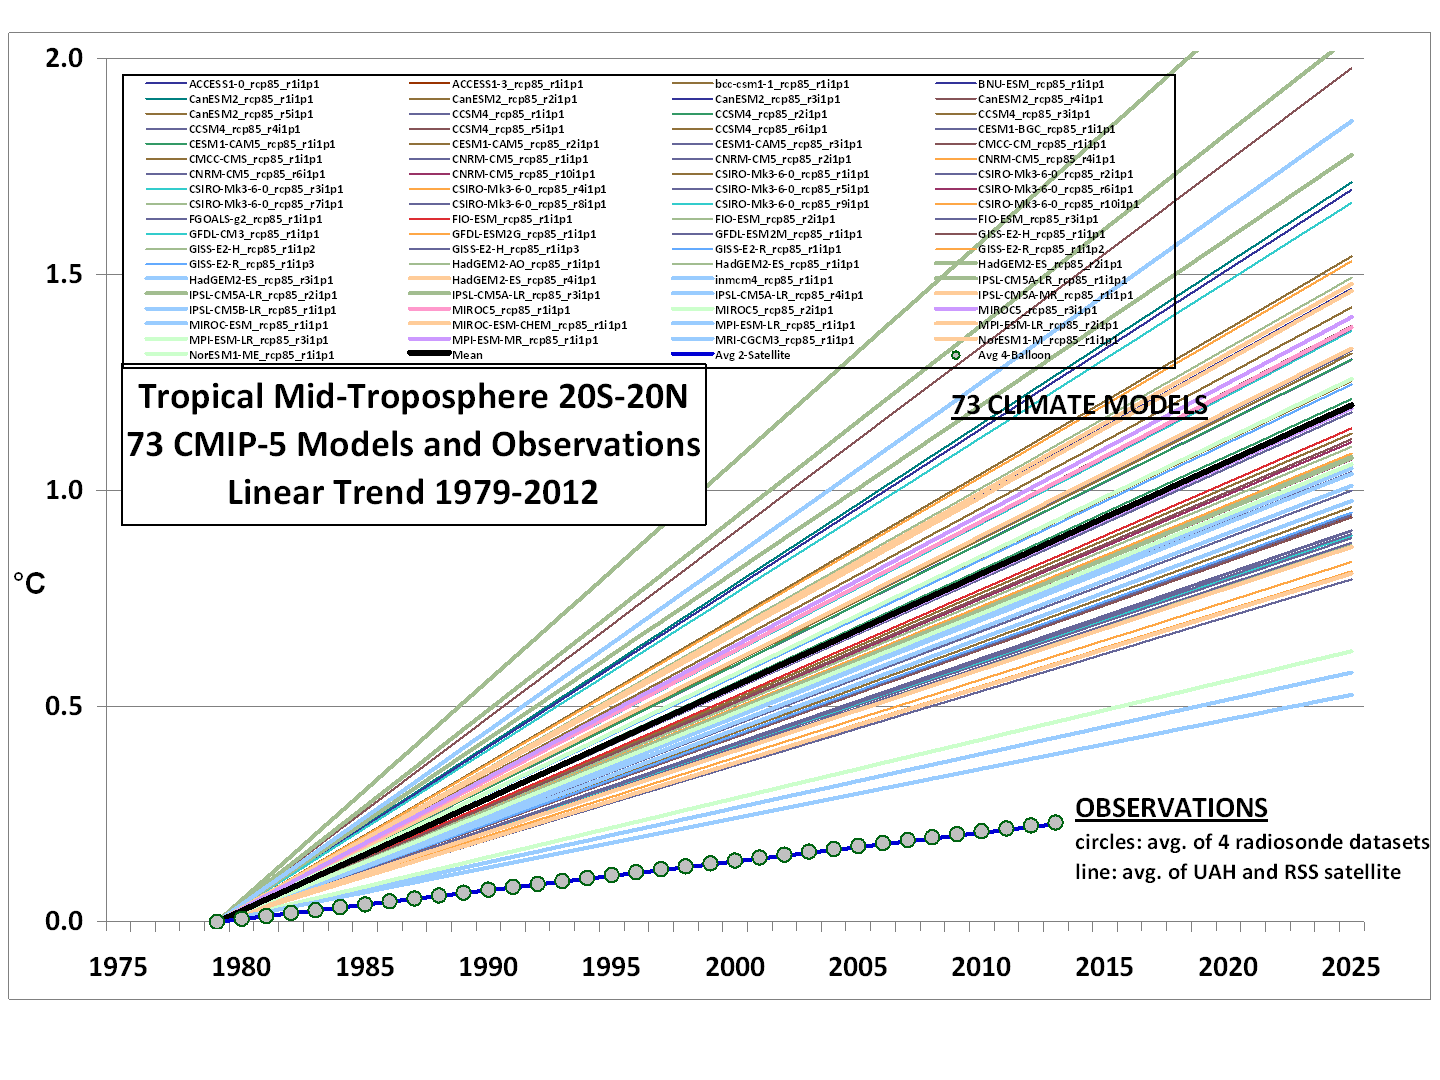
Rather than a spaghetti plot of the models’ individual years, we just plotted the linear temperature trend from each model and the observations for the period 1979-2012.
Note that the observations (which coincidentally give virtually identical trends) come from two very different observational systems: 4 radiosonde datasets, and 2 satellite datasets (UAH and RSS).
If we restrict the comparison to the 19 models produced by only U.S. research centers, the models are more tightly clustered:
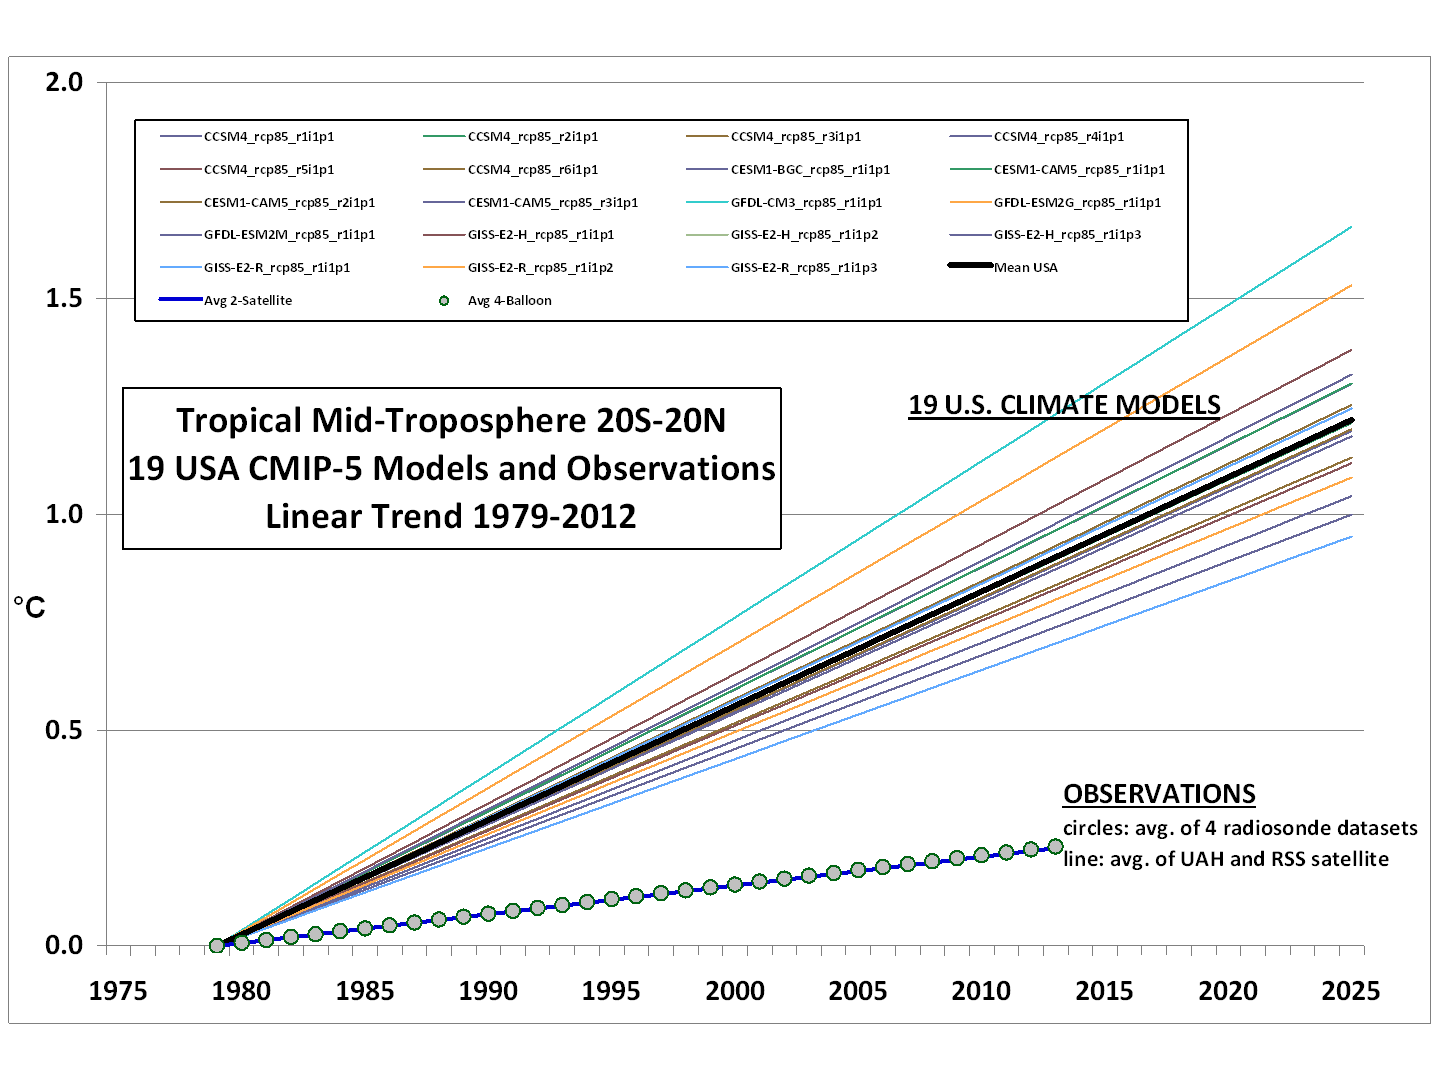
Now, in what universe do the above results not represent an epic failure for the models?
I continue to suspect that the main source of disagreement is that the models’ positive feedbacks are too strong…and possibly of even the wrong sign.
The lack of a tropical upper tropospheric hotspot in the observations is the main reason for the disconnect in the above plots, and as I have been pointing out this is probably rooted in differences in water vapor feedback. The models exhibit strongly positive water vapor feedback, which ends up causing a strong upper tropospheric warming response (the “hot spot”), while the observation’s lack of a hot spot would be consistent with little water vapor feedback.


I’m not that much of a internet reader to be honest but
your blogs really nice, keep it up! I’ll go ahead and bookmark your site to come back in the future.
Cheers
Hi, i feel that i noticed you visited my site so i got here
to go back the prefer?.I am attempting to find things to improve my
website!I guess its good enough to use some of your ideas!!