Archive for July, 2013

Big Bird at the North Pole

Friday, July 26th, 2013

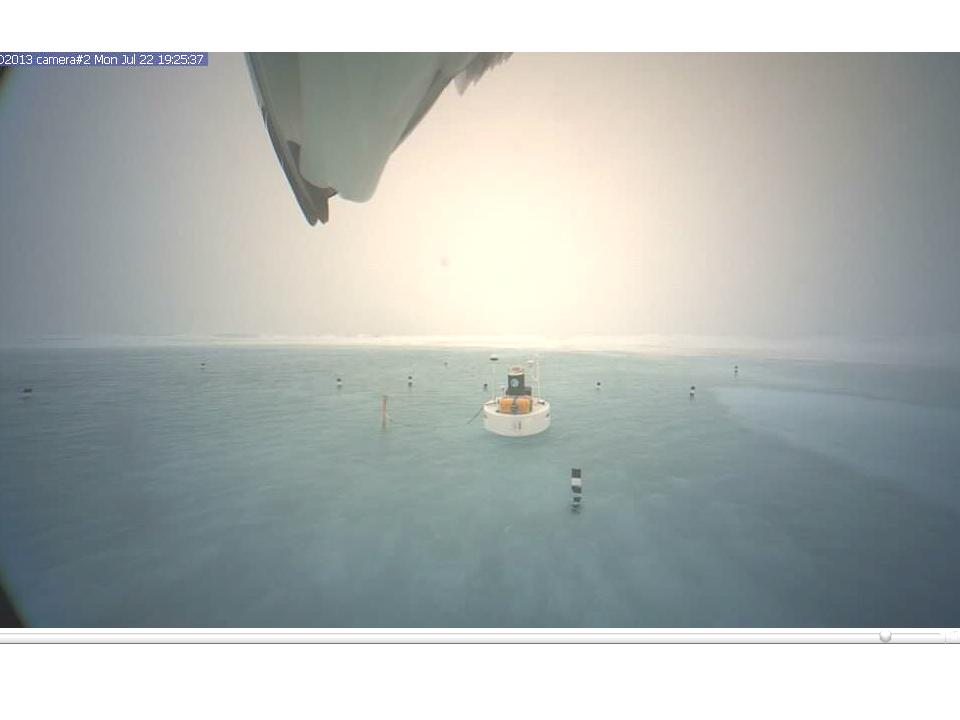
Last week, I was looking at the North Pole webcam imagery available as a time lapse video here. You can see the formation of meltponds on the ice in the last couple weeks, and then in the last few days the area around the main buoy have turned into a rather continuous, shallow pond.

But if you back up several days, you will see an unusual sight…the bottom of a bird perched on top of the camera structure:
North-Pole-Cam2-with-bird

Wildlife at the North Pole is very sparse (probably even more unusual at the South Pole, unless they are having a party at the station there). The ocean there is largely devoid of life, and it is rare that a fox or polar bear wanders there, since there is virtually no food. Check out North Pole on Wikipedia.

Anyway, I just thought it was interesting that it had gotten warm enough there for something living to actually be caught on camera.

Of course, we wouldn’t want too much life to show up there. Might get too crowded. We need to spend billions or trillions of $$ to try to freeze it all back to lifelessness. </sarc>

Senate EPW Hearing: “Climate Change: It’s Happened Before”

Friday, July 19th, 2013

OK, so yesterday’s hearing really was entitled, “Climate Change: It’s Happening Now”. I like my title better.

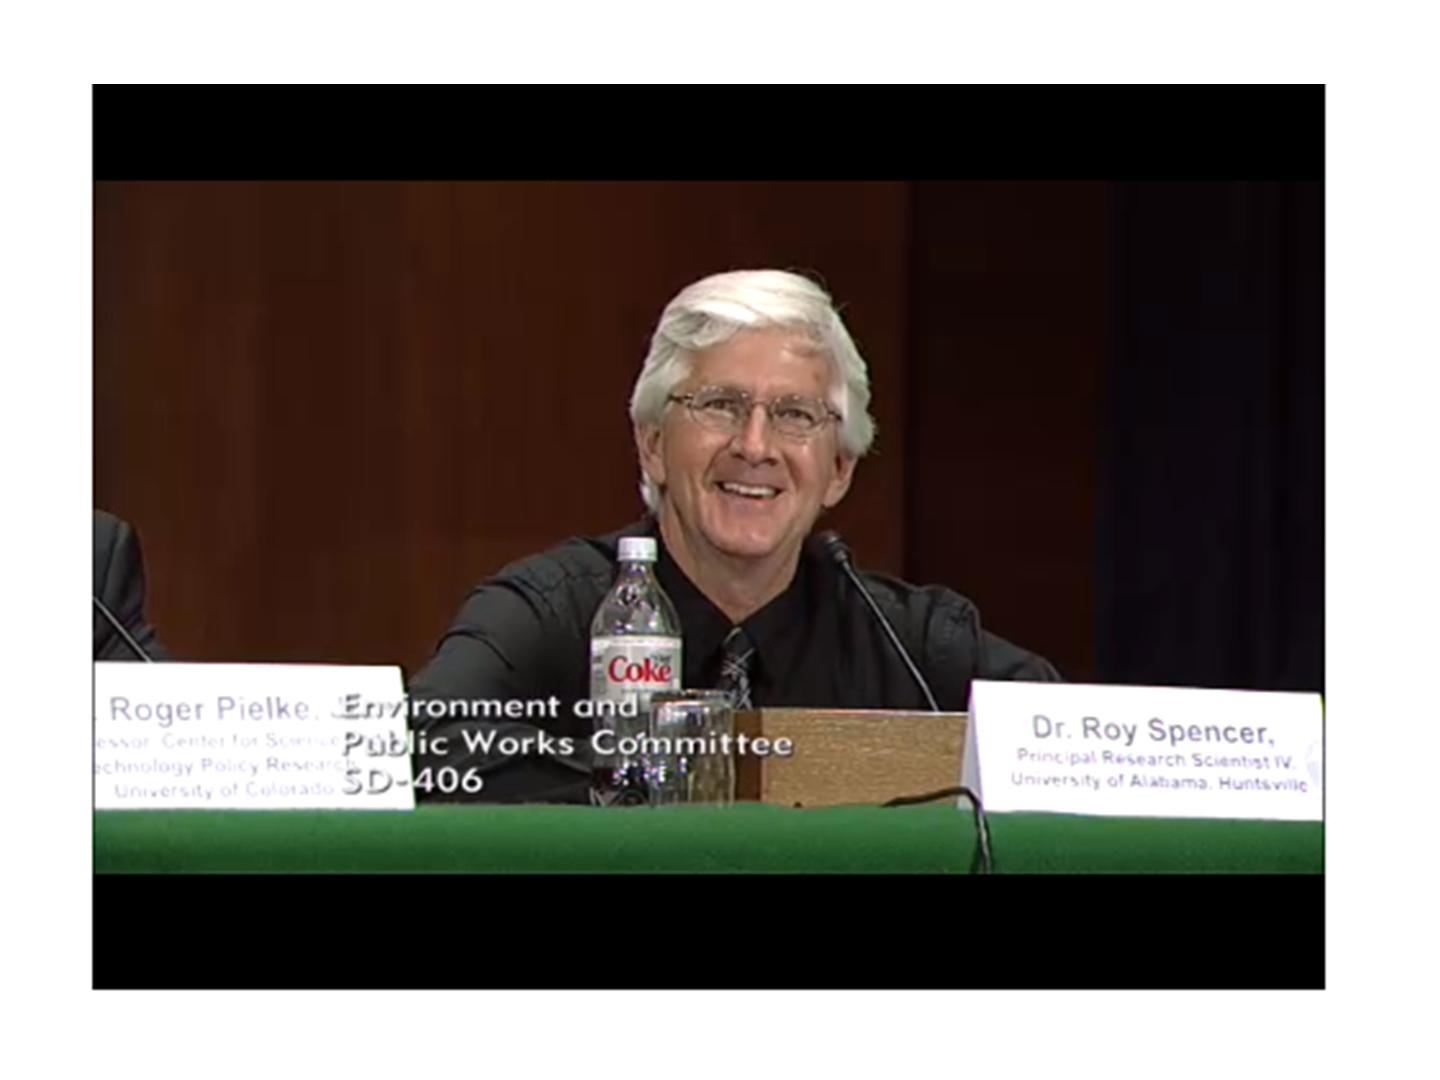
In this exceedingly rare photo of me actually cracking a smile, note my subliminal shout out to the “Coke” brothers (whom I’ve never met, btw…I don’t even know what they do):
Spencer-EPW-testimony-7-18-2013

From the opening remarks made by the Democrats on the Environment and Public Works (EPW) Committee, apparently you can see climate change yourself just by looking in your backyard, or seeing how far from shore fishermen must go now to catch fish, or even (help me with the logic on this one) the fact that smoking causes cancer.

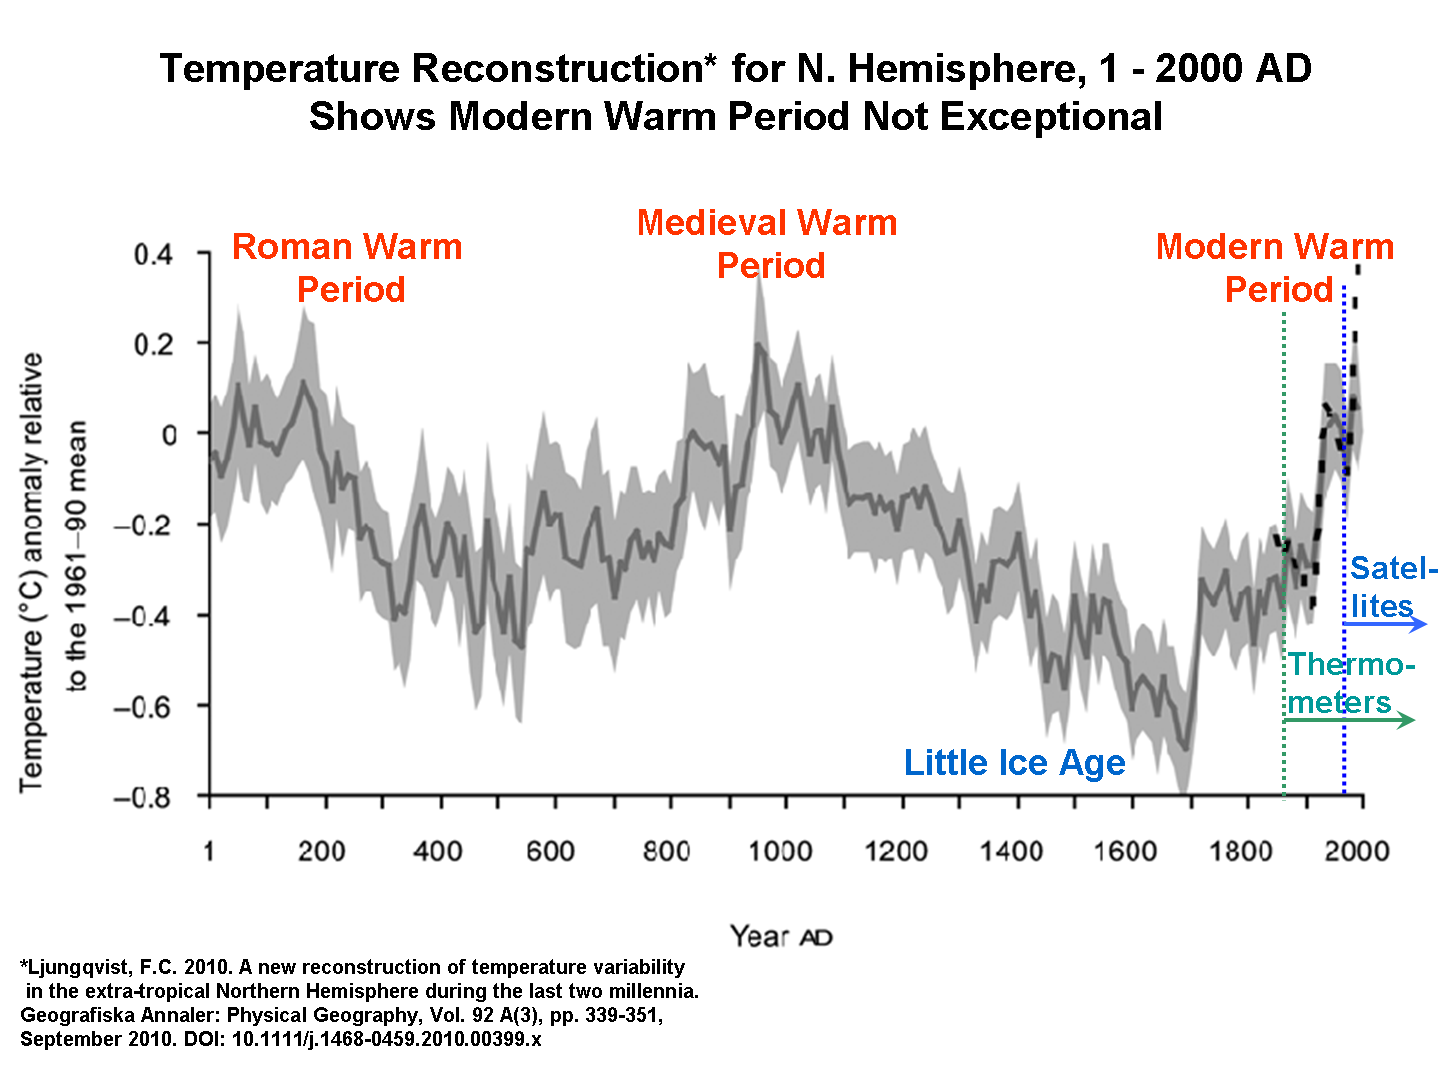
I just submitted my updated written testimony (Spencer_EPW_Written_Testimony_7_18_2013_updated) to include the following chart (Click for full size):
2000-yr-temperature-variations

This chart illustrates that, yes, we are currently warm, but not significantly warmer than the Medieval Warm Period (MWP) or the Roman Warm Period (RWP). So how is it we know today’s warmth is human-caused, when the last two warm periods couldn’t have been caused by humans? Hmmm?

And if you want to hit me with a Hockey Stick, might I remind you that there are many more papers supporting the MWP and RWP than there are supporting the Hockey Stick’s slick revision of history?

Or does “consensus” only count when it supports your side?

What’s that you say? The hockey stick is now the “new consensus”? So a scientific consensus can be wrong, after all? Hmmm.

Hearing Post Mortem
The advertised star of the show was Heidi Cullen (aka “de-certify all TV meteorologists who don’t toe the line on global warming Heidi”) who did an admirable job of presenting a litany of half-truths (hurricanes have increased [except in the last 7 years]; strong tornadoes have decreased [but she couldn’t bring her self to actually say that]; wildfire acres burned have increased dramatically [but the number of wildfires have decreased dramatically…all consistent with the USFS “let it burn” policy]; droughts and floods have increased [except NOAA’s charts say there is no change over the last 100 years], etc.).

Roger Pielke, Jr. was absolutely devastating in his testimony. Here’s a guy who claims to largely support the IPCC party line, even claiming increasing CO2 is having a “profound” effect on the climate system, yet he chides those who would try to use severe weather as evidence of climate change. The evidence simply isn’t there. Very Lomborgian, sans the sexy T-shirt.

During my testimony (in the Flash video, starting about 3:04 for my oral, and 3:23 for follow-up questions/interrogation) I decided to depart from my usual practice of reading of a prepared text to just winging it. There is VERY little you can cover in 5 minutes, and there were a number of things I would have liked to have said, but there simply isn’t time…that’s just the way committee hearings go.

All of the senators were moving in an out of the hearing room for a floor vote, so there were only 2-4 senators present at any given time.

Thanks to all of those who have posted and e-mailed supportive comments…I really appreciate it. Getting flogged in public by Sen. Boxer (last time I testified) and Sen. Whitehouse (this time) is not one of my favorite activities. But I warned the staffers I wasn’t going to be pushed around this time without some pushing back. I think we did OK for a hearing where the witness numbers were stacked against us.

From Chemtrails to Flying Saucers

Wednesday, July 10th, 2013

I’ve been receiving more e-mails than usual asking about chemtrails, the supposed clandestine spraying of chemicals by jet aircraft, so I thought I would talk a little about the issue.

I was at a townhall meeting a couple years ago, and some biker dude got up and demanded that our congressman do something about chemtrails (the congressman said he had never heard of the issue before). Based upon the level of interest I have seen, there is considerable popular support for the view that chemtrails exist.

First let me say there are such things as “conspiracies”…some people conspire together with all kinds of nefarious motives, both inside and outside government. But not everything that happens in life is a conspiracy.

Jet aircraft at high altitudes produce condensation trails (contrails) which form from water vapor, one by-product of combustion. Some of these clouds can be colorful at sunrise or sunset, just as natural clouds are. Contrail activity has increased dramatically since the 1950s, for the obvious reason that high altitude jet traffic was almost non-existent before that time.

It is indeed possible that the high altitude cirrus clouds formed by jets might have contributed to warming in recent decades due to the greenhouse effect produced by cirrus clouds (thin cirrus reduce outgoing infrared radiation more than they reflect sunlight), although research on this has a large amount of uncertainty.

Now, I suppose it’s possible the Air Force or some other entity has experimented with spraying of chemicals from jets for various purposes. For example, chemical defoliants were sprayed by aircraft from low altitudes during the Vietnam War. But there is no evidence I am aware of that any of the jet contrails you see in the sky on a daily basis is anything other than the passive (and necessary) result of combustion.

Contrails don’t always form behind a jet because sometimes the air is so dry that it absorbs the water vapor from aircraft without condensation taking place. When I was the lead scientist on a microwave radiometer we used to fly over thunderstorms on a modified U2 aircraft, the U2 pilots told us stories of flying spy missions; if the U2 started forming a contrail, they would return home because the aircraft would be too easy to spot from the ground.

I was looking at some of the claimed evidence for chemtrails, for example a 1990 USAF chemistry course outline entitled “Chemtrails”. This indeed seems to establish that the USAF coined the term “chemtrail”, but it was simply a play on “Contrails”, a handbook routinely distributed to cadets. I looked through the chemistry course materials and there was no mention of “chemtrails” in the modern sense of the word.

And graphic artists don’t help when they come up with spoofs, like this one showing airline pilots marching against chemtrails:

Another supposed proof is patents related to spraying of chemicals from aircraft. There is some truth to this claim, because with talk of geoengineering the climate system to offset global warming, there has been considerable interest in spraying a variety of substances into the stratosphere as a way to reflect sunlight in the manner of a large volcanic eruption. As a result, private companies are patenting methods for performing this spraying if it ever becomes a funded project.

But the claim that daily, routine jet traffic involves the secret spraying of chemicals for population control by the government, or to keep us sick to support the pharmaceutical industry, etc., is pretty wild. There is much more information debunking various chemtrail claims at a website called contrailscience.com.

So how do flying saucers fit into this? Well, it was pointed out that a patent for a chemtrail (or any other) device does not mean that a device has ever been developed…or that it would even work. I’d be interested in hearing some physicists’ opinions on the patent for a Space vehicle propelled by the pressure of inflationary vacuum state:
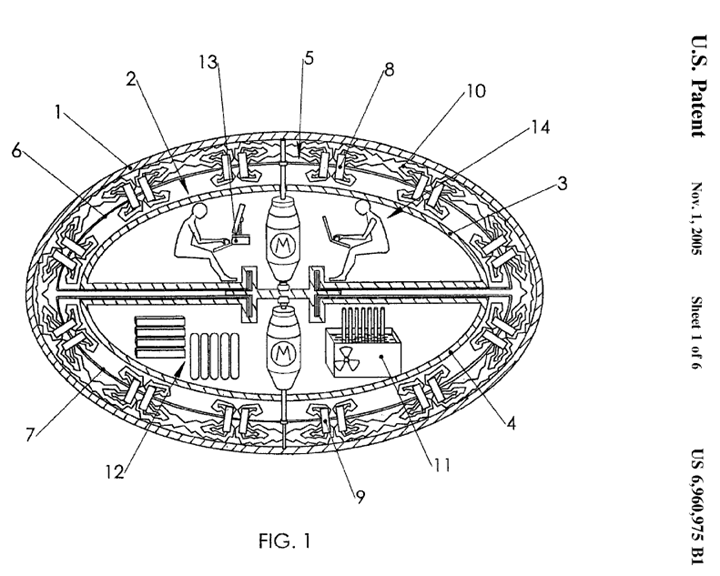
flying-saucer-patent

But, I suppose conspiracy is in the eye of the beholder, and I’m sure someone in comments below will claim I am part of the conspiracy that perpetuates the “myth” of the greenhouse effect. Oh, well.
UAH v5.6 Global Temperature Update for June, 2013: +0.30 deg. C

Tuesday, July 9th, 2013

After 10 days in Michigan’s U.P. for my 40th high school reunion, here’s the belated monthly global temperature update.

We added two satellites to the processing, Metop-A starting in 2007 and NOAA-19 starting in 2009. The resulting anomalies, which we will call Version 5.6, differ by as much as 0.04 deg. C from v5.5. You can read the details of the new processing here.

We are now making good progress on Version 6.0, which includes a variety of improvements in our processing procedures which have taken much more time than we anticipated.

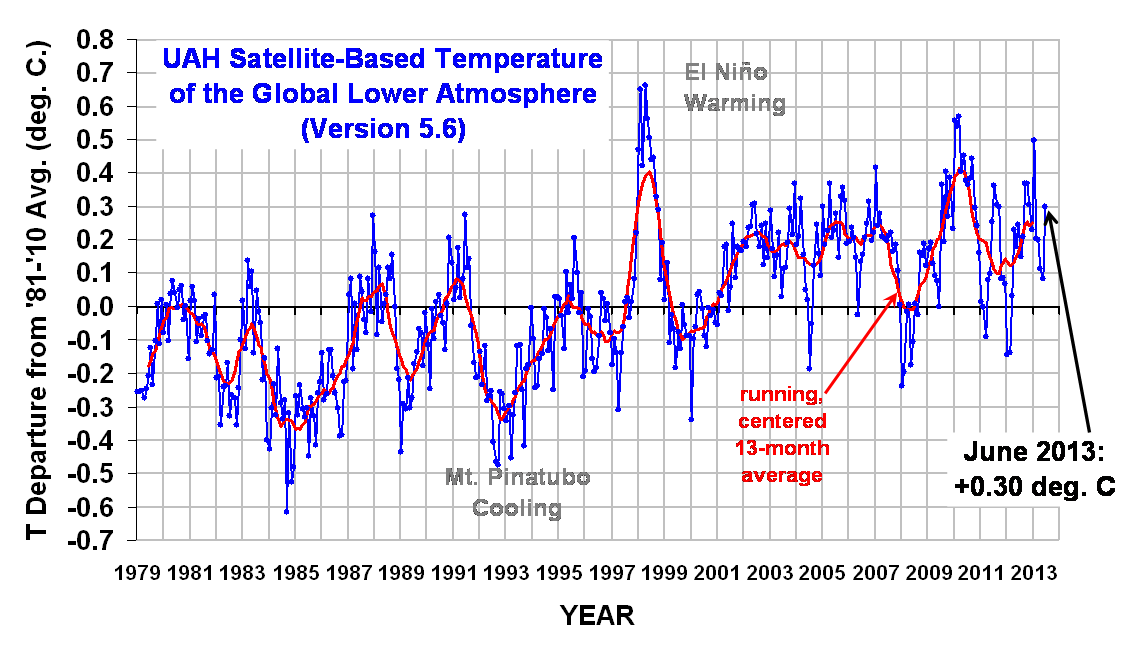
The Version 5.6 global average lower tropospheric temperature (LT) anomaly for June, 2013 is +0.30 deg. C (click for large version):
UAH_LT_1979_thru_June_2013_v5.6

The global, hemispheric, and tropical LT anomalies from the 30-year (1981-2010) average for the last 18 months are:

YR MON GLOBAL NH SH TROPICS
2012 1 -0.145 -0.088 -0.203 -0.245
2012 2 -0.140 -0.016 -0.263 -0.326
2012 3 +0.033 +0.064 +0.002 -0.238
2012 4 +0.230 +0.346 +0.114 -0.251
2012 5 +0.178 +0.338 +0.018 -0.102
2012 6 +0.244 +0.378 +0.111 -0.016
2012 7 +0.149 +0.263 +0.035 +0.146
2012 8 +0.210 +0.195 +0.225 +0.069
2012 9 +0.369 +0.376 +0.361 +0.174
2012 10 +0.367 +0.326 +0.409 +0.155
2012 11 +0.305 +0.319 +0.292 +0.209
2012 12 +0.229 +0.153 +0.305 +0.199
2013 1 +0.497 +0.512 +0.481 +0.387
2013 2 +0.203 +0.372 +0.034 +0.195
2013 3 +0.200 +0.333 +0.068 +0.243
2013 4 +0.114 +0.128 +0.101 +0.165
2013 5 +0.083 +0.180 -0.015 +0.112
2013 6 +0.298 +0.337 +0.259 +0.221