Slight warming over Dome A for the last 15 years. (updated)
The recent announcement of a new low temperature “record” for Earth on Dome A (Argus) in Antarctica of -93 deg. C (on August 10, 2010) was based upon satellite infrared measurements from the MODIS instrument on NASA’s Aqua satellite.
The temperature record is unofficial since it was made by satellite, not ground-based thermometers, and it represents the skin temperature of the ice sheet surface, not the air temperature. Assuming it was made under relatively calm wind conditions, the surface skin temperature could easily be several degrees C colder than the air temperature at traditional shelter height (2 meters).
Since we are always interested in new ways of analyzing the satellite AMSU microwave temperature sounder data, I thought I would take a look at how well this instrument might retrieve air temperature over the higher elevations of the Antarctic ice sheet.
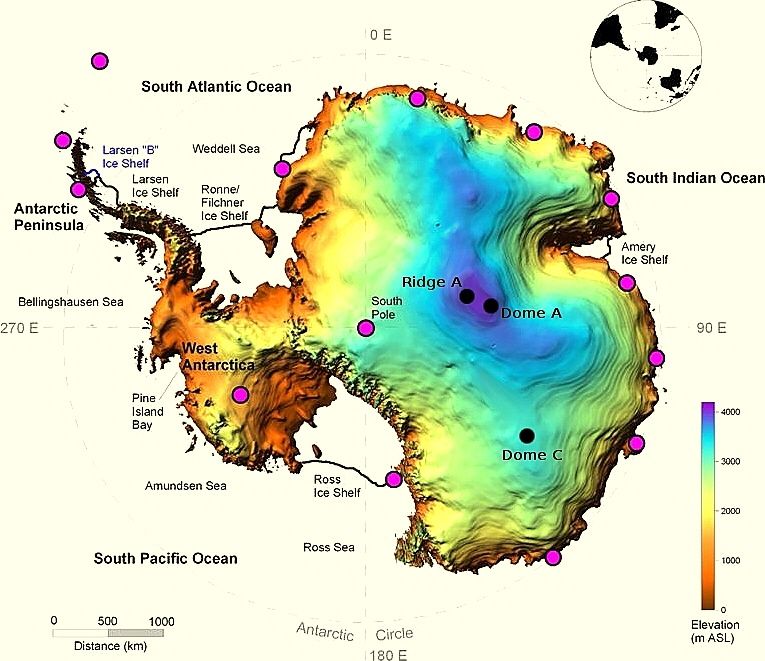
The highest elevation reported for Dome A is 4,091 m, located near 80 deg. S, 77 deg. E. Here’s an elevation image of Antarctica produced by the University of New South Wales, which has investigated Dome A as an ideal astronomical observing location from the standpoint of having extremely clear skies:
AMSU (now flying on at least 5 satellites) carries several channels which are sensitive to thermal emission by the surface and atmospheric oxygen near the surface: Channels 1 (23.8 GHz), 2 (31.4 GHz), 3 (50.3 GHz), 4 (52.8 GHz) and 15 (89 GHz). Using these channels to retrieve near-surface air temperature is generally difficult due to the wide variations in surface microwave emissivity over land and ocean, which is why infrared methods are better since variations in the IR emissivity of those surfaces are so much less.
The wide variation in microwave emissivity as a function of frequency and polarization is why we use instruments (like AMSR-E, AMSR2, SSM/I, SSMIS) to measure surface characteristics such as snow depth, vegetation, sea ice. But if we just focus on the upper reaches of the Antarctic ice sheet, it could be that the microwave emissivity of the ice surface remains fairly constant, which would allow more accurate temperature retrievals. The temperature there is well below freezing year-round, and there is very little fresh snow that falls. This should limit variations in ice sheet microphysical characteristics which affect microwave emissivity.
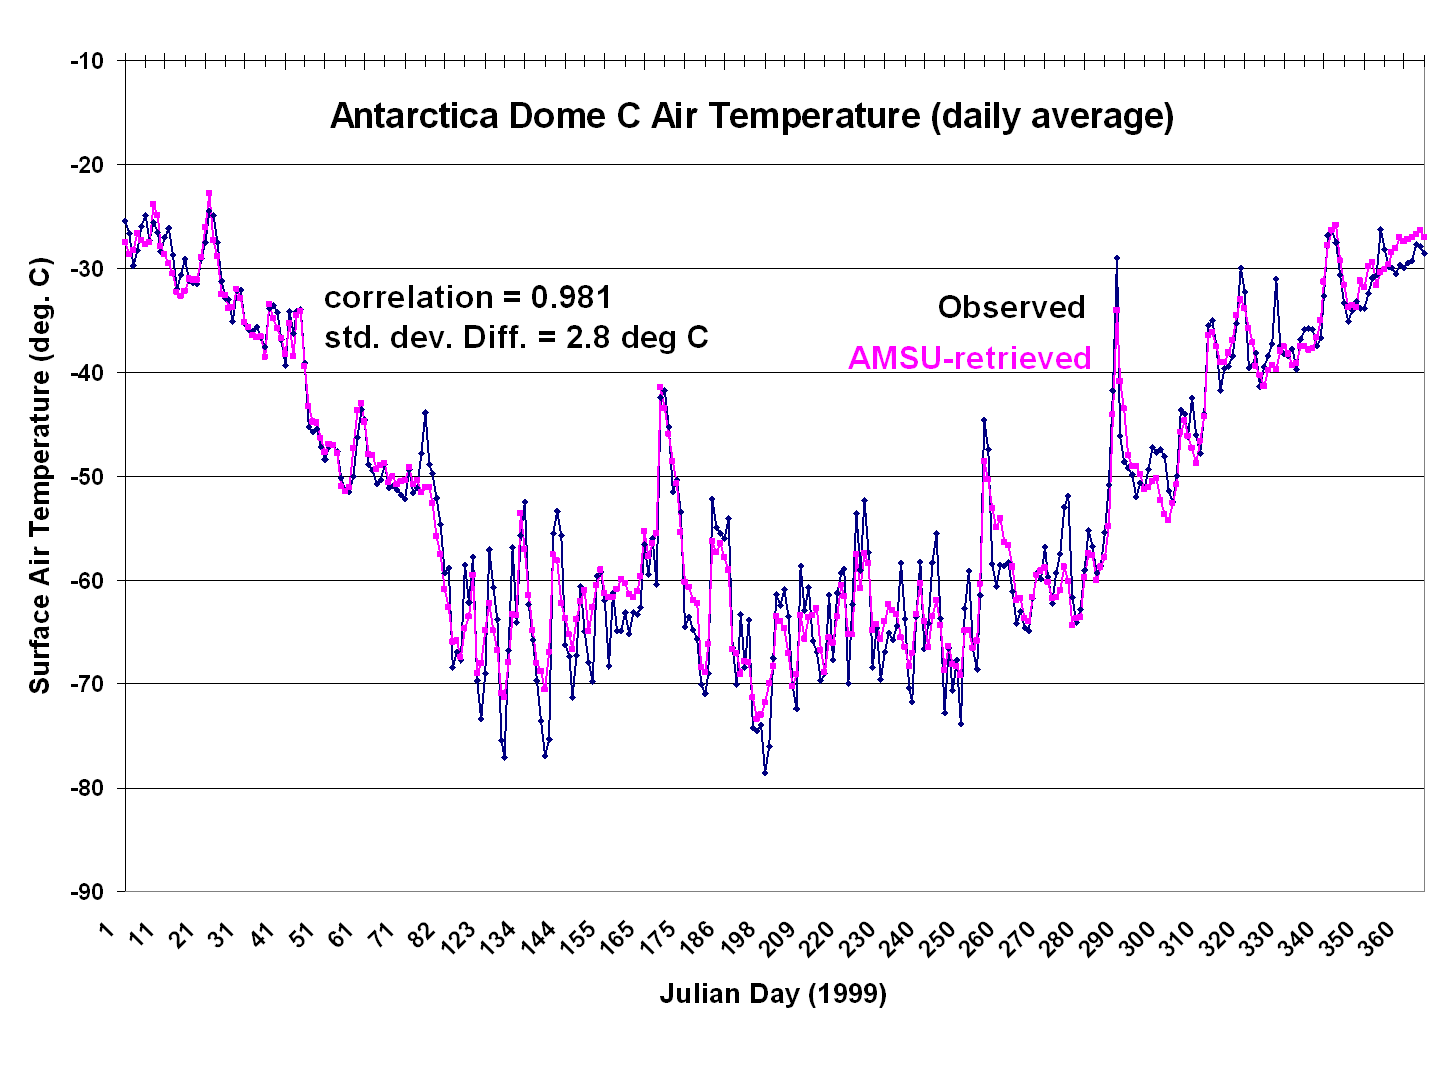
I used linear regression between the 5 AMSU channels mentioned above versus one year of daily air average temperature measurements at Dome C, which has an elevation of 3250 m. Even though the retrieval method is trained with observed air temperatures, it must be kept in mind that most of what these channels measure is thermal emission by the surface and sub-surface, with somewhat less contribution by oxygen emission from the air in the lowest km or so of the atmosphere.
The following plot shows the resulting match between the AMSU retrievals and surface air temperature at Dome C:
I then applied this algorithm to the NOAA-15 AMSU data within 50 km of the center of Dome A, the highest (and coldest) location on the Antarctic ice sheet. I restricted the analysis to just NOAA-15 since it carries the AMSU with the longest period of record (since 1998).
The resulting daily surface air temperature retrievals since August 1998 are shown in the following plot:
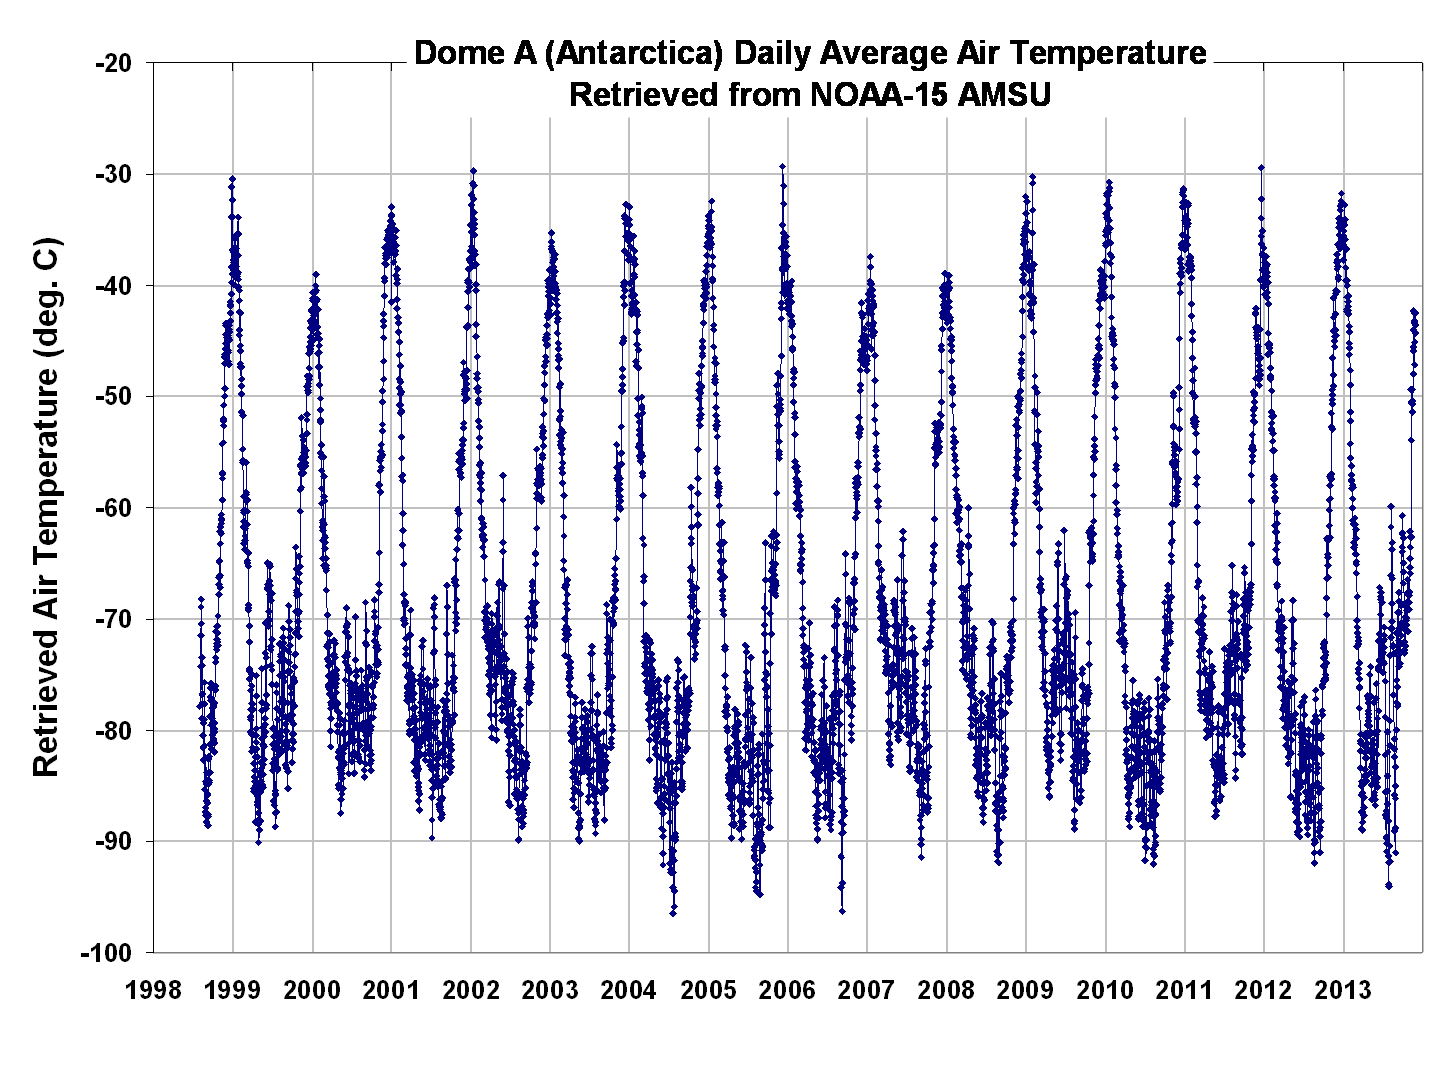
As can be seen, every year experiences temperatures below -80 deg. C, consistent with the claims from the Wikipedia entry on Dome A.
The corresponding temperature anomalies are shown next (the linear trend is +0.05 deg C/yr.):
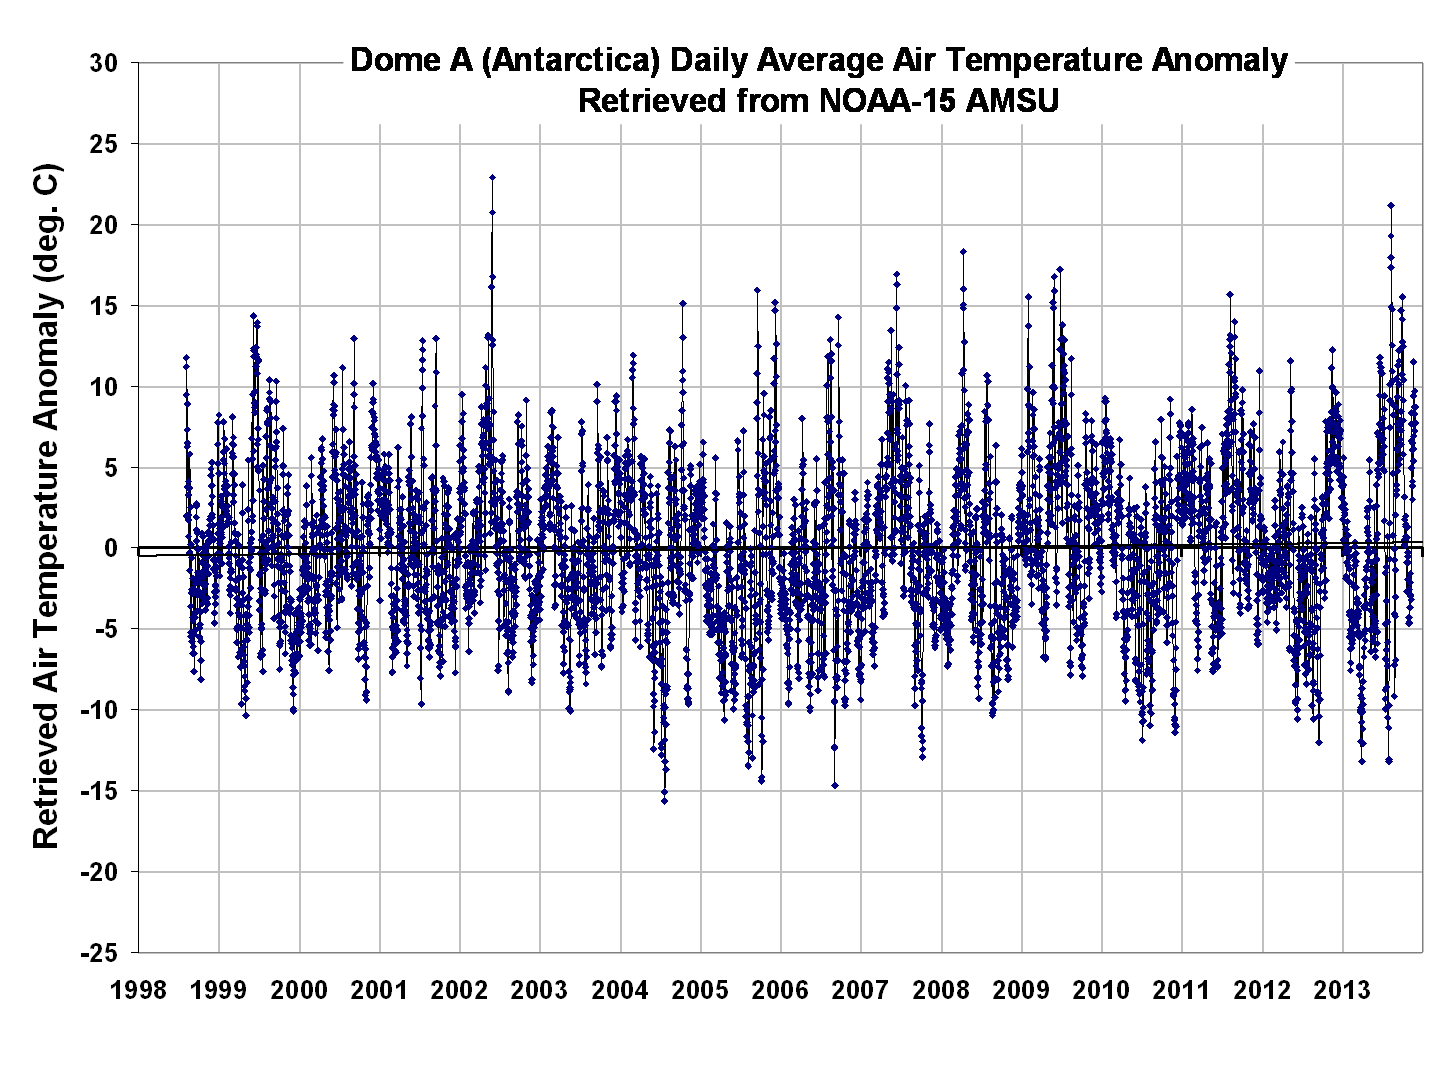
The reported record low temperature dates from MODIS in 2010, and Landsat 8 in 2013, are not obviously reflected in the AMSU retrievals (the lowest AMSU temperatures in 2010 are about a month before MODIS made its record low temperature measurement). But I wouldn’t read too much into disagreements between AMSU and the infrared measurements, for at least a couple of reasons:
1) The AMSU measurements are averaged over an area of about 100 x 100 km, whereas the infrared reports for “record” lowest temperatures are very localized (MODIS has a horizontal resolution of about 0.25 km, AMSU of 50 km).
2) IR measurements under clear conditions should provide a somewhat closer measurement to the air temperature than a microwave method can provide, due to the more variable microwave surface emissivity.
One thing I discovered is that AMSU channel 15 (89 GHz) data for this location has a signature of snowfall events, which I adjusted for in the above retrievals. That snowfall signature looks like this:
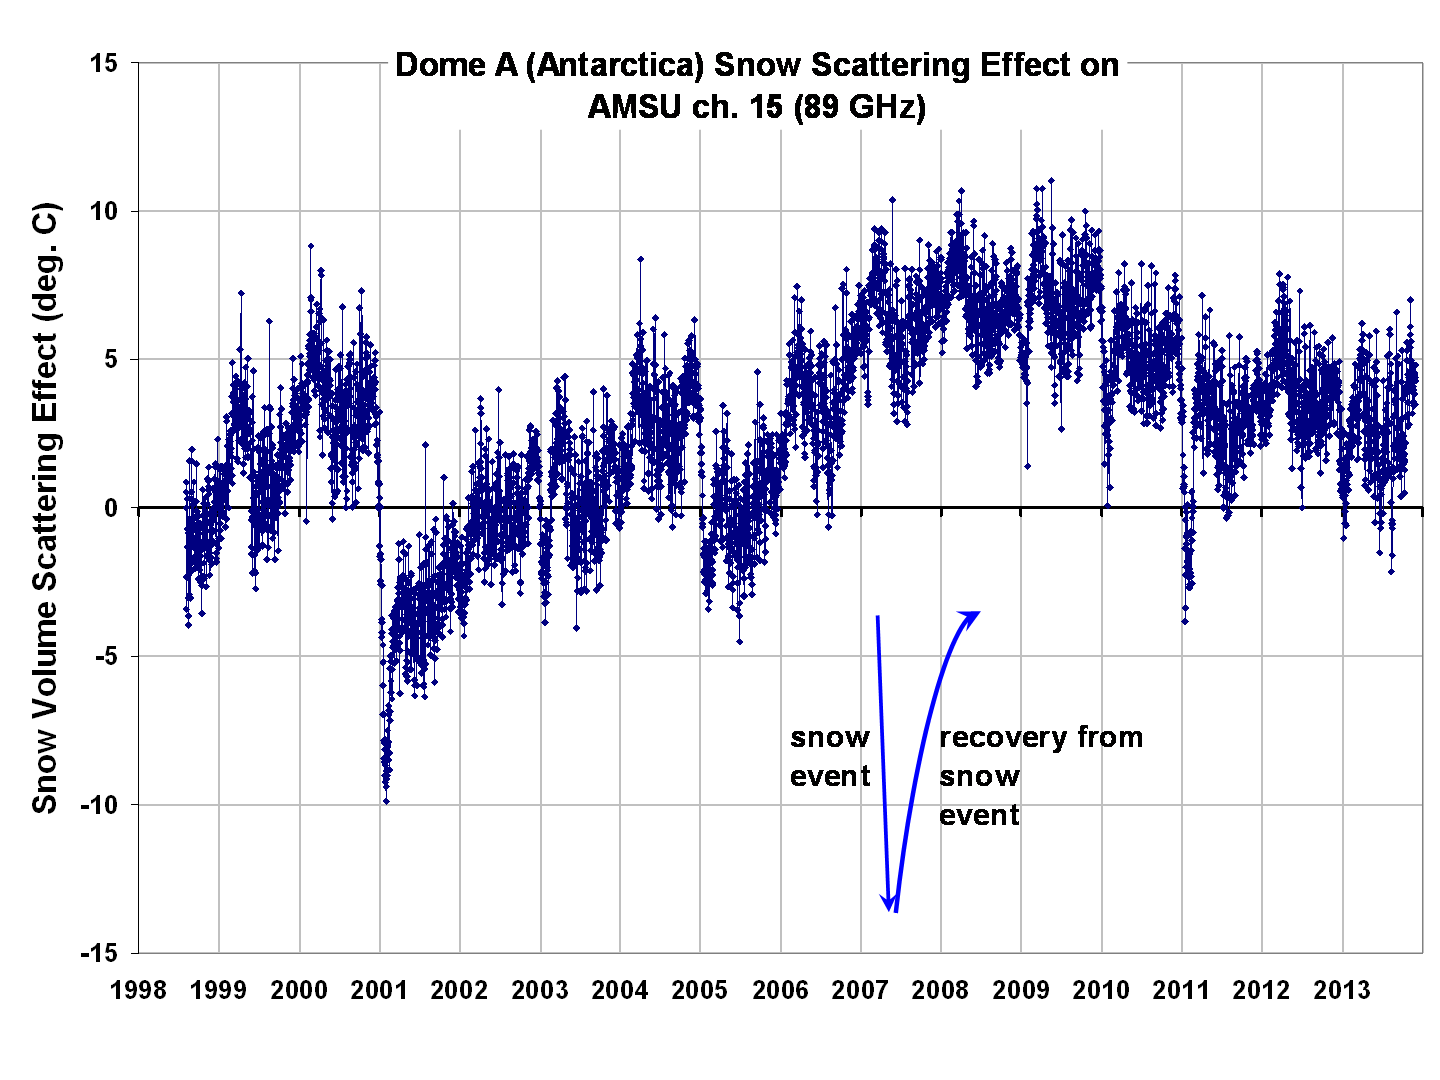
This plot was obtained by taking the 89 GHz brightness temperatures and subtracting off a regression estimate of those 89 GHz Tb based upon the other 4 AMSU channels. The characteristics of these “regression residuals” are consistent with our AMSR-E Team’s measurements of snow depth, which show sudden Tb depressions after a snow event, then gradual recovery as the snow pack particles change over time.
This was more of an experiment to get some idea of how well several AMSU channels can retrieve near-surface temperatures over the Antarctic ice sheet. I would say the data appear to be usable, especially considering the fact that there are very few actual thermometer measurements in this remote location.
Also, a comparison with climate model predictions for warming over the ice sheet would probably be an interesting comparison to make. At least over the last 15 years, the linear warming trend averages 0.05 deg. C/year (+/-0.015 deg. C/year). Given the huge variability that occurs at this location, it is difficult to know how physically significant this is.


 Home/Blog


