Archive for 2013

Exploding Russian Meteor: An Asteroid Fragment?

Friday, February 15th, 2013

UPDATE (12:18 CST 12/15/2013): A little more than 12 hours after the Russian meteor event occurred, it now appears to be the consensus of opinion that the meteor had nothing to do with the asteroid making its close approach to the Earth today. The two objects appear to have been on very different trajectories, and so it is difficult to see how they could have been sharing the same orbit around the sun.

The meteor which exploded over the Urals of Russia on 15 February 2013 entered the Earth’s atmosphere within hours of the closest approach ever recorded of an asteroid to the Earth, named 2012 DA14.

The above video of the event is quite spectacular, with a number of dash cams capturing the exploding meteor’s trail. The meteor was estimated by the Russian Academy of Sciences to be about 10 tons, which caused buildings to be damaged from the shock wave, and hundreds of injuries from flying glass.

This is the most spectacular bolide (large, bright meteor) event I can remember in my lifetime. The various videos suggest that it might have become brighter than the midday summer sun, although it is difficult to tell because the sun was very low in the sky (in the middle of the Russian winter) when the event happened.

While I am not an expert, I suspect that this was a fragment of asteroid 2012 DA14 passing closest to the Earth today (Feb. 15). This is simply too much of a coincidence. I also expect that this event will lead to renewed calls for government programs to deal with the potential threat of an asteroid collision with the Earth, a threat which space experts have been saying is very real. It’s only a matter of time before an asteroid large enough to cause substantial damage will reach the Earth. I’d be interested to hear the opinions of others on this.

By way of historical perspective, the 1908 Tunguska Event involved what is believed to be an exploding meteor or fragment of a comet, which leveled over 800 sq. miles of forest in rural Russia. The size of the meteor or cometary fragment has been estimated to be around 100 m in diameter, which is somewhat larger than the 2012 DA14 asteroid which makes its closest approach to Earth today, 15 February 2013.

Time Out for Some Time Lapse

Wednesday, February 6th, 2013

OK, boys and girls, time to take a break from bickering over warming trends and the greenhouse effect. 🙂

Let’s take in some of Nature’s beauty. My new hobby is time lapse photography, and here are 4 very short video segments I’ve put together for your enjoyment (sorry, no music to go with them).

For those not familiar with the technique, you can plug a controller into a digital SLR camera on a tripod and take many photos in succession at whatever time interval and exposure settings you want, do some (optional) “high dynamic range” (HDR) enhancement in post-processing, and then render the resulting photos as a video file, which I do in Photoshop.

I’m currently partial to the night sky as a subject, since a good DSLR camera with a fast lens can see more stars and satellites passing over than the unaided eye.

The first video I took last night from a very dark location near Hytop, Alabama (be sure to (1) click on the HD icon to toggle on the high def version, and (2) Full Screen icon next to the “HD” marker after you start the video):

http://vimeo.com/59066740

The second video I did a few days ago at Little River Falls, near Ft. Payne, Alabama:

http://vimeo.com/59076557

The third video is from my backyard at night, of stars, the moon, Jupiter, and clouds moving past the 1,000 ft tall TV tower we live next to:

http://vimeo.com/59092011

The final video was made during our wedding anniversary visit to the Grand Canyon in late November, 2012, and shows moonrise over the Canyon:

The cameras and lenses used for each, as well as the settings, are provided on my Vimeo.com page.

Decreased Surface Wind as a Contributor to Warming

Tuesday, February 5th, 2013

I recently discussed the possibility that waste heat from our energy use could be contributing to the observed increase in surface air temperatures, since it potentially rivals the size of the radiative forcing expected from increasing CO2, at least where people live (and put thermometers).

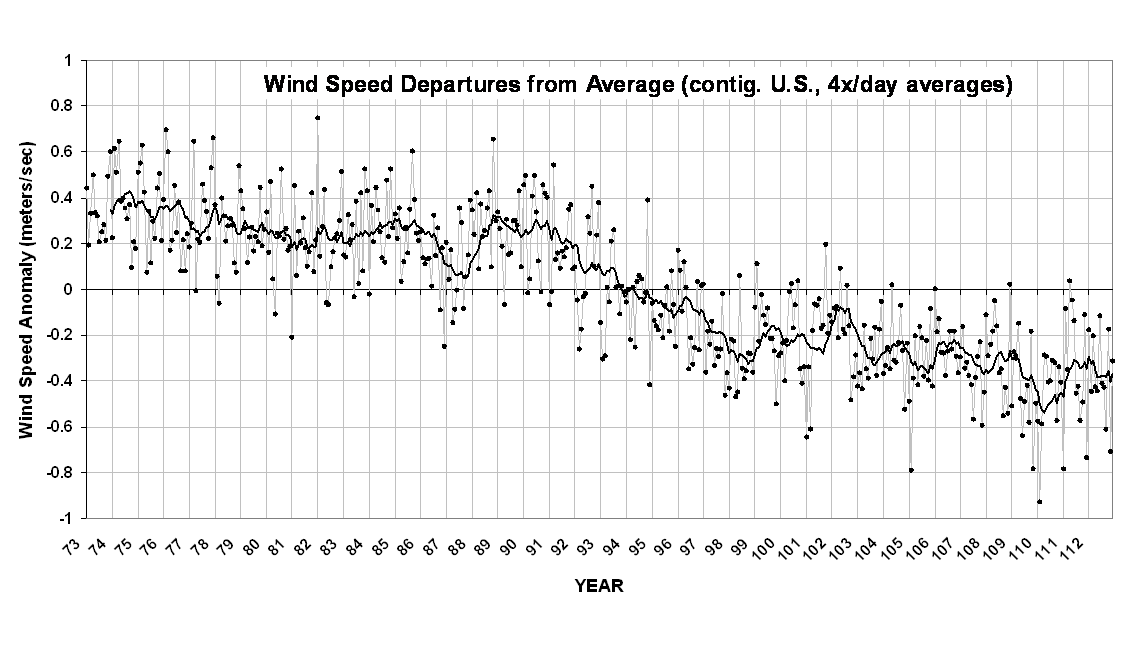
Now I’d like to discuss another possibility, related to something which I’ve noted in the surface weather data over the U.S.: a decrease in average surface wind speed. Over the last 40 years, there has been an observed decrease in near-surface wind speeds of about 0.7 meters per second, which is about 1.5 mph, which is shown in the following plot based upon my analysis of raw hourly ISH data downloaded from NCDC (dots are monthly, solid line is trailing 12-month average; click for large version):

Now, there are 3 basic ways in which land surface temperatures can warm: (1) an increase in absorbed sunlight; (2) a decrease in the rate at which the surface loses infrared (IR) energy, and (3) a decrease in convective heat loss from the surface.

That convective heat loss is made up of both dry and moist convective air currents. For example, dry convection would dominate over the desert; moist convection dominates over the ocean. Together, it is estimated that surface convective heat loss over the Earth averages around 100 Watts per sq. meter….much higher in the tropics, lower toward the poles.

Now, it is well known that convective heat loss is roughly proportional to surface wind speed. A wind decrease of 1.5 mph since the 1970s would represent about a 10% reduction in convective heat loss, which is about 10 W/m2 (all back-of-the-envelope, mind you, taking into account that there is still convective heat loss even when the wind goes to zero on a sunny day…it’s complicated).

Now, the 10 W/m2 is about 10 times larger than the estimate remaining radiative imbalance from increasing CO2. In other words, in some sense, it’s ten times easier to blame increasing U.S. temperatures on decreasing wind speed than on increasing CO2.

Of course, there are a number of caveats, not the least of which, Is the observed decrease in wind speed real?

Globally, more frequent El Nino’s in recent decades also decrease wind speeds over the ocean, which leads to a reduction in convective heat transport. But, the higher ocean surface temperatures (primarily from reduced upwelling of cold water) tend to counteract this by evaporating more water into the lower atmosphere, which can fuel stronger convection. So, there are competing influences which make the problem more difficult to analyze over the ocean.

But all other things being equal, a decrease in wind speed leads to decreased convective heat loss, which then leads to higher higher surface temperatures.

So, what then limits the value of those higher surface temperatures? Well, at 25 deg. C, an increase of 1 deg. C leads to an increase in infrared radiative loss by 6 W/m2. So, if decreased winds were to cause surface warming, the surface produces an extra boost in IR cooling which then limits the temperature rise. A change in one portion of the energy budget tends to result in changes in other components of the energy budget.

I don’t have a strong opinion regarding how much decreased surface winds (or waste heat production) have contributed to U.S warming in recent decades. Maybe a little, maybe most of it. We just don’t know.

But I do have a strong opinion about scientists who have a tendency to interpret every change they see in nature as some sort of response to increasing CO2.

NOTE: I anticipate someone is going to make a comment to the effect that convection will always stay the same in order to maintain the tropospheric temperature lapse rate. This is not true. Every day that it is sunny over land, the lapse rate in the lowest 100 meters of the atmosphere is strongly super-adiabatic. This is because convective air currents cannot transport heat from the solar-heated surface to the free atmosphere as fast as it is being generated; the process is rather slow and inefficient, and the strength of turbulent mixing by the wind does make a difference. And the hotter the surface gets under low wind conditions, the more energy the surface then loses instantaneously through infrared radiation, rather than through convection. Many field experiments in the last 50+ years have made observations of the dependence of convective heat loss on wind speed.

UAH Global Temperature Update for January, 2013: +0.51 deg. C

Tuesday, February 5th, 2013

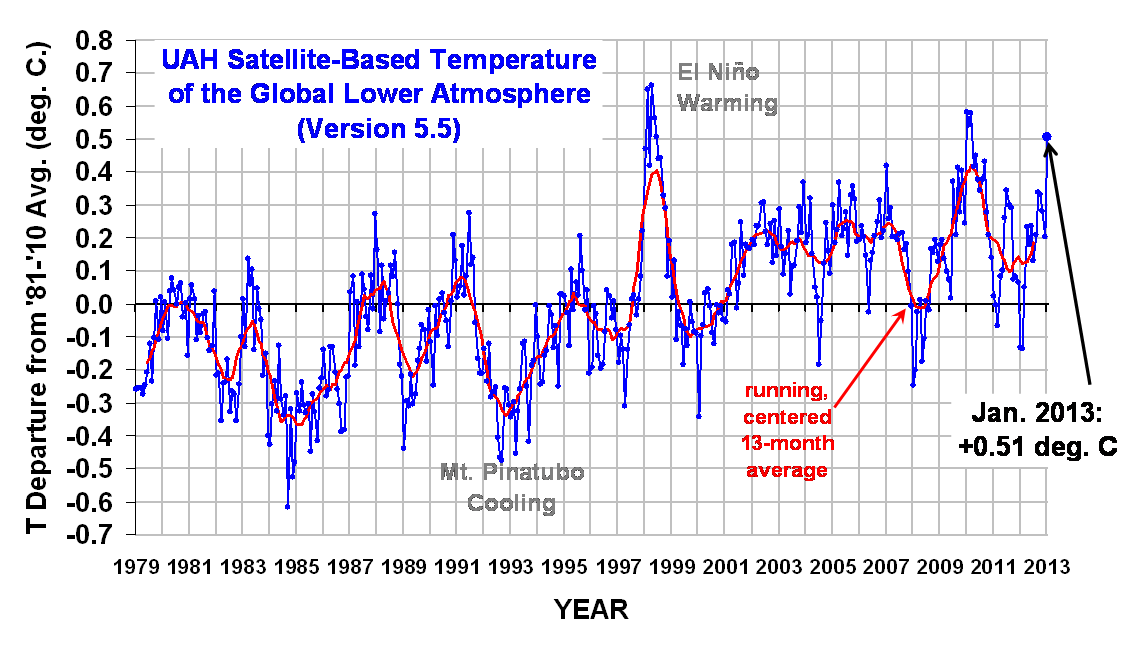
Our Version 5.5 global average lower tropospheric temperature (LT) anomaly for January, 2013 is +0.51 deg. C, a substantial increase from December’s +0.20 deg. C. (click for large version):

The global, hemispheric, and tropical LT anomalies from the 30-year (1981-2010) average for the last 13 months are:

YR MON GLOBAL NH SH TROPICS
2012 1 -0.134 -0.065 -0.203 -0.256
2012 2 -0.135 +0.018 -0.289 -0.320
2012 3 +0.051 +0.119 -0.017 -0.238
2012 4 +0.232 +0.351 +0.114 -0.242
2012 5 +0.179 +0.337 +0.021 -0.098
2012 6 +0.235 +0.370 +0.101 -0.019
2012 7 +0.130 +0.256 +0.003 +0.142
2012 8 +0.208 +0.214 +0.202 +0.062
2012 9 +0.339 +0.350 +0.327 +0.153
2012 10 +0.333 +0.306 +0.361 +0.109
2012 11 +0.282 +0.299 +0.265 +0.172
2012 12 +0.206 +0.148 +0.264 +0.138
2013 1 +0.506 +0.553 +0.459 +0.375

Due to the rather large 1-month increase in the temperature anomaly, I double checked the computations, and found that multiple satellites (NOAA-15, NOAA-18, and Aqua) all saw approximately equal levels of warming versus a year ago (January, 2012), so for now I’m accepting the results as real. The most common cause of such warm spikes (when there is no El Nino to blame) is a temporary increase in convective heat transfer from the ocean to the atmosphere. This would suggest that the global average sea surface temperature anomaly might have actually cooled in January, but I have not checked to see if that is the case.

Archived color maps of local temperature anomalies will be updated shortly are available on-line at http://nsstc.uah.edu/climate/;

The processed temperature data (updated shortly) is available on-line at http://vortex.nsstc.uah.edu/data/msu/t2lt/uahncdc.lt

Waste Heat as a Contributor to Observed Warming

Wednesday, January 9th, 2013

I sometimes get asked about the possible contribution of our daily energy consumption to warming in the U.S. With the recent announcement that the U.S. experienced the warmest year on record in 2012 (in the surface temperature data), I thought I would revisit this issue.

Many authors have analyzed the problem, starting in the 1960’s. Jill Jager’s 1983 book Climate and Energy Systems; A Reviews of their Interactions is little known, but is very good on this subject.

I have never looked into the problem very deeply, and have always assumed that the heat generated through our use of electricity and various fuels was, compared to the radiative forcing from increasing CO2, negligibly small. I have assumed that most of the urban heat island effect is “passive”, due to replacing the cooling effects of vegetation with buildings, streets. etc, which warm up more in the sun.

Now I’m not so sure….at least for industrialized and economically active countries like the U.S., it looks like waste heat production from our energy use could be a major player.

If similar calculations to those below have been posted elsewhere, my apologies…just consider this an independent estimate. Again, what I am discussing here is separate from, and in addition to, the passive change in the land energy budget from replacing vegetation with manmade structures (parking lots, etc.).

U.S. Energy Consumption

It 2006, total U.S. energy consumption was estimated (according to DOE/EIA) to be 97.1 quadrillion BTUs, which when converted to “watts” type measurements is equivalent to 3.25 x 10¹² watts generated continuously over the course of a year.

If we divide that by the surface area of the U.S. in meters, we get 0.33 watts per sq. meter.

Now, compare that the the total radiative forcing from increasing greenhouse gas concentrations supposedly operating today, which (according to the IPCC) is somewhere around 1.6 W/m2.

At this point, we might conclude that the waste heat generation (0.33 W/m2) is only about 20% of the radiative forcing from increasing CO2 (1.6 W/m2).

But there are at least 2 issues we would be neglecting.

1) Radiative Forcing is Alleviated After Warming…Waste Heat Forcing Is Not

The actual residual radiative imbalance from increasing CO2 in 2006 was (according to Jim Hansen or the IPCC) more like 0.6 watts per sq. meter, since warming has alleviated some of the radiative forcing caused by increasing CO2.

In contrast, waste heat from our use of energy keeps getting generated, no matter how much our surroundings have warmed. So, with this correction, we now see that waste heat generation (0.33) becomes more like 50% of the remaining radiative imbalance (0.6) from anthropogenic GHG production.

2) Waste Heat is Mostly Released in the Lowest 10% of the Atmosphere
The second point we would be missing is that, whereas radiative forcing from GHGs is distributed throughout the atmosphere, most waste heat (except for jet traffic) is concentrated close to the ground…in the lowest few hundred meters. And the smaller the mass of air heated by the same energy input, the greater the temperature rise will be.

Of course, the extra warmth is then dispersed upward from convection and IR cooling, but it still is first expressed as concentrated warming of the air in the lowest atmosphere. (I need to check into the increase in radiative forcing in the lower atmosphere from increasing CO2, to make this a fair comparison).

So, What is the Contribution of Waste Heat to Measured Warming?
This would not be an easy question to answer. I’ve assumed that the waste heat generated in the U.S. is spread evenly across the U.S., whereas it is actually much more concentrated where people are. Of course, thermometers are also placed where people are, so they are more apt to measure the effects of this waste heat.

Even the Climate Reference Network of “well-sited” thermometers are, for the most part, not that far from local economic activity…especially in the eastern U.S. I’ve looked at every one of the 100+ sites in Google Earth (most of are actually visible, with their distinctive trio of bright white thermometer solar shields), and relatively few of them are what you would call “remote”.

Unless I have made a serious error in my back-of-the-printer-paper calculations (which wouldn’t be the first time), I would say that humanity’s generation of waste heat can’t be ignored in the discussion of observed land surface warming trends.

This reminds me of the 2007 paper by McKitrick and Michaels who found that regional surface warming was statistically related to the level of economic activity. What I have provided here is instead a simpler comparison of the levels of energy input from waste heat production versus radiative forcing from GHGs.

(And if you want to bring in the observed warming of the oceans, where virtually no one lives, I will point out that the slight warming of the oceans in the last 50 years is equivalent to only 0.2 watts per sq. meter of net energy input (according to Levitus) into the upper half of the ocean. This value is so small and uncertain, dependent upon the measurement accuracy of hundredths of a degree change hundreds of meters deep, and with the uncertain nature of potential changes in deep ocean mixing, that I don’t think we can say anything definitive about the cause(s) of slight warming in the upper half of the ocean.)

UAH v5.5 Global Temperature Update for December, 2012: +0.20 deg. C

Thursday, January 3rd, 2013

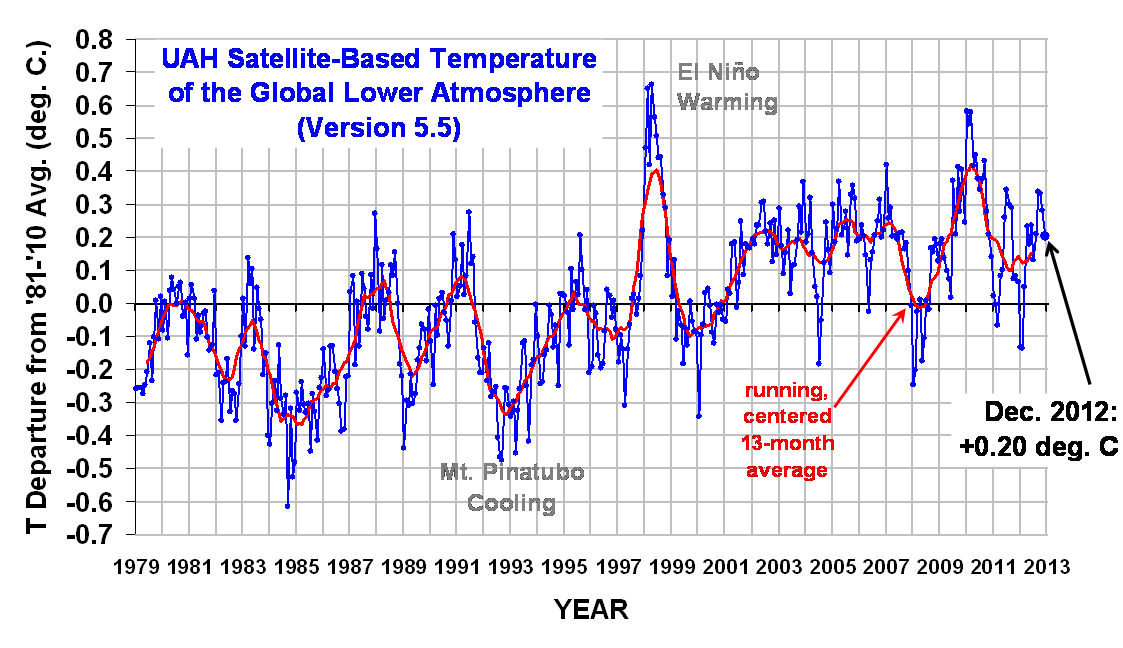
Our Version 5.5 global average lower tropospheric temperature (LT) anomaly for December, 2012 is +0.20 deg. C (click for large version):

The global, hemispheric, and tropical LT anomalies from the 30-year (1981-2010) average for 2012 are:

YR MON GLOBAL NH SH TROPICS
2012 1 -0.134 -0.065 -0.203 -0.256
2012 2 -0.135 +0.018 -0.289 -0.320
2012 3 +0.051 +0.119 -0.017 -0.238
2012 4 +0.232 +0.351 +0.114 -0.242
2012 5 +0.179 +0.337 +0.021 -0.098
2012 6 +0.235 +0.370 +0.101 -0.019
2012 7 +0.130 +0.256 +0.003 +0.142
2012 8 +0.208 +0.214 +0.202 +0.062
2012 9 +0.339 +0.350 +0.327 +0.153
2012 10 +0.333 +0.306 +0.361 +0.109
2012 11 +0.282 +0.299 +0.265 +0.172
2012 12 +0.202 +0.142 +0.261 +0.134
ANN AVG +0.161 +0.225 +0.097 -0.033

Globally, 2012 was the 9th warmest of the last 34 years, behind 1998, 2002, 2003, 2005, 2006, 2007, 2009, and 2010:

1979 through 2012, ranked from warmest to coolest:
1. 1998 0.419
2. 2010 0.394
3. 2005 0.260
4. 2002 0.218
5. 2009 0.218
6. 2007 0.202
7. 2003 0.187
8. 2006 0.186
9. 2012 0.161
10. 2011 0.130
11. 2004 0.108
12. 2001 0.107
13. 1991 0.020
14. 1987 0.013
15. 1995 0.013
16. 1988 0.012
17. 1980 -0.008
18. 2008 -0.009
19. 1990 -0.022
20. 1981 -0.045
21. 1997 -0.049
22. 1999 -0.056
23. 1983 -0.061
24. 2000 -0.061
25. 1996 -0.076
26. 1994 -0.108
27. 1979 -0.170
28. 1989 -0.207
29. 1986 -0.244
30. 1993 -0.245
31. 1982 -0.250
32. 1992 -0.289
33. 1985 -0.309
34. 1984 -0.353

The following comments are from John Christy:

While 2012 was only the ninth warmest year globally, it was the warmest year on record for both the contiguous 48 U.S. states and for the continental U.S., including Alaska. For the U.S., 2012 started with one of the three warmest Januaries in the 34-year record, saw a record-setting March heat wave, and stayed warm enough for the rest of the year to set a record.

Compared to seasonal norms, March 2012 was the warmest month on record in the 48 contiguous U.S. states. Temperatures over the U.S. averaged 2.82 C (almost 5.1° Fahrenheit) warmer than normal in March; the warmest spot on the globe that month was in northern Iowa. The annual average temperature over the conterminous 48 states in 2012 was 0.555 C (about 0.99 degrees F) warmer than seasonal norms.

Compared to seasonal norms, the coolest area on the globe throughout 2012 was central Mongolia, where temperatures averaged about 1.39 C (about 2.5 degrees Fahrenheit) cooler than seasonal norms. The warmest area was north of central Russia in the Kara Sea, where temperatures averaged 2.53 C (about 4.55 degrees Fahrenheit) warmer than seasonal norms for 2012.

Compared to seasonal norms, over the past month the coldest area on the globe was eastern Mongolia, where temperatures were as much as 4.55 C (about 8.19 degrees Fahrenheit) cooler than seasonal norms. The “warmest” area was off the coast of the Antarctic near South America, where temperatures averaged 3.79 C (about 6.82 degrees Fahrenheit) warmer than seasonal norms for December.

Archived color maps of local temperature anomalies are available on-line at http://nsstc.uah.edu/climate/;

The processed temperature data is available on-line at vortex.nsstc.uah.edu/data/msu/t2lt/uahncdc.lt

Misunderstood Basic Concepts and the Greenhouse Effect

Tuesday, January 1st, 2013

If you Google the phrase ‘greenhouse effect definition’, you get the following at the top of the returned results:

green•house ef•fect
Noun
The trapping of the sun’s warmth in a planet’s lower atmosphere due to the greater transparency of the atmosphere to visible radiation from the sun than to infrared radiation emitted from the planet’s surface

Actually, the greenhouse effect would still operate even if the atmosphere absorbed just as much solar as it does infrared. When even Google gets the definition so wrong, how can mere mortals be expected to understand it?

The so-called greenhouse effect, which is an infrared effect, is admittedly not as intuitively obvious to us as solar heating. Every layer of the atmosphere becomes both a “source” as well as a “sink” of IR energy, which is a complication not faced with understanding solar heating, with the sun as the source.

To understand the greenhouse effect’s impact on surface temperature and the atmospheric temperature profile, there are some basic concepts which I continue to see misunderstandings about. If we can’t agree on these basics, then there really is no reason to continue the discussion because we are speaking different languages, with no way to translate between them.

The following list is not meant to be exhaustive, just the issues which people most commonly misunderstand, and so represent stumbling blocks to an understanding of how the greenhouse effect operates. (I have phrased them as the way in which I believe things really work.)

1) The greenhouse effect does not necessarily require solar heating. If the climate system was heated by intense geothermal energy rather than the sun, the greenhouse effect would still operate.

2) Temperatures in the climate system are the result of energy fluxes gained versus lost. An equilibrium temperature is reached only after the rate of energy absorbed by a layer (of atmosphere, soil, or water) equals the rate of energy loss. This is contrary to the common misconception that energy input alone determines temperature.

3) The greenhouse effect does not violate the 2nd Law of Thermodynamics. Just because the greenhouse effect (passively) makes the surface of the Earth warmer than if only (active) solar heating was operating does not violate the 2nd Law, any more than insulating your house more can raise its interior temperature in the winter, given the same energy input for heating. Very high temperatures in a system can be created with relatively small energy fluxes into that system *if* the rate of energy loss can be reduced (see #2, above). Again, energy input into a system does not alone determine what the temperature in the system will be.

4) The rate of IR absorption by an atmospheric layer almost never equals the rate of IR emission. IR emission is very dependent upon the temperature of that layer, approximately increasing as the 4th power of the temperature. But IR absorption is much less dependent on the temperature of the layer. So, for example, if you irradiated a very cold layer of air with intense IR radiation, that layer would warm until the rate of IR emission equaled the rate of absorption. But in the real atmosphere, other kinds of energy fluxes are involved, too, and so in general IR emission and absorption for a layer are almost never equal.

5) Each layer of the atmosphere does not emit as much IR upward as it does downward. There are people who try to attach some sort of cosmic significance to their claim that the atmosphere supposedly emits as much IR energy upward as it does downward, which is only approximately true for thin atmospheric layers. But the claim is false. Ground-based, upward-viewing IR radiometers measure much stronger levels of downward atmospheric emission than do space-based, downward-viewing radiometers of upward atmospheric emission. The reason is mostly related to the tropospheric temperature lapse rate. If the atmosphere was isothermal (vertically uniform in temperature) then upward and downward emission would be the same. But it’s not. Even if you restrict the analysis to very thin atmospheric layers, the upward emission will be slightly less than the downward emission, because it originates from an average altitude which is slightly higher, and thus colder (except in the stratosphere). (As an interesting aside, many models actually do make the approximation that their individual layers emit as much IR radiation upward as downward, yet they still successfully create an atmospheric temperature profile which is realistic).

6) The tropospheric temperature lapse rate would not exist without the greenhouse effect. While it is true that convective overturning of the atmosphere leads to the observed lapse rate, that convection itself would not exist without the greenhouse effect constantly destabilizing the lapse rate through warming the lower atmosphere and cooling the upper atmosphere. Without the destabilization provided by the greenhouse effect, convective overturning would slow and quite possible cease altogether. The atmosphere would eventually become isothermal, as the full depth of the atmosphere would achieve the same temperature as the surface through thermal conduction; without IR emission, the middle and upper troposphere would have no way to cool itself in the face of this heating. This scenario is entirely theoretical, though, and depends upon the atmosphere absorbing/emitting absolutely no IR energy, which does not happen in the real world.

I’ll be happy to post corrections/additions to the above list as warranted. I also apologize in advance for the inevitable snarky comments you will find a few people posting. I believe in letting people speak their mind.