Archive for June, 2014

Lake Superior Water Level Sees Fastest Rise in 98 Years

Monday, June 30th, 2014

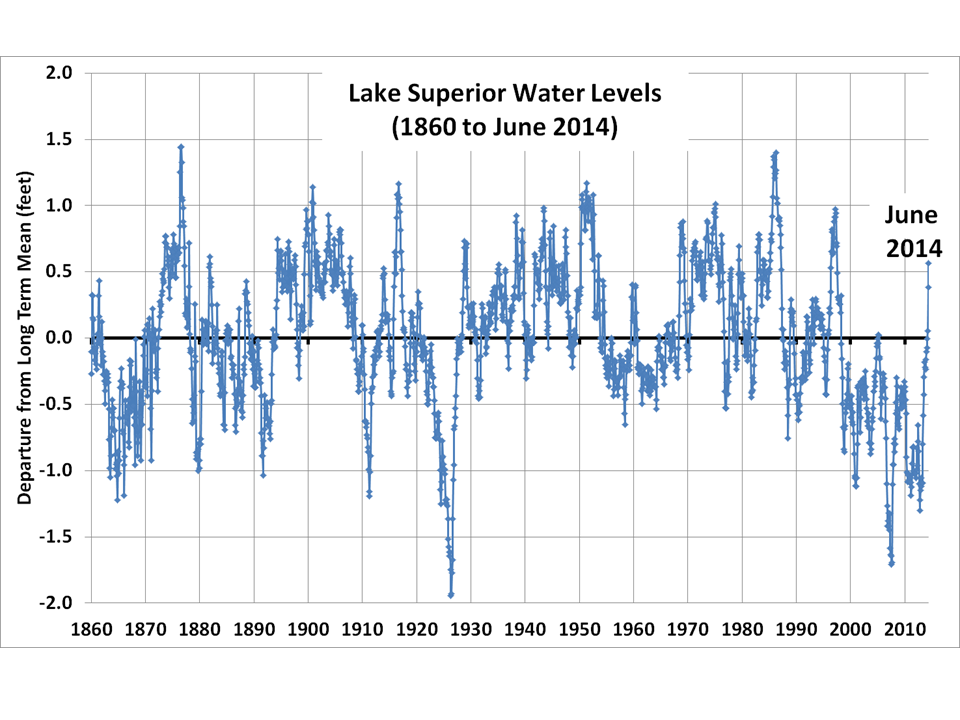
As a result of unusually heavy precipitation, the water level in Lake Superior has increased rapidly in the last year, by about 14 inches (based upon 3 month averages). This rate of rise is the fastest 12-month increase ending in April-May-June average levels since 1916, and the 2nd fastest since records began in 1860 (154 years ago). An Excel spreadsheet with the data is here.

Here’s a plot of monthly departures from the long-term average (deseasonalized):

Monthly departures from average of Lake Superior water levels between 1860 and June 2014.

Monthly departures from average of Lake Superior water levels between 1860 and June 2014.

As a result of the high lake levels, water flow out of Superior through the St. Marys river in Sault Ste. Marie, MI, has been increased by increasing the number of gates open.

As discussed by Steve Hayward today, this rise in lake levels was totally unexpected by climate scientists, who have been anticipating declining lake levels in response to global warming-induced drought.

Of course, those scientists will no doubt claim they will eventually be proved correct. Except that climate models they rely upon are notoriously poor at predicting regional changes in climate…even worse than predicting changes in global-average conditions.

Las Vegas Temperatures: The Plot Thickens

Friday, June 27th, 2014

This is my third post on Las Vegas temperatures. Not that I wanted to do 3 posts…but I keep running into “issues” regarding the thermometer data available from NCDC.

In yesterday’s post I thought I was providing the “official” USHCN temperatures for Las Vegas, as downloaded from an NCDC web page.

But there are 2 new problems:

1) that NCDC page seems to be buggy…it gives exactly the same data for maximum, minimum, and average temperatures.

2) Las Vegas is not a USHCN station anyway.

The point of my original post was to examine Las Vegas temperatures as perceived by the public. We all know it’s hot there in July, and as my two previous posts indicated, the McCarran Airport temperatures exhibit a strong urban heat island (UHI) warming signal over time (much more warming at night than during the day). The same is probably true of the North Las Vegas airport, which is where the NWS currently reports temperatures from.

So, if a record high temperature is reported on any given day in Las Vegas, it will likely be for these unadjusted, UHI-influenced temperatures…not from NCDC-adjusted USHCN temperatures (which don’t include these stations anyway).

Since there is a strong UHI warming effect there, such record setting temperatures are pretty meaningless in a climate context. With an increasing UHI effect, we expect the frequency of temperature records broken to increase over time. (Without a spurious UHI warming effect, and no global warming, we would expect the frequency of broken records to decrease over time…with 2 years of data, there’s a 50% chance of breaking a high temperature record, with 3 years, a 33% chance, etc.)

So, the bottom line remains the same. The UHI effect has probably hopelessly corrupted urban stations like Las Vegas (as Anthony Watts also concluded in his post from yesterday). Inferring anything about global warming from new temperature records set at these stations is impossible.

Las Vegas: Poster Child for the Urban Heat Island Effect (updated & corrected)

Thursday, June 26th, 2014

(This post supercedes yesterday’s post, in which I used the unadjusted USHCN temperature data. The conclusion remains the same with the adjusted USHCN data…the official Las Vegas temperature record contains a large urban heat island warming effect which is spurious to the climate signal.)

As many of you are aware, Heartland’s 9th International Conference on Climate Change (aka the “skeptics conference”) will be held in Las Vegas, Nevada during July 7-9, 2014.

Anthony Watts has already posted some July temperature statistics for Las Vegas…basically, it’s really hot there in July.

What is notable about the “official” surface temperature record there is the strong urban heat island (UHI) effect which still remains in the USHCN data.

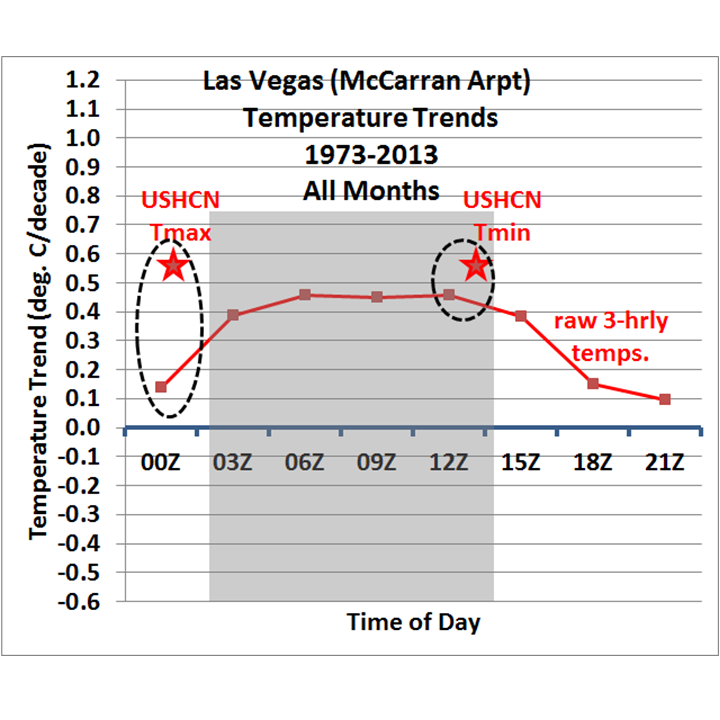
This can been seen from the raw temperature data, which shows that daytime warming has been modest and nighttime warming has been strong (over 3 deg. F since 1973), whereas the official, adjusted USHCN Tmax and Tmin trends are even warmer than the raw temperature trends, even at night, and are equal to each other:

Fig. 1. Las Vegas temperature trends during 1973-2013 (all months) from raw 3-hrly temperatures versus USHCN adjusted temperatures. Shading represent nighttime hours

Fig. 1. Las Vegas temperature trends during 1973-2013 (all months) from raw 3-hrly temperatures versus USHCN adjusted temperatures. Shading represent nighttime hours.

No matter what instrumentation changes occurred in the raw temperature record, there is no way they cause a nighttime bias that large compared to the daytime (speaking as a former certified aviation weather observer). The USHCN plot provided by Anthony shows 10 deg. F (!) of nighttime warming since the late 1930s, which is simply not a credible representation of the non-urban environment.

The most logical explanation for the raw 3-hourly temperature differences between day and night is related to the dramatic growth Las Vegas has experienced in the last 40 years. The number of visitors has skyrocketed from 8 million in 1973 to about 40 million today, a factor of 5 increase. The population has increased by a factor of about 6 or 7.

All of this translates into more waste heat from air conditioning, plus more artificial surfaces which warm faster than natural surfaces. If you doubt this for even the natural desert surrounding Las Vegas, look at the Landsat IR thermal imager data in this report.

During the day, the extra heat can mix convectively through a pretty deep layer of the atmosphere, which limits the daytime warming. But at night, the nocturnal inversion traps heat, magnifying the UHI effect.

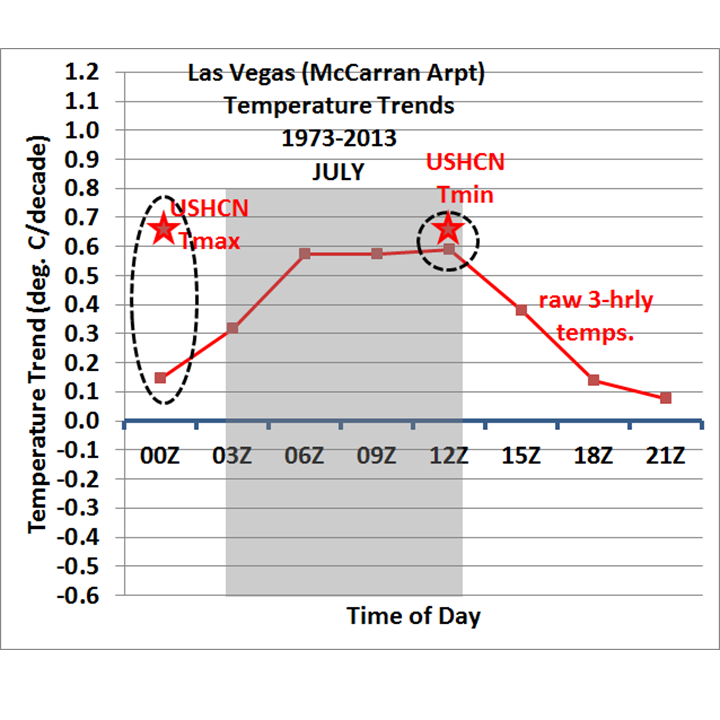
If we just focus on the month of July, the results are roughly similar to the full-year results:

Fig. 2. As in Fig. 1, but just for July.

Fig. 2. As in Fig. 1, but just for July.

It appears that the “homogenization” adjustment performed on the USHCN data has inadvertently used the spurious nighttime warming as truth, and made the daytime warming match it. Given what we know about how urban environments retain heat at night, the exact opposite should have happened. In fact, given that there should also be an urban warming signal during the day, it might well be there has been no real climate-related warming in Las Vegas in the last 40 years.

The net result is that the official (adjusted USHCN) Las Vegas warming trends appear to be dominated by local urban heat island effects.

Las Vegas: Poster Child for the Urban Heat Island Effect

Wednesday, June 25th, 2014

(This post is being superceded, as John Christy has pointed out I used the unadjusted USHCN data for this.)

As many of you are aware, Heartland’s 9th International Conference on Climate Change (aka the “skeptics conference”) will be held in Las Vegas, Nevada during July 7-9, 2014.

Anthony Watts has already posted some July temperature statistics for Las Vegas…basically, it’s really hot there in July.

What is notable about the “official” surface temperature record there is the strong urban heat island (UHI) effect which still remains in the USHCN data. Daytime warming has been modest, but nighttime warming has been spectacular….10 deg. F or more since the 1940s.

How does something like this spurious warming still remain in the USHCN data? The “homogenization” adjustment procedure that NOAA uses in USHCN apparently does not effectively remove the spurious warming. Anthony has posted extensive evidence regarding this issue in the past.

I examined the raw 3-hourly temperatures (from NOAA Integrated Surface Hourly [ISH] data) collected at McCarran Airport in Las Vegas, as well as at Nellis Air Force Base, since 1973. It clearly shows how nighttime temperatures have increased in the last 40 years compared to the daytime temperatures:
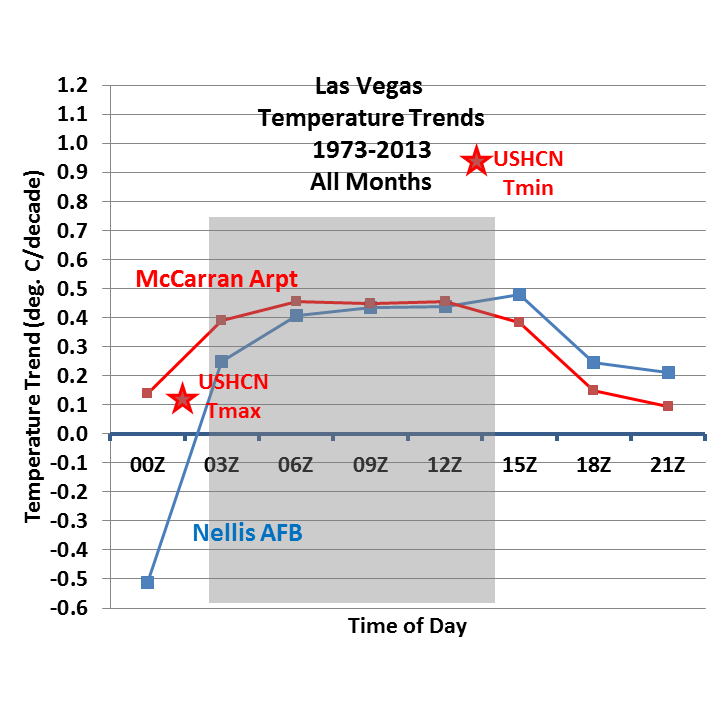
Fig. 1. Las Vegas temperature trends 1973-2013 as a function of time of day (dark shading is approx. nighttime hours).

Las Vegas temperature trends 1973-2013 as a function of time of day (dark shading is approx. nighttime hours).

What is rather remarkable, though, is that the USHCN temperature trends for the same period (1973-2013, the red stars), while agreeing with the ISH 3-hourly data for Tmax, are twice as warm as the ISH data for Tmin.

How can this be?? How can the USHCN adjustment procedures actually magnify the nighttime warming, rather than reduce it? I have no explanation for this. (Nellis AFB data are not available in the USHCN data after 1970 for some reason).

If we just focus on the month of July, the results are roughly similar to the full-year results:
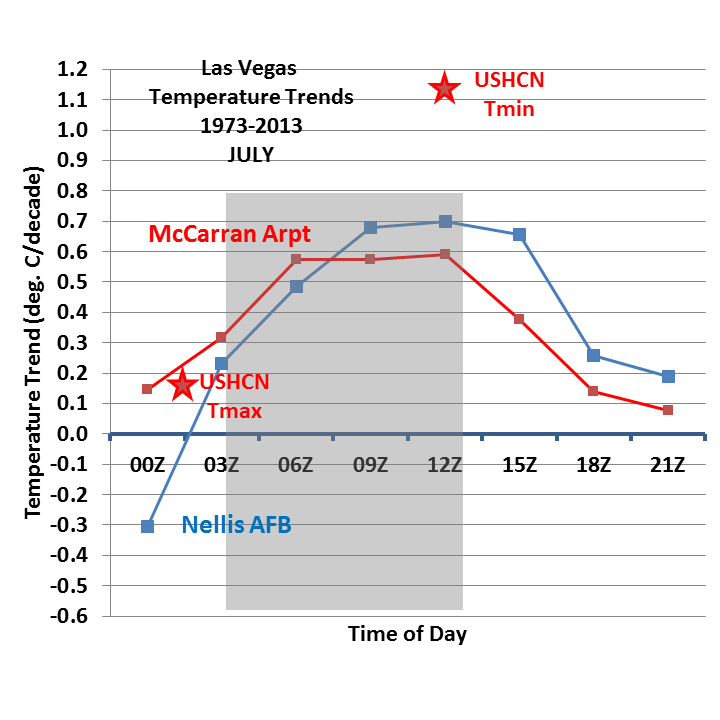
Fig. 2. As in Fig. 1, but for the month of July.

Fig. 2. As in Fig. 1, but for the month of July.

Las Vegas has seen dramatic growth over the time period represented above. The number of visitors has skyrocketed from 8 million in 1973 to about 40 million today, a factor of 5 increase. The population has increased by a factor of about 6 or 7.

All of this translates into more waste heat from air conditioning, plus more artificial surfaces which warm faster than natural surfaces. If you doubt this for even the natural desert surrounding Las Vegas, look at the Landsat IR thermal imager data in this report.

During the day, the extra heat can mix convectively through a pretty deep layer of the atmosphere, which limits the daytime warming. But at night, the nocturnal inversion traps heat, magnifying the UHI effect.

The bottom line is that the USHCN data still seems to contain significant UHI effects, which are inflating warming trends, possibly even in the daytime. So, at this point, I don’t think we know if there has been any “global warming” experienced in Las Vegas.

And when it comes to the UHI effect, I doubt that the old adage “what happens in Vegas stays in Vegas” applies.

Snow Piles Still in Michigan, June 16

Wednesday, June 18th, 2014

We visited Pictured Rocks National Lakeshore by boat on June 16, 2014, and there was still unmelted ice and snow piles in the shadows of the rock cliffs, just above the Lake Superior waterline.

This particular pile was about 30-40 feet long and looked to be about 6 feet thick:

Large pile of snow and ice, Pictured Rocks, Michigan, June 16, 2014.

Large pile of snow and ice, Pictured Rocks, Michigan, June 16, 2014.

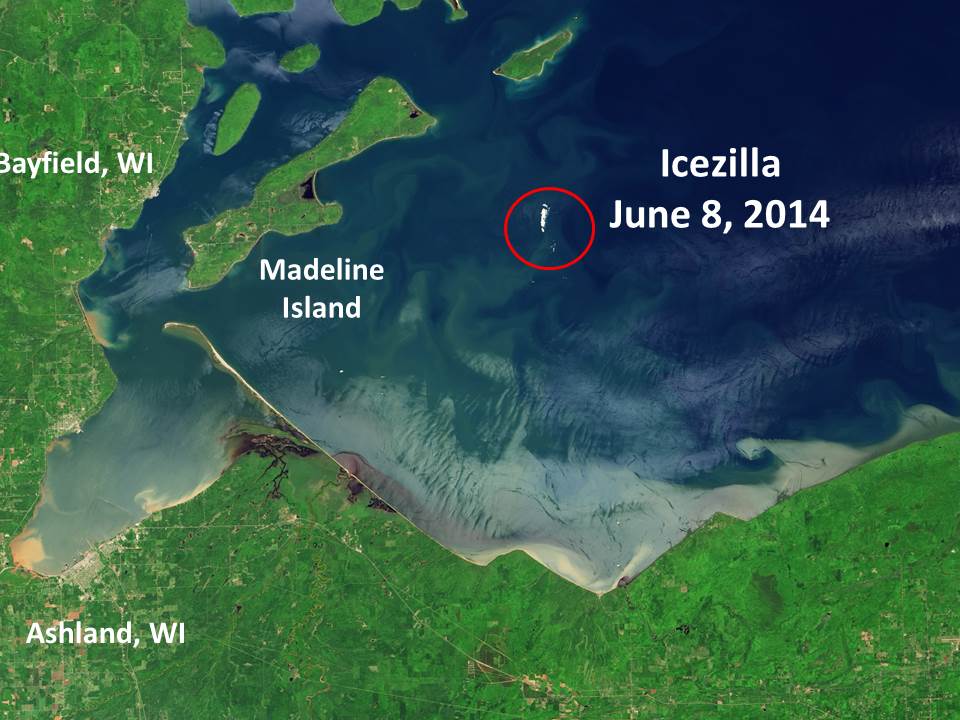
For those wondering about “Icezilla“, it appears from MODIS satellite imagery to have been beached by strong winds on the southeast shore of Michigan Island, in Michigan’s Apostle Islands in western Lake Superior.

Mile-long Icezilla Imaged by Landsat

Friday, June 13th, 2014

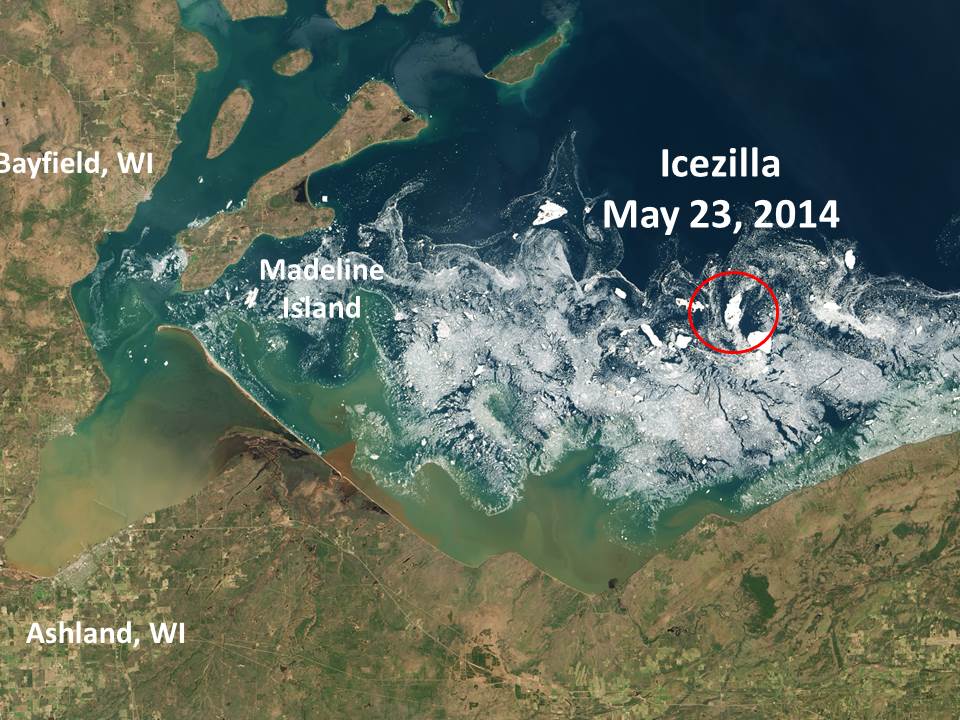
Yesterday, NASA released high-resolution satellite imagery from Landsat, showing the iceberg I’ve dubbed “Icezilla”.

I’ve back tracked through the daily MODIS imagery to find where it originated from, as shown in this Landsat image from May 23 (click for large version):
Icezilla-5-23-2014-Landsat

The latest Landsat image provided by NASA is from June 8, at which point the iceberg was about 1 mile long and about 800 ft. wide:
Icezilla-6-8-2014-Landsat

As I mentioned yesterday, this berg is so big that it was spotted from land, 20 miles to the south, on June 10. If it is sufficiently thick, Icezilla could last until July before it fully melts, since water temperatures in the vicinity appear to still be below 40 deg. F.

New IPCC Head Kim Jong-un to Punish Bad Climate Forecasts

Thursday, June 12th, 2014

Kim-Jung-Un
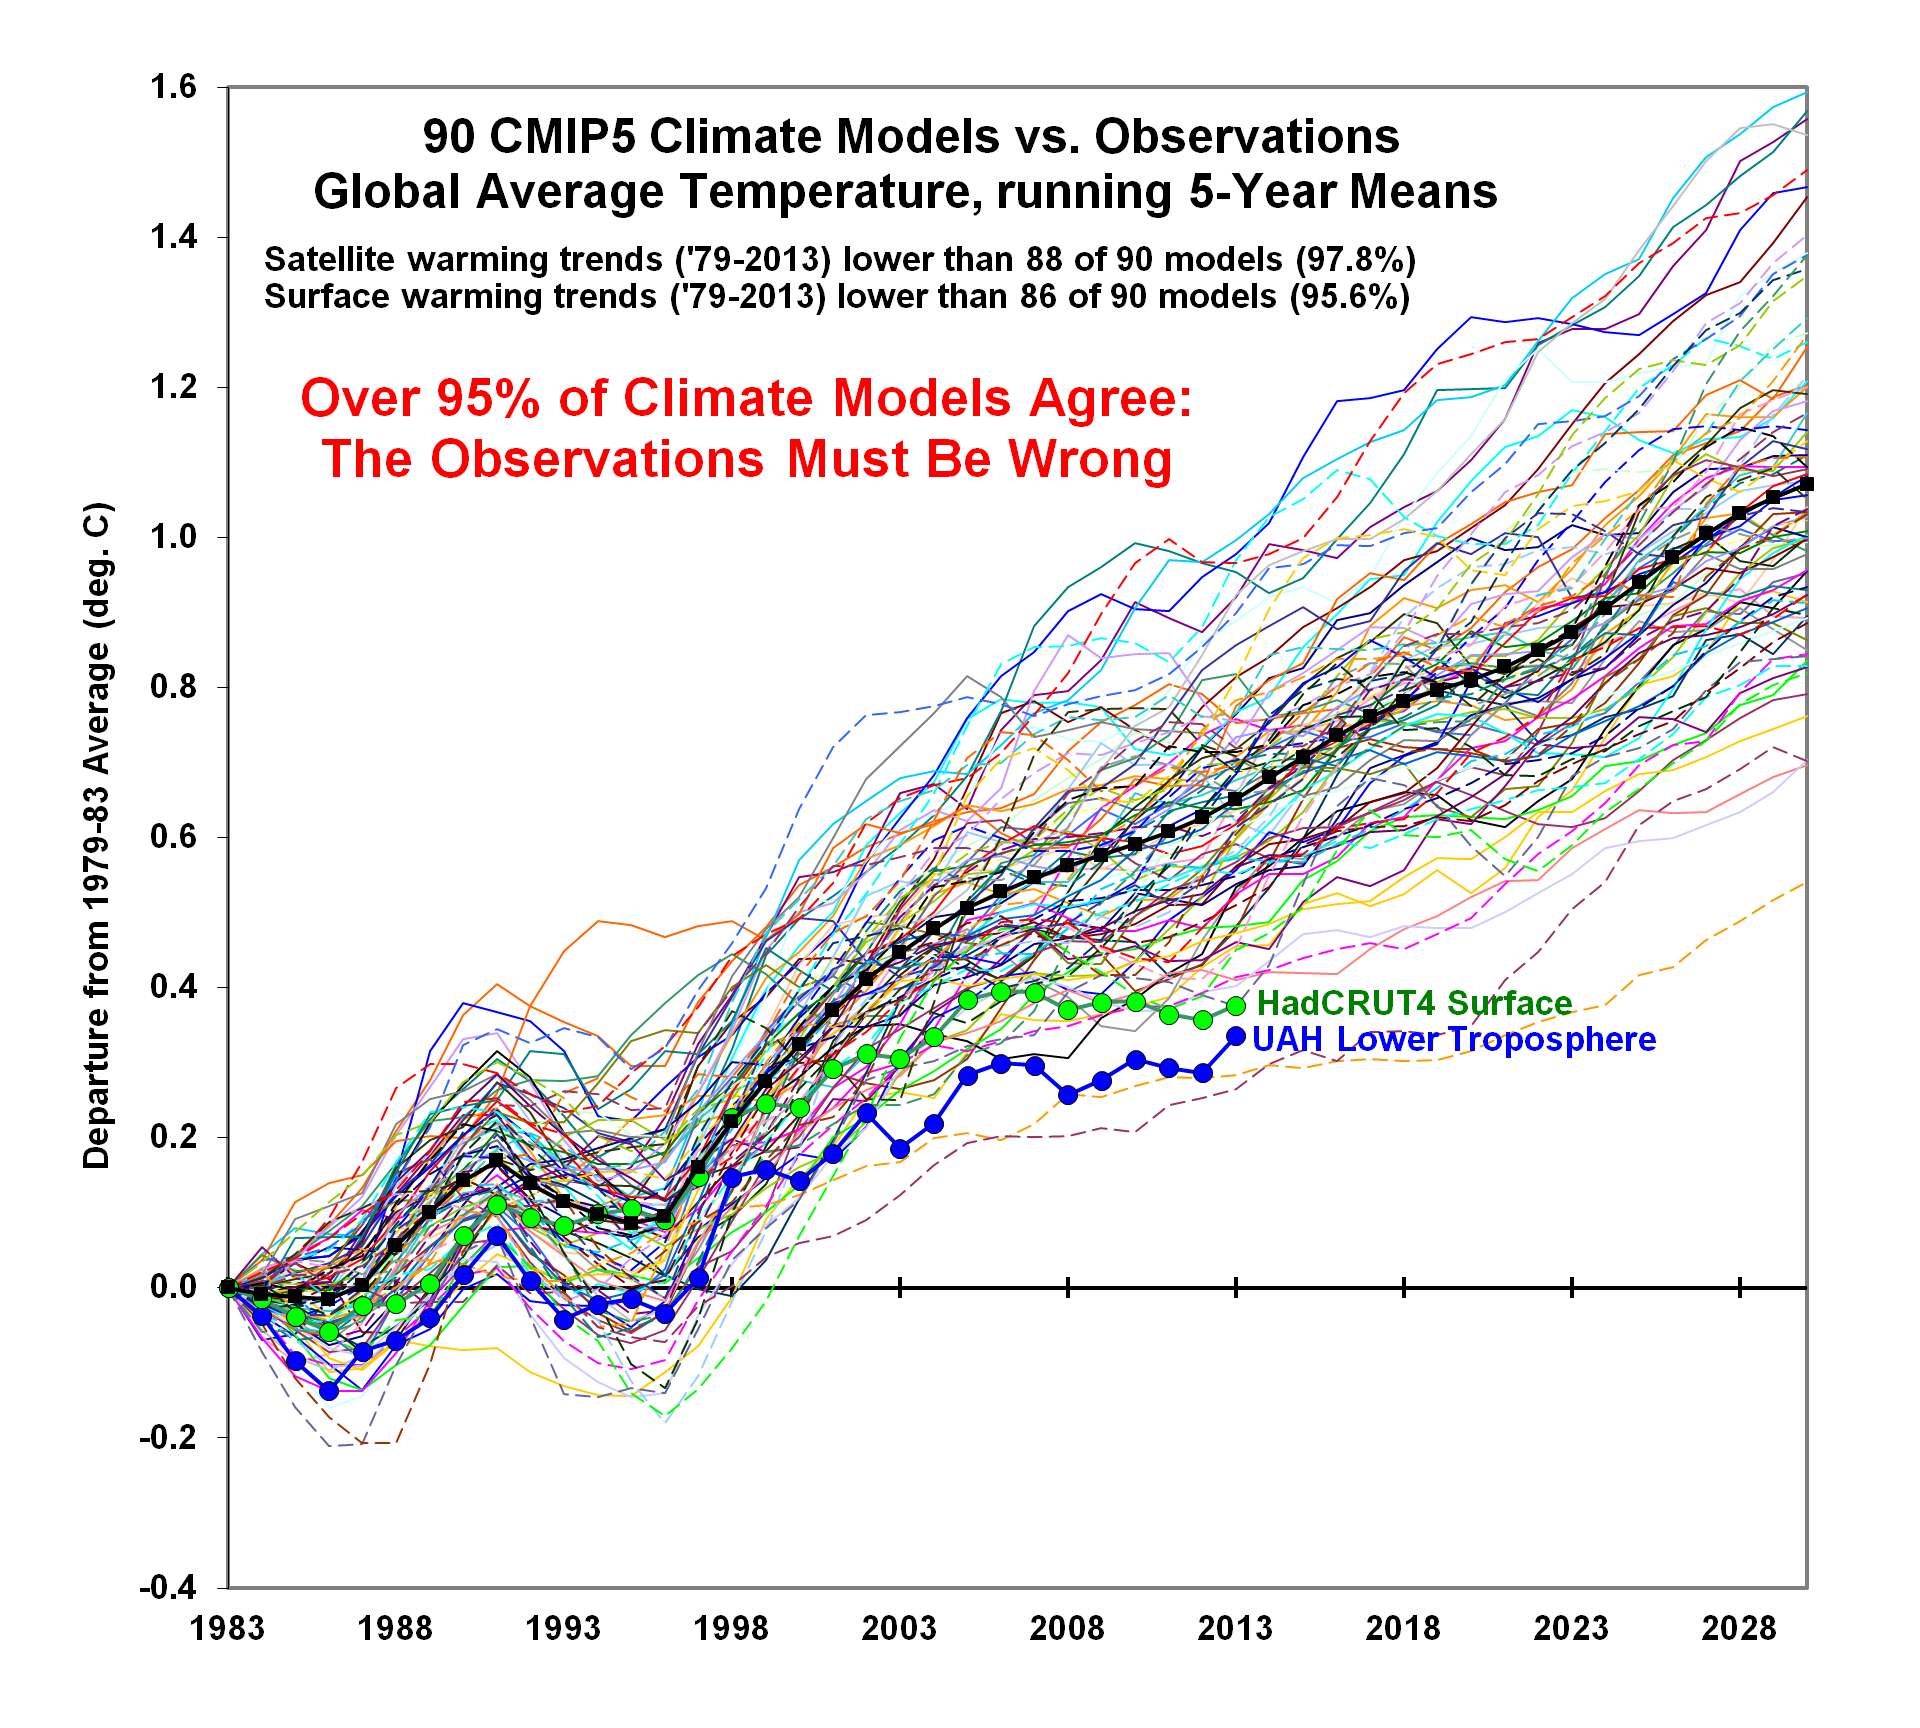
On the heels of today’s announcement that North Korea leader Kim Jong-un has warned his country’s meteorologists about their bad weather forecasts, Mr. Kim has been named the new head of the IPCC, where he will crack down on the bad climate forecasts being made by that organization.

I will direct all climate modeling groups to either start paying attention to the observations, or else“, said Kim Jong-un, a presumed reference to satellite, weather balloon, and surface temperature observations which all show the climate models relied upon by the IPCC are producing too much warming:
CMIP5-90-models-global-Tsfc-vs-obs-thru-2013

Mr. Kim also suggested that the rest of the world should follow his country’s lead on energy conservation, starting with a ban on all outdoor lighting.

Icezilla Spotted from Land, 20 Miles Away

Thursday, June 12th, 2014

In my continuing coverage of the last ice on Lake Superior (erroneously reported to have melted several days ago by the NWS in Duluth), iceberg “Icezilla” has been spotted from land 20 miles to the south.

As reported to me early this morning by Mark Vinson aboard the U.S. Geological Survey ship R/V Kiyi,

“On Tuesday (June 10), one of our employees was driving back to Ashland (WI) after getting off the ship in SSM (Sault Ste. Marie, MI). She told me she could see a large berg between Ironwood, MI and Ashland. There is a nice high spot near Saxon, WI that you can overlook the lake. She said it was a whopper and it would have had to have been for her to be able to see it from there as this spot is several miles from the lake.

This spot on highway US-2 would be 20 miles directly south of Icezilla.

Since no one seems to have a camera to capture direct evidence this mythical beast, I decided to commission an artist rendering based upon what little information we have:

Artist rendering of iceberg Icezilla, still on Lake Superior as of June 11, 2014

Artist rendering of iceberg “Icezilla”, still on Lake Superior as of June 11, 2014

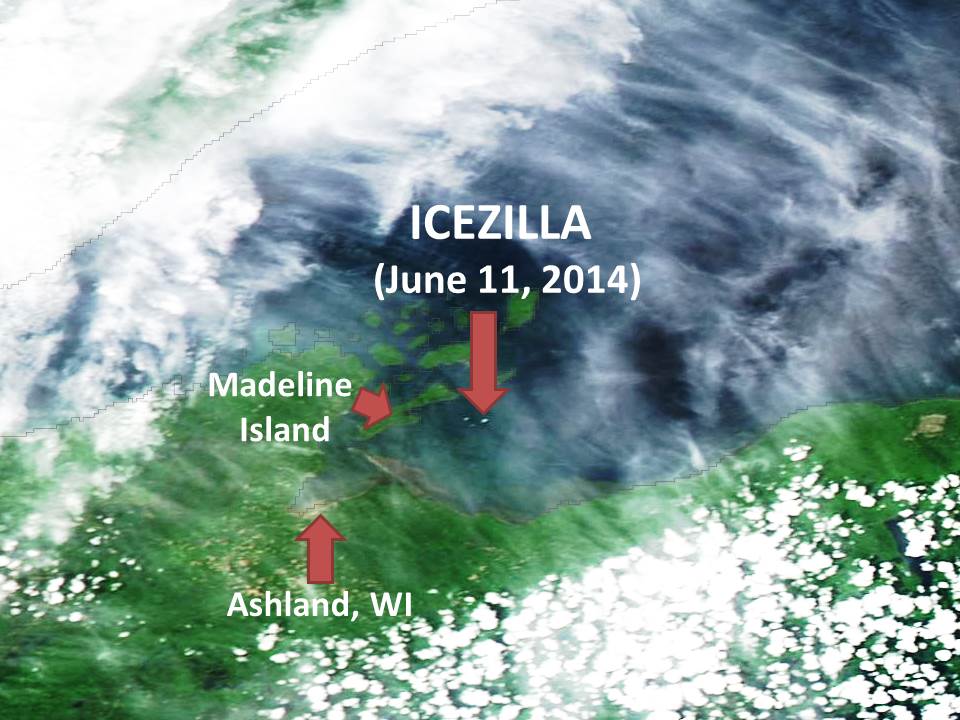
Compared to MODIS satellite imagery the day it was spotted from land (June 10), it looks like Icezilla yesterday (June 11) gave birth to Son of Icezilla and Daughter of Icezilla:

MODIS satellite imagery of iceberg Icezilla and its offspring.

MODIS satellite imagery of iceberg Icezilla and its offspring.

I’ll keep you posted on any further developments regarding the ice monster, which appears to still be several hundred feet across.

June 10 Update: Will Iceberg on Lake Superior Last till July?

Wednesday, June 11th, 2014

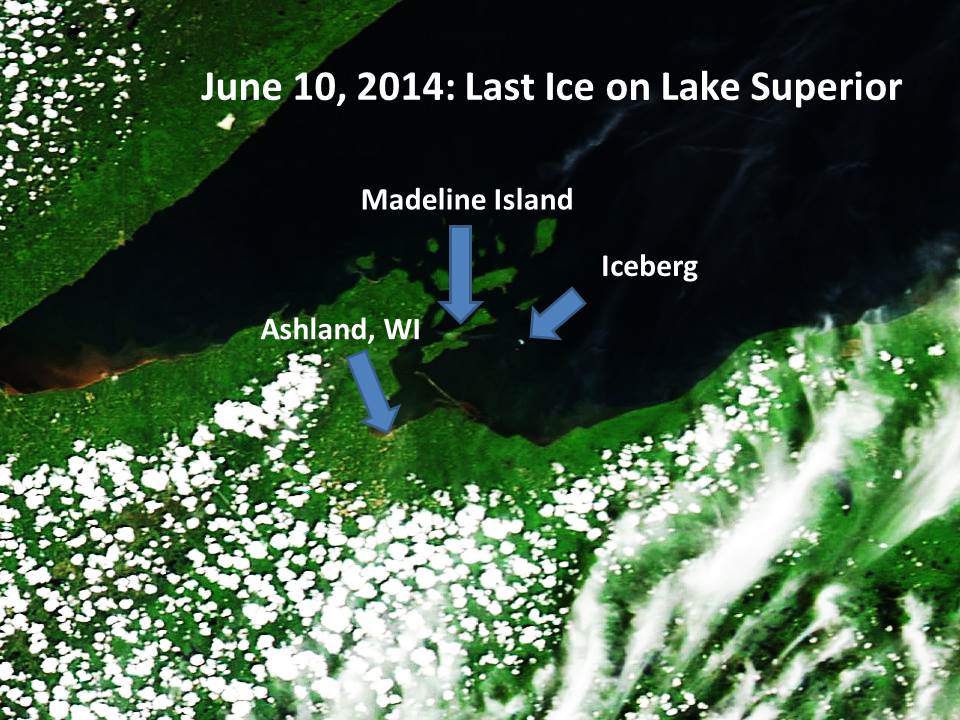
As I reported on June 4, and again on June 6, there remains a large iceberg northeast of Ashland, WI, which is slowly approaching Madeline Island.

Boatside pics of some of the smaller icebergs reached the popular press on June 7, as reported by Wisconsin DNR employee Amie Egstad:
lake-superior-icebergs-2

I’m still curious about what might be a much larger iceberg, though, which looks to be at least 1,000 ft. in diameter in the NASA Aqua satellite MODIS instrument imagery (it might be made made up of smaller pieces…you can’t tell from the satellite imagery, which has at best 750 ft resolution…click for the large version):
MODIS-last-ice-on-Superior-6-10-2014

I sent an e-mail to DNR employee Amie Egstad about this larger mass of ice…it sure would be nice if we got updates on this in the coming days. The iceberg she took pics of (above photo) is really thick, suggesting there might be “bigger” ice out there that will take some time to melt.

I’ve been getting periodic reports from Mark Vinson on R/V Kiyi, still on Superior, of nearshore water temperatures running around 37 deg. F. While it seems unthinkable, I suppose it is possible that thick icebergs in water that cold could last until July.

Brookings: Public Concern over Climate Still Bottom of the List

Wednesday, June 11th, 2014

Public opinion surveys are notoriously easy to manipulate. Depending on how you ask the survey question, you can get just about any results you want.

A recently publicized Washington Post – ABC News poll, timed to coincide with the recent announcement of the Obama EPA proposed power plant CO2 emissions regulations, found a majority of Americans supported CO2 restrictions on coal-fired power plants. But the way the question was asked minimized the supposed cost, and maximized the supposed benefit, of such restrictions on the American economy.

Quoting from the HuffPo article about the survey results:

Asked whether Washington should still go forward with limits if they “significantly lowered greenhouse gases but raised your monthly energy expenses by 20 dollars a month,” 63 percent of respondents say yes, including 51 percent of Republicans, 64 percent of independents and 71 percent of Democrats.

Hell, even *I* would probably support $20 more a month if it “significantly lowered greenhouse gases”, just to be on the safe side. But it’s NOT going to significantly lower greenhouse gases (on a global basis, which is what matters), nor is it going to cost only $20 a month.

The poll question was so poorly worded and misleading, I think the pollsters should be ashamed of themselves.

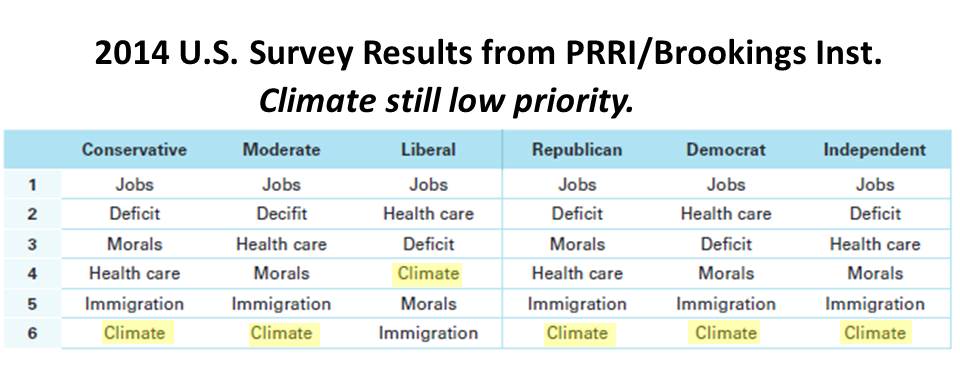
A more recent survey of American attitudes on immigration and other matters (including how the various news outlets rank for trustworthiness) was just announced yesterday by the Brookings Institution, and buried in it was the following chart that showed how Americans with different political leanings ranked various concerns. As is usually the case, “climate” comes in dead last with all groups except self-described “liberals”:
Brookings-survey-results-issues

Clearly, jobs and the deficit — basically, “the economy” — is the main concern that most Americans have. And the proposed EPA regulations will hurt far more people than they would help…especially the poor.

Generally speaking, the public has lost faith in scientists whose profession requires them to sound the alarm over global warming climate change climate disruption. Most Americans understand that forecasts of gloom and doom as predicted by “scientific experts” are not as reliable as predictions of, say, this afternoon’s weather.

In fact they have a history of almost zero reliability.

We can predict the time of sunrise in Podunk, Michigan on July 17, fifty years in advance. But not all scientific disciplines are created equally, climate prediction is still in its infancy, and fortunately the public understands that.