 A new paper in Nature: Scientific Reports by Santer et al entitled Tropospheric Warming Over the Past Two Decades begins with this:
After a recent Senate confirmation hearing, Scott Pruitt the new Administrator of the U.S. Environmental Protection Agency received a written question regarding observed warming estimates. In response, Mr. Pruitt claimed that over the past two decades satellite data indicates there has been a leveling off of warming. We test this claim here.
Now, exactly how does one scientifically test a claim of “leveling off of warming”?
First, the claim would have to have some unambiguous meaning which can be evaluated quantitatively. Does it mean that warming has decelerated in the last two decades, and is approaching zero? That would be my first interpretation of “leveling off”.
And by “two decades” did Pruitt mean exactly 20 years?
The wording is ambiguous. But the authors decided Pruitt meant “there has been zero warming” for exactly 20 years. They proceeded to evaluate this interpretation with a statistical analysis of the various satellite temperature datasets, as well as with climate models.
The result is a peer-reviewed study which took less than one month to sail through peer review.
Wow. If I only knew earlier that I could get peer-reviewed scientific papers by evaluating the silly climate claims made by politicians (Al Gore, Barack Obama, et al.) over the years.
Oh, that’s right. I’m on the wrong side of the issue. The reviewers would have said, “C’mon, that’s a politician generalizing. You can’t get a peer-reviewed scientific paper out of that!”
Why the Global Warming Pause (Hiatus, Leveling Off) is a Poor Metric
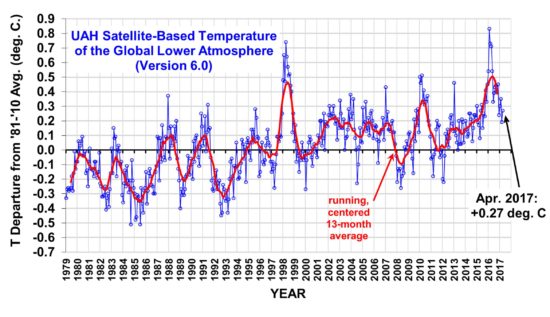
I’ve warned people not to place too much emphasis on the claim that there has been zero warming over the last x number of years.
First of all, when the next big warm El Nino occurs, the zero trend will end. And that’s exactly what happened, with the 2015-16 El Nino. A trend is very sensitive to what happens at the end of a time series, and a big (natural) warm blip from El Nino is just what the doctor ordered. No more zero trend. (Admittedly, I’m ignoring statistical uncertainty here..one might still argue there has not been any statistically significant warming in the last 20 years, depending on the error bars you assume.)
Now Santer et al. can get press saying, in effect, “See? Those silly global warming skeptics are wrong.” Of course, the authors know full well that the reason the pause/hiatus/leveling-off ended was due to a NATURAL event (El Nino).
You can’t build a case for human-caused warming by relying on natural warming! (But, they did anyway.)
So, they fault Pruitt on a technicality, straining a gnat while swallowing a camel.
This then distracts attention from the real issue: that the climate models on average produce about twice as much warming as has been observed over the last few decades.
The Santer paper also makes quite a bit out of the fact that warming exists in the satellite datasets at all, and that climate models do not produce that level of warming from their internal variability, suggesting an anthropogenic cause. Of course, they fail to mention that models are lousy at producing realistic multi-decadal time scale natural variability anyway, so this is hardly proof of an anthropogenic source of recent warming.
Nevertheless, as a “lukewarmer” I tend to believe about half of recent warming is indeed human-caused. There’s no way to prove it because there is no fingerprint of anthropogenic warming (warming from, say, a slight decrease in ocean mixing and overturning would look the same as human-caused warming, with greater warming over land than ocean, and over the Northern than Southern Hemisphere).
So, I consider the “no warmers” to be on shaky ground, both theoretically and observationally. But that doesn’t mean they are wrong…we just don’t know yet.
The Santer et al. paper is a good example of what often happens in political debate. Your opponent takes one ambiguous thing you said, interprets in a specific way, dissects it, destroys it, and in the process leaves the impression that you are an idiot who should not be listened to.
At the same time, it performs a very important function: distracting attention away from other, more important issues and lines of evidence — like the fact that observed warming has only been occurring at about half the rate climate models say should be occurring. And those model predictions are the basis for energy policy changes.
It’s sad to see how far peer-reviewed climate science has fallen.

 Home/Blog


