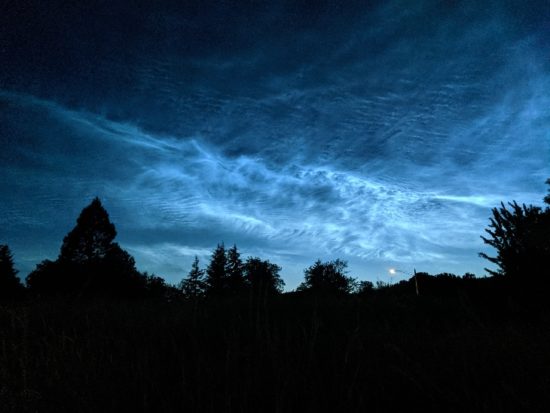
Noctilucent (night shining) clouds are being reported farther south than ever before, with reports from southern California, New Mexico, Oklahoma, and southern Ohio.

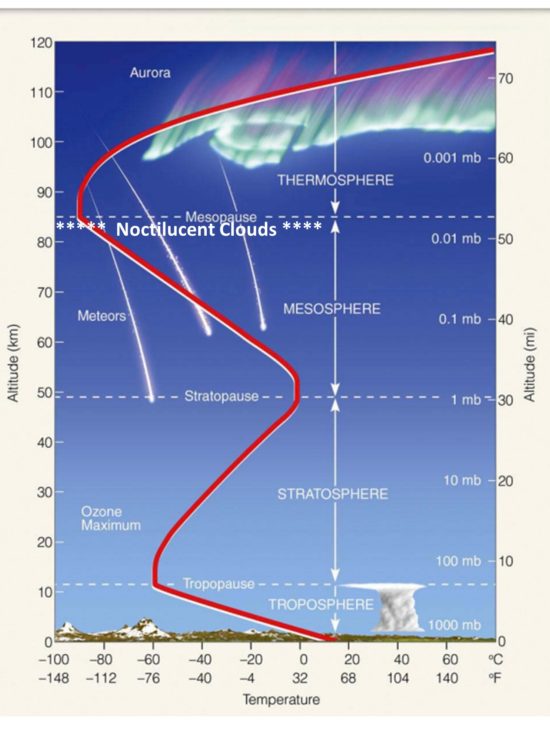
These NLCs form in the upper mesosphere at an altitude of about 85 km (around 50 miles), which is above 99.999% of the atmosphere. It is the same altitude where meteors and thunderstorm sprites occur, but somewhat below the altitude of the aurora.

They are visible about 1-2 hours after sunset or before sunrise, when other clouds are in darkness but these are still illuminated by the sun due to their high altitude. It is believed that water vapor from oxidation of methane condenses on meteor dust, leading to the ice cloud formation.
The conditions for NLC formation require extremely cold temperatures, as low as -150 deg. F. I’ve been looking for online sources of near real time satellite data which might be used to monitor them, but there isn’t much out there (more on that, below). The AIM instrument on the TIMED satellite provides daily images, but for some reason the clouds the satellite views seem to be only from the latitude of central Canada northward.
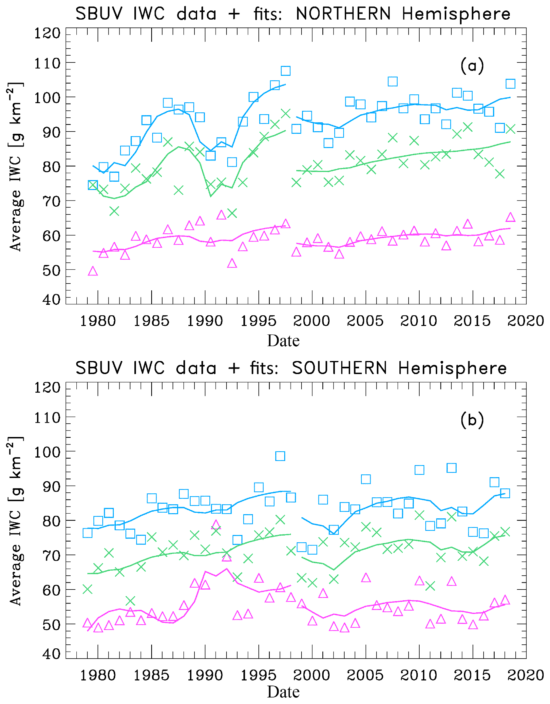
NLCs have been increasing in recent decades. They are always more prevalent during solar minimum conditions (which we are now experiencing), when there is less solar energy heating the extreme upper atmosphere. But there is also a long-term trend upward:

(a) SBUV merged seasonal average IWC (ice water content) values for three different latitude bands: 50N-64N (purple triangles), 64N-74N (green crosses) and 74N-82N (blue squares). The solid lines show multiple regression fits to the data for the periods 1979-1997 and 1998-2018. (b) SBUV merged seasonal average IWC values for 50S-64S, 64S-74S, and 74S-82S. The solid lines show fits for the periods 1979-1997 and 1998-2018. (source)
The long term increase could be the result of increasing CO2, which cools the upper atmosphere while it warms the lower atmosphere. Another possibility includes an increase in atmospheric methane, which gets oxidized into water vapor at high altitudes. Finally, some modelling suggests that climate warming should increase the Brewer-Dobson circulation, which cools the summer mesosphere (more on that, below).
Anecdotally, the most dramatic increase has been at mid-latitudes where no previous reports of NLC sightings exist. In the last couple days NLCs have been observed as far south as Joshua Tree, CA (34 deg. N) and Albuquerque, New Mexico (35 deg. N). There is no historical record of NLC sightings, anywhere, before 1880.
One of the interesting things about the mesosphere where NLCs form (and something which will mess with the heads of some here who like to argue with me) is that the summer hemisphere is colder, and the winter hemisphere warmer, in the mesosphere.
If only radiative heating by the sun (and cooling by greenhouse gases…anything that gains energy from the sun must have a way to lose that energy) were responsible for mesospheric temperatures, the opposite would be true, with the summer hemisphere being warmer, as it is in the troposphere and stratosphere.
The reason for the reversal is the Brewer-Dobson circulation, which causes upwelling (and thus adiabatic cooling) in the summer mesosphere. which That rising air forces subsidence (sinking air, and thus adiabatic warming) in the winter hemisphere.
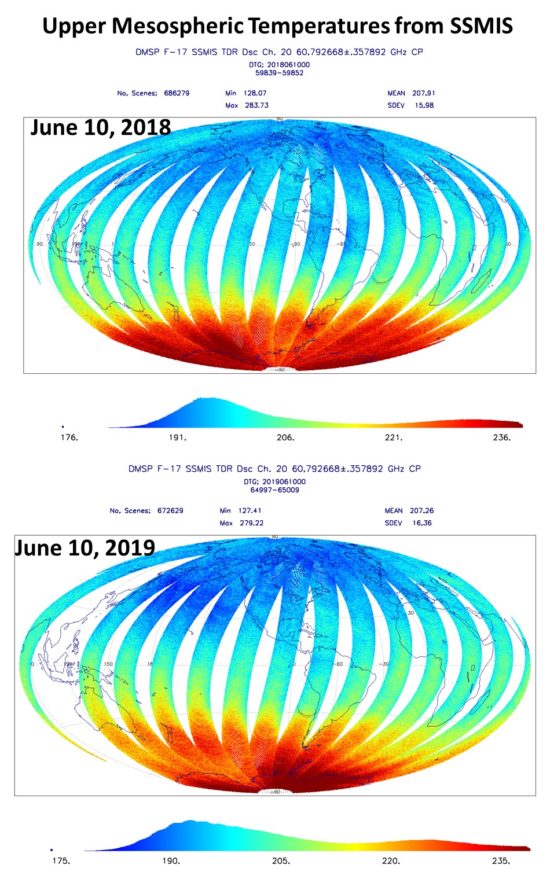
This hemispheric difference is clearly seen in upper mesospheric temperatures from channel 20 on the DMSP SSMIS instrument. These data are not widely available, and this pair of images, one year apart, was provided to me by Steve Swadley at Naval Research Laboratory – Monterey.

SSMIS 60 GHz imagery of upper mesospheric temperatures one year apart shows slightly cooler temperatures in 2019 than 2018, presumably leading to more frequent noctilucent cloud sightings.
The SSMIS imagery can’t be directly related to NLC sightings because it is a vertical average for a fairly deep layer in the upper mesosphere, while NLCs form in only the very coldest layer in the upper part of that deeper layer, at the “mesopause”. But I would wager they are correlated.
I think some clever manipulation of this SSMIS channel with the one below it could provide a useful monitoring tool for NLC formation. The SSMIS instruments have been flying since before the last solar minimum, so it would be interesting to see how much colder the current solar minimum is than the last in the mesosphere. I’d love to do this myself, but considerable time would be required for data downloading, reading, analyzing, and displaying the data, and I already have a day job.

 Home/Blog


