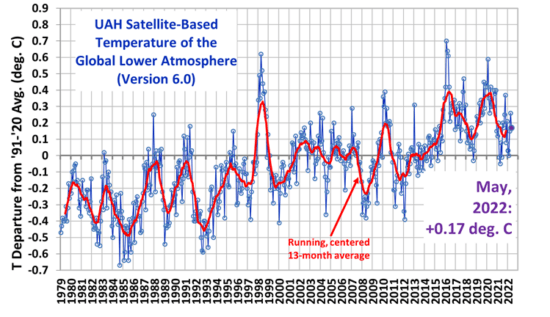
The Version 6.0 global average lower tropospheric temperature (LT) anomaly for May, 2022 was +0.17 deg. C, down from the April, 2022 value of +0.26 deg. C.
The linear warming trend since January, 1979 still stands at +0.13 C/decade (+0.12 C/decade over the global-averaged oceans, and +0.18 C/decade over global-averaged land).
Various regional LT departures from the 30-year (1991-2020) average for the last 17 months are:
YEAR MO GLOBE NHEM. SHEM. TROPIC USA48 ARCTIC AUST
2021 01 0.12 0.34 -0.09 -0.08 0.36 0.50 -0.52
2021 02 0.20 0.31 0.08 -0.14 -0.66 0.07 -0.27
2021 03 -0.01 0.12 -0.14 -0.29 0.59 -0.78 -0.79
2021 04 -0.05 0.05 -0.15 -0.28 -0.02 0.02 0.29
2021 05 0.08 0.14 0.03 0.06 -0.41 -0.04 0.02
2021 06 -0.01 0.30 -0.32 -0.14 1.44 0.63 -0.76
2021 07 0.20 0.33 0.07 0.13 0.58 0.43 0.80
2021 08 0.17 0.26 0.08 0.07 0.32 0.83 -0.02
2021 09 0.25 0.18 0.33 0.09 0.67 0.02 0.37
2021 10 0.37 0.46 0.27 0.33 0.84 0.63 0.06
2021 11 0.08 0.11 0.06 0.14 0.50 -0.43 -0.29
2021 12 0.21 0.27 0.15 0.03 1.63 0.01 -0.06
2022 01 0.03 0.06 0.00 -0.24 -0.13 0.68 0.09
2022 02 -0.00 0.01 -0.02 -0.24 -0.05 -0.31 -0.50
2022 03 0.15 0.27 0.02 -0.08 0.22 0.74 0.02
2022 04 0.26 0.35 0.18 -0.04 -0.26 0.45 0.60
2022 05 0.17 0.24 0.10 0.01 0.59 0.22 0.19
The full UAH Global Temperature Report, along with the LT global gridpoint anomaly image for May, 2022 should be available within the next several days here.
The global and regional monthly anomalies for the various atmospheric layers we monitor should be available in the next few days at the following locations:
Lower Troposphere: http://vortex.nsstc.uah.edu/data/msu/v6.0/tlt/uahncdc_lt_6.0.txt
Mid-Troposphere: http://vortex.nsstc.uah.edu/data/msu/v6.0/tmt/uahncdc_mt_6.0.txt
Tropopause: http://vortex.nsstc.uah.edu/data/msu/v6.0/ttp/uahncdc_tp_6.0.txt
Lower Stratosphere: http://vortex.nsstc.uah.edu/data/msu/v6.0/tls/uahncdc_ls_6.0.txt
Ever since barry’s meltdown started, he’s been on a mission to revive old nonsense. He’s trying to somehow save both the “plates” issue and the “Moon” issue. He’s joined on the plates issue by Willard Jr (aka E. Swanson), and on the Moon issue by RLH, which means he gets no help….
DREMT has handily debunked their nonsense, again. Here, he destroys the plates, in one short paragraph:
“barry, this has all been discussed many times before. It was agreed by both sides of the argument that with the plates pushed together, they would both be 244 K. The plates are assumed to be perfect conductors, you see. Those on your side of the argument think that when separated, by even a millimeter, the BP increases in temperature to 262 K, and the GP decreases in temperature to 220 K. So, this is clearly the warm object gaining temperature at the expense of the cooler object. Which you agreed is impossible.”
Yes indeed, that is impossible. But, that’s what the cult must believe. It’s like their belief that ice can boil water, which barry tries to deny, as he fervently clings to that belief.
They don’t understand any of this, and they can’t learn.
I told you I could boil water with ice, you never listen, you don’t understand that experiment trumps all your hypotheses.
You know when you separate the plates, they are no longer perfect conductors, so you have to recalculate the temperatures.
You know, do the hard work with the proper equations.
How’s that physics minor going?
barry agreed that a warm object could not gain temperature at the expense of a cooler object. When I pointed out that was exactly what happens in the Green Plate Effect, he just sort of wriggled his way out of it. That’s all you people do.
There was a long, largely pointless back and forth about the subject last month, eventually resulting in barry bringing up the radiative heat transfer equation. When I pointed out that even the radiative heat transfer equation and view factors debunk the GPE, he just sort of wriggled his way out of it, once again.
I would continue to try and get through to barry, but what’s the point? He doesn’t listen, can’t learn, and only wants to preserve his current beliefs.
Besides twisting the details he offers, Kiddo omits a few interesting one, e.g.
1. How he tried to put the idea that heat cannot be transferred into space to play a silly you-and-him fight game.
2. How he tried to overcome his misunderstanding of the Green Plate experiment with a riddle involving we box the Sun.
3. That he presents the Scale Factor with a decimal after 1, as if there were values beyond 1.
4. That his whole stance is refuted by a simple K12 entry on space radiation.
Sky Dragon Cranks have little else.
1) When someone from Team GPE agrees with me on something, and then another member of Team GPE disagrees with me on the same topic, that means they disagree with the original Team GPE member as well as me. Of course I am going to point that out.
2) I have no misunderstanding of the Green Plate Effect. Thanks for mentioning the Sun Shell, though, it directly relates to the GPE. If you were able to surround the Sun with a thin shell made of some highly conductive material, with a tiny vacuum gap between the Sun and the shell, according to the GPE "logic", the shell would only warm until it was emitting out to space half the amount of energy, in W/m^2, that the Sun was originally emitting to space. The shell has two sides, an inside, and an outside, you see.
Whereas, in reality, the Sun would just warm the shell until it was emitting to space almost the same amount of energy (in W/m^2) as the Sun was emitting to space originally. There would be slightly less energy emitted (in W/m^2) because the surface area of the shell is larger than the surface area of the Sun.
3) I was just following Swanson’s lead on that. Funny how you didn’t mention any problem with it to him. Probably because it’s just unbelievable pedantry, which you wouldn’t bother someone on your own "side" with.
4) Nonsense. There’s much more to the anti-GPE position than just that which relates to "space radiation". You just don’t understand any of it, so you clutch at straws.
1.1 There is no Team GPE, but physicists.
1.2 There is no real Team Sky Dragon, it is a handful of cranks.
2.1 Kiddo still misunderstands Eli’s thought experiment.
2.2 It is so easy to understand even I do.
2.3 He has no excuse.
2.4 His deflection is overly silly.
3.1 Kiddo misses the point of the “1.0” point.
3.2 Whereas ES often corrects himself and stays humble, Kiddo talks as if he was our in-house physicist.
3.3 At best he could be our DJ.
4.1 Here is where Kiddo is once again wrong:
https://theconversation.com/curious-kids-how-does-heat-travel-through-space-if-space-is-a-vacuum-111889
4.2 Whereof Kiddo cannot speak, thereof he must be silent.
4.3 But he won’t, for he must continue to troll.
4.4 Loss aversion is too strong for him.
4.5 He is on his last mile.
4.6 Let us thread lightly.
Nothing of any substance, from Willard. As per usual.
Once again proven wrong, Kiddo soldiers on.
“Proven wrong”
☺️
🐉
Willard, please stop trolling.
“barry agreed that a warm object could not gain temperature at the expense of a cooler object.”
Yes, that is the Lord Kelvin statement of the Second Law.
“When I pointed out that was exactly what happens in the Green Plate Effect, he just sort of wriggled his way out of it. Thats all you people do.”
Actually, you did no such thing.
The warmer object gains temperature at the expense of the heat source, typically the Sun.
The green plate inhibits the heat loss of the blue plate.
The green plate effect is real, confirmed by experimentation on my stove, where I can also cause water to boil with ice.
Plates together, 244 K…244 K. Plates separated, 262 K…220 K.
That is a warm object gaining temperature at the expense of a cooler object.
GPE debunked.
No, that’s insulation causing a warm object to become warmer when heated by a heat source.
Nothing debunked yet.
Still waiting.
A perfectly-conducting blackbody plate is as far from being an insulator as it is physically possible for an object to be.
Plates together, 244 K…244 K. Plates separated 262 K…220 K.
That is a warm object gaining temperature at the expense of a cooler object.
GPE debunked.
“Plates together, 244 K244 K. Plates separated 262 K220 K.”
Since that is what actually happens, how does that debunk the GPE?
“A perfectly-conducting blackbody plate is as far from being an insulator as it is physically possible for an object to be”
Ah, so the heat shield on your exhaust manifold does not insulate your tennis shoes from the heat of the exhaust.
You have some explaining to do, if you expect anyone to consider that bovine excrement.
I didn’t realize the heat shield on my exhaust manifold was a perfectly-conducting blackbody plate.
Plates together, 244 K…244 K. Plates separated 262 K…220 K.
That is a warm object gaining temperature at the expense of a cooler object.
GPE debunked.
“I didnt realize the heat shield on my exhaust manifold was a perfectly-conducting blackbody plate.”
Perfect, no, but pretty high emissivity.
Still keeps your sneakers from melting, by radiating some of the energy back to the exhaust manifold, just like the green plate effect does.
A combination of high thermal resistance and high emissivity…
The GPE is a cooling effect now?
Plates together, 244 K…244 K. Plates separated 262 K…220 K.
That is a warm object gaining temperature at the expense of a cooler object.
GPE debunked.
DREMT
Your logic is flawed so you form an incorrect conclusion. You assume incorrectly that the Green plate is giving more of its energy to the blue plate and cooling and ending warming the blue plate at its own expense. Not so.
You can use some logic to see the flaw in your thought formation. If the two plates together reach 244 K you can also introduce insulation between the two. The effect is to make the blue plate increase in temperature since it is receiving continuous external energy and the loss to the green plate has been reduced by insulation. Now the green plate also cools because it has less incoming energy from the blue plate yet continues to radiate fully from the opposite side. Now the insulation between them caused the blue plate to increase in temperature and the green plate to decrease. Now for some reason you formed an incorrect conclusion that this means the green plate is losing energy to the blue plate.
You can’t reason through the whole concept. The blue plate has a continuous supply of energy entering into it. It will have no fixed steady state temperature. It all depends upon its conditions. If it is highly insulated it will be warmer than if it has no insulation. I think you need to stop a minute and think. You are very wrong in your thoughts and until you think things through you will not be able to correct your errors.
“If the two plates together reach 244 K you can also introduce insulation between the two.”
Yes, you could introduce insulation between the two, Norman. However, that’s not what happens. All that happens is that the plates are separated.
Plates together, 244 K…244 K. Plates separated, 262 K…220 K.
That is a warm object gaining temperature at the expense of a cooler object.
GPE debunked.
Now Norman is trying to pervert his cult’s bogus “plates”.
He’s way behind: his bogus “real 255 K surface”, his false belief that two 315 /m^2 fluxes can raise a surface to 325K, and his incompetence of orbital motion — the list goes on and on.
He’s got a lot to pervert.
When you separate the plates you are adding insulation between the two plates.
You know how a thermos bottle works?
A vacuum ain’t “insulation” to radiative flux, braindead bob.
You don’t understand any of this.
You should have a word with Kiddo, Pup –
https://www.drroyspencer.com/2022/05/uah-global-temperature-update-for-april-2022-0-26-deg-c/#comment-1307917
He’s breaking ranks!
Please do not let your trolling turn into another silly semantic argument!
Willard is confused again.
“A vacuum ain’t “insulation” to radiative flux…”
I agree completely.
That 👏 is 👏 not 👏 to 👏 say 👏 that 👏 objects 👏 without 👏 a heat 👏 source, 👏 in 👏 deep 👏 space, 👏 do 👏 not 👏 cool.
So much double negatives it almost means something.
Clint R
The mindless insulting bot to get some knee-jerk reactions strikes again with more stupid information. The endless amount of stupid posts from this bot is amazing.
You can’t understand you remove the heat transfer mechanism of conduction when you separate plates in a vacuum. That is too hard for you to understand.
Yes radiant energy transfers in a vacuum but when you separate the two plates you double the surface area so the green plate has twice the emitting surface but only one receiving surface. When in contact it only had the one radiant surface loss, not it has two sides. Not that your bot brain can understand any of this.
Keep up the insults it is what you are programmed to do. Science and rational thought are not in your program. The people who designed you have you stupid, arrogant, rude and insulting. They had no desire to add intelligence or logic to your program. Sorry bot, you can only do what you do, nothing more is possible.
Norman moves away from his “insulation” argument and instead tries to suggest that the mysterious warming of the BP has something to do with radiative losses from the GP. They cannot keep their stories straight.
Plates together, 244 K…244 K. Plates separated 262 K…220 K.
That is a warm object gaining temperature at the expense of a cooler object.
GPE debunked.
Kiddo soldiers on by playing The Game again.
Sorry Norman, but that’s not how it works.
The plates are separated by such a small distance that all of the blue plate emission is absorbed by the green plate, i.e., there are no losses from BP’s one side. So the green plate still receives what it had been receiving when fully in contact with the blue plate. Green plate’s emission back to the blue plate becomes trapped in a “standing wave” because the blue plate is the same/higher temperature.
You don’t understand radiative physics.
Believing that the slight physical separation would cause such extremes in temperature means that you do NOT understand entropy. Before separation, the plates have a specific entropy. After separation, with no energy increase, the system would have the same entropy. But, your false “solution” has created a 42K temperature difference! You have reduced entropy with no energy increase. You’ve violated 2LoT!
You don’t understand thermodynamics.
You don’t understand any of this, and you can’t learn. You’re a braindead cult idiot. It’s frustrating for you, so you have to insult, falsely accuse, and make things up.
Speaking of making things up, where’s your technical reference source that Earth has a “real 255 K surface”? Where’s your source that two 315 W/m^2 fluxes can heat a surface to 325 K?
Willard chimes in with another worthless contribution, as he feels compelled to.
Everyone loves an another-worthless-contribution-er.
…as he feels compelled to.
Thank you for your concerns, Kiddo.
he feels compelled to.
Clint R
I understand the real physics. I am hoping one day you might at least try to understand it.
When the green plate is moved it now has doubled its emitting surface. Previously when joined it had only one emitting surface (away from the blue plate) like wise the blue plate only had one emitting surface toward the energy source.
When you move the plates a tiny distance in a vacuum the conduction heat transfer is done, no longer applies.
The green plate doubled its emission surface but is still receiving the same input energy from the blue plate so it will cool. No violation of any known physics laws. I do not know if you understand the emitting area has doubled. If you can grasp that reality the rest will be possible for you to understand.
So the green plate cools as it emits twice the energy as it had previously when the plates were together.
The blue plate increases in temperature because it had been losing energy through conduction to the green plate, that has stopped and now the energy it is losing from its emission surface on the side facing the green plate is decreased because as it emits to the green plate it at the same time gains return energy from the green plate and its temperature rises as it is now losing less heat then it did when it conducted the heat to the green plate. Not so hard to understand. Open your mind, think about it and you will understand what physics has been saying. Keep a closed mind and insult intelligent people, the choice is yours.
Norman says:
The blue plate increases in temperature because it had been losing energy through conduction to the green plate, that has stopped and now the energy it is losing from its emission surface on the side facing the green plate is decreased because as it emits to the green plate it at the same time gains return energy from the green plate and its temperature rises as it is now losing less heat then it did when it conducted the heat to the green plate. Not so hard to understand. Open your mind, think about it and you will understand what physics has been saying. Keep a closed mind and insult intelligent people, the choice is yours.
————————–
I don’t object to what you are saying but where is your proof that the blue plate got warmer than the source? the 290K? The description I read in the Eli experiment is that it started out at 244k and warmed to 262K in a radiation field that can produce 290k. Seems like you are spinning your wheels at a high RPM in the mud and just digging yourself in deeper.
Do you think that Nate is your friend and he should have pointed that out to you?
Bill Hunter
Thanks for the reply but I am not sure of your point. I did not say the blue plate would exceed the temperature of the source. What wheels am I spinning into the mud?
I hope you can elaborate and indicate what you perceive I got wrong. Thanks.
Here’s where you went wrong, Norman:
Plates together, 244 K…244 K. Plates separated 262 K…220 K.
That is a warm object gaining temperature at the expense of a cooler object.
GPE debunked.
Thanks DREMT: when one is trying to keep an eye on the ball its hard to also keep an eye on all 3 shells.
Yep two big clues: the blue plate is not more than the equilibrium temperature and 3rd plate didn’t get colder. Killing two birds with one stone! Gotta love it! I guess green plate experiments are an acquired taste! Thought experiments can be like dreams where the impossible happens.
Clint R,
Since we are having so much fun, how about you try an experiment at home?
So we can compare conduction heat transfer to radiant heat transfer.
Using an electric stove, see how long you can hold your hand down on the heating element, and compare it to how long you can hold your hand one centimeter above the burner.
That’s why this is so much fun.
You guys haven’t a lick of common sense.
DREMT
No you did not debunk anything. You still don’t understand, you need to read and think about what is going on.
The blue plate is not getting hotter at the expense of the green plate.
The Blue plate is conducting energy to the green plate. When separated even by a small amount in vacuum conditions that conduction transfer is halted. So you have eliminated on heat transfer process completely. The only way to lose energy for the blue plate is via radiant means. The green plate has doubled its emission surface so it is still receiving the same quantity of energy from the blue plate as it did with conduction (now radiant energy) so it will cool as it is losing energy twice as fast as before. But on the side facing the blue plate it is returning some energy to the blue plate via radiant energy. The blue plate will now lose less heat than it did by conduction and warm up with the continuous input energy.
I really am stunned you can’t seem to follow simple logic. I still don’t know what Bill Hunter complaint is about.
Yes Bob thats a great demonstration of why the greenhouse gas effect doesn’t work. Radiation sends it out at the speed of light and it still goes through glass and air molecules a lot faster than fat through a goose.
The reduction in radiation you see in plates is due to the creation of dead air spaces. Open holes in them to let the air freely mix and you lose the insulation value of them even if the gas in the air is a opaque to IR.
Here is proof of that. https://www.scirp.org/pdf/acs_2020041718295959.pdf
There is nothing you have said that I do not understand, Norman…I just disagree with you. Clint R already elaborated on the reasons you are wrong, and you had nothing to say except to repeat yourself. I expect you will repeat yourself again. The Green Plate Effect is debunked…has been for years. Frankly I am bored of talking about it.
You’re welcome, Bill.
DREMT
No you do not understand what I wrote at all. You have debunked nothing. You should try to think.
Your false approach is just to keep persisting with wrong notions (like your total ignorance on the Moon rotation). Here you show a similar pattern of ignorance. You act like you understand what I wrote but you really don’t then you make a false claim and declare a false notion of victory. You are still wrong and such declarations are most meaningless.
OK, Norman.
Bill,
Yes, if you change the experiment you get different results.
Man are you a clever boy.
Still no refutation of the greenhouse effect nor the green plate effect.
The GPE’s debunked.
“Plates together, 244 K244 K. Plates separated, 262 K220 K.
That is a warm object gaining temperature at the expense of a cooler object.
GPE debunked.’
Again its the thoroughly moronic argument by incredulity.
I’m incredulous that anyone in their right mind would think metal plates separated by a vacuum gap would be just as good at transferring heat as metal plates in contact!
Apparently they recall burning themselves by NOT touching the hot pan as children.
Im also incredulous that anyone in their right mind would argue that objects in the shade get just as hot as objects in direct sun.
Im mainly incredulous that anyone would think they can solve a heat transfer problem without using any real science.
#2
The GPE’s debunked.
Bill gets it. DREMT still doesnt. Oh well.
#3
The GPE’s debunked.
DREMT says:
”Plates together, 244K and 244K. Plates separated, 262K and 220K.”
Nate says:
Im also incredulous that anyone in their right mind would argue that objects in the shade get just as hot as objects in direct sun.
Im mainly incredulous that anyone would think they can solve a heat transfer problem without using any real science.
———————–
Nate did you even bother to read what DREMT actually said.
The blue plate moves up to 262k and the greenplate drops to 220K. You are agreeing with DREMT and you are so confused you don’t know you are.
The reason is the dead air space between the two. That dead air space, in this case a vacuum, creates an insulation because it restricts diffusion and convection. So the blue plate loses less energy and the green plate is getting less energy. . . .it is in the shade of the blue plate that has a steady stream of watts coming in the back of the plate with a VF=1.0.
You are agreeing with us in every respect yet you are saying:
”Im mainly incredulous that anyone would think they can solve a heat transfer problem without using any real science.”
Near perfect insulation say U=.001 (R=1000) would be required to force the blue plate to 290K so that you could not detect any loss of heat with a common thermometer.
The Engineering toolbox radiation transfer chart figures are for radiation directed at surfaces that have no loss of heat.
The engineer then needs to calculate the heat loss through his walls to find out the rate of heat loss through the wall and respond to that by installing a heater of sufficient size that will both obtain the correct temperature and supply the heat loss.
This is super basic stuff and doesn’t even require a college education to get right. There are many thousands of heating and air guys without degrees or college educations that know how to install a properly sized heating or air conditioning system.
“Nate did you even bother to read what DREMT actually said.
The blue plate moves up to 262k and the greenplate drops to 220K. You are agreeing with DREMT and you are so confused you dont know you are.”
Bill, you are the one who is extremely confused about what DREMT thinks. That is not it.
But, again, thanks for agreeing with the sane people that the BLUE plate warms and the GREEN plate cools.
No, Bill…I think you may have got a little confused with what I was saying.
Plates together, 244 K…244 K. Plates separated, 262 K…220 K.
That is a warm object gaining temperature at the expense of a cooler object. That can’t happen.
GPE debunked.
The correct solution is:
Plates together, 244 K…244 K. Plates separated, 244 K…244 K.
"That dead air space, in this case a vacuum, creates an insulation because it restricts diffusion and convection"
The GPE thought experiment is conducted entirely in a vacuum, Bill. So there is no convection to be restricted.
“Plates together, 244 K…244 K.”
… is only one plate. The sun warms the plate to equilibrium with deep space, as the plate warms it radiates until the radiated energy matches the energy being absorbed from the sun.
“Plates separated, 262 K…220 K.”
… is two plates. The sun warms the BP to 262K at equilibrium using 1LOT. Introduction of the second plate raised the equilibrium temperature of the first plate by 18 K and thus increases the entropy of the universe as that plate radiates to deep space. The GPE. As supported by experiment.
DREMT hasn’t been able to correctly understand this simple 1LOT example for 4.5 years now. And counting.
No, Ball4, I understand it completely. Always have. The way E-Lie and the gang see the GPE is painfully simple and straightforward to understand. I just disagree with them, and have explained why at extraordinary length.
Sure, DREMT is free to just disagree with experiment, 1LOT, and 2LOT and incorrectly explain why repeatedly especially on a climate sophistry blog. This behavior generates much humor & supported this blog until it went free of advertising.
Cult Leader grammie pup continues to display his ignorance of the GPE:
Try thinking of of the situation this way. Start by using 1.0m^2 plates. The BP receives 400 watts from the Sun. Without the GP in position, it radiates 200 watts from each side, or 200 w/m^2, so it’s S-B temperature would be 244 K. Add the GP and now the 200 watts from one side of the BP is intercepted by the GP and the GP starts to radiate from 2 sides at 100 w/m^2.
The GP’s S-B temperature can never be 244 K, since it hasn’t enough energy input to do so. grammie pup has never presented an explanation using physics that would prove the GP’s temperature would rise to 244 K, endlessly repeating the same BS as if that would make it so.
Swanson, again, there’s nothing you need to explain. I understand completely why you think of it the way you do. You could just scroll up to Clint R’s 8:57 AM comment if you wanted to understand a bit more about why you’re wrong. Or read through the comments under last month’s temperature update. I certainly can’t be bothered to go through it all again.
The GPE’s debunked.
… only if the 1LOT, 2LOT, and related experiment are debunked.
The “plates” nonsense is completely debunked, but you can’t explain physics to idiots.
The green plate can’t warm the blue plate. It’s the same violation of physics as ice cubes boiling water, or photons from “cold” can warm “hot”, or CO2 heating Earth’s surface.
The cult idiots that keep this nonsense going can’t find anything to support it outside of their cult teachings. For example, where’s the credible source that two 315 W/m^2 fluxes can heat a surface to 325K?
There is none….
None? Wrong Clint. There are 1LOT, 2LOT, and related experiment in support. That’s all that is needed.
Clint R and DREMT sure are humorous in comments though.
I love it when The Team starts to pile on…
…one thing you can be sure of, Ball4 is going to say the words, "1LoT", "2LoT" and "experiment" over and over and over and over and over again in all his responses.
Funnily enough, in a previous argument, Ball4 said that the 244 K…290 K…244 K solution to the 3-plate version of the GPE problem (the solution that E-Lie’s "logic" supports) was a violation of 1LoT! Whoops…
“The way E-Lie and the gang see the GPE is painfully simple and straightforward to understand. I just disagree with them”
If it is simple and DREMT did understand, then he would understand that Elis solution agrees with 1LOT, 2LOT, and SB law, ie standard physics.
And he would understand that his prefered solution does not satisfy these laws.
So if he disagrees still, then he doesnt understand standard physics.
Or he thinks standard physics is wrong, in which case he lacks evidence.
Or he is just here to troll.
Most likely all 3.
Dr Roys Emergency Moderation Team says:
No, BillI think you may have got a little confused with what I was saying.
————————–
Apparently so. I was still in the atmosphere. As I said I lean toward your viewpoint based upon two reasons. 1) a vacuum is more of an insulator than common air. (so is argon) and it is all about containing heat loss to achieve equilibrium of surfaces.
In fact the more I ponder it the more I have difficulty not realizing that all the plates would stablize at the same temperature in the absence of an atmosphere that provides another avenue for heat loss.
GPEs though represent some heat loss as all flat spaces have 6 sides representing some heat loss. But the global shell space doesn’t. But the fact is until they flie such an experiment into space there will always be doubt.
I have a strong aversion to extrapolation and tread cautiously in new territory realizing how I might be affected by my own biases.
It should be incredibly easy to refute the heat transfer equations. When the 2compartment box experiment was presented to them they had a very hard time accepting the result and what did they first jump to as a reason? It was leakage! Says something right there.
https://www.scirp.org/pdf/acs_2020041718295959.pdf
Yes, Bill…they certainly don’t like that Seim & Olsen experiment!
Nate says:
”If it is simple and DREMT did understand, then he would understand that Elis solution agrees with 1LOT, 2LOT, and SB law, ie standard physics.”
———————–
No it doesn’t! He is using the engineering toolbox version of the SB equations. That toolbox version of that only considers radiation from the warmer surface (one SB equation) less radiation from a cooler surface. The analysis is limited to 2 radiating surfaces.
That works great when insulation is materially sufficient to prevent heat loss (like through the core of the earth) and the equilibrium temperature of the earths surface is correctly calculated (asterisk see side bar).
Sidebar: It would be correct except for the mistreatment of albedo if you used blackbody SB equations. Insert SB’s emissivity variable (the inverse of albedo) and you will get an equilibrium different from 255k. It will be 278.5k. But thats an aside.)End sidebar.
There is no SB equation in the toolbox rendition that corresponds to the radiation being emitted from the backside of the thin conductive cooler plate. That has to be accounted for by the engineer building this stuff and the result? DREMT and Postma are correct.
Do you believe that flow on the backside has no effect? Or That it is magically created? That it is generated by something completely apart from the flow of heat from the warmer plate? Its not accounted for in the toolbox rendition of the SB laws. Which is simply the difference between the radiation per SB between just 2 surfaces. Heat is still being lost through the thin conductive plates like fat through a goose!
Of course it would be absurd that such a flow magically was created. If you understand the SB equations used to determine the net energy flow then you know it is absurd to ignore the heat loss from the backside of the cooler plate.
This is why Postma is right he understands the correct application of the SB laws through well established heat transfer equations.
Perhaps if you actually dove down into the equations and logic you would be able to free yourself from the clutches of political science lies.
Cult Leader grammie pup, your post June 4 at 8:57 AM is a gross misstatement of physics. The two plates don’t have the same internal energy as they radiate energy away at different rates which must be equal to the amount received, once equilibrium temperatures are achieved.
There’s no way that the GP could radiate 200w/m^2 on two sides when it starts receiving 200 watts on one side. You have no explanation for the extra 200 watts which must enter the GP for it to radiate at 244 K.
Your ignorance is profound, as your arrogance.
DREMT 10:02 am didn’t understand or DREMT would point out not simply assert where Ball4 actually wrote a violation of 1LOT supported by Eli’s logic.
—–
Bill 11:36 am, a Postma name used to comment around here but stopped when more astute commenters totally ruined that Postma name’s atm. science credibility.
Clint R, I think Swanson is talking to you. Hard to say, because he calls us both by the same name, even though we’re two completely different people.
Yes DREMT, poor E. Swanson (aka Willard, Jr.) is very confused. It’s the result of being braindead.
He can’t understand any of this.
“In fact the more I ponder it the more I have difficulty not realizing that all the plates would stablize at the same temperature in the absence of an atmosphere that provides another avenue for heat loss.”
OMG. Bill didnt get the memo about what the party-line was going to be, and was forced to think for himself, and came up with a sane, logical, correct answer.
Now, sadly he needs to turn off his brain to adopt the insane, illogical, party position on this issue.
“No it doesnt! He is using the engineering toolbox version of the SB equations.”
Well now that we know that Bill is not thinking for himself any longer, and is just parroting the cult’s propaganda, his posts can be safely ignored!
grammie pups has no reply. He can’t explain why the GP would settle at 244 K, so talks to himself and falls back to one of his usual attacks on the questioner.
Clint R and I are two different people. I have no idea why you seem to believe we are the same person, but it’s very funny. The correct solution (244 K…244 K) has been explained so many times on this blog that it’s beyond a joke now for you to act like you haven’t heard it.
The GPE’s debunked.
… only if the 1LOT, 2LOT, and related experiment on which the GPE is based are debunked.
That Kiddo and Pup might not have the same opinion on how to deal with The Equation does not mean much.
Who cares what motivates their trolling. Or if it is coherent. Trolling is trolling. That is all they have.
I see everybody waving hands and nobody doing any calculations explicitly using the guidance of sb equations.
Think of it another way we are going to take a massive blackbody like the size of the sun and warm it to 290k so it is emitting 400w/m2. Then you build thirty layers of concentric IR blocking globes around it. with a 10mm vacuum space between the layers.
Assume this sun is a solid and has the specific heat capacity and mass of water.
What will be the surface temperature of this massive body be in say a century say rounded to the nearest 10th of a kelvin?
Simple problem all the info you need is on the internet and you should be able to compute this in say 10 minutes after getting the dimensions of the sun.
Well, Bill, assuming by “IR blocking globes” you mean “thin (let’s say 10mm), perfectly-conducting blackbody shells” (to make it as similar as possible to the original GPE thought experiment), then view factors between the first shell and the Sun, will be 1. So thinking about what would happen between the Sun and the first shell, the radiative heat transfer equation, with VF=1, reduces to:
Q = sigma * (Tsun^4 – Tshell^4)
The shell stops rising in temperature when Q = 0, i.e. when the heat flow to it goes to zero which is thermal equilibrium. Therefore when Q = 0 the shell has a constant temperature of:
0 = Tsun^4 – Tshell^4
Tsun = Tshell
So the Sun will warm the first shell to the same temperature as the Sun, according to the radiative heat transfer equation, so that’s 290 K; meaning it emits 400 W/m^2 to the next shell. VF=1 between the first shell and the second shell, so the calculations repeat. As you might have guessed, this means the overall surface temperature of this massive body (Sun plus the 30 layers), in say a century when rounded to the nearest 10th of a kelvin, would be 290 K, emitting 400 W/m^2 to space.
Now, you could argue that since the layers (shells) get ever so slightly larger in surface area as we progress from the Sun to the 30th layer, that because the 30th layer will be emitting to space the same amount of power as the Sun, but over a slightly larger surface area, the amount of W/m^2 the 30th layer will emit to space will be a little less than 400 W/m^2. Indeed, each progressive layer should emit slightly less W/m^2 than the layer before it…but considering the scale involved the adjustment necessary would be tiny, even with 30 layers. There is only 10mm between them, after all, and we are talking about a body the size of the Sun. So I would say the final answer would still round up to 400 W/m^2.
I see Bill asking for a sammich.
Clint R,
“A vacuum aint insulation to radiative flux, braindead bob.
You dont understand any of this.”
Did I say it was?
It is insulation with respect to conduction.
Do continue to be a clown for all to see.
Cult Leader grammis pup (and Hunter) wants to build IR blocking globes around the Sun (that is, spherical shells somewhat larger than the size of the Sun) which would emit 400 w/m^2. He forgets that the 400 w/m^2 represents the intensity arriving at the radial distance to the Earth. The spherical shell(s) would thus need to have a radius equal to the Sun-Earth distance for this scheme to work. The intensity emitted at the Sun is considerably larger than 400 w/m/^2.
"The intensity emitted at the Sun is considerably larger than 400 w/m/^2."
Obviously, Swanson, but Bill wasn’t talking about our Sun. He specified:
"Think of it another way we are going to take a massive blackbody like the size of the sun and warm it to 290k so it is emitting 400w/m2."
So it’s just a massive blackbody sphere the size of our Sun, but unlike our Sun it is at 290 K, emitting 400 W/m^2.
The sun only provides a meager 341w/m2 to the planet system. By all stretches is as hot as a pure radiation/conduction based system can warm anything. Thats the 2LOT. How can the sun apply more? It can get hotter and emit more then more will arrive here.
And no a vacuum isn’t insulating. Its a ‘vacuum gap’ that is insulating so that the resistance defined by the SB law can have an effect.
> The [S]un only provides a meager 341w/m2 to the planet system.
There’s something missing in your accounting, Bill.
“Its a vacuum gap that is insulating so that the resistance defined by the SB law can have an effect.”
Bill ur gonna get in trouble with the cult, if you keep departing from their messaging on this!
They don’t believe opening up a vacuum gap change anything, nor insulates.
“Yes, you could introduce insulation between the two, Norman. However, thats not what happens. All that happens is that the plates are separated.”
“The plates are separated by such a small distance that all of the blue plate emission is absorbed by the green plate, i.e., there are no losses from BPs one side. So the green plate still receives what it had been receiving when fully in contact with the blue plate.”
“Plates together, 244 K244 K. Plates separated, 244 K244 K.”
I wonder why nobody from Team GPE answered Bill’s question on the Sun-sized blackbody sphere at 290 K with the thirty blackbody shells surrounding it, all spaced 10mm apart? Is it perhaps because according to E-Lie’s “logic”, the passive shells would have warmed the heat source sphere to such an absurd degree above 290 K that nobody would take them seriously?
Awww…. no one is taking the bait and following the Clown Team down another rabbit hole of insanity.
Maybe we’re learning.
“warmed the heat source sphere to such an absurd degree above 290 K that nobody would take them seriously”
No matter how melodramatic his incredulity gets, it is still not an argument.
There is still no science in it.
FYI Bill, Willis answers all your concerns.
https://wattsupwiththat.com/2009/11/17/the-steel-greenhouse/
Even with only one shell around it, according to Team GPE’s “logic”, the sphere would have warmed to 345 K, emitting 800 W/m^2! So that is 55 K of warming just with the one shell, let alone thirty!
https://en.wikipedia.org/wiki/Argument_from_incredulity
” This form of reasoning is fallacious because one’s inability to imagine how a statement can be true or false gives no information about whether the statement is true or false in reality”
So maybe if they repeat the astonishment a dozen more times. Thatll do it.
Funny how I have to do their own work for them…as well as solving the problem correctly at 4:13 AM yesterday. Why is no Team GPE member giving an answer for what the temperature of the sphere would be with 30 shells around it, according to their logic? I can’t be expected to do everything…
Willis explained the simple and correct physics solution to Bill’s problem.
If people refuse to learn correct physics, and insist on using fake physics, it should be no surprise that they keep on getting wrong answers.
OK, I’ll do everything…around 684 K, I make it. Emitting 12,400 W/m^2. That’s how warm the sphere would be if it had 30 passive blackbody layers around it, according to E-Lie’s "logic". Of course, I could be wrong on that. Please correct me if I am.
If nature is incredible once, it can be incredible 30 times!
…but get this…whilst the internal sphere gets warmer and warmer as you add more shells…the outermost shell always ends up at 290 K, emitting 400 W/m^2 to space. So with 30 shells, the sphere is at 684 K, emitting 12,400 W/m^2. The 1st shell is emitting 12,000 W/m^2, the 2nd shell 11,600 W/m^2, the 3rd shell 11,200 W/m^2, and so on all the way down to the 30th shell emitting 400 W/m^2 to space. All that energy to warm all those shells coming from…somewhere.
There is a never ending supply of heat from the 400 W/m2 heat source.
And there seems to be a never ending supply of incredulity about whatever nature does indeed do.
Can light quanta be blocked by resistance
Nate says:
There is a never ending supply of heat from the 400 W/m2 heat source.
And there seems to be a never ending supply of incredulity about whatever nature does indeed do.
————————-
Well now that the insulation model and the GPE exposed as a fraud. As usual it turns to the sun continuing to heat a 290w/m2 surface with a 400w/m2 radiation field.
But before we demand you go to all the trouble to build a model to demonstrate this fact explain why SB based heat transfer laws specify a ‘zero’ heat transfer for a 290k object in a 400w/m2 radiation field?
What that implies is all of the history of the use of SB equations is wrong and that radiation can’t be stopped by anything, including backradiation resistance? It would cut through any insulation like a hot knife through butter. And in fact isn’t that the result you are looking for?
If SB equations are junk why do you think you can use them for energy going through the insulated vacuum gaps between the shells but you can’t use them for the radiation from the sun as energy passes through that vacuum gap?
What did you think of Willis explanation Bill?
https://wattsupwiththat.com/2009/11/17/the-steel-greenhouse/
Are you going to think for yourself and apply reason and logic? Like here:
“Its a vacuum gap that is insulating so that the resistance defined by the SB law can have an effect.”
Or are you going to adopt the contradictory nonsensical position that the TEAM wants you to have?
Are you going to set aside reason and sanity to take one for the TEAM?
“If SB equations are junk why do you think you can use them for energy going through the insulated vacuum gaps between the shells but you cant use them for the radiation from the sun as energy passes through that vacuum gap?”
There is nothing wrong with SB law. Where did I say that?
The law is applied correctly in the GPE, and in the steel greenhouse problem.
What is insane is DREMTs claim that the radiation emitted from the inside of a steel sphere simply VANISHES.
Just as he claims the radiation emitted from the GP toward the BP simply VANISHES.
He simply acts as though these emissions do not exist!
Where did they go?
Nate:
1) Its electromagnetism. It doesn’t necessarily flow. Like the 12volt battery in your car it stays stored in the battery until the resistance is removed by opening a switch.
2) Who says its not going anywhere? Trenberth’s system budget balances to the 341w/m2 input with 102 watts/m2 reflected and 239w/m2 emitted to space. Of course there are inbalances, reflection rates can change. Clouds can change. Precipitation can change and bring less frequent or more frequent snows.
Bill, about my "Sun Shell" example that I mentioned further up-thread, I only really got into the half of it. As I said:
"If you were able to surround the Sun with a thin shell made of some highly conductive material, with a tiny vacuum gap between the Sun and the shell, according to the GPE "logic", the shell would only warm until it was emitting out to space half the amount of energy, in W/m^2, that the Sun was originally emitting to space. The shell has two sides, an inside, and an outside, you see.
Whereas, in reality, the Sun would just warm the shell until it was emitting to space almost the same amount of energy (in W/m^2) as the Sun was emitting to space originally. There would be slightly less energy emitted (in W/m^2) because the surface area of the shell is larger than the surface area of the Sun."
I neglected to mention the most ridiculous part…that according to Team GPE, the back-radiation from the shell would warm the Sun! Even though the energy to warm the shell came from the Sun originally, Team GPE believes that the Sun could, in effect, warm itself up with its own energy. With only one blackbody shell they think the Sun would warm to 6,872 K, emitting twice as much energy (in W/m^2) as it did previously, at 5,778 K. So that’s a 1,094 K temperature increase, with just one shell added. They would then have the shell itself at 5,778 K, emitting the same amount of energy to space as the Sun did previously.
To be clear, it’s nothing to do with "vacuum gap insulation". That’s just a ruse they have come up with to try to throw people off the scent. Things like your "sphere and 30 shells" example, and my "Sun Shell" example, make it clear that it’s simply about back-radiation directly warming the source. Physically impossible.
“1) Its electromagnetism. It doesnt necessarily flow. Like the 12volt battery in your car it stays stored in the battery until the resistance is removed by opening a switch.”
Weird. And nothing to radiation, SB law or whats being discussed.
“2) Who says its not going anywhere? Trenberths system budget balances to the 341w/m2 input with 102 watts/m2 reflected and 239w/m2 emitted to space. ”
So here you switch to a completely different problem, again nothing to do with whats being discussed.
IOW we see complete evasion of the quite simple question/issues.
Again, the inner surfaces of GP and steel sphere should be emitting radiation according to the SB law.
Why arent they? Where did they go? Is SB law only valid for outer surfaces?
These emissions have disappeared, in DREMTs view, by some unexplained magic.
Is this an insanity you want to support, Bill?
“I neglected to mention the most ridiculous partthat according to Team GPE, the back-radiation from the shell would warm the Sun!”
It seems, lacking any real science or sensible logic, argument by incredulity is the best they can offer. Here taken to new extremes.
Some people never learn.
Change the sun to a planet, as Willis does, if it will make you feel better, but the physics is correct either way.
Nate take it up with Eli!
I was using eli’s equations which are well established. Show where the math or equations are wrong don’t lie and claim I made it up!
Just a reminder, Bill, that I have never argued the inner surfaces of the Green Plate or the Shell don’t emit radiation. They do. So hopefully that will put a stop to any shameless and wildly dishonest misrepresentation that might be going on from obsessive, pathetic, stalking failures who have devoted their entire lives to following me about wherever I post, even though they know I no longer respond to them.
“Nate take it up with Eli!
I was using elis equations which are well established. Show where the math or equations are wrong dont lie and claim I made it up!”
Then we get the coup de gras evasion. Being completely confused about everything!
I fully agree with Eli. If you do also, then you agree with me and disagree with DREMT.
Eli and I and Willis think the SB law applies to all surfaces. And we believe 1LOT is valid.
DREMT does not.
“So hopefully that will put a stop to any shameless and wildly dishonest misrepresentation that might be going on…”
…then again, maybe it won’t! Some people just can’t help themselves.
What does the SB law say? It says a BB surface emits energy. Emitting energy is LOSING energy.
DREMT clearly states this cannot happen on the side of the GP facing the BP:
“That is, the [GP] cannot lose energy in the entire hemisphere of potential emission facing the [BP]”
“The Green Plate can only lose energy on the side facing space, unlike the Blue Plate”
And this lost emission has vanished in his math. It is not simply cancelled by the BP flux, because that continues to be counted
No physics can explain this, only magic.
DREMT there is a concept of vacuum gap insulation.
Bottom line is take an air gap in window technology that requires two solid static plates of glass to block diffusion and convection.
Without the glass air molecules would transfer energy through collisions by diffusion and both diffusion transports molecules of air that are at ground level in the same manner it transports the heavier molecule of CO2 to a uniform distribution within the atmosphere. Its more effective doing with the lighter molecules than the heavier ones like CO2.
Plus when diffusion is too weak to do the job you get mass movement of air upward in the form of convection.
Finally all this movement of molecules allows for collisions that transfer energy between airborne molecules at a far higher rate than radiation can do it.
So this whole enchilada involves a transport of heat from the surface to TOA without even considering radiation. Trenberth’s budget has more radiation 40w being transported than do thermals. 17w. This is almost certainly wrong. At any rate the 333 watts in his budget in excess of what the sky temperature would dictate. Roy has said it is less. But this warmist crowd does not want it to be so that convection/diffusion raises more heat than radiation as that would create either no greenhouse effect or it would create a huge buffer to override even more transport of heat by radiation all the while they are claiming its going to result in less transport in claiming more unrestricted layers will reduce radiation even further.
But thats an aside..
A vacuum gap represents insulation because all a vacuum gap does is remove an avenue for heat to migrate though the gap by diffusion and collision. So it has to be more insulating than air gaps between solid static sheets of glass but heat does go through these vacuum gaps via radiation.
NASA makes some really expensive insulation for space craft. They do so by coating thin polymer? sheet of plastic with gold deposited on the sheets to make a stable (gold is really stable against corrosion) that provide high reflective values that reduce outgoing heat via radiation across the vacuum gaps.ed. So both the movement of molecules and radiation is reduced in a bubble where the air has been evacuated.
Some people still just can’t help themselves…
Now, onto Bill’s comment:
"A vacuum gap represents insulation because all a vacuum gap does is remove an avenue for heat to migrate though the gap by diffusion and collision"
Sure, but in the GPE thought experiment there is no air present whatsoever, anyway. The conditions specified are that it takes place entirely in a vacuum. So those avenues for heat transfer (conduction to the air molecules/convection) never existed. There’s not really a "vacuum gap", because that implies that elsewhere there isn’t a vacuum! There’s simply a gap between the plates, or between the sphere and the shell. All energy transfer is taking place by radiation, throughout, not just in the gap between the plates, or between the sphere and the shell.
Bill, you just need to ask yourself if you’re willing to swallow the idea of the Sun being heated by 1,094 K, essentially by its own energy! I’d consider that a fairly basic sanity check that something is not right with E-Lie’s logic/physics (his math is fine, but math being fine in and of itself does not mean that the physics it represents is correct).
“A vacuum gap represents insulation because all a vacuum gap does is remove an avenue for heat to migrate though the gap by diffusion and collision. So it has to be more insulating than air gaps between solid static sheets of glass but heat does go through these vacuum gaps via radiation.”
Ok.
And how would a vacuum gap compare to the same gap filled with a good conductor like copper?
“Bill, you just need to ask yourself if youre willing to swallow”
Hee hee.
IOW don’t pay attention to the fact that my logic and physics is all wrong, pay attention to my incredulity of what correct physics does.
And did I mention that I’m very very incredulous!
Which is not an argument, or evidence of truth, at all.
"I’d consider that a fairly basic sanity check that something is not right with E-Lie’s logic/physics"
…but there’s a lot more to it than that, as we’ve already been through and discussed…particularly last month. The GPE’s debunked. Has been for years.
Argument by assertion, is not an argument, or evidence of truth, at all.
The GPE’s debunked. Has been for years.
That all said. There has never ever been a demonstration of a radiation only greenhouse effect.
SB laws provides zero heat transfer between two objects of the same temperature.
So whats going on? Its about power and nothing else.
All the empires from Alexander to the American Hegemony and the Mongols to the German Nazis have been about nothing else other than power.
The leaders become rock stars and countless fan boys and brown nosers quickly sign up.
Is a radiation only greenhouse effect plausible? Yep, we don’t know enough about energy to eliminate the possibility. Advocates have already abandoned the effort to demonstrate it in a physical model.
And they just awarded a Nobel Prize to a guy that really did nothing more than enivision a lapse rate based process and then allocated the number he wanted up over the the entire lapse rate. Heck I was doing stuff like that in complex amortizations of financial instruments shortly after my apprenticeship. When you know your starting point and the desired end point. . . .LMAO!
The problem is we don’t let private enterprise to get away with such stuff in figuring what their year end income amounted to. We make they adjust to observations. And it doesn’t matter how much they whine about this and that about the observations. Judith Curry is astounded they haven’t done that with the models. Thats only because Judith has a positive view of the human nature of the people she works with and really isn’t aware that there is no group in the world that is better than the next group. They are all subject to bias, they are all subject to being fan boys, they are all subject to wanting to advance in their careers.
Nate says:
Argument by assertion, is not an argument, or evidence of truth, at all.
——————————————
Nate you just described the only case for a radiation-based only greenhouse effect.
So far the only thing ever seen are experiments that failed to produce a greenhouse effect and are handwaved away by alleging the experiments were flawed. The GPE, for example, has clearly been debunked as a demonstration of the greenhouse effect because it wasn’t a demonstration of that at all. Every one of them.
You would have us believe that if we had a large pot of water with the water at 17C in a chilly 17c room and we dropped a 12″ sphere filled with water that was surrounded with 30 layers of glass separated by 1mm vacuum gaps into the pot the water in the sphere would begin to boil and the sphere would explode/rupture. What did DREMT calculate the results at? 12,000 watts and something north of 400c!
Come to think of it that would be a great movie plot! The Invasion of the Space Eggs.
Norman says:
DREMT
No you do not understand what I wrote at all. You have debunked nothing. You should try to think.
Your false approach is just to keep persisting with wrong notions (like your total ignorance on the Moon rotation).
————————
Hmmmm, what does DREMT have on the moon?
1. The convention of kinematics to recognize what a rotation on an external axis is.
2. A particle by particle calculation of angular momentum for a body rotating on an external axis.
3. A logical source for the how all rotations on external axes have at a minimum all the particles moving in concentric rotations.
What do you have.
1. Astronomy says without proof nor logic that the moon rotates on its own axis.
2. non-recognition by astronomy that objects can rotate on external axes.
I think that by definition makes you a fanboy that would deny any and all science so you can properly appear to be a member of an elite club.
My take on it all.
1. Astronomy doesn’t do anything that would be dependent upon not having the moon rotate on its own axis versus rotating on an external axis.
2. Due to the complexities of putting an object in orbit and time constraints they treat orbiting separately from the natural processes that inevitably bring an orbiting object into a tidal locked state.
3. No self respecting astronomer would strive to prove that the moon rotates on its own axis as it is irrelevant to everything astronomers do. Such push back only arises from fan clubs that analyze, dissect, and support everything their heroes do.
There you go!
“Nate you just described the only case for a radiation-based only greenhouse effect.
So far the only thing ever seen are experiments that failed to produce a greenhouse effect”
Well the GPE and the Steel Greenhouse were never claimed to be complete GHE theories, so it is a strawman to suggest that they ever were.
They are exactly what they are claimed to be, simple, clear demonstrations of radiative insulation, and the effect of back-radiation.
They are intended only to debunk the sky dragoneer claims that radiative insulation and back-radiation do not work. And they do that.
It seems like you agree with the analyses of Willis, and Eli, that these parallel black plates or concenetric shells, DO in fact insulate. And you disagree with the sky dragoneers, Postma/DREMT?
But you are reluctant to commit.
“SB laws provides zero heat transfer between two objects of the same temperature.”
Exactly. There must be a T gradient to get heat flow in these problems. And there must be heat flow out of plates/shells since there is heat flow into them.
To simply assert that there is no T gradient is total nonsense.
“So whats going on? Its about power and nothing else.
All the empires from Alexander to the American Hegemony”
Mixing politics into your melange argument again?!
This is simply an unhelpful distraction, Bill, when discussing a pure science issue.
“You would have us believe that if we had a large pot of water with the water at 17C in a chilly 17c room and we dropped a 12″ sphere filled with water that was surrounded with 30 layers of glass separated by 1mm vacuum gaps into the pot the water in the sphere would begin to boil and the sphere would explode/rupture. What did DREMT calculate the results at? 12,000 watts and something north of 400c!
Come to think of it that would be a great movie plot! The Invasion of the Space Eggs.”
Yes, Bill, glass has quite high emissivity. Some reflectivity, therefore according to Team GPE it should be an even better radiative insulator than a blackbody shell. Basically, every single substance in the Universe is an excellent radiative insulator according to Team GPE…but glass is a reasonable choice. Maybe just put less shells around the sphere so that it doesn’t explode/rupture, and only boils the water. That way you could incorporate some sort of valve to let the steam out, and to add more water in to replace it, then the steam could power a turbine and voila! We can generate electricity, using the magical powers of back-radiation heating!
“You would have us believe that if we had a large pot of water with the water at 17C in a chilly 17c room and we dropped a 12″ sphere filled with water that was surrounded with 30”
Is there a heat source involved? No? Then its a different problem and has a different answer!
A similar problem would be an old bare 60 W light bulb. Turn it on. Let it equilibrate. Now surround it with a black metal enclosure. Does it heat up more?
Does the enclosure heat up? Of course it does.
Now surround it with a second black metal enclosure. Does the light bulb heat up more? Does it melt?
Probably.
Does the first enclosure heat up more than it was? Does the second enclosure heat up? Of course they do.
Of course there is nothing incredible about this, if you understand that adding insulation to a heat source causes it to heat up!
And Bill, already has explained that a vacuum gap between layers is indeed insulation.
Nate says:
Well the GPE and the Steel Greenhouse were never claimed to be complete GHE theories, so it is a strawman to suggest that they ever were.
They are exactly what they are claimed to be, simple, clear demonstrations of radiative insulation, and the effect of back-radiation.
===================================
FOLKS LOOK HERE! Nate just admitted the GPE does not at all establish the Greenhouse Theory!!!!!
He even claims that its a strawman to suggest anybody ever did that!
And to close the deal Nate claims sky dragon slayers were claiming air gaps can’t insulate!
Talking about the pot calling the kettle black. . . .sheesh!
Nate you are nothing but a walking and talking contradiction, contradicting yourself at a pace of one per post.
Lets see what did Nate say about how the insulation of the GPE theory would allow the surface to warm.
”Thanks Bill for your agreement that the BP warms in the presence of the GP. It warms closer to but not all the way to the T of the sun, or whatever heat source. ”
Here nate claims that insulation of 14 air gaps (a u value of .000061) would warm the surface of the earth to 5,778K if it didn’t melt first.
There’s even less consistency to their claims…when the green plate is only on one side of the blue, it’s “adding green plates will warm the blue plate closer and closer to a maximum temperature set by the heat source”. When there are green plates either side of a heat source blue plate, or shells around a heat source sphere, however, it’s “adding green plates/shells will warm the blue plate/sphere above the maximum temperature”, e.g. adding one shell around the Sun supposedly causes the Sun to warm by 1,094 K, until it’s emitting twice as much energy (in W/m^2) as it did previously! Quite impressive for one vacuum gap…
Of course, one minute it’s the “Green Plate Effect” and next minute it’s the “Vacuum Gap Effect”…they can never decide if it’s supposedly the Green Plate that warms the BP, via back-radiation, or whether it’s the presence of a “vacuum gap” that insulates the BP.
They also want to do away with the concept of thermal equilibrium, altogether. Have a heat source sphere in space at a certain temperature and add a passive shell around the heat source. With view factors = 1 between the sphere and the shell, according to the radiative heat transfer equation heat flow goes to zero when the sphere warms the shell to the same temperature as the sphere. That is thermal equilibrium. At this point, heat is no longer flowing from the sphere to the shell, and because the shell has warmed, it radiates energy to space based on its temperature and emissivity. So there is no heat flow between the sphere and the shell, and no heat flow from the shell to space.
They want you to believe that there “must be a temperature gradient to drive heat through the system” and so they argue the sphere must perpetually remain at a higher temperature than the shell! Which is total nonsense. At thermal equilibrium there is no heat flow, and there doesn’t need to be…the sphere has already heated the shell, and the shell is simply radiating energy to space because it’s matter above 0 K. Whereas, it’s like they think that unless there is a permanent temperature gradient constantly driving heat into the shell from the sphere, the shell would just…stop radiating, for some reason!
“Here nate claims that insulation of 14 air gaps (a u value of .000061) would warm the surface of the earth to 5,778K if it didnt melt first”
Nope, a light bulb.
You admit that plates with gaps DO insulate. DREMT is proven wrong about that.
That argument is over.
Now you know very well that insulating a heat source, like the light bulb, will make it heat up. So it makes little sense to express incredulity about that.
So Im not sure what you are on about now.
“FOLKS LOOK HERE! Nate just admitted the GPE does not at all establish the Greenhouse Theory!!!!!”
Bill you can use as many !! as you want. It wont change that fact that this is just YOUR endless confusion about what the GPE argument was about.
No one, not Eli, not me, claimed the GPE, was supposed to be the GHE.
To misrepresent that it was is another big strawman, just a sad attempt to troll.
Whatever Nate. Saying clearly you are not here supporting the Greenhouse gas forcing model probably is news to many. But I still have a problem with your claim that the GHG insulalation model will warm the world to the same T as the sun. 5,778k
So you agree that layers of metal separated by vacuum are insulators.
You don’t dispute that the light bulb warms when insulated by such layered enclosures, just as your sun-model would.
So you have to make up things that I NEVER said, to dispute.
“Saying clearly you are not here supporting the Greenhouse gas forcing model probably is news to many.”
Thats one.
“But I still have a problem with your claim that the GHG insulalation model will warm the world to the same T as the sun. 5,778k”
Thats two and three.
Look its obvious that you are still trying to please your friends on the Moron TEAM, while having debunked their claims.
You can tell when they start to get desperate, Bill. They will start to mention things like light bulbs, even though the main “heat source” for a light bulb, the filament, can be at temperatures in excess of 2700 K. So, according to the GPE logic, surrounding the bulb with a blackbody shell should cause a significant increase in temperature of the filament, which of course does not occur in reality. You have to always be careful with the nonsense they try to pull…
Nate says:
”You admit that plates with gaps DO insulate. DREMT is proven wrong about that.”
The issue behind light bulbs is governed by the square distance law and it would take an infinite number of glass bulb shells each separated by a vacuum to double the temperature of the inside glass bulb of say a 60watt light bulb from its ~93c temperature to 160C. The 160c should then correspond to the filament temperature modified by the square distance law which for a light bulb is typically around 2500c. There is no forcing on the lightbulb filament. That isn’t exact, though they evacuate most of the air from the inside of the bulb to avoid interation with oxygen.
The forcing concept of AGW has always been the most controversial issue, but there is a lot of censorship and coersion on all employees and businesses that want to stay out the political limelight
Yes obviously there is a greenhouse effect. But until you properly describe it in mathematical blueprints you cannot do the math to calculate how it varies. Thats why you need to understand the natural world and natural climate variation before you can understand anthropogenic climate variation. Quite simply the GPE was invented to sell a fraud. Perhaps you championed it to not do that. . . .but that seems to be a long reach considering why you are even here. So I am calling liar, big fib, on that one. It seems either you were in on the fraud or you were a victim of it. No inbetweens, no excuses that you are here to sell the truth about insulation. Nobody is going to buy that fib.
Dr Roys Emergency Moderation Team says:
When there are green plates either side of a heat source blue plate
———————-
Green plates around a blue plate will insulate the blue plate from both sides. If blue plate has a heat source it will reduce heat losses. If it doesn’t and there is a heat source it reduce the warming rate of the blue plate.
This completely explains Dr. RW Woods experiment outcome and explains why you have never seen any experiment, other than an imaginary thought experiment emerging from mainstream climate science on this. RW Woods was a man far ahead of his time obviously.
The above explains why the IR opaque greenhouse warmed more slowly and it explains why it didn’t warm more.
So now we have all the morons in here that for years have pooh pooh Dr Woods suddenly claim they weren’t here at all for that but were here to teach people about insulation.
“it would take an infinite number of glass bulb shells each separated by a vacuum to double the temperature of the inside glass bulb of say a 60watt light bulb from its ~93c temperature to 160C.”
Confidently making up ‘facts’ again?
At least you get the principles that a heat source, insulated, will heat up. And that plates with vacuum gaps are insulators.
Then there is DREMT who magically converts his incredulity into ‘truth’.
“So, according to the GPE logic, surrounding the bulb with a blackbody shell should cause a significant increase in temperature of the filament, which of course does not occur in reality.”
“They want you to believe that there ‘must be a temperature gradient to drive heat through the system'”
Who is they? Its those darn meddling physicists with their ‘laws of physics’ and their ‘thousands of experiments’. Meddling with my beliefs.
“At thermal equilibrium there is no heat flow, and there doesnt need to bethe sphere has already heated the shell, and the shell is simply radiating energy to space because its matter above 0 K.”
He has had 5 years to learn this one physics principle, and solve one basic homework problem, and he just can’t do it.
And he’s even had the solution manual!
“Whereas, its like they think that unless there is a permanent temperature gradient constantly driving heat into the shell from the sphere, the shell would juststop radiating, for some reason!”
Again, extreme incredulity about what heat actually does in the real world, is erroneously believed to be an argument!
This is very sad and persistent inability to grasp the concept of Conservation of Energy.
If they get really, really desperate, Bill, they might even double down on nonsense like claiming surrounding the bulb with a blackbody shell would increase the temperature of the actual filament itself! Or saying that unless there is a permanent temperature gradient constantly driving heat from a heat source sphere to a shell in space, the shell would just magically stop radiating! Who knows what they are going to come out with next…
Nate says:
June 12, 2022 at 4:22 AM
it would take an infinite number of glass bulb shells each separated by a vacuum to double the temperature of the inside glass bulb of say a 60watt light bulb from its ~93c temperature to 160C.
Confidently making up facts again?
At least you get the principles that a heat source, insulated, will heat up. And that plates with vacuum gaps are insulators.
————————————-
Nate the filament doesn’t heat up! What heats up from additional insulation is the glass enclosure of the filament.
The glass enclosure of the filament sits half way between the ambient temperature and the radiation field cast by the filament. To calculate the radiation field you use the inverse square distance law.
Since manufacturers of bulbs make them in different shapes and sizes and use a variety of filament sizes (for extended life bulbs for example) there is no one size fits all calculation for a light bulb. But you can roughly calculate it from information contained on the internet as to typical sizes. I used 1/100th of an inch for the filament diameter, 2 1/2inch diameter glass shell, and 93c for the temperature of the glass shell of a typical 60watt bulb and 2500c. Apply the insulation factor to double the temperature of the shell. Doubling 93c produces 160c. So this should be the temperature equivalent of the filament radiation field when it reaches a spherical globe surrounding it.
So then apply the square distance law to find the temperature of the filament. Don’t expect it to be perfect as the globe of a bulb isn’t perfectly spherical and a thread of a filament not perfectly corresponding to the shape of the shell. But it gets you well into the ballpark.
No! Please understand completely Nate! Insulation cannot warm up the source. You claim one minute to understand this and the next minute you are claiming insulation warms the filament of a light bulb. Obviously you don’t get it yet! Insulation cannot warm up the source because it has no source of additional forcing to make it hotter than the source.
Its amazing how these tinfoil hat folks cling to the forcing model of insulation. The implications of that is backradiation from earth warms the sun. They don’t understand physics.
Nate is still shifting between the two propaganda models offered up by the folks profiting from this venture. One minute he suggests that the sun can continue to warm a surface to 5778k and he wants to ignore the equilibrium value established by view factors and the inverse square distance law.
Then when somebody calls him on that he shifts to the insulation forcing model that both RW Woods and Seim/Olsen blew a Mack Truck sized hole in using real science.
But that isn’t even necessary as the laws of science already prohibit such a ‘forcing model’ as pointed out by Physicists G&Tand not responded to by the proponents with a viable with a forcing model.
How much evidence does one need to rip a tinfoil hat off a fanboy?
Hunter, The RW Wood experiment showed that most of the warming in a greenhouse was the result of suppressing the convection with the surroundings. There were many aspects of that experiment which preclude a determination of the effects of back radiation to the inner plate. For one, the outer covers must be able to warm above ambient, which can’t happen while convection is operating, both inside and outside the box.
The Seim/Olsen paper also has several problems which have been pointed out numerous times. That said, remember that they did conclude:
They claim that the observed “backscatter” (Figure 9) should have produced greater warming, while ignoring the fact that their setup included small fans to promote convection. Also, the fact that the CO2 showed more IR reduction outside than the increase in IR to the rear plate could have been the result of the CO2 absorbing IR from the room, which would have warmed things when only air was used.
Given the other problems with their experiments, I think they don’t prove their conclusion:
The back wall thermocouple is not the heated plate, which would be the location analogous to the Earth’s surface. They intentionally control the temperature of the rear plate for most of their setups, so any such warming can not be determined.
“Nate the filament doesnt heat up!”
In your opinion. Not based on any actual knowledge.
“What heats up from additional insulation is the glass enclosure of the filament.”
I agree it heats up. Let the glass be your ‘sun’ then. It heats up when surrounded by insulation.
That makes the point that a heat source, surrounded by an insulating enclosure will heat up! Surround that enclosure by another enclosure and the first enclosure will heat up, and the glass will heat up further. On and on.
The logic here is unavoidable.
That anyone would be think this too incredible, is trying hard to remain ignorant of heat transfer.
And their incredulity of a thing that actually happens is a very poor argument!
“The implications of that is backradiation from earth warms the sun. They don’t understand physics.“
There have been various people on here that have indeed argued just that – that back-radiation from Earth warms the Sun a little bit! You only have to look at the reaction to the “Sun Shell” example to see that there is absolutely no limit to what they are prepared to claim.
E. Swanson says:
June 12, 2022 at 9:01 AM
Hunter, The RW Wood experiment showed that most of the warming in a greenhouse was the result of suppressing the convection with the surroundings. There were many aspects of that experiment which preclude a determination of the effects of back radiation to the inner plate. For one, the outer covers must be able to warm above ambient, which cant happen while convection is operating, both inside and outside the box.
The Seim/Olsen paper also has several problems which have been pointed out numerous times. That said, remember that they did conclude:
————————————————–
You misunderstand the experiment results.
The results merely show there are no exceptions to the S&B Law, the 1LOT, AND 2LOT caused by an electromagnetic process.
All these experiments do is replicate the experiments that led to those laws. As you well know if you could show otherwise you would overturn those laws. It has been a long time since I have seen a real scientist argue that the 3rd grader radiation model is an explanation of the greenhouse effect. . . .for good reason.
The fanboys in here though bring it up almost daily.
Nate has already acknowledged that the GPE doesn’t in any way prove the greenhouse effect and the only thing it is designed to do is educate people that air gaps and vacuum gaps have insulating qualities. Seim/Olson and RW Wood experiments also shows that insulation doesn’t warm anything about equilibrium in accordance with known laws of radiation and that IR filtering is not a special case.
Nate says:
DREMT:”They want you to believe that there ‘must be a temperature gradient to drive heat through the system’ ”
Who is they? Its those darn meddling physicists with their laws of physics and their thousands of experiments. Meddling with my beliefs.
————————
‘they’ would be you and the other fanboys in here. And near as I can tell none of you have come up with a relevant experiment yet.
===========================
Nate says:
DREMT:”At thermal equilibrium there is no heat flow, and there doesnt need to bethe sphere has already heated the shell, and the shell is simply radiating energy to space because its matter above 0 K.”
He has had 5 years to learn this one physics principle, and solveN one basic homework problem, and he just cant do it.
—————–
When are you going to learn that one physics principle Nate?
You posted in the last week your opinion that the sun would warm the earth’s temperature above its equilibrium value with the sun.
I presumed you believed that because of the insulation such that any insulation allows a surface to exceed its equilibrium value and then you repeated the same thing with light bulbs.
I think we all agree now, except DREMT and toadies, that the GPE results in a warmer BP.
And as Bill noted, the warmest it can get is 290 K with many plates. because, at most it can radiate 400 W/m^2 to space, the amount it receives.
But the GPE, and the steel greenhouse are not the same. And they will have different answers. The steel greenhouse planet cannot radiate out its back side like the BP, so its T is not limited to 290K.
Similarly the Earths surface cannot radiate out its back side to space like the BP. It can only lose heat thru the atmosphere to space. Thus it doesnt have a T limit like the BP does.
Look at Venus. It has a very strong GHE and is warmed to 475 C. Much warmer than Earth or Mercury.
“As you well know if you could show otherwise you would overturn those laws. It has been a long time since I have seen a real scientist argue that the 3rd grader radiation model is an explanation of the greenhouse effect. . . .for good reason.
The fanboys in here though bring it up almost daily.”
Yes, we saw that Vaughan Pratt recently criticized the back-radiation model on here, even saying the Wikipedia article on the GHE needed changing. Not sure why the regulars here can’t let it go.
I see that Kiddo has yet to get Pup’s memo regarding thy Wiki page.
☺️
Not sure why the regulars here can’t let it go.
Nate says:
”Nate the filament doesnt heat up!”
In your opinion. Not based on any actual knowledge.
———————–
Yes based on actual knowledge. There is no temperature gradient in the filament. It is heated evenly by the resistance of the wire a resistance that is determined by the area of its crosssection vs the amperage flowing and the resistance of the wire.
No temperature gradient and then no warming from insulating the wire. The blue plate in the blue plate experiment is an example of a temperature gradient.
The equilibrium of the blueplate is a floating equilibrium determined by the difference in temperature of the source and the target. Insert a second plate and you divide that difference by 3 instead of 2. Insert a third and it is now 4 that you divide by. If the target is the same temperature as the source then you are dividing those numbers into zero.
A plate of glass or a plate has a temperture gradient across it but it is inconsequential because glass and plates are conductive. Put an asbestos plate up there and it will develop a temperature gradient across the thickness of the asbestos because asbestos is an insulator.
“es based on actual knowledge. There is no temperature gradient in the filament. It is heated evenly by the resistance of the wire a resistance that is determined by the area of its crosssection vs the amperage flowing and the resistance of the wire.”
What matters is that the environment of the filament, where it needs to dissipate its heat, has gotten warmer, thus the filament must get warmer. Not very much, I do agree.
But this is getting into the weeds and is besides the point, that the bulb, as whole, heats up when more insulation surrounds it. We agree on this.
What we agree on is the shell will warm to the same temperature as the surface as modified by the inverse square distance law. You cannot heat the shell of the light bulb to 2500c no matter how much insulation you pack around it unless you get an exothermic chemical reaction and the insulation combusts.
“What we agree on is the shell will warm to the same temperature as the surface as modified by the inverse square distance law. You cannot heat the shell of the light bulb to 2500c no matter how much insulation you pack around it unless you get an exothermic chemical reaction and the insulation combusts.”
In the Steel Greenhouse, the radius of the shells are very close to the radius of the planet to keep it simple.
I agree that if the radius of the shell is much larger than the radius of the planet, you will get a smaller amount of warming.
But you will still get warming, and that is the main point here.
> Not sure why the regulars here can’t let it go.
Allow me to help:
(P1) If Kiddo’s interpretation of Vaughan’s argument is correct, Vaughan would be a Sky Dragon Crank.
(P2) Vaughan is not a Sky Dragon Crank.
What should we conclude?
🤔
You could conclude that it is possible to still believe in a Greenhouse Effect whilst not believing in the Green Plate Effect. After all, some members of Team GPE have been arguing that the latter was never meant to be a demonstration of the former.
People can believe whatever they want, I guess.
With the GPE both theoretically and experimentally debunked, there is not a lot of choice left for you guys, anyway.
… except to know DREMT is wrong about the GPE since the 1LOT has not been both theoretically and experimentally debunked
Oh yes, Ball4 and 1LoT. How could I forget?
https://www.drroyspencer.com/2019/03/uah-global-temperature-update-for-february-2019-0-36-deg-c/#comment-345722
> it is possible to still believe in a Greenhouse Effect whilst not believing in the Green Plate Effect.
It is also possible to believe that the Green Plate Effect does not offer a good account of the Greenhouse Effect while still believing in both.
This might explain Vaughan’s specific wording.
Most likely he would defend the GPE if questioned. The Team stick together, after all. I mean, he would strictly-speaking then be contradicting what he said about the back-radiation account of the GHE, but when have they ever been consistent?
[KIDDO] The Team stick together, after all.
[ALSO KIDDO] I have explained it my way, Pup explains it his [… Pup] is a separate human being from me with his own ideas.
You do realize there’s no contradiction there, right? Clint R and I are obviously not in Team GPE, which is the Team I was referring to.
Some people here continue to maintain that testable, fact-based knowledge about the world is somehow opinion-based.
That what heat transfer does in the real world is just a matter of opinion.
Its more or less ‘your team believes 11 > 9, but my team happens to not believe it’.
Its because they don’t have to make anything work in the real world.
Whereas those of us who do have to, realize that belief that facts are wrong won’t actually make them wrong.
Team GPE’s their name – false accusations, misrepresentations and insults is their game.
> there’s no contradiction
There is at least one, Kiddo. Your “explanation” does not cohere with Pup’s. In fact they are mutually exclusive.
But more important is the double standard. You wash your hands over what Pup holds even if it does not cohere with your view. Yet you harp about how people view the relationship between Eli’s thought experiment and greenhouse theory when both are independent.
You should reread what Vaughan said. It does not imply what you make it imply.
Vaughan Pratt said:
"“[Quoting Bill Hunter] Seems a lot of university websites and textbooks need correcting.”
Certainly the Wikipedia article on the greenhouse effect needs correcting, where it says “Part of this radiation is directed towards the surface, thus warming it.” Wikipedia editor William M. Connolley continues to believe in the back radiation theory, though his source for this (a 2003 book on the earth’s biosphere) says nothing more than what’s in the IPCC’s definition in AR5, namely that when CO2 traps heat it reradiates it both up and down. Connolley overlooks that even more heat is radiated up from below as temperature rises.
While I have a number of textbooks on modern climate I don’t have any that support Wikipedia on its back radiation theory."
Nate says:
”Some people here continue to maintain that testable, fact-based knowledge about the world is somehow opinion-based.”
Nate also said:
”What matters is that the environment of the filament, where it needs to dissipate its heat, has gotten warmer, thus the filament must get warmer. Not very much, I do agree.”
Nate claims that insulation which is always colder than the filament is going to make the filament hotter. Unfortunately that an opinion in conflict with the opinion of the lawmaker Clausius.
Kiddo still has not got the memo left by Pup about thy Wiki.
So, let me get this straight – a lot of textbooks would need correcting, but Vaughan found none?
I simply quoted Vaughan Pratt. I did nothing else, I said nothing else. Yet for some reason Willard chose to respond with some nonsense about Clint R, and textbooks!? Who knows what goes on in his head, he certainly never makes himself clear.
Here is Stefan-Boltzmann explained in a way that cuts through inculcation and attaches a personal interest in the outcome.
DREMT and Bill are just as rich. DREMT gives Bill $2 and Bill gives $2 back in response. DREMT and Bill are still just as rich.
Bill and Nate are just as rich. Bill gives Nate $2 and Nate gives $2 back in response. Nate and Bill are still just as rich.
Stefan Boltzmann calls that equilibrium.
Now Nate gives Swanson $2 and Swanson being half as rich as Nate only gives $1 back since both are socialists they are happy that they are both richer.
> I simply quoted
Kiddo does not always quote, but when he does it’s to simply quote.
And nothing else.
He’s not trying to convey or suggest anything.
He has no point to make.
No argument.
It’s just a quote, after all.
Wouldn’t that correspond to The Game?
Some might argue that it is.
The quote says it all. You’ve got nothing in response except to scrabble around desperately.
Here’s how we make an argument using a quote, Kiddo.
First, the quote:
https://www.drroyspencer.com/2021/04/uah-global-temperature-update-for-march-2021-0-01-deg-c/#comment-671002
Second, the argument:
You are overlooking a paragraph that Vaughan warned not to forget.
See?
Arguing is simple.
"You could conclude that it is possible to still believe in a Greenhouse Effect whilst not believing in the Green Plate Effect."
Thank you for further proving my point. As I said, Pratt agrees that the back-radiation account of the GHE is debunked…and what is an example of the back-radiation account of the GHE? The Green Plate Effect. Naturally he still believes in the GHE, though. Some version or other of it.
(Of course, most likely if you asked him if the GPE was correct or not, he would try to squirm around some way of claiming that it was, whilst still maintaining the back-radiation account of the GHE is debunked – you know what these people are like).
> Thank you for further proving my point
Except that this is not your point, Kiddo.
Also, *how* we prove a point matters. Pointing to an experiment is one thing. Declaring a refutation by armwaving around a fairly basic equation is quite another.
Have some empirical evidence about backradiation:
https://scienceofdoom.com/2010/07/17/the-amazing-case-of-back-radiation/
DLR stands for Downward Longwave Radiation, the correct term.
Therefore, instead of proving what you call your point, I am proving *mine*: one can reject Eli’s thought experiment as a valid explanation of the greenhouse effect while accepting both Eli’s thought experiment and the greenhouse effect.
Since nobody is arguing that back-radiation doesn’t exist, you don’t have a point.
I thought you said the quote spoke for itself, Kiddo:
“Wikipedia editor William M. Connolley continues to believe in the back radiation theory”
Perhaps you need to read more closely what Vaughan said which, to repeat, does not invalidate Eli’s Green Plate thought experiment.
https://www.drroyspencer.com/2022/06/uah-global-temperature-update-for-may-2022-0-17-deg-c/#comment-1315036
Still waiting for Nate to show that ‘they’ includes a scientist with an experiment proving that ‘they’ isn’t just the fanboy squad.
Who said that what Pratt said invalidates the GPE? Certainly not me. The GPE has been debunked both theoretically and experimentally. Pratt just acknowledges that fact, which is unusual for a GHE Defense Team member. Which is why it is noteworthy. Your quote makes it even clearer than mine did that he acknowledges the back-radiation version of the GHE is debunked, so thanks again for your support in making my point.
I did not say you said anything, Kiddo. In fact that is the main problem I underline. You are mostly dogwhistling.
What Vaughan said does not imply what you make it imply.
And I am *showing* how your pea and thimble game works. S&O did not disprove the greenhouse effect. They did not refute the Green Plate effect. Nor did they refute backradiation.
All Vaughan said was that backradiation is not a good model of the greenhouse effect.
Do you really think that a blue plate and a green plate was meant to explain the complexities of the greenhouse effect like lapse rate?
Eli presented the simplest argument he could think of to explain something simple.
And you still cannot get it!
“I hope people aren’t overlooking my paragraph “Any laboratory experiment that ignores lapse rate cannot debunk the greenhouse effect. What it can do is debunk the back radiation account of the greenhouse effect, as theory predicts it should.””
“Back radiation account of the greenhouse effect” = Green Plate Effect. Pratt agrees the GPE is debunked. Thank you for your assistance in proving my point.
Kiddo cannot let go of The Game. He has to repeat the quote I myself quoted in support of what I said. He fails a basic logic implication:
Suppose that A does not explain B. That does not imply that A is false. That does not imply that B is false. All it implies is that A and B are not connected.
Nobody believes that backradiation alone can explain the greenhouse effect, including our Stoatness and Eli. The only disagreement is about how to evaluate an idealized model of the greenhouse effect:
https://en.wikipedia.org/wiki/Idealized_greenhouse_model
Also, Kiddo still did not get the memo Pup left him. Thy Wiki page on the greenhouse effect changed a bit since the last time he read it. Sad.
Since there is no need for me to defend arguments I am not making, your last comment requires no rebuttal. Thanks again for your support. You are dismissed with derision by a better man.
Since Vaughan neither denies the greenhouse effect nor the implications of a basic equation Kiddo still fails to master after all these years, the simplest and surest inference to make is that Kiddo misinterprets Vaughan. As I said in my first comment. Which means the green plate, the greenhouse effect, and backradiation all are still standing.
When will he read thy Wiki entry as Pup intimated he should?
You are dismissed with derision by a better man.
I know you are, Kiddo, but what am I?
Here is what Pup might have wanted to warn you about:
> The idealized greenhouse model is a simplification. In reality, the atmosphere near the Earth’s surface is largely opaque to thermal radiation and most heat loss from the surface is by convection. However radiative energy losses become increasingly important higher in the atmosphere, largely because of the decreasing concentration of water vapor, an important greenhouse gas. Rather than the surface itself, it is more realistic to think of the greenhouse effect as applying to a layer in the mid-troposphere, which is effectively coupled to the surface by a lapse rate. A simple picture also assumes a steady state, but in the real world, the diurnal cycle, as well as the seasonal cycle and weather disturbances, complicate matters. Solar heating applies only during daytime. During the night, the atmosphere cools somewhat, but not greatly, because its emissivity is low. Diurnal temperature changes decrease with height in the atmosphere.
https://en.wikipedia.org/wiki/Greenhouse_effect
If you want to play The Game, you really need to learn how to read.
Looks like somebody took Vaughan Pratt’s advice, and edited the Wikipedia page on the GHE now that the back-radiation account of the GHE is debunked (an example of the back-radiation account of the GHE is the Green Plate Effect).
Looks like Kiddo lost just every single point he put forward in this exchange.
Will he try to save his honour by playing The Game?
Tune in tomorrow!
Pointing out that the GHE Wikipedia article has actually been changed only strengthens the case that the back-radiation account of the GHE is debunked. So thanks again for your assistance. You have been very helpful in making my point for me.
Willard says:
And I am *showing* how your pea and thimble game works. S&O did not disprove the greenhouse effect. They did not refute the Green Plate effect. Nor did they refute backradiation.
———————
Willard science can’t prove something doesn’t exist. Thats why the burden of proof is to prove backradiation exists.
When you don’t have proof it exists and you can’t prove it doesn’t exist. . . .what you have is a religion. . . .One might call it faith if only one person believes it otherwise if its being proslytized or inherited by birth or ceremony it is indeed a religion.
Personally, I don’t have any problem accepting that back-radiation exists, it’s the idea that it “warms” or “insulates” things that I disagree with. Hence why I don’t think there is any need to “refute back-radiation” itself. Since Vaughan Pratt has agreed that the back-radiation account of the GHE is debunked, and people like Vaughan Pratt do people like Willard’s thinking for them, I would expect people like Willard to have accepted that the back-radiation account of the GHE is debunked…but for some reason, they just can’t let it go.
“it’s the idea that it “warms” or “insulates” things that I disagree with”
Then DREMT disagrees with basic physics which is not unusual. See Dr. Spencer’s experiments where “the idea that it “warms” or “insulates” things” is shown to happen in nature & proves DREMT is wrong to disagree.
…but, for some reason, they just can’t let it go.
Even after being shown that he misrepresented Vaughan, Kiddo soldiers on with The Game.
Perhaps one day Bill realize that there exists many impossibility results in science.
Willard falsely accused me of a lot but demonstrated nothing. Pratt said what he said, and what he said was that the back-radiation account of the GHE is debunked. There is no way to misrepresent that.
Kiddo still fails to even acknowledge a simple logical inference:
Would his interpretation of what Vaughan said was true, Vaughan would be a Sky Dragon Crank. Yet he is not.
I understand hat modus rollers is hard for a third of the population, but Kiddo has had all the time in the world to come around it.
Modus rollers has a nice ring to it, so the autocorrect is not that wrong.
Still, it is modus tollens.
No, because he still believes in the Greenhouse Effect. Just not the back-radiation account of the GHE. This really isn’t that hard to understand.
Willard says:
Perhaps one day Bill realize that there exists many impossibility results in science.
—————————–
That is actually an astute observation provided you understand:
1) impossible results are common in the practice of science.
(Even public accountants, or are heavily accountable for blowing it, blow it every once in a while.)
2) That imagining impossible results is the provenance of religion not science.
3) that becoming science is a result of proving that which is believed to be impossible is possible.
DREMT,
“I dont have any problem accepting that back-radiation exists, its the idea that it warms or insulates things that I disagree with.”
I think this is a semantic argument that will never be settled, at least with the AGW believers.
You rebuffed my previous interpretation of back conduction. Perhaps back diffusion would have been a better analogy. It is generally known that not all molecules diffuse down a concentration gradient, because some do so in a random walk sense. Fick’s Law is always obeyed, however, because the majority of the molecules proceed downstream.
Everyone should agree that back diffusion exists but it never increases the upstream concentration. If that occurs, it must come from extraneous concentration sources, e.g. osmosis.
Everyone should agree that back conduction exists, but it doesn’t transfer heat in the warmer direction.
The same logic applies to back radiation. It exists, but it doesn’t transfer heat from cold to hot. This discussion is much ado about the definitions of warming and insulation.
Bill, Bill,
There is nothing astute in my observation. It is the most mundane fact. Anyone who studied he history of science or even thought about it for five minutes could have come up with it.
You are merely equivocating on the notion of proof once again. Since Dragon Cranks have little else than silly semantic games, I can understand you cling to them. Still, they are of no use unless all you care about is The Game.
Do you really want to be like Kiddo?
I think it’s a fairly straightforward discussion, Chic. There are those who believe that the Sun could increase its own temperature by 1,094 K using its own recycled energy, and there are those who understand that’s impossible.
> This discussion is much ado about the definitions of warming and insulation.
Let’s not forget heating, Chic, and more importantly blankets.
Also, let’s not forget that Sky Dragons Cranks have little else.
Kiddo has had all the time to show where physicists all over the world missed for decades how they created something more grandiose than a perpetual machine. But he cannot read a simple equation.
All this genial knowledge hidden on a blog. A pity.
"But he cannot read a simple equation."
Another false accusation. I have demonstrated more understanding of Eli’s math and logic than most other commenters here. When JD Huff.man first introduced the "3-plate scenario", Norman initially wrongly calculated that the blue plate would rise in temperature to 345 K. All the other regulars here lapped this up, without correcting him. I was the one who had to actually set everybody straight by correctly calculating (well, "correctly" at least according to Eli’s math and logic) that Eli’s solution would be 244 K…290 K…244 K.
I again demonstrated my understanding further up-thread by providing what Eli’s answer to Bill’s 30-shell scenario would be, as well as calculating how much Eli would have the Sun increasing in temperature by with the "Sun Shell" example.
You, on the other hand, Willard, have demonstrated absolutely zero understanding of any of the issues raised.
Kiddo the Master Explainer:
[TIM] Gordo, let’s skip the semantics (“photons flying both ways” vs “thermal IR” vs heat vs “EM radiation”) for a moment and see if we can agree on numbers. After all, that is the ultimate goal – to be able to calculate how the universe works. *Then follows some basic equations.*
[KIDDO] Tim, please stop trolling.
https://www.drroyspencer.com/2019/03/uah-global-temperature-update-for-february-2019-0-36-deg-c/#comment-344562
Willard, please stop trolling.
Keep claiming you can boil water with ice, braindead bob. You idiots believe such nonsense makes you appear smart? You probably even fool other idiots like Willard and Norman.
That’s why this is so much fun.
Clint R,
You know you can’t prove that I can’t cause water to boil using ice.
Sorry charlie, experimental evidence trumps your bovine excrement.
The rest of your cult believes you, braindead bob.
They won’t all admit it, but they believe ice can boil water. They HAVE to, to believe CO2 can heat the planet.
That’s why this is so much fun.
Believe has nothing to do with it.
Experimental evidence rules Clint R drools.
keep believing in your cult nonsense, bob.
That’s why you’re braindead.
Observations Clint R, not beliefs.
You know that’s the way science is done.
You don’t get to make up bovine excrement in science.
Sorry braindead bob, but your “observations” ain’t nothing more than your delusions.
Kinda like your false beliefs that passenger jets fly backwards.
You don’t understand any of this.
Whoopie tie aye yay,
Get along little Droege.
Gordon,
You are disrespecting our host with a comment like that.
Try some light reading.
https://www.amazon.com/Quantum-Physics-Dummies-Steven-Holzner/dp/1118460820/ref=asc_df_1118460820/?tag=hyprod-20&linkCode=df0&hvadid=312090128349&hvpos=&hvnetw=g&hvrand=5570970933550129142&hvpone=&hvptwo=&hvqmt=&hvdev=c&hvdvcmdl=&hvlocint=&hvlocphy=9022811&hvtargid=pla-459731889516&psc=1
bobdroege, please stop trolling.
Clint needs some attention it seems. Why else pack a post with a bunch of lies intended to needle? Well here you go, buddy, and that’s it for today.
Glad barry is varying from his usual long, rambling nonsense comments, to one where he wisely avoids any discussion of the science he can’t understand.
Variety is good.
The Planet Surface Rotational Warming Phenomenon states:
Planets’ mean surface temperatures RELATE (everything else equals) as their (N*cp) products’ SIXTEENTH ROOT.
( N*cp ) ^1/16
or
[ (N*cp)∕ ⁴ ] ∕ ⁴
This discovery has explained the origin of the formerly observed the planets’ average surface temperatures comparison discrepancies.
Earth is warmer than Moon because Earth rotates faster than Moon and because Earths surface is covered with water.
What we do in our research is to compare the satellite measured planetary temperatures.
The Planet Surface Rotational Warming Phenomenon can be expressed now also QUANTITATIVELY . And it happens so to be a very POWERFUL the planet surface warming factor.
https://www.cristos-vournas.com
“This discovery has explained”
Then publish it! Tell the scientific community about this important discovery!
So, you make a lake on Mars which has the diameter of football field,
with 1 meter frozen water on top. And then add 1/2 meter of transparent frozen CO2 to top of lake.
And the water under the frozen surface is 10 meters or more in depth.
It seems most of sunlight is absorbed by 1.5 meter of ice, and most of visible sunlight passes thru the ice into liquid water of the lake.
How warm is the frozen CO2 at the top of lake at noon and midnight?
It seems the frozen surface of CO2 absorbs less sunlight than typical Mars rocky surface which can get warmer than 20 C.
As .5 meter of CO2 only absorbs a fraction of sunlight and most of it
is shortwave IR AND CO2 would have evaporational cooling. And at midnite the frozen CO2 could colder than rocky surface because it have evaporational cooling.
So in general radiates less energy from sunlight from it’s surface, but the lake absorbs more sunlight than the rocky surface, can.
https://imgur.com/gallery/8AC3rda
3 month evolution of La Nina according to the ESNO blog at NOAA, climate.gov.
Later this month we will get this months picture.
Looks superdeveloping
Wait until later this month and we will see.
swannie…”Gordo still can not explain what happens to the thermal IR radiant energy from the GP which hits the BP, so he falls back on more empty assertions without proof”.
***
IR is not thermal energy, it is electromagnetic energy.
With regard to what happens to IR that cannot be absorbed, it’s a moot point. No one understands atomic theory precisely at the atomic level, quantum theory being largely hypothesis and math. As Feynman once lamented, quantum theory works but we have no idea why.
Bohr hypothesized the behavior of electrons in atoms based on the spectral lines of hydrogen. Each line has a specific frequency and he hypothesized that electrons must live at discrete quantum levels in order to explain that. His relationship E = hf relates the energy levels at which an electron can exist, E, with the angular frequency of the electron in the higher orbital energy level.
Both E and f are related by proportion through Planck’s constant. If an electron drops from energy level E2 to energy level E1, it emits a quantum of energy, E2 – E1, with frequency f. That’s why I don’t believe in photons because a photon is defined as a particle of EM with momentum but no mass, an idiotic proposition as far as momentum is concerned.
I think a better way to look at the problem is IR (EM) as a wave. When the wave encounters mass, the entire wave front strikes the mass and any electrons on the mass that are affected by the wave will jump to a higher energy level. With the reverse situation, emission, quanta of energy from individual atoms somehow aggregate to form a wavefront.
It’s the same as EM used in communications. It radiates isotropically from an antenna and it will strike all sorts of objects along the way. If it strikes another antenna of the right dimensions (the correct fraction of its wavelength), it will be absorbed. For any other object, it simply bounces off and carries on its merry way.
No one knows how it interacts exactly. As for IR from your GP, it simply bounces off the BP and carries on. Or maybe it sneaks between the surface atoms on the BP and wiggles around a bit.
I know, under the right conditions, EM causes electrons in metal to move, producing cyclical Eddy currents. I have not studies the whys and where-to-fores, it was handed to us as a fact and demonstrated in motor braking systems. Also, with Faraday cages.
Gordo wrote:
You are again suggesting that the IR radiation from the GP is not absorbed by the BP, without any substantive reason. For solid materials, the emissivity may be close to that of a black body, but never equal to 100% in the real world. The energy not absorbed may be reflected, or “scattered”. Glass is a good electrical insulator and a good emitter of IR radiation, but visible radiation passes thru, so your discussion of metals doesn’t apply. Polished metals reflect IR but add a thin coat of paint can produce a good IR emitter. A different coating on metal can produce a “selective absorber” which reflects IR but also absorbs SW from the Sun.
Your previous explanation was that the radiation from the BP was “blocked” or “cutoff” and was thus not absorbed by the GP. But, this can not explain the fact that the GP warms when moved next to the BP and also that the BP also warms as well.
https://principia-scientific.com/greenplate-effect-it-doesnt-happen/#comment-28851
🐉
Willard, please stop trolling.
E. Swanson says:
Gordo wrote:
”IR is not thermal energy, it is electromagnetic energy.
With regard to what happens to IR that cannot be absorbed, its a moot point.”
You are again suggesting that the IR radiation from the GP is not absorbed by the BP, without any substantive reason.
———————–
Swanson in any insulating system the flow of energy and thus heat is from the heat source to the cold source. It is simply obfuscating to try to break down the photon theory when it hasn’t been established as a particle theory vs a potential across a medium and have it obfuscate what is really happening. What is really happening that heat is arriving at the blue plate from the heat source, not from the green plate.
E. Swanson says:
”With regard to what happens to IR that cannot be absorbed, its a moot point.
You are again suggesting that the IR radiation from the GP is not absorbed by the BP, without any substantive reason.”
—————————————
Swanson are you aware of what a moot point is?
If you only get $1 for every $2 you give is the same thing as only giving $1.
In neither case do you get richer.
E. Swanson says:
Gordo wrote:
IR is not thermal energy, it is electromagnetic energy.
With regard to what happens to IR that cannot be absorbed, its a moot point.
You are again suggesting that the IR radiation from the GP is not absorbed by the BP, without any substantive reason.
—————————
Swanson you are only making a moot point. Photons are a quasi-particle, meaning they can both display particle like behavior and wave behavior. You are cherry picking one over the other. I already showed that insulation theory is consistent with both theories. You just cherry pick a particle theory to insist that the surface absorb that energy to force the surface to exceed its equilibrium.
I am of the notion that either the accounting is wrong (the heat is trapped in the atmosphere and is expressed as heat there floating in value to emit 239w/m2 to counterbalance the 239w/m2 coming in. This is essentially the Dr. Lindzen theory and you are not qualified to contest it. You can be skeptical of it though.
But Lindzen’s theory is also a particle theory and we still have wave theories to consider where waves are deflected when encountering a strong enough resistance.
Hunter, In the GP thought experiment (and my GP demo), there is no atmosphere, it’s not the same as the Greenhouse Effect. Energy can’t be “trapped” in the vacuum between the plates. But, both plates radiate based on their respective temperatures and the energy flowing thru the system. Each plate emits radiant energy according to it’s temperature and the emission is the same on each side. Thus, there’s some energy from the GP being emitted toward the BP.
What happens to that radiant energy if the BP doesn’t absorb it? You clowns never provide a physics based answer that question.
E. Swanson says:
What happens to that radiant energy if the BP doesnt absorb it? You
clowns never provide a physics based answer that question.
———————————-
Thats a unique thing about Clausius and energy Swanson. Here are the facts:
1) a non-insulated plate will a non-insulated plate will be 290k if it has a 400w/m2 radiation source at FV=1 on just both sides of the plate.
2) a well insulated plate with a 400w/m2 source at FV=1 on one side of the plate will be approaching a maximum of 290k on one side of the insulation and approaching 0k on the other side of the insulation. That insulation can be conventional or a sufficient number of spaced plates to qualify as being well insulated. (this is well established in window technology)
3) a well insulated plate with a 400w/m2 source at FV=1 on both sides of the plate will be 290k no matter how many spaced layers of insulation is provided.
We know in all those cases that cooling is unnecessary. You put cooling anywhere in those systems and you won’t even get to 290k.
The so called back radiation simply ensures a temperature gradient through the plate/gap style of insulation if its not lit on both sides.
Clausius did not specify that equilibrium required the plate to cool. True equilibrium cannot be achieved via lighting one side of insulation, you can just get so close to equilibrium you can’t measure what is creeping out the other side.
all these testable facts testify to the nature of energy and it wave qualities.
Everybody focuses on photons and runs off the track. Energy can be captured in a box. A vacuum thermos does a pretty good job without the coffee getting hotter it just stays hot longer.
You cannot provide enough insulation eliminate all heat loss as insulation is rated by R-value with R-13 equalling 13times less heat loss than a single insulating panel (in the atmosphere). I expect it will equal R-2 in space in relationship to R-1 of just radiation flying through space unimpeded. In the atmosphere R-1 is one panel as it takes out half of radiation and half of convection. The second panel halves both again and earns an R-2.
But there is a way to completely bottle up energy. And that is with a field of energy such that the potential of one overrides the other and when equal and all around the object (considering FV and inverse square distance, maintains a perfect equilibrium. No cooling at all occurring. But 3rd grader insulation model believer believe that if losses are not 100% then the stuff has to heat up and possibly go nuclear.
Swanson, please stop trolling.
Gordo says in reply to Swanson:
“IR is not thermal energy”
What Swanson said:
“thermal IR radiant energy”
Unable to explain what happens to the IR from a cooler body when it reaches a warmer one, Gordon says it bounces off, or “maybe it sneaks between the surface atoms on the BP and wiggles around a bit,” or “No one understands.”
But we can bypass all this conjecture with a single clear reference from a formal physics text.
2 years and still waiting for that reference stating that EM radiation from cooler bodies cannot be absorbed by warmer.
And this is not some complicated proposition. This supposed universal law should be as easy to cite as heat must flow hot to cold.
But the problem, as ever, is that Gordon and others think that radiation is heat when it comes to radiative transfer. Even though they correctly protest radiation is NOT heat at other times.
barry, repeatedly asking that lame question merely demonstrates how incompetent you are. You know NOTHING about this issue.
It’s like you’re asking for a reference that a rock on the ground can’t fall up. There is no need for such a reference for someone that understands gravity.
You’re a braindead cult idiot that believes ice can boil water, but you don’t know enough about the science to know that.
You’ve as braindead as Norman, and you’re in full meltdown.
That’s why this is so much fun.
Claim unsubstantiated for 2 years despite repeated requests. Rejected.
https://plato.stanford.edu/archives/win2008/entries/newton-principia/#Boo3Pri
You can’t substantiate your claim in 20 years, braindead barry. Not even in 200 years. Your claim is bogus.
Two 315 W/m^2 fluxes impacting on a surface can NOT raise the surface to 325 K. You’ve been misled. You don’t know enough about the relevant physics to understand. You’re a braindead cult idiot posing as an anonymous troll.
Barry, your problem lies with your incessant appeal to authority. You won’t find textbooks discussing what happens to EM that is not absorbed by atoms. Everything these days is presented in the form of probability of finding an electron in a specific space. Textbooks shun anything related to actual, physical reality, they seem satisfied with obfuscation by the way of math.
You will find references to the intensity of EM required in order that it be absorbed but I am not going to spend my time trying to satisfy your demands. It it interests you, do what I do…research it.
I have spent a long time studying electron theory aimed at their action in conductors, semiconductors, capacitors, inductors and resistors. I have formed an intuitive idea of how they operate, although no one knows for sure.
I’ve done my work, put in the time. How about doing some yourself? I would be tickled if you could prove me wrong.
Nobody is going to find a textbook saying warm objects can’t absorb radiation from colder.
Because it’s not true.
We can find any number of textbooks from current university courses, all the way back to the father of the 2nd Law himself saying the opposite, as referenced here numerous times.
So we’ve got some guys on a blog saying Clauisus is wrong, MIT is wrong, and any physics text I bring here is wrong, based on stuff they say that they can’t substantiate with any physics textbook.
You’d have to be a bleeding idiot to go along with these guys.
You and your cronies have deluded yourselves with more and more detailed fantasies about physics, all because you don’t like AGW.
And you don’t see how weak your position is with zero corroboration for 2 years, against numerous experts in physics that have been quoted and linked here.
How do you fool yourself into thinking you’re right and the rest of the world is wrong?
barry, you can abuse your keyboard all you want, but until you can support your nonsense, you’ve got NOTHING.
Where’s your technical reference that two 315 W/m^2 fluxes can warm a surface to 325 K?
I already provided you a physics text from university lecture notes saying fluxes arriving at a surface are summed. You saw it. I’ve done the same for any number of rebuttals to the nutso ‘physics’ you guys keep pulling out of your butts. Dozens of formal references.
Where is a formal reference for any of the assertions you’ve made? After 2 years?
Nowhere.
Not even one.
Because there is none.
Wrong barry. You didn’t understand the “formal reference” you provided. If you want to understand it, and can behave like an adult, provide it again and I will take the time to explain.
Here are 2 references, both describing radiative exchange between diffuse greybody surfaces:
“The net average radiative flux from the surface, denoted q, will simply be the difference between the flux leaving the surface and the flux arriving at the surface…
…radiosity will consist of emission from the surface plus the reflected part of the irradiance. On the other hand, irradiance will depend explicitly on the incoming radiation field at the surface, which, in turn, will depend on the outgoing radiation fields from all the other surface which can ‘view’ surface 1.”
https://www.eng.auburn.edu/~dmckwski/mech7210/radexchange.pdf
Thermopedia puts it even more succinctly, describing the same multi-surfaced enclosure with surfaces at different temps.
“the incident flux (irradiance) on surface k can be found. It is the sum of the radiation leaving each other surface j in the enclosure that is incident on surface k.”
https://www.thermopedia.com/content/70/
Now you can explain why these documents do NOT mean that radiation arriving at a surface from different sources should be summed.
And if you’re suddenly going to agree that of course they are summed, but that this is not the only consideration, don’t waste your breath on that wriggle. We already know that. But your contention was that they could not possibly be summed.
I await your explanation.
But more than that, I await your formal references establishing that radiation from an object can’t be absorbed by a warmer object. (Remember, ‘heat’ and radiation are not the same thing).
barry, your job was to provide responsible verification that “fluxes arriving at a surface are summed” (your words), or “two 315 W/m^2 fluxes can warm a surface to 325 K” (my words).
What you provided was “simply be the difference between the flux leaving the surface and the flux arriving at the surface”. You’re just throwing stuff at the wall, hoping something will stick.
Im not going to get in a keyboard contest with you. What you need to show is why you are so confused about this. What source, other than from cult idiots, leads you to believe fluxes arriving a surface simply add?
“What you provided was ‘simply be the difference between the flux leaving the surface and the flux arriving at the surface’.”
Did your eyes slide by this?
“The incident flux (irradiance) on surface k can be found. It is the sum of the radiation leaving each other surface j in the enclosure that is incident on surface k.”
Fluxes incident on a surface are summed. There in black and white. As you said, my “job was to provide responsible verification that ‘fluxes arriving at a surface are summed’.”
Before you move the goalposts, would you like to acknowledge that this is exactly what I’ve done?
barry, two little boys are 1 meter tall each. You can simply add their heights and get 2 meters. But that is NOT the same as one boy that is 2 meters tall.
You don’t understand any of this.
Your mission is to provide a technical reference source that two “boys” add to a “2 meter boy”, that is, two arriving fluxes can increase the temperature above the greater of the two fluxes.
You can’t do that because fluxes don’t simply add. Your cult has misled you, and you’ve swallowed it all, gladly. You don’t know enough physics to understand your cult’s nonsense would result in ice cubes boiling water. Instead of realizing that, you called me a “lying dog”. You can’t stand reality.
Did your eyes slide by this?
https://www.drroyspencer.com/2022/06/uah-global-temperature-update-for-may-2022-0-17-deg-c/#comment-1308051
And this?
https://www.drroyspencer.com/2022/06/uah-global-temperature-update-for-may-2022-0-17-deg-c/#comment-1308792
I’m not moving the goalposts, barry. You’re avoiding reality. You’re a braindead cult idiot posing as an anonymous troll.
“barry, two little boys are 1 meter tall each. You can simply add their heights and get 2 meters. But that is NOT the same as one boy that is 2 meters tall.”
Barry gave Clint exactly the evidence he asked for.
So he takes his go-to evasion tactic, the faulty analogy, to new heights of idiocy.
Troll Nate, you will always support your cult members, as you will always reject reality.
Thats what cults do, and youre doing a great job….
Predictably (as in I called it right before you did it) you shifted the goalposts instead of acknowledging that the references I provided confirm that you sum fluxes arriving at a surface when determining radiative exchange.
You shift whenever a clear rebuttal comes through. You just cant be trusted to be honest in these conversations, making up stories about what I think about ice cubes and so on.
Look at the math in the documents for heat at surface k.
The radiative energy balance on surface k indicates that the net heat flux at the surface (the energy added to surface k) is the difference between the outgoing and incident radiation as:
q” = Jk – Gk
Where q is the net heat flux, J is the radiation leaving k, and G is the incident radiation that is not reflected.
net heat flux = outgoing flux – incident flux
G represents the sum of irradiance from all sources incident on k.
The more sources incident on k, the greater the value of G, and thus the warmer the surface.
So if you have a single source J(a) that yields irradiance G(a) of 100 W/m2 on the surface of k, and then another flux from J(b) that yields irradiance G(b) 200 W/m2, these get summed. You don’t discard the cooler source from the equation. Surface k does not suddenly become reflective to the first flux just because a higher value flux is added.
If you can see a different conclusion from the math in either document, please point it out with specificity, not rhetoric.
https://www.thermopedia.com/content/70/
https://www.eng.auburn.edu/~dmckwski/mech7210/radexchange.pdf (p. 13: G is replaced with H in the equations)
Sorry barry, but you’re still locked on to your cult beliefs. You don’t understand ANY of the related physics so you search the Internet for things you hope confirm your beliefs. But, you can’t understand what you find.
If fluxes added the way you believe they do, then you could boil water with ice cubes. You’re so braindead you don’t even know you believe that.
That’s why this is so much fun.
By now, no one here is fooled by Clint’s empty insults any longer.
It is obvious to all that has no real science to offer.
Nate, where’s your technical source that verifies two 315 W/m^2 fluxes can heat a surface to 325 K?
You don’t have one. You’re just trolling, as usual.
Barry’s source, this proves you dont know what you are talking about.
“Finally, the incident flux (irradiance) on surface k can be found. It is the sum of the radiation leaving each other surface j in the enclosure that is incident on surface k. The fraction of the total radiant energy (radiosity) leaving surface j that arrives at surface k is, by definition, the configuration (shape) factor Fj-k, so the energy reaching surface k from j is JjAjFj-k. The total energy reaching k from all surfaces is then”
See eqn 3.
Troll Nate, Equation 3 is nothing more than the arithmetic sum. It has NOTHING to do with raising temperature. Temperature isn’t even mentioned.
Like barry, you don’t understand any of this. You’re trying to get a 2-meter tall boy by adding heights of two 1-meter boys.
Thanks for being such a good example of a braindead cult idiot posing as an anonymous troll.
It’s right there in the math, Clint.
And it’s in the math of dozens of physics articles I’ve looked at in recent weeks.
Either radiative exchange expressed as the the difference between 2 surface’s temperatures to the 4th power…
Q = σ A (T₂⁴-T₁⁴)
Or as the expression purely of radiosity and radiance as expressed above.
qₖ = Jₖ-Gₖ
You see these equations everywhere in papers, physics texts, and articles on radiative exchange.
You just need to accept that radiation is not heat (that is BASIC), and that just because there is a two-way transfer of radiation, does not mean that heat, in the classic sense, flows from cold to hot.
Here are more texts with those equations and derivations of them, eg, with and without view factors:
https://www.engineersedge.com/heat_transfer/black_body_radiation.htm
https://www.engineeringtoolbox.com/radiation-heat-transfer-d_431.html
https://openoregon.pressbooks.pub/bodyphysics/chapter/space-blankets/
Here is a university physics text with a test and solution:
Calculating the Net Heat Transfer of a Person
What is the rate of heat transfer by radiation of an unclothed person standing in a dark room whose ambient temperature is 22.0°C? The person has a normal skin temperature of 33.0°C and a surface area of 1.50/m². The emissivity of skin is 0.97 in the infrared, the part of the spectrum where the radiation takes place.
We can solve this by using the equation for the rate of radiative heat transfer.
Solution
Insert the temperature values T₂=295K and T₁=306K, so that
Q/t = σεA (T₂⁴-T₁⁴)
https://openstax.org/books/university-physics-volume-2/pages/1-6-mechanisms-of-heat-transfer
The solution for this using the area of the person’s skin, its emissivity of 0.97 and the difference between the absolute temps of the walls of the room and the person (to the fourth power), and the S/B constant, yields…
-99W
This is the NET exchange of radiation. It is negative because the person is losing heat to the cooler surrounds.
Look! Radiative exchange results in heat flowing from hot to cold! No laws broken just because the radiation is exchanged between both hot and cold.
If you remove T₂ from the equation, you will get the WRONG result.
And if the temperature of the walls is different, then the rate of radiative heat loss will be different. That is what these equations show you.
If the walls are of higher temperature, the radiative loss of the person will be less.
It’s right there in the math!
All the links above corroborate the NET transfer of radiation via the math.
I know you can’t accept this, but you are disagreeing with Roy, with Clausius, with universities all over the world, with engineering departments, with every physics text on radiative transfer I can find. I’ve now linked at least a dozen university courses and online engineering toolkits here backing up what Tim, Nate (Clausius and Roy) and me are saying
And in the face of all this you have not offered
One.
Single.
Physics text.
To corroborate what you are saying.
You keep talking about “cults.”
There’s nothing more culty to me than a small group of people on the internet who deny reams of expert evidence countering their views who can supply not on reputable source to back up their own.
Radiation is not heat. 2-way radiative exchange always results in heat flowing from hot to cold, as long as the radiation from the warmer body is greater than the radiation from the cooler body.
Which is exactly what all the radiative transfer equations show.
You just don’t understand it, I guess.
“Troll Nate, Equation 3 is nothing more than the arithmetic sum. It has NOTHING to do with raising temperature. Temperature isnt even mentioned.”
So you admit that your oft repeated claim that fluxes hitting a surface don’t sum is completely FALSE?
Well thats a step forward.
“You cant do that because fluxes dont simply add. ”
Case in point.
Now, you move the goal posts.
barry and Nate seem to be competing for who is the most braindead cult idiot.
I’m glad I don’t have to be the judge….
And here’s some more reality barry and Nate can attempt to distort/deny/pervert:
https://www.drroyspencer.com/2022/06/uah-global-temperature-update-for-may-2022-0-17-deg-c/#comment-1312486
May the best braindead cult idiot win.
Gordon,
“You will find references to the intensity of EM required in order that it be absorbed but I am not going to spend my time trying to satisfy your demands. It it interests you, do what I doresearch it.”
You are seriously confused.
Try to learn what intensity means with respect to EM.
It’s the wavelength, or energy, or frequency of EM that determines whether it will be ab.sorbed or not.
Not the intensity.
Please provide your source, cause I can’t find it.
ENSO forecast updates:
“The ENSO Outlook remains at LA NIÑA.
While some La Niña indicators such as tropical Pacific sea surface temperatures and equatorial cloudiness near the Date Line have remained similar in strength over the past fortnight, waters below the surface of the tropical Pacific have continued their gradual warming away from La Niña levels.
Most models show a return to neutral El Niño–Southern Oscillation (ENSO) during winter. However, even if La Niña eases, the forecast sea surface temperature pattern in the tropical Pacific still favours average to above average winter rainfall for eastern Australia.”
http://www.bom.gov.au/climate/enso/outlook/
“The subsurface warm water volume observed in the western equatorial Pacific is expected to migrate eastward and slightly increase SSTs in the eastern parts in boreal summer. JMA's seasonal ensemble prediction System predicts that the NINO.3 SST slightly increases in boreal summer, then persists to be close to -0.5°C until boreal autumn. In conclusion, the La Niña conditions are likely to continue (70%) until early boreal summer, then it is equally likely (50%) that the La Niña conditions continue or ENSO-neutral conditions present until boreal autumn.”
https://ds.data.jma.go.jp/tcc/tcc/products/elnino/outlook.html
“Though La Niña is favored to continue, the odds for La Niña decrease into the late Northern Hemisphere summer (58% chance in August-October 2022) before slightly increasing through the Northern Hemisphere fall and early winter 2022 (61% chance).”
https://www.cpc.ncep.noaa.gov/products/analysis_monitoring/lanina/enso_evolution-status-fcsts-web.pdf
Predictions will firm up shortly, as we’re passing the (NH) ‘spring barrier’ that makes forecasts more uncertain prior.
Finding links you don’t understand won’t give you any credibility, barry. That’s the same trick used by Bindidon and Norman.
Your cult is running out of tricks.
Doesn’t matter Barry, we have established natural variability is controlling warming/cooling.
Since the 2016 extreme EN, we’ve had a 5 year flat trend. That was preceded by an 18 year flat trend. Of the 24 years since 1998, most of it has represented a flat trend.
Bin&Barry copy/paste forecasting services , no brains required
And what else do YOU do, Ebaby?
Just laughing , Ha Ha Ha ,
Bindiclowns forecasting comedy is on
https://www.drroyspencer.com/2022/02/uah-global-temperature-update-for-january-2022-0-03-deg-c/#comment-1169482
Again Ebaby, if you are not too dense, look at the two NOAA forecasts and compare them by superposing.
https://i.postimg.cc/dVfs0sCJ/nino34-Mon030422.gif
https://i.postimg.cc/pLww7p85/nino34-Mon020622.gif
But maybe you are really too dense, and even don’t understand what I’m showing…
And the forecasts for Nino 1+2 at 10 day intervals?
https://www.cpc.ncep.noaa.gov/products/CFSv2/imagesInd1/nino12Mon.gif
https://www.cpc.ncep.noaa.gov/products/CFSv2/imagesInd2/nino12Mon.gif
https://www.cpc.ncep.noaa.gov/products/CFSv2/imagesInd3/nino12Mon.gif
What do you think will happen in the next 10 or 20 days?
You’re welcome, Eben.
The ankle biters are in full force tonight.
Barry must have hit a nerve!
You do know that BOM defines La Nina as being -0.8C surface temperatures whereas the rest of the world defines it as being -0.5C?
https://www.cpc.ncep.noaa.gov/products/analysis_monitoring/lanina/enso_evolution-status-fcsts-web.pdf
30 May 2022
“Though La Nia is favored to continue, the odds for La Nia decrease into the late Northern Hemisphere summer (58% chance in August-October 2022) before slightly increasing through the Northern Hemisphere fall and early winter 2022 (61% chance)”
“Though La Nina is favored to continue, the odds for La Nina decrease into the late Northern Hemisphere summer (58% chance in August-October 2022) before slightly increasing through the Northern Hemisphere fall and early winter 2022 (61% chance)”
3 month evolution of La Nina according to the ESNO blog at NOAA, climate.gov
https://imgur.com/gallery/8AC3rda
Sub-Surface Temperature Departures in the Equatorial Pacific
https://imgur.com/a/co4uEGc
CPC/IRI Probabilistic ENSO Outlook
Updated: 12 May 2022
https://imgur.com/a/GOIBUth
“Though La Nina is favored to continue, the odds for La Nina decrease into the late Northern Hemisphere summer (58% chance in August-October 2022) before slightly increasing through the Northern Hemisphere fall and early winter 2022 (61% chance)”
FINALLY you recognise that there is only a 60% chance of your prediction eventuating.
Only a 60% chance is better odds that most gambling tables offer.,
Still outside the IPCC range for likeliness.
We will see later this year, won’t we.
“Would have been likely” isn’t defined in the IPCC glossary.
Later this year is defined for evreybody.
“We will see later if it was likely” would not make any sense.
Neither would be to feel vindicated if it happens.
Just like investing, science is a numbers game.
We will see later this year if it was actually likely that La Nina would continue into this winter.
Oh, Richard.
Willard, please stop trolling.
RLH,
“You do know that BOM defines La Nina as being -0.8C surface temperatures…”
Yep. I mentioned that ages ago, and several times. BoM also factor in the SOI in their forecasts.
“…whereas the rest of the world defines it as being -0.5C?”
JMA uses the NINO3 region, instead of NINO O3.4 like NOAA and BoM.
MEI use 5 variables for the NSO index, and there is no SST threshold in their analysis.
I think you know a little of what NOAA does, and fuck all about “the rest of the world.”
But you must turn an update into a pissing contest, so off you go, Galahad.
There is actually a good reason for the BOM using a +0.8 threshold (perhaps you’ve mentioned in before).
Very weak La Ninas actually have a drying effect in southeast Australia. It is not until it reaches about -0.8 that things start getting wet. RLH fails to realize that the BOM is reporting for Australians, not the world.
If these people actually looked at all the data instead of just the ONI they would see that most events that just scrape 0.5 don’t get in lockstep with the SOI.
“RLH fails to realize that the BOM is reporting for Australians, not the world.”
But you use it to describe world events.
I said only that their target group is Australians, not that it is not applicable globally. My only intention was to explain the 0.8.
But you used it to describe world events anyway.
What world events did he describe re the BoM metric?
The criteria for ENSO events is different for every forecasting group internationally, as far as I’m aware. There is certainly no agreed upon standard. And each region tailors their criteria to local interests. These reports aren’t designed for keyboard climate junkies, they are for farmers and other stakeholders that have a vested interest.
So when you look at ENSO FAQs from various countries, those countries will describe local impacts. For Australia, flood and drought, mainly, for the US, drought, tornadoes and Atlantic hurricanes are the main interest.
I have to assume you are American, RLH, and have that typically insular US habit of thinking that your country’s systems, methods etc are or should be the universal standard.
I didn’t know that was the reasoning for the 0.8 threshold, Antonin. do you have a link to that information handy?
I can’t recall where I saw it – it was a few years ago. But I’m pretty sure it was someone from the BOM explaining it.
“Average of international model outlooks for IOD Issued 24 May 2022
October IOD index: −1.5 C”
And what do you suppose that means, Richard?
That was the BOM looking ‘outwards’.
Current SOI
https://climatedatablog.files.wordpress.com/2022/05/soi.jpeg
barry…”If the EM is from a cooler body, the electrons in the hotter boy cannot absorb the EM due to the basic laws of quantum theory. The EM lacks the intensity and frequency to affect electrons which are already at a higher energy state.
and
Energy cannot be transferred from an area of lower potential energy to an area of high potential energy.
This is just plain wrong”.
***
You make an assertion but cannot back it up with scientific reasoning. My first claim above comes directly from Bohr’s theory.
My second claim is grossly apparent to any objective observer. You claim my references to potential energy come from electronics theory, not surprising since electronics theory is based on quantum theory.
However, consider a 100 kg bolder at the edge of a 100 metre cliff. It has a potential energy of mgh. If it is levered off the cliff and falls straight down, it has a balance at each height of potential energy to kinetic energy. Just before it touches the ground, its KE is max and it PE is minimum.
Once it comes to rest, its PE is mgh less than it was at the top of the cliff. It is not possible for the boulder to be raised onto the cliff without external work being done on it. That’s one example of energy transfer being impossible from a lower state of potential energy to a higher state, by its own means.
Another example is water. It cannot flow from a state of lower potential energy to a state of higher potential energy. In the electrical/electronics field, voltage is the potential difference between two points in a circuit. If the voltage is taken, open-circuit, across a battery, it represents the work done per coulomb of charge to raise those charges to a higher potential energy level at the negative electrode.
Once again, those charges can only flow from the higher potential level to the lower potential level.
With radiation, it’s the same thing. When energy is added to a mass, the electrons in the mass jump to higher energy levels. That is represented by an increase in heat, making the body hotter. Meantime, the electrons in a cooler body are at lower energy levels. If that body radiates EM, the EM has an intensity, E, and a frequency, f, based on the energy levels of the cooler body.
Those energy levels are potential energy levels. With PE in an atom, an infinite distance from the nucleus is rated as zero PE. Toward the nucleus energy levels become more negative till the lowest state, or ground state is reached at the most negative value.
Each energy level has a kinetic energy associated with it. Unlike a boulder falling off a cliff, each level is quantized and the KE is based on the mass and velocity of the electron in each level as KE = 1/2mv^2. The frequency in E = hf is also based on the electron velocity per energy level, which changes level to level.
If an electron absorbs a quantum of energy, it gains that energy and moves to a higher energy level. The gained energy is KE, therefore electrons have higher KE s at higher enrrgy levels.
“You make an assertion but cannot back it up with scientific reasoning.”
I’ve backed it up with physics texts many times, and reasoning many times.
All objects emit at a broad range of frequencies, not just one frequency. Absorbing bodies absorb at the frequencies that their surface optical properties, or molecular structure, is able to absorb.
The temperature of a body has almost nothing to do with how much radiation it absorbs, transmits or reflects.
That’s why a mirror will reflect the sun, even though it as much colder. Its colder temperature doesn’t make it absorb – its surface optical properties make it reflect sunlight.
A heated window will admit the light of a cool LED light, even though the radiation from the LED comes from a colder surface than the window.
We know that reflection is not temperature dependent. We know that transmission is not temperature dependent.
But as soon as we talk about ab.sorp.tion, people turn into idiots because anti-AGW makes them idiots.
Ab.sorp.tion is not temperature dependent either.
A CO2 molecule absorbs at a peak of around 15um regardless of the source or the temperature of the ambient air in which the CO2 molecule sits.
A CO@ molecule will absorb at a peak of 15um whether the source is a -10C or 10C. All that is different is that the PEAK intensity from either source is at slightly different wavelengths. There is still plenty of 15um wavelength given off by any surface in the range of earth temperatures.
You tried to argue that atoms determine ab.sorp.tion, and that molecules don’t. I showed you a physics text explaining how this is not the case, and linked a spectroscopy database showing different ab.sorp.tion profiles for 2 different molecules that contained the same variety of atoms and no others.
If only atoms were responsible for ab.sorp.tion then these should not have been different.
You’ve been provided empirical spectroscopy to disprove your nonsense, physics texts to confirm that radiation is absorbed both ways, and ‘reasoning’ to unlace the bone-headed wrongness you and your ilk suffer from all because you don’t like AGW, and you need to make shit up to pad your rejection.
In all this time, you have provided zero. references.
Nada. Zilch. Nothing.
You have written reams of screed without an ounce of substantiation, while I and others have provided plenty.
Your claims remain unsupported despite 2 years of repeated requests.
Because you cannot possibly back up what you’re saying with any formal physics text.
Rejected.
barry is abusing his keyboard, again.
He throws out so much nonsense that no one has time to debunk it all. Plus, he mixes correct with incorrect, to add to the confusion. I only have time to respond to two of his errors:
barry claims: “The temperature of a body has almost nothing to do with how much radiation it absorbs, transmits or reflects.”
Absorp.tion and emission are both governed by the type of surface (molecules involved) AND the surface’s temperature. An iron bar does not emit visible light, but put it in a campfire for a few minutes and you can see it in the dark — same object, different temperature.
Next, barry confuses emission from LEDs with natural emission. An LED emission does NOT obey Stefan-Boltzmann Law.
And barry is still unable to provide a competent source for his claim that two 315 W/m^2 fluxes can heat a surface to 325 K. He fully believes that, not realizing if it were true then ice could boil water.
He can’t understand any of this, and he can’t learn.
Why so many words just to troll, Pup? Eli reduced the problem to a very simple equation. We can see why Kiddo will fail to solve it, but you? If you need, you could do like Chic and build a spreadsheet. Like this:
https://i.postimg.cc/SsqjbqzF/calculations-Insulation-via-Green-Plate.jpg
Carry on.
Yes worthless Willard, that’s Troll Trick #142 — “Provide a link to something you don’t understand”.
We’ve seen them all before.
You should have clicked on the link before walling yourself in your usual retort, Pup.
What will it be when you will lose your trolling around a simple algebraic problem humans solved more than 150 years ago?
If only Sky Dragon Cranks had a Master Argument
Troll Trick #37 — “Distract with incoherent rambling”.
Here’s incoherent rambling, Pup:
https://www.drroyspencer.com/2022/06/uah-global-temperature-update-for-may-2022-0-17-deg-c/#comment-1308701
Here’s what’s not incoherent:
Willard, please stop trolling.
“An iron bar does not emit visible light, but put it in a campfire for a few minutes and you can see it in the dark same object, different temperature.”
You are talking about emission, not ab.sorp.tion, idiot.
Ab.sorp.tion does not depend on the temperature of the receiving surface.
I’ve provided quit enough references.
Provide one formal reference that backs your assertion here.
Just one reputable source will do.
If you don’t, then we know exactly what your opinion is worth.
barry, for a surface at equilibrium temperature, absorp.tion equals emission.
You don’t understand any of this.
Roy Spencer:
“…the rate at which a layer of the atmosphere absorbs IR is relatively independent of its temperature; but the rate at which it loses IR is very dependent on temperature.”
https://www.drroyspencer.com/2015/01/how-the-climate-system-works-for-dummies/
Now you have to tell us that Roy Spencer is wrong.
This will be fun.
Clintionary.com
“You dont understand any of this.”
– I (Clint) don’t understand any of this. Typically followed by no explanation whatsoever.
barry, gas molecules are not the same as a solid surface.
You need to study more “for dummies” stuff, before you can advance.
Differentiating between solids and gases on this are you, eh Clint?
Let’s set aside that you are wrong and just follow your logic through.
By making that distinction you infer that the temperature of a solid surface is very important for ab.sorp.tion, but the temperature of a gas is not.
So the ab.sorp.tion of a layer of atmosphere is not dependent on its temperature. Thus warmer layers of atmosphere can absorb the radiation from cooler layers.
Did you really mean to infer that warmer layers of the atmosphere absorb IR radiation from cooler layers, or would you like to rescind that comment?
If you don’t rescind it, then GHE works. If you do, then you are saying Dr Roy Spencer doesn’t know what he’s talking about.
I mean you already believe he doesn’t know what he’s talking about regarding atmospheric physics, as he believes the GHE and the enhanced GHE works.
Guess you forgot that Roy is wrong this time?
Looking forward to a clear explanation without any squirming waffle.
barry, so you don’t get any more confused, gas molecules are not the same as a solid surface.
“…the rate at which a layer of the atmosphere absorbs IR is relatively independent of its temperature.”
And you’re saying Roy’s view is correct, because “gas molecules are not the same as a solid surface.”
That’s very interesting. Are you absolutely sure you don’t want to disagree with Roy about atmospheric absorbance being independent of the temperature of the absorbing layer?
Because that means that there is no bar to warmer layers of atmosphere absorbing radiation admitted from cooler layers above.
I mean, Roy believes that “back radiation” occurs, but I am surprised that you would agree.
Are you sure you don’t want to clarify?
barry, you’re all over the place. You can’t seem to land on one spot because it’s wrong, so you keep flitting to the next spot. Stay with one issue. When it gets shot down, learn!
Two 315 W/m^2 fluxes arriving the same surface can NOT raise the temperature to 325 K. Do you understand that yet?
LED emits light when it absorbs energy and goes from zero to one state.
Same with Iron Bar. It absorbs energy and when it gets from zero state to one state it emits energy.
The only difference is that it takes longer for iron to get from zero state to one state.
Barry is right; The temperature of a body has almost nothing to do with how much radiation it absorbs, transmits or reflects.
Thanks for verifying your ignorance of the relevant physics, Ken.
Troll Trick #37 “Distract with incoherent rambling”.
I’ll be sure to let you know when I think you have anything relevant to say.
To presume that you know anything about relevance would go against almost every single comment of yours, Kennui.
Willard, please stop trolling.
The temperature of a body has nothing to do with how much it absorbs or emits? Wrong.
Powerful argument.
Consider the case of your basic CO2 molecule.
At zero state it absorbs energy 15um meter.
As it goes from zero state to one state it expands as per gas law rising in elevation, transferring energy to O2 and N2 via collision and as per gas law reduces temperature.
Clearly the temperature of a body has nothing to do with how much it absorbs or emits.
Clearly you don’t understand radiative physics or thermodynamics.
We’ve already learned you know NOTHING about orbital motion either.
“But as soon as we talk about ab.sorp.tion, people turn into idiots because anti-AGW makes them idiots.”
Yep, that explains it.
barry, please stop trolling.
–LUXURY BELIEFS: Michael Barone on Politics as the Leisure of the Theory Class.
Politics has increasingly become, for many Americans, the leisure of the theory class. Thats a phrase from the early 20th century sociologist Thorstein Veblen, which I turned on its head in a recent column. He was condemning the showy consumerism of the contemporary rich for having no economically practical purpose. I, on the other hand, was describing the political preoccupations of contemporary people, mainly high-education liberals but also low-education populists, as having no practically achievable goals.–
https://instapundit.com/
–Read the whole thing.
Posted at 9:14 pm by Ed Driscoll
So, Theory Class reminded me, of this place.
But I read whole thing, and when did Americans have practical achievable goals?
Or Michael Barone seems to suggest something “recently” has changed in American politics.
It seems to me the only practical achievable goals were only made by constitutional amendments. And something makes me think, Mr Barone would regard such a political process as a mad idea.
Or Mr Barone is pundit and seems to think his punditry is to somehow useful to reach practical achievable goals.
It hasn’t been, and won’t be, but I find it interesting sometimes, but not practical, in terms of politically.
“Or Michael Barone seems to suggest something recently has changed in American politics. ”
I think I can can date this quite closely.
It was the day in 2009, soon after the Presidential election , that the Republicans told Nancy Pelosi that they would oppose all legislation put forward by the Obama administration.
Before 2009 the two parties tacitly agreed to pass routine legislation, though they fought over contentious matters.
Since then, even this tacit relationship has broken down and both sides are locked into absolute non-cooperation.
Nancy Pelosi was first politician in history which “needed” this explained to her from her opposition party politicians?
It seems this is quite unlikely.
[[But it’s almost plausible, that it might have been needed to be explained to the Junior Senator, Obama, who just became the US President.
Who was, btw, later, was called by the worst US president, Jimmy Carter, as the worst president. And Obama has said some things regarding his vice President, Joe Biden, which should have been, perhaps, heeded in regards to Joe’s performance as Vice President.
And it seems that Joe can’t recommend his Vice President- though, also, Joe is well known to say, almost anything.]]
“Nancy Pelosi was first politician in history which needed this explained to her from her opposition party politicians?”
It’s probably the first time it happened.
Before then there was enough cooperation to allow the federal government to function. Since then, nothing.
Benjamin Franklin designed the United States to have a dysfunctional federal government, but this is bad even by his standards.
Well, it’s possible other US president had different approaches.
Hmm:
Youngest Presidents:
1. Theodore Roosevelt 42 322
2. John F. Kennedy 43 236
3. Bill Clinton 46 154
4. Ulysses S. Grant 46 236
5. Barack Obama 47 169
6. Grover Cleveland 47 351
7. Franklin Pierce 48 101
8. James Garfield 49 105
Well, not the youngest, but others might of had more experience.
Grant had experience as US general but some were disappointed in Grant as president.
I don’t many are happy with Joe Biden and he had endless amounts of experience.
I don’t know much about it, other that Congress ignored Obama’s NASA budgets.
Clint R says:
June 3, 2022 at 6:20 PM
A vacuum aint insulation to radiative flux, braindead bob.
You dont understand any of this.”
But my vacuum flask does a lovely job of keeping my tea warm. Isn’t that insulation?
Ent, your vacuum flask doesn’t make your tea hotter than when you put it in.
You don’t understand any of this.
It would if there was an immersion heater in my thermos, to make it more like the blue green plate experiment.
Seems you have a problem looking at the big picture and just focus on the fine details and ignore the rest.
braindead bob brings in an external energy source to help his nonsense.
That’s why it’s all nonsense. And the fact that he can’t understand it is why this is so much fun.
Clint R
Instead of endless babbling can you point out why bringing in an external source to warm tea in a vacuum flask makes it warmer is nonsense. I really don’t follow your logic or thought process. Can you explain or will you just ignore?
Norman, you’re a complete phony, remember?
You can’t support your own nonsense and you don’t understand physics or thermodynamics. You make things up, get caught, and then resort to insults and false accusations.
But, I’m enjoying your meltdown.
Clint R
Just as you are wrong about science and physics, you are also wrong about your incorrect opinions of me.
The strange thing is you describe you actions completely and accurately and then you paste your own flaws on to me.
Exactly you describe your own ignorance. YOU: “You cant support your own nonsense and you dont understand physics or thermodynamics. You make things up, get caught, and then resort to insults and false accusations.”
This is what you do on a regular basis. You can’t understand anything about any physics. You make things up such as “fluxes don’t add” or the valid radiant heat transfer equation is “bogus”
Then of course you insult in almost every post of yours “braindead cult member”.
You do all this and yet you can’t see it. That is because you are a bot and have not been programmed to examine yourself. You are reflecting things others have said about you and in your program you repeat it back at them. Odd program you are. Not much good for anything. There are far superior bots out there.
Clint R,
We were discussing the Green Plate Effect, which has an external energy source.
Why can’t you keep on the topic?
All of that keyboard abuse Norman, yet you still can’t support your made-up physics. You can’t find your bogus “real 255 K surface”, and you can’t find any source that two 315 W/m^2 fluxes will heat a surface to 325 K.
You’ve got NOTHING, and you’re a complete phony. But your meltdown is fun to follow.
Clint R
Sorry bot I did indeed support your endlessly repeating points. You state them, I explain them very thoroughly. You can’t understand the supporting points and go on later to repeat the points, over and over.
That is why I perceive you are a bot and not human. Your behavior displays the properties of a program that continues to loop through the same routine.
I wasted much time explaining the points to you but your program is not able to assimilate actual information so it repeats the same thing over and over.
It’s not your opinions or beliefs that matter, Norman.
You can’t find your bogus “real 255 K surface”, and you can’t find any source that two 315 W/m^2 fluxes will heat a surface to 325 K.
Until you do, you’ve got NOTHING.
entropic…”But my vacuum flask does a lovely job of keeping my tea warm. Isnt that insulation?”
***
The tea would be toasty at first coffee break, a bit cooler at lunch, luke warm by afternoon coffee, and likely cold by the same night.
That’s with a silver lining inside the flask, presumably to prevent radiation, and a decent vacuum between flask walls. Unfortunately, the flask has to be mounted on something and allow conduction at top of flask.
Another normal year for Lake Mead.(sarc/off)
https://www.bbc.co.uk/news/world-us-canada-61669233
And this is different from normal La Nina years how?
If decade-old murder victims are being uncovered for the first time, then it can’t be like “normal” La Ninas now can it. Unless you believe the last La Nina was decades ago.
It is the one of the rare double dip La Nina, does that matter?
Remind me.
When were the last three double dip La Ninas and what was the minimum level of Lake Mead for each of them?
Which of those La Ninas reduced the lake level below the current 1498 feet.
Ask climate.gov
https://imgur.com/gallery/8AC3rda
Entropic man
” … and what was the minimum level of Lake Mead for each of them?
Which of those La Ninas reduced the lake level below the current 1498 feet. ”
I notice that although your comment has been answered, your question in fact has not been.
How many double dip La Nina has there been since the lake was opened?
Antonin Qwerty
Here is a chart allowing to compare all stronger La Nina events since 1900, using the MEI data (Multivariate ENSO Index):
https://i.postimg.cc/Jzr88YzK/MEI-superposed-La-Ninas.png
The last La Nina really deserving its name was 2010-2012:
https://psl.noaa.gov/enso/mei/img/meiv2.timeseries.png
The MEI data shows that the last month in a double dip was indeed unprecedented (i.e. below all others for that stage in the cycle).
La Nina has become more frequent in the last 25 years.
People like you always select that period perfectly fitting their narrative.
Thus,
https://drive.google.com/file/d/12F2SO09XyelVRnCSeHF5bUKuDdd1IoNV/view
is much more relevant than
https://drive.google.com/file/d/1OHWgzgJgpPucSyVxd9ttbMDOD-aBziI6/view
Only recent data count for you, doesn’t it?
Like in
https://www.woodfortrees.org/plot/uah6/plot/uah6/to:2016/trend/plot/uah6/from:2016/trend
and of course discarding the fact that the same happened FOUR times in only 43 years.
List of all years with a yearly UAH LT anomaly lower than those in the five years before:
1985
1992
2000
2008
Oh! The supermegacool 2021 isn’t even in the list!
Why?
And another proof of your very selective view: suddenly, MEI values are of interest only in case of double dips, aren’t they?
2010 7 :-2.43
2010 8 :-2.40
2010 9 :-2.28
2010 10 :-2.18
2010 11 :-2.04
2010 12 :-1.91
2011 1 :-1.83
1988 8 :-1.79
2011 3 :-1.79
1988 7 :-1.77
1988 9 :-1.77
1998 8 :-1.74
2011 4 :-1.74
2011 2 :-1.63
1988 11 :-1.61
2022 4 :-1.60
Au royaume des aveugles, le borgne est roi, dit-on en France.
Oh Noes! I forgot to add the historical MEI data…
1893 7 :-2.56
1893 8 :-2.52
2010 7 :-2.43
1893 9 :-2.43
2010 8 :-2.40
1893 6 :-2.36
2010 9 :-2.28
1975 10 :-2.27
1975 11 :-2.19
1974 2 :-2.19
2010 10 :-2.18
1916 9 :-2.17
1893 10 :-2.17
1916 8 :-2.10
1974 3 :-2.09
1955 11 :-2.08
1975 9 :-2.06
2010 11 :-2.04
1974 1 :-2.02
1910 7 :-2.01
1910 6 :-1.99
1971 4 :-1.98
1955 12 :-1.97
1875 7 :-1.96
1955 10 :-1.96
1893 5 :-1.94
1917 1 :-1.92
1910 5 :-1.91
2010 12 :-1.91
1975 12 :-1.91
1916 12 :-1.90
1955 6 :-1.89
1876 5 :-1.88
1971 3 :-1.87
1876 6 :-1.85
1893 11 :-1.83
2011 1 :-1.83
1910 4 :-1.81
1875 6 :-1.81
1974 4 :-1.80
1950 8 :-1.80
1988 8 :-1.79
2011 3 :-1.79
1916 10 :-1.77
1988 7 :-1.77
1988 9 :-1.77
1973 12 :-1.77
1917 2 :-1.76
1971 5 :-1.76
1976 1 :-1.76
1956 1 :-1.76
1909 9 :-1.75
1955 7 :-1.75
1892 10 :-1.75
1917 5 :-1.75
1975 8 :-1.74
1973 10 :-1.74
1998 8 :-1.74
2011 4 :-1.74
1890 2 :-1.73
1917 6 :-1.71
1876 4 :-1.69
1892 11 :-1.68
1916 11 :-1.68
1909 8 :-1.67
1973 9 :-1.66
1910 8 :-1.65
1955 9 :-1.65
1894 4 :-1.65
2011 2 :-1.63
1976 2 :-1.63
1893 2 :-1.63
1910 3 :-1.62
1892 9 :-1.62
1956 2 :-1.61
1910 10 :-1.61
1988 11 :-1.61
1917 3 :-1.61
1909 10 :-1.60
2022 4 :-1.60
Feel free to search for other ‘unprecedented’ years in La Nina double dips!
Since I’m not sure you’ll be able to do the job, I give you the best example:
1973 10 :-1.74
1973 12 :-1.77
1973 9 :-1.66
1974 1 :-2.02
1974 2 :-2.19
1974 3 :-2.09
1974 4 :-1.80
1975 10 :-2.27
1975 11 :-2.19
1975 12 :-1.91
1975 8 :-1.74
1975 9 :-2.06
1976 1 :-1.76
1976 2 :-1.63
Got it, Linsley-Hood?
Blinny spews data to fill up the screen but does not prove anything as usual.
La Nina has become more frequent in the last 25 years. Fact.
Didn’t your article say that the ‘trend’ was almost statistically significant?
Which means that greater frequency of la Ninas is not yet established as being beyond chance.
You have no rigour, Richard.
Judge for yourself.
https://arachnoid.com/NaturalResources/charts/Lake%20Mead.png
The current daily figure is 1049 feet.
Last time it was this low the lake was being filled for the first time.
Note the 1050 foot level which triggers reductions in water supply and power generation. As a water source Lake Mead is spent.
The BBC report is misleading, it suggests that the lake is low due to a severe drought this year, a reader would assume that ordinarily the lake is full, it omits the fact the lake has been struggling to supply and the level dropping steadily for 20+ years. Most of the water is used by agricultural irrigation which has increased significantly, draining the reservoir. This has been coming for a while, regardless of rainfall. The BBC has exploited it to make a trendy “climate change is going to kill us all” story.
Thanks for pointing out the problem when climate change meets population growth.
https://red.msudenver.edu/2022/water-wars-come-to-colorado/
https://en.m.wikipedia.org/wiki/Colorado_River_dispute
Since you have been unable to amicably share the Colorado river for more than a century I doubt you’ll sort yourselves out now.
A reservoir drops because water is extracted faster than it is replenished.
The graph indicates that the Western US has been doing this to Lake Mead for 20 years.
The lake has now reached the level which triggers Stage III water conservation measures for the first time since the Hoover Dam was built.
If it’s not climate change, then it must be bad management. Don’t you Yanks ever think ahead?
Only when planning an insurrection.
Does that happen frequently in the USA?
They tried one in January 2021 but it didn’t work.
And the time before that?
In January 2021, the Republicans forgot to bring guns.
If shooting actually started in January 2021 then the insurrectionists would have lost.
“If shooting actually started in January 2021 then the insurrectionists would have lost.”
So, the Republicans were thinking ahead and decided not to bring their guns to the insurrection?
Republicans {and all Americans} believe it is their right to bear arms, because, such arms would allow citizens to do an insurrection, but they thought they could have lost if they brought their guns to an insurrection?
Or perhaps Republicans didn’t know that an insurrection could possibly happen, and were smart enough not to bring any of their guns, and because they didn’t bring guns, that helped them to get closer to something which was essentially, an insurrection, and so therefore, won, rather not getting so far, if they made the mistake of bringing some guns.
So, they win by having hundreds detained without trial, will be famous for doing the only insurrection which could have won- and it could only be done without using any guns.
{Sounds like a Hollywood movie}
The lake is a managed resource, so the lake level is determined by some function of inflow and outflow. It is the case that inflow over the past two decades is significantly below the historic average, regardless of how the outflow is managed.
In that sense, the BBC is correct in citing the long and ongoing drought as a major contributing factor.
Upper Colorado River Basin Hydrology
“It is the case that inflow over the past two decades is significantly below the historic average”
Is that anything to do with La Nina becoming more frequent in the last 25 years?
And what causes La Ninas to become more frequent?
Well La Nina causes cold water in the central Pacific.
P.S. Well the models say that they shouldn’t (become more frequent that is).
Entropic man
I notice that although your comment has been answered, your question in fact has not been.
Natural cycles.
As long as it is not ours, let them fight. Some light reading:
https://www.thecanadianencyclopedia.ca/en/article/us-thirsts-for-canadian-water
Canadian water for the Canadians!
The sense of entitlement by the American author, the veiled accusations that Canadians waste water. Ten there is the insinuation that their reluctance is emotional and not rational. Finally the veiled threats that the US will steal water anyway
Enough to make every Canadian intransigent in opposition to water exports.
As a Canadian, I am not interested in shipping water to states like Nevada and California when all they’ll use it for is bigger swimming pools and car washes.
When I took a year of geology, we studied the impact of damming rivers. A dam changes the profiles of rivers downstream. In the case of Lake Mead, the Hoover Dam, which created Mead, has opened the Colorado River to water loss through massive evapouration. That water should eventually condense and fall as rain elsewhere, but where?
Some are spouting climate change but no one can explain how a recovery warming of about 1C since 1850 could possibly affect climates on such a large scale.
> no one can explain
Start here, Gordo:
https://www.ipcc.ch/sr15/
Notice how you’re wrong by at least 50%.
Willard, you don’t seem to understand. I regard anything from the IPCC as fiction, propaganda, and lies. That’s especially true for the Summary, written by 50 politically-appointed lead authors whose political opinions override the review work done by 2500 reviewers. The IPCC are corrupt from the ground up.
The IPCC are a load of cheating scumbags. Their garbage is blamed on left-wingers, but the IPCC was actually formed based on the urgings of uber-right winger Margaret Thatcher, a former Tory UK Prime Minister. Old Iron-Pants Thatcher was scheming to outlaw coal unionists by creating the image that coal was dirty fuel and should be abandoned.
Thatcher did not give a hoot about the environment, her presentation to the UN was political. Of course, the pathetic UN had been looking for that kind of cause since the ’60s and stuck to it like doo doo to a blanket. Thatcher had her protege, John Houghton appointed as co-chair and he introduced climate modeling to the IPCC as their means of bs-ing the world about warming and climate change based on unvalidated models.
You have linked me to a work of fiction, poor fiction at that. Dickens would have regarded IPCC propaganda as codswallop.
C’mon, Gordo.
It is you who does not seem to understand.
You said that one can explain.
That is obviously false.
Think.
Alternatively, try to disagree without being a disagreeable ignoramus.
Lake Mead is supposed to be a reservoir, presumably, in part, for drinking water. Why then, are they dumping treated sewage in the lake, allowing communities to be built around the reservoir, and allowing power boats to run on the lake?
That would never be permitted in a reservoir around Vancouver, Canada, but we are more fortunate than most with mountains to create natural reservoirs. We have water rationing in summer so there is nothing to spare for export in the Vancouver area, with a typical rain-forest climate.
It’s ironic the US wants to ‘share’ water after slapping lumber tariffs on Canadian wood and ignoring a decision by a NAFTA tribunal that it was illegal to do so.
“Las Vegas Lakefront Homes
Water lovers take refuge in their dream homes found in Hendersons Lake Las Vegas, Desert Shores, and The Lakes. Custom designed neighborhoods around Lake Mead in Boulder City include: Lake Mead View Estates, Lake Terrace, Marina Highlands, and Vista del Lago.
Boulder City Homes Overlooking Lake Mead
Boulder City boasts some of the most scenic waterfront homes in the area. Beautiful custom homes pepper the hills overlooking the sparkling waters of Lake Mead and feature incredible mountain views and majestic sunsets. The area right on the lake is owned by the Bureau of Land Management, which means no Boulder City real estate exists directly on the lake. However, no homes are without fabulous views.
https://www.lasvegashomesbyleslie.com/las-vegas-lake-front-communities.php
***
“However, not all water that enters Lake Mead is free from human influences; certain parts of the local watershed tend to harbor more contaminants. Las Vegas Wash, for instance, carries more than 175 million gallons of treated wastewater into Lake Mead each day, as well as storm-water runoff from the valley. Las Vegas Bay, where this water enters the lake, is carefully monitored to make sure that water treatment programs are meeting state and federal standards and reducing contaminants to safe levels”.
https://www.nps.gov/lake/learn/contaminants.htm
“Boating on Lake Mead and Lake Mohave is one of the more popular activities here. With more than 290 square miles of waterway to navigate, boaters can enjoy the thrill of open water or relax in a private cove”.
https://www.nps.gov/lake/planyourvisit/boating.htm
The IPCC does actually tell some truths but then ignores the truth in their conclusions.
The IPCC’s conclusions are couched in probability estimates, so I’m not sure exactly what truths you are invoking, Troglodyte.
However, you did not respond to the proper comment.
stephen…”The IPCC does actually tell some truths but then ignores the truth in their conclusions”.
***
I can think of only 3 examples of them telling the truth:
1)They admitted in the first review circa 1990 that the Little Ice Age and the Medieval Warm Period existed. Then they threw out both when they anointed the hockey stick as the truth. A few years later they had to hustle to get rid of the hockey stick when NAS and a statistics expert rubbished the hockey stick. The IPCC immediately re-instated the LIA and MWP in their amended version.
2)They claimed in TAR that future climate states cannot be predicted. Then they undid the claim by using unvalidated climate models to predict future climate states. They got away with the lies till expert reviewer, Vincent Gray, advised them unvalidated models cannot predict. Rather than cut the propaganda, the IPCC changed the word predict to project.
3)In 2013, they admitted there had been no warming over the 15 year period form 1998 – 2012. They called it a hiatus, however, or a pause. The flat trend continued till 2015 then a major EN drove global temps to record levels. After the smoke cleared, we are now in another 6 year flat trend.
C’mon, Gordo.
Your first point is silly. For starters, the Lamb graph was a cartoon. Second, here’s what the report looked like back in the days:
https://www.ipcc.ch/site/assets/uploads/2018/05/ipcc_90_92_assessments_far_wg_I_spm.pdf
Third, science changes.
Revise and resubmit.
Gordon,
“Then they undid the claim by using unvalidated climate models to predict future climate states.”
Do you have an example of where the IPCC predicted future climate states?
Willard, bobdroege, please stop trolling.
Superdeveloping La Nina effect
https://www.dailymail.co.uk/news/article-10884663/Miami-hit-major-flooding-12-INCHES-rain-falls-Tropical-Storm-Alex-hits.html
But isn’t that all down to Global Warming?
Probably.
But La Nina….
Ebaby
Tell the same stuff at WUWT, and you might experience some very nice contradiction
No matter how you dumb it down even to kindergarten level
Stuck on stupid Bindidong will simply never get it
https://youtu.be/M6D4qZYJuQg
All you are able to show is your endless sequence of anonymous youtubes.
THAT, Ebaby, is kindergarten level. YOUR level.
“TROPICAL CYCLONE ONE FL FLOODING LA NINA & WHY THIS 2022 HURRICANE SEASON WILL BE A STRONG ONE”
Where is heat escaping from the subsurface Pacific Ocean?
http://www.bom.gov.au/archive/oceanography/ocean_anals/IDYOC006/IDYOC006.202206.gif
Will La Nia come to an end?
https://www.tropicaltidbits.com/analysis/ocean/nino12.png
To add to that
https://www.tropicaltidbits.com/analysis/ocean/nino3.png
https://www.tropicaltidbits.com/analysis/ocean/nino34.png
https://www.tropicaltidbits.com/analysis/ocean/nino4.png
Yes it will, Eventually the cold will leak out into outer space
But cooling the lower atmosphere until it does.
Yeah ren…
ALL La Ninas and El Ninos come to an end.
The 1908 and the 1973 La Nina both took longer a time to do, but…
“ALL La Ninas and El Ninos come to an end” eventually.
Are you really stupid enough to think that THIS La Nina will behave different than ALL those reported since centuries, just because you would like it happens?
Are you stupid enough to realize that double dip La Nina are quite rare and this is one of them.
The PSMSL station Virginia Key (since 1994), reports (VLM corrected) about 6 mm/year for 1994-now.
Doesn’t look so terrible at a first glance, of course, when we plot the stuff:
https://tinyurl.com/38tfacnw
But…. better would be to ask the people really living there, wouldn’t it?
“an increase in air pressure of 1 hPa (one millibar) lowers the water level by 1 cm” (10mm or 0.4 inches) and vice versa.
Typical blah blah of a person who never had anything real to do with sea levels, and shows off with a little statement.
I propose you to
– (1) download the PSMSL data:
https://tinyurl.com/5cny8jwp
– (2) download the SONEL data for vertical land movement correction:
https://tinyurl.com/mr7b7w96
– (3) process all that data
and
– (4) to search for worldwide air pressure data available over a sea level measurement period like that since 1979, for which there shoud exist enough data.
And when you will have done that job, Linsley-Hood, come back to us with your results, and THEN… we can discuss further.
I was just setting your 6mm in context. The simple facts are that tidal ranges and normal pressure differences swamp your observation.
RLH: I always follow the data. And X is always true.
Me: Here is some data which proves that X is not always true.
RLH: Data shmata. Are you claiming that Y is not true?
Me: You said nothing about Y. I just proved that X is not always true.
RLH: One example? You’re kidding me.
Me: One example is all I need to prove that X is not ALWAYS true. But hey, here’s two more examples.
RLH: Are you claiming that Y is not true?
Me: What’s your fascination with Y. Your claim was that X is always true.
RLH: If Y is true then X is always true.
Me: Given that I’ve show you three examples from the data to show that X is not always true then there must be something wrong with your ‘logic’, mustn’t there.
RLH: Data shmata. By the way, here’s some data to prove that Y always causes X.
Me: No, that is only one month. Here is an example from YOUR data to show that X is not always true.
RLH: Data shmata, Are you trying to claim that Y is not true?
And so it goes on. Ad infinitum. Not sure whether I should put it down to his agenda or to his sucking on car exhaust pipes 40 years ago.
And I forgot to mention that his ultimate goal was to prove the CONVERSE of X. He never was able to address that. Apparently he believes that as all dogs are animals, then all animals must be dogs.
The problem, I think, lies a little deeper: in the fact namely that Linsley-Hood NEVER admits to being wrong.
You see that best in his endless stalking against me concerning my allegedly wrong processing of NOAA’s USCRN data.
His most recent post:
RLH says:
June 2, 2022 at 7:32 PM
Did you delete the graph where you boasted about how your data was more accurate than USCRNs daily data on a single station?
*
Of course I never ‘boasted about how [my] data was more accurate than USCRNs daily data!
I just tried to explain him last year that averaging USCRN’s hourly data into days does not give a terrible difference compared to their own daily data:
https://drive.google.com/file/d/1WjAdT5r_6R7Pu9xEmxBChZpg7N8YkML3/view
Minimum difference: -0.06 C
Maximum difference: +0.07 C
Average difference: 0.00 C
Median difference: 0.00 C
*
But the major point was that he never was able to understand that the difference between
– my averaging of USCRN hourly data into days
and
– USCRN’s official daily data
is of no interest because I don’t use daily data as he does: I average hourly data directly into months.
*
And thus… I therefore still await his fair competition with my monthly comparison of (Tmin+Tmax)/2, median and average for all 138 active USCRN stations since 2002:
https://drive.google.com/file/d/1BhgrAn-eVrX9JZUhr_y4ceVWAKsXtqml/view
It’s probably even deeper than that. He’s getting on in life and time is running out for his desperate attempt to leave his mark on the world. Any admission to being wrong sets him back and increases the risk that the grim reaper will catch him before reaching his unreachable goal. That’s my impression anyway.
AQ: Do you accept that the NOAA absolute data shows that Nino 2+1 is first in time and coldest, Nino 3 is next, Nino 3.4 next and Nino 4 is last and warmest?
https://www.drroyspencer.com/2022/06/uah-global-temperature-update-for-may-2022-0-17-deg-c/#comment-1308784
Notice how you had to revert to absolute temperatures instead of anomalies?
Notice how despite that, 1.2 is rising at the start of the year while 3.4 falls?
We were talking about CHANGES in temperatures, not temperatures themselves. That is, we were talking about the TRANSITION into La Nina. If you look at all the absolute temperatures you would find 1.2 colder than 3.4 in a majority of months, including in El Ninos.
Good attempt though – no one can beat you for slyness.
“Notice how you had to revert to absolute temperatures instead of anomalies?”
Notice how anomalies are based on absolutes.
“Notice how despite that, 1.2 is rising at the start of the year while 3.4 falls?”
Notice that 1+2 is mostly colder than 3.4 (uses averages over the year if you like).
https://i.imgur.com/2Wwddjf.png
Anomalies are not useful without the normals that make then up. They are only part of the picture.
“We were talking about CHANGES in temperatures”
Does https://i.imgur.com/2Wwddjf.png not show changes?
You will find nowhere where I have said that there is not a general decreasing temperature gradient east to west across the equatorial tropics.
The ONLY claim I have made is that the first COOLING (ie. decrease in temperature, in case you don’t understand that word), does not always occur in 1.2. Your data illustrates that nicely, so thanks again for that.
When do you think you will address the original issue here, ie. the converse? How often do sudden drops in ENSO 1.2 lead to La Ninas?
Just thought I’d make a second post here, just to mimic your rabidness, even if only partially.
“You will find nowhere where I have said that there is not a general decreasing temperature gradient east to west across the equatorial tropics.”
Except that you claimed that the various Nino areas did not follow that pattern.
I said that nowhere. But of course just like last time you will post some quote which you will deliberately misinterpret.
You said quite clearly that Nino 1+2 did not feed into Nino 3 and thence into Nino 3.4 and on into Nino 4 which is an East to West pattern following the prevailing winds.
https://imgur.com/gallery/Cja7hdM
https://imgur.com/gallery/JDp9Wuy
AQ: Do you accept that the NOAA absolute data shows that Nino 2+1 is first in time and coldest, Nino 3 is next, Nino 3.4 next and Nino 4 is last and warmest?
https://www.drroyspencer.com/2022/06/uah-global-temperature-update-for-may-2022-0-17-deg-c/#comment-1308784
AQ: Do you accept that the NOAA absolute data shows that Nino 2+1 is first in time and coldest, Nino 3 is next, Nino 3.4 next and Nino 4 is last and warmest?
https://www.drroyspencer.com/2022/06/uah-global-temperature-update-for-may-2022-0-17-deg-c/#comment-1308784
barry…”All objects emit at a broad range of frequencies, not just one frequency. Absorbing bodies absorb at the frequencies that their surface optical properties, or molecular structure, is able to absorb.
The temperature of a body has almost nothing to do with how much radiation it absorbs, transmits or reflects”.
***
I tried to explain this based on textbook theory and it is out there for anyone interested. An ‘object’ is undefined. I gave an example of a certain type of quartz which contains silicon, lithium, aluminum, sodium, calcium, manganese, and magnesium. Each one of these elements have electrons that can emit EM at different discrete frequencies and overall, that spectrum of all the elements could be regarded as a broad range of frequencies. Therefore, a chunk of this kind of quartz would radiate EM at about a dozen discrete frequencies.
The thing to get is that all EM absorp-tion and emission is based on the electrons surrounding atoms. Bohr’s model is based on that as is Schrodinger’s wave equation, which formalized Bohr’s model.
A rebuttal to your point about temperature can be easily observed by turning on an electric stove and observing the ring colour. As it gets hotter, the ring begins to have an orange hue and at full temperature it glows red. That is proof that temperature and emission frequency are closely related.
I did not say absorp-tion is temperature dependent, I only said that EM from cooler sources could not be absorbed by hotter bodies. However, the frequency at which a body absorbs will shift as it gets hotter.
With regard to a mirror, it is the backing on the mirror glass that reflects light. It is so highly reflective it reflects most light. Silver is a common backing material because it is the most reflective element. Silver also as a spectrum, mainly in the green-blue region of the visible spectrum.
Temperature is defined as the average kinetic energy of atoms in a gas. However, a thermometer is calibrated to measure, in degrees, the number of calories of heat required to raise 1 cc of water by one degree. By definition, 1cc of water weighs 1 gram, therefore it takes 100 calories of heat to raise the water temperature of 100 grams of water from 0C at sea level to 100C. A thermometer is merely designed to reflect those conditions.
For those of you who insist on using mechanical unit, multiply by 4.18 to get the number of joules. Please keep in mind the joule is not the standard measure of heat, no matter what some modernists claim.
We can relate the theory of temperature based on the kinetic theory of gases to temperature in all forms of matter simply by understanding it is a human invention geared to measure kinetic energy in mass. However, kinetic energy has no meaning in itself, it only indicates that energy is in motion. We have another name for energy in motion as related to atoms, we call it thermal energy, or heat.
Clausius pointed out that internal energy is comprised of both heat and work. Vibrating atoms are producing work while heat is required to maintain the vibrations. Therefore, if we look more closely at the actions of electrons in a solid, in orbit about a nucleus, and consider their kinetic energies, we can better visualize the relationship between the electron kinetic energies, en mass, and the temperature of a body.
It is known that electrons absorbing energy jump to higher energy levels where their kinetic energy is higher. Although it’s not kosher to consider the temperature of a single electron, if the heat is applied to a mass, or the mass absorbs EM from a hotter source, all electrons affected will jump to higher levels of kinetic energy, which translates to a higher temperature.
It should be noted as well that EM will not penetrate a solid mass anymore than skin depth, whatever that depth may be.
barry…”But as soon as we talk about ab.sorp.tion, people turn into idiots because anti-AGW makes them idiots”.
***
The problem is, Barry, your propensity to create straw man arguments. I have never tried to relate absorp-tion to temperature per se, all I have done is relate the EM emissions from electrons in a cooler body to the ability of electrons at higher temperatures to absorb the EM from the cooler body. It jut so happens that electrons in a hotter body are at a higher level of kinetic energy, hence hotter.
Remember, EM is not related to temperature but it has an electromagnetic field that can affect the electric field in an electron. If the EM intensity and frequency matches the electron frequency it can excite the electron to a higher energy level, which is a higher KE level and that is related to heat.
You have offered a generalization to support your rebuttal, like CO2 absorbing only at 15 um. The wavelength at which CO2 absorbs is immaterial. If you have CO2 at 0C in a container of halite, that can allow IR through it, and you have another container of CO2 in a halite container next to it, the cooler CO2 cannot warm the hotter CO2 simply because the EM it emits cannot be absorbed by the hotter CO2.
The opposite is not true, EM from the hotter CO2 will warm the cooler CO2 in the other container.
Gordon,
“It jut so happens that electrons in a hotter body are at a higher level of kinetic energy, hence hotter.”
Actually, they are not.
You don’t understand this, probably never will.
You are confusing kinetic energy, which doesn’t apply to molecular orbital energy levels or atomic energy levels, with the energy levels in molecules and atoms.
“A rebuttal to your point about temperature can be easily observed by turning on an electric stove and observing the ring colour. As it gets hotter, the ring begins to have an orange hue and at full temperature it glows red. That is proof that temperature and emission frequency are closely related.”
Yes, emission and temperature are very closely related, but that is not the case for the temperature of the object absorbing radiation.
I have provided numerous references substantiating my point.
This is what you must do to prove that what you are saying is not bullshit.
“I only said that EM from cooler sources could not be absorbed by hotter bodies.”
I have asked for just one reference from you and other people who believe this nonsense. 2 years later and none have ben provided.
You say:
“I tried to explain this based on textbook theory and it is out there for anyone interested.”
If it is “out there”, as you say, then provide it. If you read it in a textbook, look it up online and link it here. Or search for one that corroborates.
But surely you know by now that you will never find any corroboration for what you are claiming in any physics textbook.
“However, the frequency at which a body absorbs will shift as it gets hotter.”
You think that a body can only absorb EM radiation at a single frequency?
Perhaps this is why you fail to understand.
A body emits EM radiation at a broad range of frequencies. So does an absorbing body. What frequencies are best absorbed has nothing to do with the temperature of the receiving body, but with its optical properties.
I’m going to quote another reference – the host of this blog:
“…the rate at which a layer of the atmosphere absorbs IR is relatively independent of its temperature; but the rate at which it loses IR is very dependent on temperature.”
https://www.drroyspencer.com/2015/01/how-the-climate-system-works-for-dummies/
You’ve rejected Clausius, MIT, and other universities whose physics lecture notes I have provided corroborating that warmer bodies absorb EM radiation from cooler bodies, and that ab.sorp.tion is almost entirely independent of the temperature of the receiving body.
Now I quote Roy Spencer, an atmospheric physicist. I guess you’re going to have to tell everyone that Roy doesn’t know what he’s talking about.
And you really think that these experts are all wrong, and we should believe Gordon Robertson who has been waffling on for 2 years without once providing a reputable reference for his extraordinary claims.
How are you going to prove that your remarks are not bullshit?
barry…”This is what you must do to prove that what you are saying is not bullshit”.
***
I don’t have to prove anything, the theory is out there for anyone willing to search. It’s up to you to prove me wrong.
No, Gordon.
I have provided references for everything I say. You have said that these are ‘wrong’ and then told me what you think is right. When challenged to corroborate what you are saying you expect me to go looking on your behalf for something I don’t believe exists?
Arrogance personified.
I am not going to waste a minute looking for something to prove what you are saying when I think it can’t be found. If you can’t produce a reference – 2 years on now – then you’ll have to accept the judgement that your views are unsupported, regardless of your own confidence in them.
That’s how it goes in the world of reason. And reasonableness. Claimants furnish their own substantiation. If you don’t know how to do an internet search then no one should have any confidence in your views.
barry…”Youve rejected Clausius, MIT, and other universities whose physics lecture notes I have provided corroborating that warmer bodies absorb EM radiation from cooler bodies, and that ab.sorp.tion is almost entirely independent of the temperature of the receiving body.
Now I quote Roy Spencer, an atmospheric physicist. I guess youre going to have to tell everyone that Roy doesnt know what hes talking about”.
***
I have said several times that out of respect I will not bring Roy into this. Roy had a good interchange on the subject with Philip Latour, who specializes in chemical engineering related to thermodynamics. From what I saw of that discussion, they agreed to disagree.
Clausius has not commented on this at all. I explained clearly that his comments on EM were based on the anachronistic belief that heat moved through space as heat rays. In the day of Clausius, electrons had not yet been discovered and it took nearly another 20 years for the relationship between electrons and EM to be hypothesized.
You cannot claim Clausius agreed that heat could be transferred cold to hot because he was talking about heat rays, not EM as we now understand it.
Even at that, Clausius still maintained that radiation had to obey the 2nd law. The meaning is clear, it cannot obey the 2nd law if heat is allowed to be transferred, by its own means, from cold to hot. The creator of the BP/GP thought experiment, Eli Rabbett, is thoroughly confused about that point.
Re MIT. There are climate scientists like Kerry Emanuel at MIT who push alarmist theory. I know the book from which you quoted was a mechanical engineering textbook and it bothers me that engineers can be so obtuse. Not once do they supply an example of heat being transferred both ways. Any examples provided involve conduction and/or convection, where heat is being transferred in the correct direction.
Then again, in my branch of electrical engineering they still teach that electric current flows from positive to negative. They know it doesn’t and explain it as a convention. That makes no sense, to teach a convention established circa 1925 that is a lie. I talked to an electrical engineering prof and he told me not to worry about, that it doesn’t matter in calculation which way it flows as long as the signs are properly.
I’ll tell you where it does matter. When engineers put out drawings in industry, they must all be based on current flow from -ve to +ve. That’s the industry standard in the field and all electricians are taught -ve to +ve. This silliness could lead to serious mistakes.
barry…”You tried to argue that atoms determine ab.sorp.tion, and that molecules dont. I showed you a physics text explaining how this is not the case, and linked a spectroscopy database showing different ab.sorp.tion profiles for 2 different molecules that contained the same variety of atoms and no others.
If only atoms were responsible for ab.sorp.tion then these should not have been different”.
***
You simply don’t get it that the word molecule is only a definition for two or more atoms bonded by electrons. A molecule, as an aggregation of atoms, can have no properties different than the atoms themselves bring to the mix. The constituent atoms can dictate the shape of the molecule, it’s atomic weight, obviously, it particular charge, etc., but nothing is added that can deal with EM separate from the electrons already making up the atoms.
Forget the word molecule, see it as what it is, two or more atoms bonded by electrons.CO2…
O=====C=====O
The dashed line indicate double electron bonds between the oxygen and the carbon atoms. There is nothing else there, the term CO2 molecule tells us only there are one carbon and two oxygen atoms joined by electron bonds.
Of course, when you combine atoms, they have different properties than the individual atoms. That is produced in part by the differing electrostatic forces brought to bear when two or more atoms are in proximity. However, anything related to EM emission/absorp-tion is still a property of the bonding electrons since they are the only particles that can emit or absorb EM.
Naturally, when combined, the spectra will be different because the bonding electrons behave differently in bonds than in their normal outer shell electron orbitals. However, there is nothing in a molecule other than what the individual atoms bring to the table.
With the CO2 molecule, the O atoms at the ends of the bonds repel each other equally, producing a linear bond. It’s not clear to me why dipoles like CO2 can absorb infrared but it’s said that dipoles can vibrate more easily. The vibration is a direct result of the electron bonds.
“Naturally, when combined, the spectra will be different because the bonding electrons behave differently in bonds than in their normal outer shell electron orbitals.”
Obviously you’ve forgotten that you said molecules have no “magical” properties that cause them to absorb EM radiation at different frequencies.
That was a long-winded way of saying different molecules absorb at different frequencies. Finally!
“Its not clear to me why dipoles like CO2 can absorb infrared but its said that dipoles can vibrate more easily. The vibration is a direct result of the electron bonds.”
You’re getting it. The atoms vibrate at different rates depending on their molecular configuration. Diatomic molecules have a single pattern, moving closer and further away. Triatomic molecules can vibrate in a variety of patterns and have a broader spectrum available to emit/absorb at intensity as a result.
The patterns of movement determine the wavelengths at which the molecules absorb most efficiently. CO2, as we know, absorbs most efficiently at 15um. This doesn’t change depending on the temperature of the layer of air in which the molecule resides, nor the temperature of the body that emits to it. Solar radiation at 15 um is virtually non-existent (extremely low intensity), which is why it is said CO2 and other GHGs are transparent to solar radiation (there is a tiny amount of ab.sorp.tion), but opaque to upwelling IR, and IR emitted from the atmosphere.
Every object on the planet emits radiation with a broad spectrum that well encompasses the 15um band.
Dipoles are separated plus and minus charges. The oscillation of these charges is what radiates EM waves.
CO2 has dipoles because C and O atoms attract electrons differently.
Identical atoms in O2 and N2 have identical attraction of electrons, no dipoles, and little radiation.
Not quite. There are three main modes of vibration that a CO2 molecule can undergo. For symmetric vibration there is no separation of charge. Asymmetric vibration and bending vibration do result in a separation of charge. Conversely, a separation of charge can cause these vibrations.
Wich is why the symmetric vibrations do not radiate.
“For CO2 (linear molecule) there are 4 vibrational modes corresponding to symmetric stretch, antisymmetric stretch and two bends. The symmetric stretch does not change the dipole moment so it is not IR active.”
“A molecule, as an aggregation of atoms, can have no properties different than the atoms themselves bring to the mix. ”
This is spectacularly wrong!
There are 1000’s of molecules made simply of carbon and hydrogen. These molecules each have there own energy levels related to their own absorp.tion and emission spectra. And these energy levels are NOT simply combinations of the energy levels of C and H atoms.
Similarly, quartz does NOT radiate at ‘about a dozen distinct frequencies’. When atoms form into crystal structures, the ‘distinct frequencies’ broaden in to ‘bands’.
https://en.wikipedia.org/wiki/Electronic_band_structure
Gordon,
“It should be noted as well that EM will not penetrate a solid mass anymore than skin depth, whatever that depth may be.”
You might want to dig out the 8th studio album by Pink Floyd.
And study the cover while listening to the girl having an orgasm.
If that don’t work, try and try again, with various dosages of hallucinogenic drugs, eventually you will get there.
bobdroege, please stop trolling.
Can you spell ‘atmospheric river’? Lookout Washington.
Set it to 250 hpa to see jet stream.
https://earth.nullschool.net/
Click on the location then copy-paste the link, e.g.:
https://earth.nullschool.net/#current/wind/surface/level/orthographic=-92.04,25.52,313/loc=-76.741,38.025
Even better:
https://earth.nullschool.net/#current/wind/isobaric/250hPa/orthographic=-92.04,25.52,313/loc=-76.741,38.025
I wonder where the current sub-solar points are.
https://imgur.com/a/zxGRi0M
A difference focus for me on that animation – a great illustration for RLH, who insists that winds ONLY blow east to west along the equator, especially near the South American coast. Of course he won’t reply until the winds are actually blowing east to west and say “look, I told you”.
AQ: Do you accept that the NOAA absolute data shows that Nino 2+1 is first in time and coldest, Nino 3 is next, Nino 3.4 next and Nino 4 is last and warmest?
https://www.drroyspencer.com/2022/06/uah-global-temperature-update-for-may-2022-0-17-deg-c/#comment-1308784
I never said that winds only blow east to west along the equator, but that the predominant winds blow east to west along the equator. That is what wind atlases show.
https://www.drroyspencer.com/2022/06/uah-global-temperature-update-for-may-2022-0-17-deg-c/#comment-1309793
–The discovery of phosphine (PH3), an almost unambiguous biosignature on Earth, in the clouds of Venus in 2021 increased interest in reinvestigating the planets clouds for life, a scientific goal that had been on hiatus since the last atmospheric entry and lander vehicle mission, Vega-2 in 1984. While the recent primary target for life discovery has been Mars, whether extinct, or extant in the subsurface, it has taken nearly half a century since the Viking landers to once again look directly for Martian life with the Perseverance rover.
However, if the PH3 discovery is real (and it is supported by a reanalysis of the Pioneer Venus probe data), then maybe we have been looking at the wrong planet. The temperate zone in the Venusian clouds is the nearest habitable zone to Earth.
…–
https://www.centauri-dreams.org/2022/06/03/venus-life-finder-scooping-big-science/
–But why launch a private mission, rather than leave it to a well-funded, national one?–
…
–Cutting through the slow progress of the national missions, the privately funded Venus Life Finder mission aims to start the search directly. The mission to look for life is focused on small instruments and a low-cost launcher. Not just one but a series of missions is planned, each increasing in capability. The first is intended to launch in 2023, and if the three anticipated missions are successful, Venus Life Finder would scoop the big science missions in being the first to detect life in Venus should it exist.—
Be careful with your logic.
Phosphine is produced by microbes and by non-biological processes.
You cannot say “I see phosphine, therefore there must be microbes.”
https://curiosmos.com/research-reveals-origin-of-phosphine-on-venus-10-things-you-should-know/
It is conceivable that extremophiles could survive in Venus’ upper atmosphere. Unfortunately living in sulphuric acid droplets at 70C is harsh even for them. I wouldn’t bet short odds on it.
–Be careful with your logic.
Phosphine is produced by microbes and by non-biological processes.–
I am quoting someone.
Or it’s not my logic. My logic is, if it’s habitable can live there.
Or I would logically ask, is there a better bio-signature than Phosphine.
And if there is alien life, on Venus, then we should avoid living there, until such time as we find out more about this alien life.
If there is alien life on Venus or Mars, we should not bring the alien life to Earth. It might be safe to bring it to the Moon.
Or I am not a fan of a lunar base, unless the purpose of the base in to study alien life. Or lunar base could be safe place to study alien life.
Now, governments start global pandemics and governments are generally very evil and kill millions of people for no good reason. But if government studies alien life, then it should be done on the Moon.
If people want to get infected with alien life, they can do that, but they don’t have the right to infect other people with this alien life.
There is no chance of La Nia ending during the current winter in the Southern Hemisphere . Moreover, this winter in the Southern Hemisphere, temperatures will remain below the multi-year average.
https://climatereanalyzer.org/wx_frames/gfs/ds/gfs_world-ced2_t2anom_1-day.png
3.4 has risen from -1 to -0.64 in three weeks. Not saying it won’t stay below -0.5, but you cannot honestly say no chance.
Would you give a more precise definition than “multi-year”. Do you mean the 20th century average?
And if you have to give another graph in response, please make it one with predictive value, not a daily snapshot.
The anomalies here are based on a 1979-2000 reference climatology derived from the NCEP Climate Forecast System Reanalysis (CFSR). This 22-year baseline is used instead of the more common 1981-2010 climate normal because 1979-2000 represents conditions prior to significant Arctic warming and sea-ice loss. A comparison of different climate baselines against the historical temperature record is shown here.
https://climatereanalyzer.org/wx/DailySummary/images/GISS_land+ocean_1880-2014.png
https://climatereanalyzer.org/
And then there’s Dr Spencer – the only one to use 1991-2020.
I wonder what his motivation for that choice might be?
Do you think on the South Pacific will be warmer next month?
https://i.ibb.co/j5KLTnZ/gfs-nh-sat7-t2anom-1-day.png
The stratospheric polar vortex in the south is developing perfectly.
https://earth.nullschool.net/#current/wind/isobaric/10hPa/orthographic=-70.27,-76.37,354
I have no idea what will happen next month. Nor do you. What happens happens.
Everything is totally random and unpredictable according to AQ.
“the only one to use 1991-2020. I wonder what his motivation for that choice might be?”
Keeping up to date? The rest will change sometime in all probability. They are mostly on different ranges so inter series comparison is actually quite difficult.
In fact, if things were to be kept logical, then the normals would be constructed over the whole record period and the small changes that happen each year would just be accepted. To use any shorter fixed period just makes the inevitable distortions that any one period brings even more into focus.
Roy’s new period is not a constant offset for each month for instance, but varies just slightly month by month.
RLH
Every prediction comes with a probability distribution.. The problem is when people misinterpret a 60% probability as a 100% certainty. You can tell they do this when they say something WILL happen, without qualifying. Have you been guilty of that by any chance?
Will probably happen as the odds are greater than 50%.
Got an answer for NOAA absolute data yet?
Antonin Qwerty
I see in the spreadsheet containing JMA’s monthly data that the near-zero mean has moved in between from 1981-2010 to 1991-2020 as well.
Bindidon
Interesting – but I still have to wonder why. Expanding the baseline period to 40 years makes sense, shifting it doesn’t.
1991-2020 is not 40 years.
” Expanding the baseline period to 40 years makes sense, shifting it doesnt. ”
As you can see if you look at the post just below yours, some elementary school teachers are so pushy to teach their classroom that they can’t even finish reading a whole paragraph… OMG.
*
Now to your 40 years.
1. I generated some months ago a UAH 6.0 LT anomaly time series out of their absolute data with 1981-2020 as reference period, and there was no really significant difference to 1991-2020.
2. The 30-year reference periods are WHO recommendations, as are their regular shifts, which help to incorporate more recent data into the most recent reference periods.
Some stick to it, some don’t: the latter mostly because their old periods are the ones with their most varied dates, so GISS, BEST or Hadley.
Why RSS sticks to the good old 1979-1998 period (which was also used by UAH until about 2012) is not clear.
Blinnt denigrates with every post he makes. Normally that would be called an ‘ad hom’ attack.
https://www.drroyspencer.com/2022/06/uah-global-temperature-update-for-may-2022-0-17-deg-c/#comment-1309690
Antonin Qwerty
” 3.4 has risen from -1 to -0.64 in three weeks. ”
Which ENSO source are you referring to? I’m wondering about this increase.
Here is the raw 3.4 ERSST5 input for ONI
2021 6 27.45 27.73 -0.28
2021 7 26.90 27.29 -0.39
2021 8 26.32 26.86 -0.53
2021 9 26.16 26.72 -0.55
2021 10 25.78 26.72 -0.94
2021 11 25.76 26.70 -0.94
2021 12 25.54 26.60 -1.06
2022 1 25.60 26.55 -0.95
2022 2 25.87 26.76 -0.90
2022 3 26.32 27.29 -0.98
2022 4 26.71 27.83 -1.12
2022 5 26.79 27.94 -1.15
and here the 3 month running average
MJJ 2021 -0.46
JJA 2021 -0.54
JAS 2021 -0.66
ASO 2021 -0.86
SON 2021 -1.02
OND 2021 -1.20
NDJ 2021 -1.23
DJF 2022 -1.20
JFM 2022 -1.17
FMA 2022 -1.17
MAM 2022 -1.20
Source
https://www.cpc.ncep.noaa.gov/data/indices/
I was going by the Tropicaltidbits site that so many reference here. I know I shouldn’t use that as a source, but it’s so convenient.
But the NOAA weekly ENSO data has ENSO 3.4 rising from -1.2 in the week centred May 4, rising to -1.0 in the week centred May 25, and if the TTB site is correct at least in relative terms, I would be expecting a further rise when the next week’s data comes out in the next day or so.
CFSv2 has had the following on it (captured recently)
https://imgur.com/gallery/N2ErqXP
and
https://imgur.com/gallery/N2ErqXP
Find the current data at
https://www.cpc.ncep.noaa.gov/products/CFSv2/CFSv2_body.html
The NCEI OLv2.1 data will update in about 6 days or so when the initial conditions are only of this month.
I understand what you mean.
https://www.drroyspencer.com/2022/06/uah-global-temperature-update-for-may-2022-0-17-deg-c/#comment-1309690
Have you noticed how RLH is chasing me around, desperate for attention.
I guess he has no one at home.
It looks like AQ has no answer to factual data that proves what he said was incorrect.
https://www.drroyspencer.com/2022/06/uah-global-temperature-update-for-may-2022-0-17-deg-c/#comment-1309706
Richard spews data to fill up the screen but does not prove anything as usual.
So Willard thinks that actual data is not that important.
Looks like Richard has no answer to factual claims that prove he does not quite tell the whole picture.
So Willard thinks that actual data showing that Nino 1+2 leads Nino 3, then Nino 3.4 and then Nino 4 is not proof of what I said was true that the actual progression was from East to West.
https://imgur.com/a/m1BKlv4
https://imgur.com/gallery/JDp9Wuy
https://imgur.com/gallery/Cja7hdM
Richard continues to spew data to fill up the screen as if it proved anything.
“So Willard thinks that actual data is not that important.”
If the data was important to YOU, you would have accepted that in 1998 ENSO 3.4 cooled before ENSO 1.2.
Instead, you had to redefine “cooling” as “being cool”.
https://www.drroyspencer.com/2022/06/uah-global-temperature-update-for-may-2022-0-17-deg-c/#comment-1310113
The data proves you wrong. You can see quite clearly that 1+2 leads 3, leads, 3.4, leads 4.
“in 1998 ENSO 3.4 cooled before ENSO 1.2”
During the ‘spring barrier’ period. The rest of the time (the majority) the opposite was in effect.
RLH,
Defining the ENSO state, whether La Nina, Neutral, or El Nino has always been determined from T anomalies of the Nino regions.
Why then do you keep showing absolute T, whose variations are not dominated by ENSO, but by seasonal change?
Because anomalies are determined from absolutes by removing the seasonal variation.
You can just as easily use absolutes to show who comes first in the sequence as my reporting of the absolute data from NOAA shows.
https://imgur.com/gallery/QMrprci
https://imgur.com/gallery/Cja7hdM
https://imgur.com/gallery/JDp9Wuy
From that data which movement do you think is the first in time to occur?
Or you could just post the normals for each area and thus show the same thing.
P.S. Anomalies do not show temperature differences between each area and these are all based around the Equator.
RLH says: So Willard thinks that actual data showing that Nino 1+2 leads Nino 3, then Nino 3.4 and then Nino 4 is not proof of what I said was true that the actual progression was from East to West.
I may not be clear on what point you’re trying to make, but it sounds like your contention is that Nino 1+2 is a leading indicator of El Nino evolution.
Assuming this is the case, I think also by looking at absolute temperatures rather than anomalies may be misleading because the Nino 1+2 is not centered on the equator and has, by far, the largest seasonal component with a normal peak in March.
Looking at anomalies, Nino 1+2 is low, as would be expected under La Nina conditions, but it’s been static for the last couple months. Evidence of a continuing La Nina, perhaps, but not clearly evident of a deepening La Nina if that’s what you’re trying to imply.
For what it’s worth, it’s been argued by some (Trenberth iirc) that Nino 4 is a better indicator for the La Nina phase and it’s been flat a couple months longer than Nino 1+2.
Good catch Mark, 1-2 extends way South. Its warm season peaks first.
Nothing to do with ENSO.
“that Nino 1+2 is a leading indicator of El Nino evolution”
I did not claim that. I said that cold water in Nino 1+2 feeds into Nino 3, then into Nino 3.4 and then into Nino 4. Do you dispute that?
“Nothing to do with ENSO”
Why do people not read?
“The data proves you wrong. You can see quite clearly that 1+2 leads 3, leads, 3.4, leads 4.”
Nope. Anomalies are the proper measures of ENSO. You were misled by not looking at anomalies.
1. Earths Without-Atmosphere Mean Surface Temperature calculation
Tmean.earth
So = 1.361 W/m (So is the Solar constant)
S (W/m) is the planets solar flux. For Earth S = So
Earths albedo: aearth = 0,306
Earth is a smooth rocky planet, Earths surface solar irradiation accepting factor Φearth = 0,47
(Accepted by a Smooth Hemisphere with radius r sunlight is S*Φ*π*r(1-a), where Φ = 0,47)
β = 150 days*gr*oC/rotation*cal is a Rotating Planet Surface Solar Irradiation INTERACTING-Emitting Universal Law constant
N = 1 rotation /per day, is Earths axial spin
cp.earth = 1 cal/gr*oC, it is because Earth has a vast ocean. Generally speaking almost the whole Earths surface is wet. We can call Earth a Planet Ocean.
σ = 5,67*10⁻⁸ W/mK⁴, the Stefan-Boltzmann constant
Earths Without-Atmosphere Mean Surface Temperature Equation Tmean.earth is:
Tmean.earth= [ Φ (1-a) So (β*N*cp)∕ ⁴ /4σ ]∕ ⁴ (K)
Τmean.earth = [ 0,47(1-0,306)1.361 W/m(150 days*gr*oC/rotation*cal *1rotations/day*1 cal/gr*oC)∕ ⁴ /4*5,67*10⁻⁸ W/mK⁴ ]∕ ⁴ =
Τmean.earth = [ 0,47(1-0,306)1.361 W/m(150*1*1)∕ ⁴ /4*5,67*10⁻⁸ W/mK⁴ ]∕ ⁴ =
Τmean.earth = ( 6.854.905.906,50 )∕ ⁴ = 287,74 K
Tmean.earth = 287,74 Κ
And we compare it with the
Tsat.mean.earth = 288 K, measured by satellites.
These two temperatures, the calculated one, and the measured by satellites are almost identical.
Conclusions:
The planet mean surface temperature equation
Tmean = [ Φ (1-a) S (β*N*cp)∕ ⁴ /4σ ]∕ ⁴ (K)
produces remarkable results.
The calculated planets temperatures are almost identical with the measured by satellites.
Planet…..Tmean….Tsat.mean
Mercury…325,83 K…340 K
Earth…..287,74 K…288 K
Moon……223,35 Κ…220 Κ
Mars……213,21 K…210 K
The 288 K 255 K = 33 oC difference does not exist in the real world.
There are only traces of greenhouse gasses.
The Earths atmosphere is very thin. There is not any measurable Greenhouse Gasses Warming effect on the Earths surface.
There is NO +33C greenhouse enhancement on the Earths mean surface temperature.
Both the calculated by equation and the satellite measured Earths mean surface temperatures are almost identical:
Tmean.earth = 287,74K = 288 K
https://www.cristos-vournas.com
AQ: So you did not say the the Nino areas did not follow the pattern of predominantly cold in the East to Warm in the West and that the progression over them is East to West.
As https://imgur.com/a/Cja7hdM shows.
Do you accept that as fact now?
Here is the last few years
https://imgur.com/a/JDp9Wuy
We,ve been here before.
Over a full cycle cycles are temperature neutral. You cannot use short term cycles to explain the observed long term warming .trend.
For example ENSO is an irregular oscillation with a period of approximately ten years. It cannot explain 140 years of warming.
The only cycle that might be relevant is the 100,000 year glacial/interglacial cycle. That is causing about 0.001C/decade cooling and has been overriden by AGW.
Richard Whybray, you make stuff up really well. You’ll fit in nicely here.
Welcome!
“For example ENSO is an irregular oscillation with a period of approximately ten years”
But over the last 25 years there have been more La Nina than El Nino.
Problem is the 2 major ENs have been major and raised the global average. I don’t know if it was an LN following the 1998 EN that offset the EN warming partially. I wonder if we’ll experience an LN as extreme as the 1998 and 2016 ENs?
The real question is if multiple LN can exceed the occasional EN.
“But over the last 25 years there have been more La Nina than El Nino.”
Yes, and that should provide a cooling influence to global temperatures.
https://www.woodfortrees.org/plot/uah6/from:1997/to:2023/plot/uah6/from:1997/to:2023/trend
0.115 C/decade (+/- 0.111)
1997 to current, which is 25.4 years.
But maybe we need to put it into a larger context.
https://www.woodfortrees.org/plot/uah6/from:1979/to:2023/plot/uah6/from:1979/to:1997/trend/plot/uah6/from:1997/to:2023/trend
0.086 C/decade (+/- 0.172)
1979 to 1997
So many conclusions you could draw, if you needed a conclusion.
We been in ice house climate for about 34 million years, and the last 2.5 million years have been the coldest time within 34 million years.
Within the 2.5 million years, polar bears have evolved and humans have evolved to be able to live in colder regions of Earth in this time period- Humans migrated from tropical forests in Africa, into grasslands of Africa, then into temperate and even arctic zones, all over Earth. The use of fire, home building, and clothing were the human technologies which allow this happen.
For last 5000 years we have returning to conditions associated with glacial conditions, in Little Ice Age, global glacial growth was recorded, and in 20th century most of this glacial advance has retreated.
And over next 500 years, we should continue towards conditions associated with glaciation periods, but this not mean huge continental ice sheets will forming within such short time, but condition similar to Little Ice Age would occurring, again.
Some think our 5000 years of cooling could somehow be reversed, but there doesn’t to be any evident which supports this.
I will ask question, will global warming trend of .013 C per year continue for the next year?
Or we have a .13 C per decade of warming over the last 30 year period. We had a .14 C per decade, which has reduce to .13 per decade because the has warming last several years.
Will another year be continuation of what happened recently or will get up tick which returns to .14 C per decade. Or will we drop to .12 per decade, within the next year.
Or .13 C continue to be the case for next year. Or does it increase or decrease.
I think it drop to .12 C increase per decade within the next year.
And within 10 years drop to .01 C increase.
And I think China in 10 years will still have enough coal to mine 4 billion tons per year. And China will not get to 5 billion tonnes of coal mined per year. And due to technology or other changes, may only mine as much as 3 billion tons of coal per year by 2032.
Of course with unknown large discovery of coal which China can use, this may be wrong.
And after 10 years, the discussion will be about the global shortage of CO2 in our atmosphere.
And what to do about it.
Or rising CO2 levels has increased crop yields, and unless there some other easy way to increase crop yields, the history in increasing crop yield, stopping, will regarded a major problem.
Due to natural cycle will current at a peak, and will drop again because cycle, so it’s natural rebound which doesn’t happen, which will be the observable issue. Or we should continue have more CO2 than we did a end of 20th century, but will be lack of expected upward tread in next upward cycle, which will start some worrying/alarm.
We don’t have a global warming problem. We have a global cooling problem. The temperature region plus or minus 10 degrees latitude of the equator will be called Columbiana where most will live. There will be huge snow-capped mountain ranges and large greenhouses constructed for agriculture. The world’s population will probably shrink by 75 percent.
“We dont have a global warming problem. We have a global cooling problem”
Over the last few years that is obviously not true. The real question is when (and if) the current rising trend reaches its limits.
“The real question is when (and if) the current rising trend reaches its limits.”
I would say if ocean was 5 C, it would not reaching it’s limits, yet.
“I will ask question, will global warming trend of .013 C per year continue for the next year?”
In 12 months the trend from 1979 will almost certainly be the same as that value, or, outside chance, it will change by 0.001.
Feel free to save this post to show me in 12 months.
richard w…”It cannot explain 140 years of warming”.
***
It has never been scientifically proved that CO2 is causing the warming. We emerged from a 400+ year Little Ice Age in 1850 where major cooling had been locked into the land and oceans as glaciers and Arctic/Antarctic ice. It takes a long time to melt that ice and warm the oceans. The ice is replaced every year in the northern and southern hemisphere winters so overall melting takes a long time.
Syun Akasofu, a geophysicist, has claimed the IPCC erred by not taking that re-warming into account. He thinks the planet should re-warm at a rate of 0.5C/century.
If you read the current IPCC review propaganda, they dismiss the Little Ice Age in a footnote even though many scientific papers have been published proving the existence and effect of the LIA.
Especially when historically CO2 lags temperature in both short and long time scales.
Except when CO2 leads temperature.
When was that?
https://imgur.com/a/N4EptIS
https://www.carbonbrief.org/explainer-how-the-rise-and-fall-of-co2-levels-influenced-the-ice-ages/
That would be now.
You may notice an interesting thing, and that is, red immediately appears in the graphics of summer season temperature anomalies in regions of stationary highs. It is different when it is cloudy. In my opinion, in the period of low solar activity more long-wave UV radiation can reach the Earth, which heats up the surface of the continents more.
https://www.cpc.ncep.noaa.gov/products/stratosphere/strat-trop/gif_files/time_pres_TEMP_ANOM_ALL_EQ_2022.png
For comparison here is what happened last 2 years
https://www.cpc.ncep.noaa.gov/products/stratosphere/strat-trop/gif_files/time_pres_TEMP_ANOM_ALL_EQ_2021.png
https://www.cpc.ncep.noaa.gov/products/stratosphere/strat-trop/gif_files/time_pres_TEMP_ANOM_ALL_EQ_2020.png
Temperatures in the upper stratosphere above the equator are falling, which means lower ozone production.
https://www.cpc.ncep.noaa.gov/products/stratosphere/strat trop/gif_files/time_pres_TEMP_ANOM_ALL_EQ_2018.png
https://www.cpc.ncep.noaa.gov/products/stratosphere/strat-trop/gif_files/time_pres_TEMP_ANOM_ALL_EQ_2019.png
https://www.cpc.ncep.noaa.gov/products/stratosphere/strat-trop/gif_files/time_pres_TEMP_ANOM_ALL_EQ_2018.png
Lower ozone production means less protection against the UV.
After an apparent increase since mid-May, solar wind speeds are again declining. No active sunspots or coronal holes.
https://i.ibb.co/0JznfHc/plot-image.png
Let’s look at the current temperature anomalies of the Peruvian Current. Is it getting colder?
https://www.tropicaltidbits.com/analysis/ocean/cdas-sflux_ssta_samer_1.png
Good point, Ren. Looks pretty blue to me.
Hasn’t changed that much in the last 7 days.
https://www.tropicaltidbits.com/analysis/ocean/cdas-sflux_ssta7diff_samer_1.png
We have first tropical storm called Alex which heading out into the Atlantic:
https://www.nhc.noaa.gov/
When will we get most of hurricane during this season? Sooner or more later in the season?
“For the 2022 hurricane season, NOAA is forecasting a likely range of 14 to 21 named storms (winds of 39 mph or higher), of which 6 to 10 could become hurricanes (winds of 74 mph or higher), including 3 to 6 major hurricanes (category 3, 4 or 5; with winds of 111 mph or higher). NOAA provides these ranges with a 70% confidence”
Not curiously at all, those people who are very quick in posting here a link to an article of Clive Best because it fits to their egomaniac narrative:
April global temperature drops to 0.77C
https://clivebest.com/blog/?p=10273
never and never would post a link to the author’s previous article:
Nights warm faster than days
https://clivebest.com/blog/?p=10264
because it manifestly is not at all their interest to make it visible.
When do you expect that trend to stop?
“RLH says:
May 10, 2022 at 10:45 AM”
https://www.drroyspencer.com/2022/05/uah-global-temperature-update-for-april-2022-0-26-deg-c/#comment-1277663
Looks like your memory is not quite correct,
Linsley-Hood
Correct, I was wrong. My bad!
As opposed to you, I always admit my mistakes.
*
But what you write:
” That cannot continue on indefinitely of course, else nighttime would be warmer than daytime and Winter warmer than Summer. ”
is typical for your urging to discredit an article on the basis of a simple-minded, completely irrelevant, redundant comment.
What Clive Best wrote I see since years when comparing Tmin and Tmax in GHCN daily station data, and also when seeing that winter month anomalies increase mostly faster than those calculated for summer months.
*
The two aspects are of course the reason why so many dumb US people claim that ‘NOAA and GISS made our warm 1930’s disappear’.
Completely wrong, as can be shown by posting a CONUS absolute temperature chart, or – as was done by John Christy (and I) – by generating a histogram of the years in which 100+ year old stations had their warmest days.
“That cannot continue on indefinitely of course”
You disagree with that observation?
“never and never would post a link to the authors previous article:
….
because it manifestly is not at all their interest to make it visible”
You going to take that back?
Looks like you did.
Since 1979, 48 % of the indices of the Multivariate ENSO index were above 0, and conversely 52 % below 0.
Exactly the same ratio exists among the indices below -0.5 (La Nina treshold) resp. above +0.5 (El Nino treshold).
For MEI’s historical period (1871-now), the ratio is 55 % below the La Nina treshold, and 45 % above the El Nino treshold.
The real question is if multiple LN can exceed the occasional EN. This includes stuff that sits inside of the +-0.5C threshold.
Stochastic data.
The multivariate ENSO index bounces around 0 but not in a way which can be predicted more than a few months ahead. The current double dip La Nina illustrates this.
If ENSO were a cycle we would not see so much random variation.
All is random. There are no natural cycles at all. Sure. Yet everything balances around 0. Why is that?
Thermodynamics.
Plot the multivariate ENSO index as a frequency distribution and 0 is the mean. That represents the condition in which the energy balance in the Pacific matches the planet as a whole.
In El Nino conditions the Pacific ocean is absorbing a smaller amount of energy than the planetary average.
La Nina occurs when the Pacific ocean is absorbing more energy than the planetary average.
“0 is the mean”
Only if you make it so by taking an appropriate time period over ENSO in order to make it so. Note that this will not be a whole number of years.
P.S. Should you be using the mean or the median?
Use the mean.
La Nina global means tend to be 0.3C low and El Ninos about 0.2C high.Median would be about0.05C.
“Use the mean”
Your statistical justification for that is?
“La Nina global means tend to be 0.3C low and El Ninos about 0.2C high. Median would be about 0.05C.”
Only if there are 50% of both in the sample period and the distribution is symmetrical.
Moved the thread on molecules down here to keep my replies to Barry, Nate, Anton, and Tim together. There is a theme running through each reply that indicates a misunderstanding of basic atomic theory.
I do not pretend to be an authority on the subject, not even well informed. However, I have spent much of my life studying and applying electrical/electronics theory and it all begins with the study of atomic structure. Furthermore, I studied organic chemistry as part of a chemistry course I was required to take in first year, pre-engineering.
I have forgotten more than I currently know and I’m still light years ahead of Barry, Nate, Anton, and Tim. I am not basing that on ego, I am basing it on what they reveal re their understanding of molecules/atoms, bonding, and charges, and the complete absence of electrons in their analysis.
For example….
[Barry]”Obviously youve forgotten that you said molecules have no magical properties that cause them to absorb EM radiation at different frequencies.
That was a long-winded way of saying different molecules absorb at different frequencies”.
***
I had just finished a detailed explanation revealing a molecule is just a name for an aggregation of atoms bonded by electrons. No Barry, different molecules don’t absorb anything their constituent atom’s electrons absorb everything. Quantum theory is based on the interaction of electrons with proton charges in the nucleus and also with the various energy levels the electrons can take. Absorp-tion/emission is all about electron transitions.
It’s more complicated. Electron bonding involves only electrons in the outer energy level shells. It’s still not clear, more than 100 years after Bohr’s model was presented, exactly how electron bonding between atoms takes place. That’s because no one can locate the electrons at an instant to determine the action. Therefore, quantum theory is based on probability clouds representing the probability of locating electrons at any point around a nucleus.
However, the theory uses references like covalent bonding and ionic bonding. The notion of metallic bonding has come into vogue more recently but it addresses electron clouds which, to me, is nonsense. Electrons cannot exist as clouds in a copper conductor, only in the minds of theorists.
If we consider a covalent bond, the theory claims electrons are shared between atoms. The idea is to fill the outer shells of atoms with electrons, called valence electrons, making the atom stable. With the atoms we are considering, like oxygen and carbon, the number of electrons required to fill the outer shell is 8.
With CO2, combining 2 oxygen atoms with 1 carbon atom fulfills that requirement as the sharing completes both valence shells of the atoms. However, no one shows how this sharing takes place, and with more atoms per molecule, the concept becomes far more complex.
The sharing is often shown as electron orbitals surrounding both or multiple atoms in a molecule with more than two atoms. In that case, it complicates electron transitions dramatically, and that explains variations in properties between molecules with different atomic arrangements.
It has nothing to do with mysterious properties in molecules. No, Barry, my explanation is not long-winded, it explains what goes on in molecules. Personally, whenever I see anyone using the term molecule and making claims of EM emissions, without addressing the electrons in the constituent atoms, I regard that person as having no understanding of the subject.
Gordon Robertson
So now you are claiming to know more about Chemistry than Linus Pauling. Amazing degree of arrogance! You can’t link to anything that supports your absurd ideas.
You are really dense Gordon. You did not take any college level Organic Chemistry. You just lie about that to try and make yourself look smarter.
Well you fail, flunk big F. You don’t have any idea what you are talking about. Just making up fluff based upon some random items you have read about.
The science of IR spectroscopy in identifying compounds is quite well established all based upon molecular vibrations. The Chemists know quite a bit about how it works. You know nothing. You just lie and deceive with intent over and over.
Why do you need to do this? How does being so totally dishonest (like claiming you actually took Chemistry classes) make you feel good about yourself? Or are you so adept at lying that you no longer recognize what you are doing?
The really stupid thing about your molecular misunderstanding is that you can’t explain why oxygen and nitrogen do not emit IR but CO2 and H2O do. If it was all electrons in the bonds then N2 and O2 would emit equally with the others. They both have electrons that could get excited, certainly some band of IR would fit the correct energy bands. No you know nothing of physics or chemistry. Make up more nonsense and then keep lying about what you don’t know. You are getting to be as stupid as Clint R. I did not think that was possible.
AQ…”There are three main modes of vibration that a CO2 molecule can undergo. For symmetric vibration there is no separation of charge. Asymmetric vibration and bending vibration do result in a separation of charge. Conversely, a separation of charge can cause these vibrations”.
***
See my reply to Nate below, which I had intended to be in this thread. It has nothing to do with a separation of charge, it’s about electronegativity, a propensity of certain atoms to attract electrons more due to having more protons in their nucleus. The O atom at the ends of a linear CO2 molecule have a higher electronegativity than the C atom, therefore electrons in the bonds tend to favour the O end, making those ends of both bonds more negative and creating two dipoles.
The modes of vibration mean the vibrations can occur in three directions, There is no ‘conversely’ about it. It is electrostatic forces between the negatively charged electrons and positively charged protons in the nucleus that cause vibration. In other words, vibration does not cause charges, the charges are properties of electrons and protons.
You guys need to get it’s all about the negative and positive charges of the electrons and protons that create the properties of various molecules, as well as electron transitions within each atom. Just because electrons are involved with other atoms in a molecule does not mean they stop absorbing and emitting EM or being influenced by heat.
These charges are fixed hence not cumulative. However, the charge on the electrons can vary if they absorb EM or heat.
nate…sorry…my reply to you was meant to be in this thread. Please find it in next thread down.
“different molecules dont absorb anything their constituent atoms electrons absorb everything. “
No. As a simple example, molecules can absorb/emit by changes in their overall rotation. That is a PHYSICAL MOTION of the molecule. Those energies are independent of the levels of the electrons in their orbits. Same for vibrational modes for the molecules.
“I do not pretend to be an authority …
Its still not clear …
which, to me, is nonsense …
no one shows how this sharing takes place …
mysterious properties in molecules …
Scientists DO understand this — well enough to make remarkable predictions about the structure and behavior of molecules and solids. Accept that you are not an authority and don’t lecture based on your decades-old sophomore science classes.
tim…”There are 1000s of molecules made simply of carbon and hydrogen. These molecules each have there own energy levels related to their own absorp.tion and emission spectra. And these energy levels are NOT simply combinations of the energy levels of C and H atoms.
Similarly, quartz does NOT radiate at about a dozen distinct frequencies. When atoms form into crystal structures, the distinct frequencies broaden in to bands.
https://en.wikipedia.org/wiki/Electronic_band_structure
***
Tim…Atoms don’t have an energy level per se, the electrons in them have potential energy levels, If a molecule emits or absorbs EM, the emission/absorp-tion spectra are those of the individual atom’s electrons.
The example you provided at your link has nothing to do with the spectral lines to which I referred. The article is about bond energies related to the junctions in a semiconductor. Semiconductor silicon is doped with impurity atoms to create slabs of silicon that have an excess of electrons (n-type) or a dearth of electrons )p-type). When those slabs are fused together to form a PN junction, the electrons in the faces being fused interact with each other.
One result is that electron charges on either slab repel each other producing a potential hill. That hill is the in-built bias in semiconductor junctions, typically 0.7 volts for silicon slabs. That his has to be overcome before current will flow. That’s why a silicon diode in a circuit has a 0.7 volt drop across it. Same with base-emitter junctions in BJT transistors.
It states in the article…”Band theory derives these bands and band gaps by examining the allowed quantum mechanical wave functions for an electron in a large, periodic lattice of atoms or molecules”.
That’s not what we are talking about here, it’s a single electron transition between energy levels. The article goes on to state…
“The electrons of a single, isolated atom occupy atomic orbitals each of which has a discrete energy level. When two or more atoms join together to form a molecule, their atomic orbitals overlap and hybridize.[1][2]
Similarly, if a large number N of identical atoms come together to form a solid, such as a crystal lattice, the atoms’ atomic orbitals overlap with the nearby orbitals.[1] Each discrete energy level splits into N levels, each with a different energy”.
then….”This formation of bands is mostly a feature of the outermost electrons (valence electrons) in the atom, which are the ones involved in chemical bonding and electrical conductivity. The inner electron orbitals do not overlap to a significant degree, so their bands are very narrow”.
I mentioned all that in my reply to Barry. When bonds are formed, the orbitals energy levels behave differently, hence properties in a molecule that are due to combined properties of atoms in the valence bands.
That is confirmed here for lapis quartz, where each atom emits a very narrow line.
https://www.researchgate.net/figure/The-representative-emission-spectrum-of-lapis-quartz-along-with-the-relevant-atomic_fig5_311423481
Good try, but that paper it about “Laser-Induced Breakdown Spectroscopy (LIBS)”
“A high-power laser pulse is used as an energy source to cause ablation of atoms from the sample surface and formation of a short-lived, high-temperature plasma. “
So the laser is blasting atoms out of the sample, ionizing the individual atoms, and looking at the spectral of ionized atoms. This is NOT the spectrum of the neutral atoms in solid quartz.
So, ‘the example you provided at your link has nothing to do with the spectral lines to which you referred’.
**********************************
“The article is about bond energies related to the junctions in a semiconductor … ” and in conductors and in insulators. Band structure relates to all of these. It relates the work function for photovoltaic.
And since you seem to have missed it “Band theory has been successfully used to explain many physical properties of solids, such as electrical resistivity and optical absorp.tion”
Yes, that article that (until now) you were happy to quote from, states that the actual current topic — optical absorp.tion and esmission — is an area where band theory excels!
[Nate]…”Dipoles are separated plus and minus charges. The oscillation of these charges is what radiates EM waves”.
***
They are not plus and minus charges in a dipole, they are negative and less negative charges at work. I realize that is a technicality and we use it freely in an electronic circuit. I just want to emphasize there are no true positive charges as would be found with the protons in a nucleus.
It’s about electronegativity which is basically the ability of atoms to attract electrons to them. If you look at a periodic table with Pauling electronegativity values, in the 2nd row in the rightmost columns, you have B, C, N, O, F (boron, carbon, nitrogen, oxygen, and fluorine) with corresponding electronegativity values above them of 2.05, 2.55, 3.04, 3.44, and 3.98. Fluorine at 3.98 is the most electronegative.
It’s a point of interest to me that the atoms composing air are grouped together in the periodic table. Methane and argon are outliers but for water, hydrogen is not far off, 4 element positions below. It is claimed that hydrogen is the most abundant element in the solar system.
If you look at carbon, C, with 2.55 and oxygen with 3.44, it means that oxygen has an electronegativity 3.44 – 2.55 = 0.89 stronger than carbon. That’s because O has more protons in the nucleus, therefore tends to attract electrons more to it than carbon.
Therefore in the CO2 molecule as…
O=====C=====O
the dipole on each side of the C atom is more negative toward the O atom. Oxygen attracts the electrons in the bond closer to it, making that end of the bond more negative. Both dipoles have opposite polarity hence they tend to cancel dipole moments which would act as a torque about the C atom.
Because the forces attracting the electrons to the protons is electrostatic, it is always oscillation (vibrating). Therefore, even though the dipoles moments cancel there is still a slight vibrations of the dipole bonds about the C atom. Also, there is a vibration along both dipole bonds that can be symmetrical or asymmetrical.
There’s you vibration and it’s all due to electrostatic forces between electrons and protons. What would cause that vibration to increase? An unbalance of charge would do that if the electrons in the bonds absorbed EM or heat. However, it is the electrons absorbing the EM or heat.
There is no reason why a difference in negativity should generate EM. That would mean a battery would generate EM and it does not.
La Nina on Its Last Leg?
https://youtu.be/E_a8RV4dPco?t=1428
Probably a little early to say that yet, given what happened last year.
But thanks for presenting yet another example for the sake of RLH of CHANGES in anomalistic temperature coming in from the west.
(Capitals for RLH’s sake, not yours.)
Just because you made a false conclusion by using anomalies (without considering the normals, i.e. just half of the data) rather than the absolutes does not mean you can’t see the CHANGES in temperatures in the actual data.
https://imgur.com/a/m1BKlv4
https://imgur.com/gallery/Cja7hdM
https://imgur.com/gallery/JDp9Wuy
1+2 leads 3, leads 3.4. leads 4 in both time and temperature from East to West as I claimed. Fact.
Add to that
https://imgur.com/a/QMrprci
which is the first 10 years of NOAA data for ENSO areas.
RLH
I see your strategy is to post the same nonsense everywhere, relying on the knowledge that a reasonable person would not waste time responding to every post. When you cease presenting as a rabid 7 year old troll then perhaps the conversation can continue. Do you think you have that within you? I suspect not.
Just because you made a false conclusion by using anomalies (without considering the normals, i.e. just half of the data) rather than the absolutes does not mean you cant see the CHANGES in temperatures in the actual data.
https://imgur.com/a/m1BKlv4
https://imgur.com/gallery/Cja7hdM
https://imgur.com/gallery/JDp9Wuy
1+2 leads 3, leads 3.4. leads 4 in both time and temperature from East to West as I claimed. Fact.
The video says otherwise. Take a hike hickster.
The data clearly shows you are wrong. But who needs facts to support their beliefs?
“Take a hike hickster”
And so you resort to name calling. Just like Blinny and Willard do. ‘Ad hom’ much do you?
And you … “idiot”.
Linsley-Hood
– You name anybody ‘idiot’ on this blog who disagrees with what you claim (often enough without any proof).
– You seem to have forgotten that you named me an ‘arrogant twat’ last year.
. When I name Robertson “Putin’s boot licker and cock sucker”, then it’s due to his disgusting denial of the Russian invasion against Ukraine and his disgusting claims about an alleged ‘denazification’ of Ukraine, though everybody knows thast there are many more Neo-Nazis in Russia than in the entire Europe.
– Robertson had no problem to name Andrew Motte (Newton’s worldwide known translator) a ‘cheating SOB’.
*
And by the way: why do you refer to ‘Blinny and Willard’ only?
What about Clint R and Swenson, both permanently naming others ‘braindead cult idiot’ or ‘moron’ etc?
As usual, Linsley-Hood, you are blind on the right eye.
Stop whining.
Where is Swenson BTW?
“And you ‘idiot'”
I call those idiots who don’t take into account the actual data. Do you feel you want that epithet applied to you also?
Are you ever going to publish the normals you rely on to produce the anomalies for ENSO or are you going to persist in the view that a small portion of the year during the ‘spring barrier’ period is useful for whole year observations?
“You seem to have forgotten that you named me an ‘arrogant twat’ last year”
If the caps fits….
While we are at name calling I call Bindidong the worst piece of scum to hit this board since David Appel
I vote for AQ.
So the speaker gets do decide “if the cap fits”.
OK by me, IDIOT.
https://www.drroyspencer.com/2022/06/uah-global-temperature-update-for-may-2022-0-17-deg-c/#comment-1310113
“So the speaker gets do decide ‘if the cap fits'”
Usually that phrase lets the listener decide..
So if I listen to you calling me an idiot, I get to decide if the cap fits?
Of are you just deliberately using a different interpretation of “the speaker”?
“So if I listen to you calling me an idiot, I get to decide if the cap fits?”
Yup.
“if the cap fits, wear it”
BRITISH
used as a way of suggesting that someone should accept a generalized remark or criticism as applying to themselves.
[RICHARD] “Ad hom” much do you?
[ALSO RICHARD] I call those idiots who don’t take into account the actual data
Richard should add “special pleader” to his CV.
Willard should add ‘idiot’ to his CV.
Norman, you old, sea dog…I get too much of a laugh out of your attemp-ted character assassination to take it seriously. My g/f is much better at it than you. She gets annoyed when I laugh with glee as she assails me with insults.
I said nothing against Pauling, all I mentioned was his electronegativity values. I regard Linus as a genius who many foolish, so-called experts tried in vain to denigrate.
You claim expert in IR spectroscopy know a lot. Where do you think I got my information?
Nitrogen does emit IR, I posted a link to the nitrogen spectrum showing it. Oxygen definitely emits radiation in the microwave range which is just below the IR band. O2 is also associated with IR absor-p-tion in airglow, a glowing effect besides the aurora. Same with nitrogen in the aurora.
I simply don’t trust climate alarmist scientists, they are willing to ignore significant activity in the IR regions by N2 and O2.
I claimed not to understand why GHGs absorb IR and other atoms don’t. I accep-t Tyndall’s word for that since his experiment seemed sound but I question the reasons. Alarmist took shots at me for admitting that truth, rather than explain it. It appears they can’t.
Here’s one explanation offered. I am not going to supply every link I visit.
“When the frequency of a specific vibration is equal to the frequency of the IR radiation directed on the molecule, it absorbs radiation”.
This makes no sense, far too general. Vibrations have no properties that allow absor-p-tion of IR. A vibration has no mass, it’s simply a descrip-tion of the state of one or more atoms in this case.
Neither is there anything in the polar bonds of CO2 that can absorb IR.
Essentially, no one seems to know. I’ll keep researching when I have time.
Do you understand that an asymmetric or bending vibration of a CO2 molecule causes an oscillating charge separation? Do you understand what a charge separation is? Do you know what can cause an oscillating charge separation this leading to a physical vibration?
Hint: It’s not caused by the earth’s shadow.
aq…”Do you understand that an asymmetric or bending vibration of a CO2 molecule causes an oscillating charge separation?”
***
No, I don’t. My expertise is in electronics and the electrical field and I have never heard of a charge separation in the manner in which you present it.
Coulomb’s Law, which is an equivalent law for the force between charges to Newton’s law about the force between masses is….F = kQ1Q2/r^2. It tells us there is a force of attraction or repulsion between charges depending on their sign.
You don’t seem to understand that vibrations are caused by this Coulomb force and not the other way around. That is, vibrations don’t affect charges.
In the case of CO2, which is easier to visualize, the oxygen atoms at the ends of the bonds between the 2 Os and the carbon atom, are more electronegative than the carbon atom. The O atoms have more protons and have a greater Coulomb force on the shared electrons, therefore the shared electrons tend to accumulate more on the O side than the C side.
That sets up two dipoles, one on each side of the C atom with the dipoles more negative on the O sides. The linear bonds can expand and contract symmetrically or asymmetrically. The cause of that must be related to the shared electrons gaining and losing energy.
The dipoles may also try to rotate around the C atom, but the repelling Coulomb forces between O atoms prevents them going far beyond the linear axis.
Gordon Robertson
Try reading through this material.
https://chem.libretexts.org/Bookshelves/Physical_and_Theoretical_Chemistry_Textbook_Maps/Supplemental_Modules_(Physical_and_Theoretical_Chemistry)/Spectroscopy/Vibrational_Spectroscopy/Infrared_Spectroscopy/Infrared_Spectroscopy#:~:text=Molecular%20vibrational%20frequencies%20lie%20in,is%20measured%20at%20each%20frequency.
–May is usually the month with the highest carbon dioxide levels each year.
In May 2022, the threshold of 420 parts per million (ppm) a unit of measurement used to quantify pollution in the atmosphere was crossed.
In May 2021, the rate was 419 ppm, and in 2020, 417 ppm.–
https://www.sciencealert.com/co2-levels-are-now-comparable-to-what-they-were-4-million-years-ago-says-noaa
from: https://instapundit.com/
So by June it level off and fall about 1/2 year and then rise until May 2023, and in theory it should be higher than 420 ppm. But will it be and by how much?
It seems to me it could stall and add only 1 ppm or less.
Keep in mind, when suppose future average rise of 2.5 ppm which I counted as the most possible for average rise, or +25 ppm in a 10 ten period, some insisted to had to be much higher rate of increase.
At moment I consider 2 ppm average rise as most possible, and I think it’s likely it will less than 1 ppm average rise or +10 ppm in the 10 years, and quite possible it will reach 0 increase per year.
And none this change will be related to governmental efforts- as I said all government actions have done, is cause more CO2 emission, not less.
There are few reasons for this. But let’s go back the article:
“The level now is comparable to what it was between 4.1 and 4.5 million years ago, when CO2 levels were near or above 400 ppm, the agency said in a statement.
At that time, sea levels were between 5 and 25 meters higher than now, high enough to submerge many of today’s major cities. Large forests also occupied parts of the Arctic, according to studies.”
4 million years ago our 34 million year ice age had cooled as much as would in the last 2.5 C million years.
Or it’s only in last 2.5 million that Greenland had a permanent ice sheet, or during interglacial periods most it would melted and during glaciation period it could become ice sheet as it is now.
Or 4 million years ago, every interglacial period melt the ice sheet in Greenland.
So during our peak Holocene period, ice sheets in North America melted causing over 100 meter rise in sea level.
4 million years old there were no ice sheets in North America during Glaciation periods, but there was ice sheet in Greenland, which melted during the peak of interglacial which instead +100 meter rise, was a 5 to 25 meter rise in sea levels.
And average ocean temperature was around 5 C. Unlike recent peak interglacial which had peak ocean average temperature of around 4 C.
If we didn’t have ocean of 3.5 C but it was 5 C, we would have much higher global water vapor, and the Sahara Desert would be grassland and forests.
So, reason we have low CO2 levels in because we are in ice house climate [as called an Ice Age] which has the case for 34 million years. Or a cold ocean absorbs CO2. Our ocean is the coldest in been during these 34 Million year, and why are CO2 in future will drop.
CO2 concentrations generally rise by more in El Nino years and less in La Nina years.
Average rises in year to May, starting 2000:
La Nina: +1.8
Neutral: +2.3
El Nina: +2.6
The last 2 years have been +1.82 and +1.86, so pretty much normal for a La Nina year.
Does that not prove that CO2 is not the cause of El Nino/La Nina the later of which have been more prevalent over the last 25 years?
No one has claimed it is the cause. Burn that straw man.
So natural cycles are not effected by the rise in CO2. Interesting.
I believe we were talking about only one “cycle”. But not sure what you find interesting about it. The baseline for this “cycle” has risen. It is an unchanging cycle about a rising baseline.
“I believe we were talking about only one ‘cycle'”
One of the natural cycles. Are you claiming that others ARE effected?
The word is AFFECTED/ Learn some English.
Now we are into spelling are we.
There is a difference between a spelling mistake and not knowing the correct word.
Let me guess – you also don’t know the correct usage of imply vs infer.
You take no account of autocorrect even though you use computers.
Oh right – because you started with ‘a’ and it suggested ‘e’.
And no – I’ve never used autocorrect. Why would I?
Fat fingers on a phone will produce many offerings.
And yes, I do know the difference in meaning between affect and effect.
So it’s fat fingers now, not autocorrect.
If you knew the difference you would not have made the SAME mistake TWICE in consecutive posts, LIAR.
RLH,
Wasn’t that you who gave me crap one time for using affects when it was effects? Or was that Droege? The English language is f*ked up.
“If you knew the difference you would not have made the SAME mistake TWICE in consecutive posts, LIAR”
I am guilty of posting without re-reading precisely what I have written and I have said that in the past. I rely all too often on squiggly red underlines to point out my mistakes. When pointed out my errors in the precise wording of posts, I have always corrected them.
Calling me a liar based on the posts just shows your prejudices and stupidity.
“Wasn’t that you who gave me crap one time for using affects when it was effects”
Not by calling you a liar (if it was me).
Calling you are liar just shows how carefully I read your posts.
“So it’s fat fingers now, not autocorrect”
A combination of them and looking more for squiggly red underlines is my fault.
BTW – if you actually knew how to spell you would be screaming with excitement at a typo I have made. You wouldn’t be able to restrain yourself.
“Calling you are liar” just shows your prejudices.
“if you actually knew how to spell”
I claim too much reliance on computers, having been using them for so long.
I’m sure I’ve been using them for just as long. Why do I not rely on autocorrect?
Because I don’t like others to do my thinking for me.
“Im sure I’ve been using them for just as long”
I was born in 1948 and my first use of computers was before the PC was invented.
And of course they came with autocorrect.
Autocorrect came about after the Internet arrived. My first web site predated Google.
Which doesn’t answer the question of why you rely on an aid for the uneducated while I don’t.
AQ calls himself educated when he doesn’t know that abnormalities rely on normals (and yet is afraid to publish those same normals for some reason).
Anomalies, Richard.
Anomalies.
Here’s how to calculate them in five easy step:
https://scied.ucar.edu/image/measure-global-average-temperature-five-easy-steps
Most welcome.
Step 1: Measure some absolute temperatures….
Anomalies. Thanks for the correction.
“Step 1: Measure some absolute”
Phrase not found.
Step 1: Measure {absolute} temperatures above the land and ocean in THOUSANDS of places around the world.
Step 2: Subtract the {absolute} temperature that you measure at each location from the usual {normal} temperature on that day.
….
Idiot.
“Anomaly and Abnormality are in fact synonyms as they both refer to ‘something that is not normal'”
Anomaly designates an absence of regularity, dummy.
No need to follow any normal distribution for that.
Nomos means law.
“So natural cycles are not effected by the rise in CO2. Interesting.”
A mathematical look, using tools like FFT, at the natural cycles would reveal if CO2, which is not cyclical, actually has any artifact in the data.
“using tools like FFT”
You do realize that things like FFT (and Wavelets) are in fact ‘tuned’ sine wave filters whereas HQLP (High Quality Low Pass) filters are not.
What are the reasons are given for this?
The latest weekly NOAA ENSO anomalies show just how far Tropicaltidbits is out for ENSO 1.2:
https://www.cpc.ncep.noaa.gov/data/indices/wksst9120.for
But of course people who need the TTB value will swear by that site, without being able to state the source of its data, probably believing they have launched their own buoys.
Daily CDAS data as reported at
https://www.tropicaltidbits.com/analysis/ocean/nino12.png
Yes, thanks for affirming the discrepancy. TTB sure is unreliable.
“TTB sure is unreliable”
Tell that to levicowan@tropicaltidbits.com. I am sure he will respond appropriately.
He no longer responds to emails.
So are you saying that his presentation of CDAS data is wrong?
So are you saying that NOAA’s presentation of its data is wrong?
But wasn’t it you who said that TTB was inaccurate? Or is it CDAs which it reports that is inaccurate?
“Climate Data Assimilation System NCEP/NCAR Reanalysis (CDAS)”
CFSv2 is a model too, even though it comes from NOAA.
“seasonal climate anomalies from the NCEP coupled forecast system model version 2 (CFSv2)”
I thought you said only one was a model.
“And one of them reports data, the other reports a re-analysis”
BTW – CDAS stands for “Crowdsourcing Data Analytics System”. It is not “data”.
Wrong.
Climate Data Assimilation System
NCEP/NCAR Reanalysis (CDAS) is run in real time.
But don’t let thinks get in the way of your prejudices.
….But dont let things get in the way of your prejudices…..
There is no mention of NCEP/NCAR on the TTB website.
But yes – I got the wrong CDAS.
Please link me to this data so we can compare to the graph.
“There is no mention of NCEP/NCAR on the TTB website”
CDAS is mentioned in the title.
https://www.tropicaltidbits.com/analysis/ocean/nino12.png
“Crowdsourcing Data Analytics System”
https://arxiv.org/abs/1207.0143
“Some complex problems, such as image tagging and natural language processing, are very challenging for computers, where even state-of-the-art technology is yet able to provide satisfactory accuracy. Therefore, rather than relying solely on developing new and better algorithms to handle such tasks, we look to the crowdsourcing solution — employing human participation — to make good the shortfall in current technology”
Nothing about climate.
“Crowdsourcing Data Analytics System” “climate” in Google returns
“It looks like there aren’t many great matches for your search”
Still waiting for that link to the past week’s NCEP/NCAR data for ENSO 1.2.
Were you incapable of reading the middle sentence of my post from 5:56 am?
Do you need a translation?
“Please link me to this data so we can compare to the graph”
You have any good reason (other than prejudice) to think that the presentation is wrong?
“Were you incapable of reading the middle sentence of my post from 5:56 am?
Do you need a translation?”
No. I know you were wrong and admitted it.
“Still waiting for that link to the past weeks NCEP/NCAR data for ENSO 1.2”
Looks like there is no simple url for that data. You need to do your own work/calculations on the daily NCEP/NCAR data restricted to the ENSO 1+2 area.
I say again, do you have a belief that the presentation is wrong or is it just your own prejudices that are showing?
Do you have a belief that the presentation is right or is it just your own prejudices that are showing?
https://www.drroyspencer.com/2022/06/uah-global-temperature-update-for-may-2022-0-17-deg-c/#comment-1310113
https://www.drroyspencer.com/2022/06/uah-global-temperature-update-for-may-2022-0-17-deg-c/#comment-1310168
So you now think that CDAS is in error.
So you now think that NOAA is in error? I guess their ENSO model must be wrong too then.
CDAS is daily. NOAA is weekly/monthly. Takes a time for one to catch up the other.
Oh really. So the NOAA weekly figure of -0.6 for May 29 to June 4 isn’t really an average of May 29 to June 4. Interesting. Do you have any more idiotic insights to share?
Today is June 6th. Your point was?
Tell me how many date in the given interval were around -0.6 on TTB.
No – tell me how many days in that interval on that site were warmer than -1.5.
Are you saying that CDAS on the various dates was wrong?
Are you saying that NOAA averaged over those various dates was wrong?
So you are saying that the 2 models of CDAS and NOAA produced differing results.
Sorted out the absolute NOAA data yet?
Indeed. And one of them reports data, the other reports a re-analysis. Care to guess which is which?
> NOAA averaged
Please, Antonin. Do *not* mention averages to Richard too often. He has very strong opinions about them.
Am I allowed to say he has below average intelligence?
“And one of them reports data, the other reports a re-analysis”
Are you saying that re-analysis (which are based on models) does not well predict actual outcomes?
“Do *not* mention averages to Richard too often”
Are those averages based on mean or median and why?
Sorted out the absolute NOAA data yet?
> Am I allowed to say he has below average intelligence?
That would be *mean* of you, Antonin!
Wink wink.
AQ and Willard are soul brothers.
👊
Idiot.
Is Antonin westward or eastward from me, Richard?
Does dumb have an west or east?
Dearest Richard,
No U
Dumb does contain a U. Idiot.
But not *idiot*, dummy.
Still using U I see, idiot.
A series of Atlantic lows will pass over Western Europe in the coming days, ending with the remnants of Tropical Storm Alex.
Weather patterns tend to flow Westwards over Europe. That is what the prevailing wind patterns show.
https://svs.gsfc.nasa.gov/vis/a000000/a004100/a004171/jetstream_uk_1080.mp4
Surface weather patterns tend to flow Westwards over Europe.
https://en.wikipedia.org/wiki/File:Earth_Global_Circulation_-_en.svg
Your map shows WESTERLIES, which flow FROM the west, hence EASTWARDS, meaning TO the east.
You really need to learn some basic English.
That’s why the word Westerlies appears in the diagram.
“WESTERLIES, which flow FROM the west, hence EASTWARDS, meaning TO the east”
The arrows say otherwise. WESTERLIES, flow TO the west
https://cdn.britannica.com/00/102500-050-2A2E7E20/circulation-patterns-Earth-surface-diagram.jpg?w=690&h=388&c=crop
…The arrows say otherwise….
Are you for real. The arrows point TO THE RIGHT.
Do you really not know where east is on a map.
….Surface weather patterns tend to flow to the West over Europe…..
RIGHT IS EAST YOU EFFING MORON.
HOW EFFING IMBECILIC ARE YOU?
My mistake. To the West instead of Westwards. As the diagrams clearly show.
Sorted out the absolute NOAA data yet?
FROM the west. The weather is coming FROM the west.
“WESTWARDS” MEANS “TO THE WEST”.
Do you also have an issue with “from” and “to”?
….My mistake. From the East to the West instead of Westwards. As the diagrams clearly show…..
Sorted out the absolute NOAA data yet?
https://www.dictionary.com/browse/westward
“westwards towards the west”
JESUS EFFING CHRIST.
FROM THE WEST TO THE EAST.
LEFT TO RIGHT.
You must be the dumbest FK I’ve ever come across.
AQ: Sorted out the absolute NOAA data yet?
You have no shame do you. No self-pride. How could someone get so confused over the simplest of geographical concepts and not be at least mildly embarrassed?
“FROM THE WEST TO THE EAST.
LEFT TO RIGHT.”
Here I was thinking that East was to the left and West was to the right. Not.
Western Europe is to the right of the Atlantic but to the left of the rest of Europe.
Winds blow towards the West, predominantly, in Western Europe. i.e. from off the Atlantic.
AQ: Sill not sorted out the absolute NOAA data yet?
Towards the WEST COAST.
NOT towards the west.
…Winds blow towards the East, predominantly, in Western Europe. i.e. from off the Atlantic…..
AQ: Sill not sorted out the absolute NOAA data yet have you?
Right and left for directions of West/East depends on if you are looking North or South at the time.
Being a sailor, I tend to think in degrees rather than compass directions to overcome just that problem.
FINALLY.
And no, the absolute data is not relevant. It is seasonal.
The onset of La Nina and El Nina is not determined by seasonal cooling.
But hey, ENSO 3.4 warmed in April and again in May in absolute terms. Are you happy to call that a movement out of La Nina? Or is that different?
Sailor my ass.
“And no, the absolute data is not relevant”
And yet you compose normals from just that source which you then subtract from the same absolute data to get the anomalies.
And that absolute data clearly shows that Nino1+2 precedes Nino 3, then Nino 3.4 and then Nino 4 in both time and temperature.
https://imgur.com/gallery/Cja7hdM
https://imgur.com/gallery/JDp9Wuy
https://imgur.com/gallery/QMrprci
“Sailor my ass”
Not so much nowadays but I do hold a few pieces of papers (and a few trophies) in just that discipline.
AQ: Care to publish the normals that you use for Nino1+2, Nino3, Nino3.4 and Nino4?
“But hey, ENSO 3.4 warmed in April and again in May in absolute terms”
As the data clearly shows https://imgur.com/gallery/JDp9Wuy.
Was that before or after Nino 1+2 during the whole year?
RLH, In the science of meteorology, the term “Westerly” means “FROM THE WEST”. Live with it.
“Westerly means ‘FROM THE WEST'”
I know. You could have said ‘from 270 degrees’ too.
How would I know. All I see for 1.2 is the seasonal cycle.
As the data clearly shows https://imgur.com/gallery/JDp9Wuy.
Was that change in 3.4 before or after Nino 1+2 in time during the whole year?
Could it be, for instance, that Nino 1+2 has already started downwards this month but that Nino3, 3.4 and 4 will only follow that trend later on this year?
P.S. “All I see for 1.2 is the seasonal cycle”
All ENSO areas have seasonal cycles, that is what normals show.
I’m a sailor. We had some Brits onboard one time, and they asked for their Rum ration. We told them, sorry, but we were a real fighting force.
The SBS (Special Boat Service), the Marine equivalent of the SAS, are well respected the world over.
https://www.royalnavy.mod.uk/our-organisation/the-fighting-arms/royal-marines/special-boat-service/special-boat-service
You guys handled Argentina by yourselves. I will give you that.
Sure. All on our own.
The weak La Nina will continue until the easterly wind along the equatorial Pacific strengthens, that is, until the solar wind strength increases. If solar activity increases strongly, then the ENSO cycle will close. Until that happens, a weak La Nina will continue.
https://www.longpaddock.qld.gov.au/soi/
http://www.bom.gov.au/archive/oceanography/ocean_anals/IDYOC007/IDYOC007.202206.gif
Solar wind has no effect on ENSO.
Absolute data for Nino areas do not report ENSO (according to you).
Index Nino 1.2 is falling again.
https://www.tropicaltidbits.com/analysis/ocean/nino12.png
According to AQ that is not important (or accurate).
According to you, West on a north-up map of the earth’s surface is to the right.
And here I was thinking Gordon was the biggest idiot for thinking the moon’s phases are caused by the earth’s shadow.
That baton has passed to you.
Anyway, I’ve spent far too long this month trying to educate clueless morons. See you next month.
As I said, I normally use degrees.
Still not going to say if data from NOAA data shows that Nino 1+2 moves first in the series are you. Coward.
https://imgur.com/gallery/QMrprci
https://imgur.com/gallery/Cja7hdM
https://imgur.com/gallery/JDp9Wuy
Central Europe may experience heavy precipitation in the coming days. It is necessary to remain vigilant.
15% of voters have seen 2000mules.
14% of them have seen that it is a fraud.
No, about 30% didn’t find it compelling but 70% did, including Democrats.
“A new Rasmussen Reports national telephone and online survey finds that 77% of those Likely U.S. voters who have seen 2000 Mules say the movie strengthened their conviction that there was systematic and widespread election fraud in the 2020 election. Only 19% of those who have seen the documentary say their belief in election fraud was weakened”
You have heard about self selection bias I hope.
“After the 2010 midterm elections, Silver concluded that Rasmussen’s polls were the least accurate of the major pollsters in 2010, having an average error of 5.8 points and a pro-Republican bias of 3.9 points according to Silver’s model”
“The Rasmussen polls are often viewed as outliers due to their favorable Donald Trump approval ratings”
https://xkcd.com/2618/
“Selection bias is the bias introduced by the selection of individuals, groups, or data for analysis in such a way that proper randomization is not achieved, thereby failing to ensure that the sample obtained is representative of the population intended to be analyzed”
I think they’re polling the people who’ve seen the movie. Most Americans know (especially Democrats) that fraud happened in Maricopa, Detroit, Philadelphia, Milwaukie, and Fulton County. And, that it was enough to steal the election. If the next election goes this way our Republic is over. It might take a decade or two but it will be done.
“Maricopa”
You mean the place with the months long Cyber Ninja ‘audit’ that promised to find the election ‘fraud’, but found a great big zilch?
“I think theyre polling the people whove seen the movie”
I know.
https://www.theguardian.com/us-news/2022/jun/09/trump-january-6-hearings-capitol-attack
“In a cinematic display meant to grip a weary public, the panel weaved footage of the violence together with live testimony and videotaped depositions from some of Trump’s closest allies and family members.
These included the former attorney general, William Barr, Donald Trumps daughter and White House adviser, Ivanka Trump, his son-in-law and adviser, Jared Kushner, and a longtime aide and spokesman, Jason Miller”
“The committee showed a clip of Barr saying he ‘repeatedly’ told Trump in no uncertain terms that he had lost the election and the claims of it being stolen because of widespread voting fraud were bullshit.
In another interview, Ivanka Trump said she ‘accepted’ Barrs determination that the presidential election had been fair”
willard…”Heres how to calculate them in five easy step:
https://scied.ucar.edu/image/measure-global-average-temperature-five-easy-steps
***
A lesson from UCAR on how to fudge temperatures to show warming.
They claim there are thousands of temperatures taken globally and daily, which is misleading, since NOAA, the provider of data for most surface users, uses less than 1500 stations globally for the solid surface.
Then they advise us to take the garnered temps and subtract each one from the ‘normal’ temperature on that day. Serious pseudo-science. The temperature on any one day could vary markedly.
Bur here’s the real fudging…divide the planet into 2596 grid cells and ‘calculate’ the average temperature anomaly for that day.
They make all this sound scientific whereas it is nothing more than cheating. They even remark ‘Look at that, it’s warmer than usual’.
These cheaters need to spend some time in jail to refine their chicanery.
The Earth’s total surface area is about 510 million km^2. Divided by 2596 and you get 196,000 km^2 and change for each grid square. That’s a square area of 443 km per side with one thermometer measuring the temperature of the area.
To demonstrate the absurdity of this, it’s like using 1 thermometer to measure the temperature of the UK. Alarmists would likely place it in Plymouth on the south coast of England where it is warmest in the UK.
Here’s how the fudging is done in actuality.
“Although we know that traits like temperature vary continuously across the face of the Earth, calculating such properties for the entire globe is beyond the reach of even the fastest supercomputers. Instead, the models typically use an algorithm that might be expressed as “calculate the temperature at a point, then move 100 km west and calculate temperature again; then move another 100 km west and repeat; once you’ve gone all the way around the globe, move 100 km north and repeat the process; and so on”. In effect, the model places “virtual weather stations” at 100 km intervals and reports the calculated properties at each of the “weather stations”. The “virtual weather stations” are located at the corners of the grid cells. So, for a model with 100 km resolution, we only know the predicted temperature (wind speed, etc.) at 100 km intervals. We can interpolate values in between “weather stations”, but the reliability of such interpolations is limited”.
https://eo.ucar.edu/staff/rrussell/climate/modeling/climate_model_resolution.html
“Alarmists would likely place it in Plymouth on the south coast of England where it is warmest in the UK”
They would never do that as it is a Maritime environment. Better at Oxford which is a long way from the sea. : )
Richard…I have punted on the river Cam but don’t recall if I got to Oxford or not.
Very different cities.
Cambridge used to be a market town with a university in the middle. Now it’s surrounded by Silicon Fen.
Oxford is an industrial city with a university in the middle.
Climatewise Cambridge is warmer and drier.
I lived in Cambridge In my youth. In Cambridge, as you know, punters stand on the platform in the stern and use a pole to push the punt forwards. In Oxford they do it wrong, they stand in the bow and push the punt backwards.
In Oxford we would say that Cambridge do it wrong.
P.S. Cambridge is not in the CET.
Come on, Gordo.
Why would anyone care about the drunken rants of a mythomaniac?
Think.
Willard, please stop trolling.
bindumbass…” When I name Robertson Putins boot licker and **** *******,
***
Knock off the foul language, you ignorant Kraut. We want to keep this blog going and idiots like you are compromising that opportunity, while compromising Roy’s integrity.
Have you no damned sense at all?
Robertson
You are on this blog the disgusting person par excellence, and merit all insults you obtain.
You are the person who is compromising every day the integrity of this blog and of his owner, through your permanent lies.
Yes, Bindidong the worst piece of scum to hit this board since David Appel
Bindidon is one of the contributors to this site.
Your characterization of him as scum is not called for. There certainly are worse regular posters on this site who contribute nothing at all including yourself.
Ken
Thank you.
[GORDO] Knock off the foul language
[ALSO GORDO] you ignorant Kraut.
In the same sentence, no less.
Willard, please stop trolling.
I actually have obtained $19700 merely a month just working parttime at home. Just when I lost my previous post, I was so disturbed and eventually I’ve searched this yeh simple online job & in this way I am capable to get thousand USD from my home. Anyone can certainly get this chance and may collect more dollars on-line by going following internet-web site….
>>> https://brightfuture241.blogspot.com/
RLH,
Why have you suddenly eschewed the CFSv2 ENSO forecasts you have promoted exclusively since you joined this site, in favour of CPC/IRI?
Could it be because for the first time in your time here CPC/IRI has finally projected a cooler forecast than CFS?
CPC/IRI probabilistic forecast:
“Though La Niña is favored to continue, the odds for La Niña decrease into the late Northern Hemisphere summer (58% chance in August-October 2022) before slightly increasing through the Northern Hemisphere fall and early winter 2022 (61% chance).”
That’s the one you’ve quoted most recently. And CFSv2?
“The CFS.v2 ensemble mean (black dashed line) indicates a transition to ENSO neutral during the Northern Hemisphere summer, with borderline La Niña conditions favored during the fall and winter.”
Hahahahahahaa!
Dude. Can you be more obvious?
“Why have you suddenly eschewed the CFSv2 ENSO forecasts”
I haven’t.
You may not have noticed that CFSv2 updates monthly.
I have.
https://imgur.com/gallery/N2ErqXP
https://imgur.com/gallery/vP8B4Ma
CDAs updates daily.
So does
https://coralreefwatch.noaa.gov/data/5km/v3.1/current/daily/gif/cur_coraltemp5km_ssta_large.gif
Yes, I would be trying to change the subject, too.
So you think the large (and deep) blue areas near the Equator are not going to translate into the actual numbers differing. What are you, an idiot?
No, an idiot doesn’t know how to stay on topic.
Irrelevant to my point, and yes I did.
Daily data never shows up in monthly accumulations of course.
Yes you have. You haven’t posted the latest CFSv2 update, instead, and I think for the first time, posted CPC/IRI forecast without posting CFS.
Come on Richard, you switched groups simply because IRI gave a lower forecast. You may not even have ben aware that you did it, but you might remember that you’ve never favoured them, and almost never (until now) copied their forecast to this board.
It’s bleeding obvious, mate. You jumped ship when the forecast was at last a cooler one than CFS.
https://www.cpc.ncep.noaa.gov/products/CFSv2/CFSv2_body.html
and for 3.4
https://www.cpc.ncep.noaa.gov/products/CFSv2/imagesInd3/nino34Mon.gif
Notice that it only updates the solid line portion monthly in arrears.
Of course
https://coralreefwatch.noaa.gov/data/5km/v3.1/current/daily/gif/cur_coraltemp5km_ssta_large.gif
does not show large blue areas near the Equator. How do you think that is going to represent in the figures?
https://www.tropicaltidbits.com/analysis/ocean/cdas-sflux_sst_global_1.png
https://www.tropicaltidbits.com/analysis/ocean/cdas-sflux_ssta_global_1.png
https://www.tropicaltidbits.com/analysis/ocean/cdas-sflux_ssta7diff_global_1.png
https://www.tropicaltidbits.com/analysis/ocean/cdas-sflux_ssta_relative_global_1.png
https://www.tropicaltidbits.com/analysis/ocean/nino12.png
https://www.tropicaltidbits.com/analysis/ocean/nino3.png
https://www.tropicaltidbits.com/analysis/ocean/nino34.png
https://www.tropicaltidbits.com/analysis/ocean/nino4.png
https://coralreefwatch.noaa.gov/data/5km/v3.1/current/daily/gif/cur_coraltemp5km_ssta_large.gif
https://coralreefwatch.noaa.gov/data/5km/v3.1/current/animation/gif/ssta_animation_90day_large.gif
CFSv2 forecast update just for you:
“The CFS.v2 ensemble mean (black dashed line) indicates a transition to ENSO neutral during the Northern Hemisphere summer, with borderline La Nina conditions favored during the fall and winter.”
Is this still your favourite forecast group, or have you changed your mind about that?
tim f…”As a simple example, molecules can absorb/emit by changes in their overall rotation. That is a PHYSICAL MOTION of the molecule. Those energies are independent of the levels of the electrons in their orbits. Same for vibrational modes for the molecules”.
***
Tim…how does a physical motion produce EM? If I throw a stone through the air, does it emit EM? If I wave a stick in the air, does it emit EM. If a bicycle wheel rotates, or a jack-hammer vibrates, does either emit EM?
What is it in a molecule that absorbs/emits EM? There is only one particle known to do that in atoms, the electron. Theoretically, a proton, being a charged particle, should emit an electromagnetic field. However, protons cannot move through conductors or change energy levels in an atom.
Something has to be emitting the EM in your molecule but claiming it is the molecule itself does not explain the EM absorp-tion or emission. You need to look deeper in the molecule. What do you see? There are only atoms bonded by electrons.
Is the EM coming from the nucleus or the electrons? Bohr said it was the electrons and that has become the basis of quantum theory.
But there’s more. Electrons are particles with mass that carry an electric charge, forming an electric field around them and producing a magnetic field when the electrons moves. Do you have to go any deeper to see where EM comes from?
Gordon Roberstson
You know what EMR is. It is oscillating electric and magnetic fields that move through space. A proton will emit EMR if it is accelerated. The moving charge in a molecule takes place because of uneven charge distribution. The vibration produces the EMR because there is a oscillating charge. The vibrational part of the molecule can absorb the energy of the EMR as well.
The vibrational part of the molecule can emit EMR energy as well.
“Timhow does a physical motion produce EM? ”
You REALLY need to go back to study basic E&M! EM radiation is created by accelerating charges. Positive charges. Negative charges. It doesn’t matter.
“Electrons are particles with mass that carry an electric charge, forming an electric field around them and producing a magnetic field when the electrons moves. ”
Replace “electrons” with “protons” and it is just as true! And guess what? When a molecule vibrates, the protons move and produce E & M fields.
How does a group of molecules (atoms) have a incremental range of temperatures measurable remotely?
Not sure what you man, but UAH measure ‘brightness’ temperature of O2 molecules to derive their temp data set we most often refer to here.
“Microwave temperature sounders like AMSU measure the very low levels of thermal microwave radiation emitted by molecular oxygen in the 50 to 60 GHz oxygen ab.sorp.tion complex. This is somewhat analogous to infrared temperature sounders (for instance, the Atmospheric InfraRed Sounder, AIRS, also on Aqua) which measure thermal emission by carbon dioxide in the atmosphere.
…At these microwave frequencies, the intensity of thermally-emitted radiation measured by the instrument is directly proportional to the temperature of the oxygen molecules. The instrument actually measures a voltage, which is digitized by the radiometer and recorded as a certain number of digital counts.”
https://www.drroyspencer.com/2010/01/how-the-uah-global-temperatures-are-produced/
As Roy has now updated his full monthly data
Global
https://climatedatablog.files.wordpress.com/2022/06/uah.jpeg
Tropics
https://climatedatablog.files.wordpress.com/2022/06/uah-tropics.jpeg
Northern Hemisphere
https://climatedatablog.files.wordpress.com/2022/06/uah-northern-hemi-1.jpeg
Northern Ex Tropics
https://climatedatablog.files.wordpress.com/2022/06/uah-northern-ex.jpeg
Northern Polar
https://climatedatablog.files.wordpress.com/2022/06/uah-north-pole.jpeg
Southern Hemisphere
https://climatedatablog.files.wordpress.com/2022/06/uah-southern-hemi.jpeg
Southern ExTropics
https://climatedatablog.files.wordpress.com/2022/06/uah-southern-ex.jpeg
Southern Polar
https://climatedatablog.files.wordpress.com/2022/06/uah-south-pole.jpeg
Lower Troposphere
https://climatedatablog.files.wordpress.com/2022/06/uah_lt.jpg
Middle Troposphere
https://climatedatablog.files.wordpress.com/2022/06/uah_mt.jpg
Tropopause
https://climatedatablog.files.wordpress.com/2022/06/uah_tp.jpg
Lower Stratosphere
https://climatedatablog.files.wordpress.com/2022/06/uah_ls.jpg
Trends
https://climatedatablog.files.wordpress.com/2022/06/uah-1.jpeg
Residuals
https://climatedatablog.files.wordpress.com/2022/06/uah-residuals.jpeg
Month on Month
https://climatedatablog.files.wordpress.com/2022/06/uah-month-on-month.jpeg
RLH
Thanks for the graphs. Useful information.
NP
RLH
This is just an eyeball reaction. NH, SH and SH POLAR were about what I expected. But NH POLAR is a bit of a surprise in that the so called Polar Amplification seems to be absent.
Do you have any insights or am I reading more into it than is what is there?
Also, the Lower Stratosphere was interesting. I dont think I have seen a similar graph.
Thanks
To see polar amplification one would look that the long term rate of change in the various regions. Below I’ve listed a decadal trend estimate for each region described in UAH. Note that “Land.x” and “Ocean.x” are sub-regions for the region immediately above, so “Land.1” is the land portion of NH, and so forth.
The “NoPol” region is warming at about twice the global average rate per UAH (0.25 C/decade vs 0.13 C/decade global).
Globe : 0.13
Land : 0.18
Ocean : 0.12
NH : 0.16
Land.1 : 0.19
Ocean.1 : 0.14
SH : 0.11
Land.2 : 0.16
Ocean.2 : 0.10
Trpcs : 0.12
Land.3 : 0.16
Ocean.3 : 0.11
NoExt : 0.19
Land.4 : 0.21
Ocean.4 : 0.17
SoExt : 0.10
Land.5 : 0.14
Ocean.5 : 0.09
NoPol : 0.25
Land.6 : 0.23
Ocean.6 : 0.27
SoPol : 0.01
Land.7 : 0.09
Ocean.7 : -0.02
USA48 : 0.18
USA49 : 0.18
AUST : 0.18
“Globe : 0.13
Land : 0.18
Ocean : 0.12”
etc.
How long do you expect that differing trend to continue between Land and Ocean?
“NoPol : 0.25
Land.6 : 0.23
Ocean.6 : 0.27
SoPol : 0.01
Land.7 : 0.09
Ocean.7 : -0.02”
Likewise the same question for the 2 Poles.
RLH, The UAH LT global land vs. ocean difference is the result of the large thermal capacity of the upper ocean. For the NoPol data, the land fraction is further to the south than the ocean fraction, which is mostly the high latitude Arctic Ocean. As I’ve tried to point out previously, sea-ice has a higher emissivity than open ocean, so the decline in Arctic sea-ice and increase in melt ponding for the remaining ice would appear as a cooling trend in the MSU/AMSU data.
The SoPol data is contaminated by the high elevations over the Antarctic continent and the effects of the Ozone hole
“The UAH LT global land vs. ocean difference is the result of the large thermal capacity of the upper ocean”
So you are saying that the difference recorded will never change in the future. So noted.
RLH, As long as humanity continues to spew greenhouse gasses into the air, warming the Earth, I would expect the global ocean temperature trend to lag the land surface temperature trend. Of course, there are many other man made changes which could impact those trends, time will tell.
ES: There could also be some natural cycles that will also have some effects.
https://www.drroyspencer.com/2022/06/uah-global-temperature-update-for-may-2022-0-17-deg-c/#comment-1305597
I post these every month. They are just simple plots of all of Roys data.
NH (and SH) Polar is what it is.
I might add a 7 years low pass to those graphs to get more insight.
Denny
Maybe this below interests you – a superposition of UAH6.0’s LT and LS anomalies for the Globe:
https://drive.google.com/file/d/1OO6HpUOvk_N_tC2fUt8wzDDvMzhYM8C_/view
… and this is how the two layers look like when using absolute temperatures instead:
https://drive.google.com/file/d/16GaarHUs7npnzyN5-wtJ7z0qODSKplVq/view
Well there’s a surprise. Absolute temperatures drop as we move further away from the surface. As though that was not know previously!
You could always compare anomalies/absolutes by subtracting the mean (or better still median) of all of the samples over the whole period to make to disparities much less and still retain the information content.
This would allow you not to include the erroneous monthly data spread that comes from only using an inevitably biased 30 samples (typically) for each month in the year to construct the ‘normals’.
” Absolute temperatures drop as we move further away from the surface. As though that was not know previously! ”
Typical egomaniac and superfluous comment from Superclimatologist Linsley-Hood.
The reason for posting the absolute data was solely to show Denny how inaccurate absolute data can be when the goal is to compare them, and how good anomalies are, due to their departure behavior, and also to the removal of the annual cycle.
You name everybody an idiot, Linsley-Hood. How far are you from being an idiot?
“The reason for posting the absolute data was solely to show Denny how inaccurate absolute data”
So anomalies which are based on just the same absolute data are ‘accurate’ but the absolute data itself is not.
Why do you publish only half of the data? Anomalies require that the normals are published also.
” This would allow you not to include the erroneous monthly data spread that comes from only using an inevitably biased 30 samples (typically) for each month in the year to construct the normals. ”
The problem with you, Linsley-Hood, is that you NEVER implemented the construction of any anomaly-based time series.
NOAA uses different reference periods. One of them is 1901-2000.
The difference between using that period and e.g. 1951-1980 or 1991-2020 is nearly negligible, despite the different amount of data available.
I made such a test years ago using GHCN V3 absolute data.
*
Start working instead of trying to teach, Linsley-Hood.
I can compare normals from any pair of data sources you wish. Name the period and the source (different of course).
It will inevitably show a month by month figure difference, not a single offset. Have you got the UAH 2 latest reference periods?
P.S. 1991-2020 is the current WMO recommendation.
“nearly negligible”
is what you boasted about for monthly USCRN data. You said your calculations were more accurate than USCRNs ones.
Denny
Having read your comment again, I’m wondering about what you write:
” But NH POLAR is a bit of a surprise in that the so called Polar Amplification seems to be absent. ”
Until now, I had understood the the (North) Polar Amplification is measured by the difference in trend between the Polar regions and the Globe.
– UAH Globe: 0.13 C / decade
– UAH North Pole: 0.25 (1.9)
From Remote Sensing Systems, much higher anomalies, but similar amplification factor.
– RSS Globe: 0.21 C / decade
– RSS North Pole: 0.47 (2.2)
What exactly did you mean?
RSS is based on a different ‘normals’ period so the anomalies cannot be compared directly to UAH.
Again, you play the dominant, all-time-better-knowing elementary school teacher, but fail through trying to explain what you yourself manifestly don’t take into account.
The different reference periods (1991-2020 versus 1979-1998) are here of no interest, Linsley-Hood.
1. We don’t speak about anomalies but about trends which are independent of the reference period chosen for anomaly construction.
UAH’s trends are for all regions and zones the same for 1981-2010, 1991-2020 and 1979-1998. Explained ad nauseam by Roy Spencer since evah.
2. Of interest was solely the amplification factor which keeps independent of the reference periods for the very same reason.
“The different reference periods (1991-2020 versus 1979-1998) are here of no interest”
They are if you compare anomalies from each source.
Interesting that you consider the 2 reference periods are simply separated by a common offset. In fact there are differences month to month.
“We dont speak about anomalies but about trends”
I’ll make the same observation as before. Do you expect that trend to continue into the far future. In both the Land/Ocean series and the North Polar/South Polar series. If not when will it end?
I post these every month. They are just simple plots of all of Roy’s data.
NH (and SH) Polar is what it is.
I might add a 7 years low pass to those graphs to get more insight.
In the recent past I have been stalked several times by the climate and statistics genius Linsley-Hood.
One of these stalking tracks was the repeated claim that running means aka moving averages were inappropriate tools for time series smoothing.
Here is a prose of him concerning that:
” Running means yet again. No accuracy needed, just something that can be done simply with Excel it seems. No need to take notice of what has been said by Vaughan Pratt about how all this should be done (even with Excel) or what others have done with S-G and LOWESS. Outside of Blinnys expertise so dont bother with it. ”
Yeah. This blog’s most ‘subtle’ {/sarc} polemicist at work…
*
Here is a graph showing the North Pole region anomalies of UAH 6.0 LT and the difference between a running mean and the Savitzky-Golay filter output:
https://drive.google.com/file/d/1KcyiUniwJMPogwnL_pagEPuN-us2DDDQ/view
Look at the tremendous inaccuracy of the running mean!
Incredible. How could I use crap like that? {/sarc}
I tested the stuff with other time windows; same result.
*
Another example, a comparison of NCEP SST anomalies for the ENSO regions Nino1+2 and Nino3+4 that I always forgot to do:
https://drive.google.com/file/d/1t0osgiXxHM5Q2PkLhqNQY7P8A3TRJ8ML/view
The differences are here somewhat more visible, agreed.
But unless you base your discourse on ideology, it’s hard to say which filter is nearer to the ‘truth’.
*
I anticipate that Linsley-Hood will try, as he did so often with his horrible ‘Are you saying that…’ or ‘So you recon that…’, to intentionally misrepresent what I wrote here.
*
I never claimed anywhere that filters based on finite impulse response, like are simple moving averages, would be the best tool for extracting the essence of time series.
But even if complex filters a la CTRM or Savitzy-Golay are in fine the better solution, this is very certainly not a reason to denigrate other people’s work by polemically discrediting the tools they use.
Basta ya!
“running means aka moving averages were inappropriate tools for time series smoothing”
What I actually said was that running means are a poor choice of Low Pass filters as they include a load of distortions due to the beating a square wave sampling methodology with the time series data. This is well acknowledged, except by Blinny it seems.
I use HQLP filters to try and introduce low distortion into the data. This includes the use of Gaussian CTRM and/or Savitzy-Golay LP filters.
And I was right in anticipating, as it shows.
So Bliny prefers added distortions instead of low distortion data. Quelle surprise.
And Linsley-Hood stays on discrediting and denigrating, like do all liars.
You perfectly know that what you write here is an utter lie.
Me rewording what you said is a lie? I think not.
Running means introduce errors as Vaughn Pratt said.
I mean, what does a small difference in numbers really matter? Even if they all add up (may be they cancel) as we go. First we have means rather than medians. Then we have different reference periods where things differ each month. Then we an have inaccurate filtering methodology. What’s that uncertainty? We know that to 0.001C because we have multiple samples. But if we put it all together it will come out correct in the end. Must do, wont it.
https://judithcurry.com/2019/12/27/two-more-degrees-by-2100/
We will have to see if the predictions of more La Nina than El Nino will have any effect on the global temperatures.
Obviously the models are not correct but how badly off are they?
Vaughan, Richard. Vaughan:
[RICHARD] Running means introduce errors as Vaughn said.
[VAUGHAN] I suggest estimating an average, suitably weighted, over the 75 years 2063-2137.
What Vaughn actually said was
“Instead of taking the goal to be estimating climate for 2100, perhaps plus or minus a few years, I suggest estimating an average, suitably weighted, over the 75 years 2063-2137”
No doubt when we get to 2137 it would be good thinking to take his advice looking back at 2100.
Vaughan Pratt said:-
1.2067 then 1.5478
12 / 1.2067 = 9.94447667191514 = ~10
12 / 1.5478 = 7.752939656286342 = ~8
So 12, 10, 8 as the yearly CTRM values
What is a weighted moving average, Richard?
Willard, please stop trolling.
Big 5 Natural Causes of Climate Change part 5: Clouds the Moderators of Warming and Extreme Heat
Jim Steele
https://www.youtube.com/watch?v=tiQ6bLiWNmw
Transcript
https://perhapsallnatural.blogspot.com/2022/06/big-5-natural-causes-of-climate-change.html
Having been busy these days with NCEP’s ENSO SST data, I thought it would make sense to compare NCEP’s Nino3+4 and Nino1+2 data with UAH’s LT grid data for the grid cells exactly above these regions (5S-5N — 170W-120W resp. 0S-10S — 90W-80W):
https://drive.google.com/file/d/1f0qJxzwaBpDxQ8Z5RPAj5A3Z3GtXq7MW/view
What an amazing correlation!
*
The comparison of NCEP with UAH for Nino1+2 however shows less correlation, maybe due to the very small Nino1+2 region:
https://drive.google.com/file/d/1kZDJDMTTJfU8AotUweXYhtkABd0RZuML/view
Care to publish the normals on which those anomalies are based?
On dirait que Linsley-Hood est tellement dominé par son propre complexe de supériorité qu'il n'a même plus le temps de lire les graphiques avec l'attention qui s'impose…
Buvez un bon coup de rouge, allez vous coucher et laissez-moi donc en paix, Linsley-Hood.
Vous êtes incroyablement ennuyeux.
I hate this blog scanner.
Should read
On dirait que Linsley-Hood est tellement dominé par son propre complexe de supériorité qu'il n'a même plus le temps de lire les graphiques avec l'attention qui s'impose…
Buvez un bon coup de rouge, allez vous coucher et laissez-moi donc en paix, Linsley-Hood.
Vous êtes incroyablement ennuyeux.
For those who don’t speak French.
“Looks like Linsley-Hood is so overpowered. by his own superiority complex; that he doesn’t even have time to read the charts with due attention…
Drink a good shot of red, go to bed, and leave me alone, Linsley-Hood.
You are incredibly boring.”
So you don’t think that having all of the data is useful in a scientific context.
” So you dont think that having all of the data is useful in a scientific context. ”
What about reading the charts again, Linsley-Hood, instead of endlessly insinuating?
What about looking at what I posted about alternative methods for reducing the spread without introducing the monthly errors that choosing any particular reference period does?
https://www.drroyspencer.com/2022/06/uah-global-temperature-update-for-may-2022-0-17-deg-c/#comment-1311227
Publish the normals on which those anomalies are based.
Doesn’t matter what language you speak, it’s all crap.
Blinny hides behind a ‘nom-de-plume’. He does have the courage to publish his real name.
R H L hath spoken!
What’s Eboy’s name, again?
What’s yours?
I use a nom-de-plume by request to avoid embarrassing my children. They don’t want it known that their old dad argues with climate change denialists.
I just report the data with HQLP filters added.
Gordo and Troglodyte make fools of themselves daily under their alleged birth names.
R L H lies in an intriguing in-between.
I have long posted under my real name, in fact ever since the Internet came around.
That you post under your name from time to time may not imply everybody knows you. Take Antonin, for instance. He did not stumble upon it before you started your spamming campaign against him.
Why do you keep stretching the bounds of justified disingenuousness, Richard?
Why do you think that I post under my initials rather than my full name? Could there be a reason for that?
[RLH] B hides behind a “nom-de-plume”. He does [not] have the courage to publish his real name.
[ALSO RLH] Why do you think that I post under my initials rather than my full name? Could there be a reason for that?
My initials are directly linked to my full name. Can you find where?
[RLH] B hides behind a nom-de-plume. He does [not] have the courage to publish his real name.
[ALSO RLH] Why do you think that I post under my initials rather than my full name? Could there be a reason for that?
[AND THEN RLH] My initials are directly linked to my full name. Can you find where?
“Can you find where?”
Well can you?
Why do you think I keep calling you “Richard,” Richard, and why would you expect readers to be ninjas?
Willard, please stop trolling.
Superdeveloping La Nina progress has been updated
https://i.postimg.cc/htXWCXq7/mei-lifecycle-current.png
Not unprecedented at all. Even though this month is below all the other at this month in the cycle. Who need records?
For those who prefer their urls on the net rather than just images.
https://psl.noaa.gov/enso/mei/img/mei_lifecycle_current.png
MEI v2 starts in 1979.
Before that year, there were lots of El Ninos and La Ninas.
And there was also MEI v1, with historical data going back to 1871:
https://psl.noaa.gov/enso/mei.ext/
Then, the current situation looks like this:
https://drive.google.com/file/d/1OFB3GczUOmJ-T1IwbmVFa3NuRaWpSIaO/view
But… that was the past, which for some doesn’t exist anymore, unless they suddenly need it back again.
*
But as I’ve admitted many times, the current La Nina is more enduring than I thought at the same time last year: it has now 24 months of activity.
I’m not thrilled at all!
Still hoping for La Nina going away ???
You can take some tips from these guys
https://youtu.be/aMTLs4qfJtI
There soon will be statistically significant more La Nina than El Nino over the last 25 years. According to climate.gov.
https://drive.google.com/file/d/1OFB3GczUOmJ-T1IwbmVFa3NuRaWpSIaO/view
Of course the monthly curve, whilst a record for this time in the cycle, is not unprecedented.
Now that’s the truth.
Not big on irony are you? How can a record not be unprecedented?
Oh dear, I thought you’d grown up.
I love irony. I’m not big on sensationalizing.
At least 5 of the double-dip la Ninas has a record-breaking, unprecedented month.
Five!
When you read some ‘warmist’ here saying that a certain month is the warmest in the record – let’s say it was the warmest September ever since 1979….
Do you go wow?
Or, please be honest, what do you actually think?
How can a record not be unprecedented?
I thought you might answer my question. Oh well, nicely dodged.
Today marks the longest amount of time I have been alive.
Is my age unprecedented?
It actually is for me. But the meaning of the word ‘unprecedented’ is traduced here.
Or more analogously…
I have never been so cold as the past week. This was unprecedented for me.
But other people have been even colder than me.
Calling this unprecedented, just because it happened to this particular human being is silly. Like trying to create excitement over something that has actually happened before with even greater intensity, but not at the same time (day, month, season).
You can call the recent low in la Nina unprecedented for the particular time of year, but the descriptor is just sensationalism, as with the above. Other double dip la Ninas have been colder at other times. Why being the coldest in May this year, but not the coldest at other times, nor the longest la Nina double dip, nor the coldest on average… is sensational, I’m not sure.
I also don’t find ‘warmest September ever’ particularly impressive, and you saw me very recently telling someone who advanced a similar idea (on the ‘warmist’ side) that one month’s datum tells you next to nothing. You are pushing the same kind of hype in a different direction.
And apparently now pretending that it’s simply a technical term. Pfffft.
May 2022 was the warmest May in the temperature record that occurred during any double-dip la Nina.
By George, this is unprecedented!
Climate.gov does not agree with you.
https://imgur.com/gallery/8AC3rda
Where do they contradict that May 2022 was the warmest ever May in a double-dip la Nina?
I don’t see anything about that in your link, nor the word “unprecedented” in relation to the double-dip la Nina.
I had another look. You’re not gunna believe this.
In 2022
January was the warmest ever January in a double-dip la Nina
February was the warmest ever February in a double-dip la Nina
March was the warmest ever March in a double-dip la Nina
April was the warmest ever April in a double-dip la Nina
May was the warmest ever May in a double-dip la Nina
Unprecedented 5 times in a row!!!!
But there’s more.
That’s 3 tri-month averages the warmest ever in a double dip la Nina all in the same 5 months!!
Unprecedented, by jingo.
And I’m pretty sure the climate.gov website aint disagreeing with me.
If we get some more unprecedented lows in la Nina for the time of year, we can double-team these stats and get some really intense unprecedentds going, yeah? High five!
La Nina explains superdeveloping La Nina is the most intense at this time of the year since 1950 and the effect of it
https://youtu.be/5vWwxOaXNUg
Bindicast La Nina gone by April LOL ,
Did you save some ha ha has for this ??? I did.
Did he say which year? : )
tim f…”Replace electrons with protons and it is just as true! And guess what? When a molecule vibrates, the protons move and produce E & M fields”.
***
Now you are being an idiot by claiming I need to return to school while you spew out such nonsense.
You are trying to claim that protons in the nucleus of an atom can produce EM just as easily as electrons. Silly Bohr, silly Schrodinger, and all those who contributed to quantum theory for not noticing Tim’s theory. Both Bohr and Schrodinger based quantum theory on the properties of electrons, they only used the nucleus for base measurement to the first electron orbital (Bohr radius), and for mass measurements.
Why do you think it is, in all of quantum theory related to atoms, that only electron transitions are credited with emitting and absorbing EM?
At least you have progressed, Tim, you are now looking inside the molecule rather than positing innuendo about magical locations in a molecule that can absorb and emit EM.
Daily Sun: 07 Jun 22
Solar wind
speed: 302.5 km/sec
density: 8.47 protons/cm3
Sunspot number: 45
Oulu Neutron Counts
Percentages of the Space Age average:
today: +3.9% Elevated
48-hr change: -0.8%
https://www.spaceweather.com/
“QUIET SUN: Following months of almost uninterrupted solar activity, the sun is taking a break. Today there are only a handful of small sunspots, and not one of them poses a threat for strong flares.”
–THE VENUS CLOUD DISCONTINUITY: A towering wall of acid clouds is racing through the atmosphere of Venus. Luigi Morrone photographed it from Agerola, Italy, on June 4th:
“It’s called the Venus Cloud Discontinuity,” says Morrone, who is part of an international network of amateur astronomers who have been tracking the massive structure. “I used a 14-inch Celestron telescope to record the discontinuity twice in 20 minutes.”
The Venus Cloud Discontinuity is a relatively new discovery, photographed by Japan’s Venus orbiter Akatsuki in 2016 and first spotted by JAXA scientist Javier Peralta. The massive structure cuts vertically across Venus’s equator, stretching almost 5000 miles from end to end, and circles the planet faster than 200 mph, making one lap every ~5 Earth days.
Researchers following up on the discovery soon stumbled onto another surprise. Older photographs of Venus showed it, too. “[The Cloud Discontinuity] is a recurrent phenomenon that has gone unnoticed since at least the year 1983,” —
That posted, other posts didn’t. And continue regarding, VENUS CLOUD DISCONTINUITY.
“Researchers still aren’t sure what the Cloud Discontinuity is. “This atmospheric disruption is a new meteorological phenomenon, unseen on other planets. Because of this it is difficult to provide a confident physical interpretation,” says Peralta. Numerical simulations suggest that it might be some kind of exotic nonlinear Kelvin wave; the jury’s still out.
Whatever it is, the structure might help solve a longstanding mystery: Why does Venus’s atmosphere rotate so much faster than the planet itself? The hot, deadly air on Venus spins nearly 60 times faster than its surface, an effect known as “super-rotation.” Venus’s Cloud Discontinuity could be assisting the spin-up by transporting angular momentum from the deep atmosphere to the cloudtops. “
Solar wind
speed: 314.1 km/sec
density: 6.86 protons/cm3
Sunspot number: 23
Updated 08 Jun 2022
Thermosphere Climate Index
today: 14.48×10^10 W Neutral
Oulu Neutron Counts
Percentages of the Space Age average:
today: +4.5% Elevated
The Cloud Discontinuity: It seems one will in most intense sunlight where sun is closer to zenith {angle sun higher 45 degrees above horizon [or less 45 degree away from zenith].
If air was not moving, it make bubble or donut. But since it’s moving, air enter at -45 degree, reaches 0, and leaves at + 45 degrees longitude.
And have regions near polar regions getting very little sunlight and air cooling and falling [and replaced warmed higher air from “tropics”].
And Venus terminator line is supposed to falling upper air which might make a large sound.
Anyhow it seems one has many things making lines/waves/walls. And assume the Sun gravity gradient would create tides.
Daily Sun: 08 Jun 22
Solar wind
speed: 305.8 km/sec
density: 9.40 protons/cm3
Sunspot number: 0
Spotless Days
Current Stretch: 1 day
Thermosphere Climate Index
today: 14.51×10^10 W Neutral
Oulu Neutron Counts
Percentages of the Space Age average:
today: +5.0% Elevated
48-hr change: +0.2%
{bad time to go to Mars}
[and Atmosphere has not increased drag much in this Solar Max,
so space debris has been removed much}
Also:
“BLANK SUN: Today the sun is blank–no sunspots. This is a remarkable development more than 2 years after the start of surging Solar Cycle 25. The situation won’t last long, though. NASA’s STEREO-A spacecraft is monitoring a likely sunspot group approaching from behind the sun’s northeastern limb.”
https://www.spaceweather.com/
A new sunspot is growing at the circled location.
[[And the other sunspot coming to near side, have not arrived,
yet, from the farside of sun]]
Spotless Days
Current Stretch: 0 days
2022 total: 1 day (<1%)
Solar wind
speed: 288.7 km/sec
density: 14.31 protons/cm3
Thermosphere Climate Index
today: 14.36×10¹⁰ W Neutral
Oulu Neutron Counts
Percentages of the Space Age average:
today: +5.5% High
48-hr change: +1.6%
[getting worse to go to Mars}
"A STRANGE NEW SUNSPOT: A new sunspot is emerging in the sun's southern hemisphere–and it's a little strange. For one thing, it is circular. For another, its magnetic field is tilted 90 degrees away from normal sunspots. This one merits watching."
https://www.spaceweather.com/
[the sun is strange and I would guess is going to get even weirder, but I sure the sun is doing just fine, we just don't understand it.
We don't understand many things. We need to explore space, to have any chance of knowing anything.]
Daily Sun: 11 Jun 22
Solar wind
speed: 347.5 km/sec
density: 12.16 protons/cm3
Sunspot number: 33
Thermosphere Climate Index
today: 14.12×10^10 W Neutral
Oulu Neutron Counts
Percentages of the Space Age average:
today: +6.5% High
48-hr change: +1.5%
Solar min type conditions, very bad time to go to
Mars- unless you have a lot radiation shielding.
And if got starship that can carry 100 passengers and you are bringing 3 crew to Mars, one could have a lot radiation shielding.
Other than water, liquid Hydrogen is good shielding.
And if bring say 20 tons of LH2, one make a lot water if combined
with CO2 of Mars atmosphere to make Liquid Methane.
But of course one going to send crew to Mars anytime soon, but in future when could send crew GCR could be much higher – higher than we ever seen.
Anyways, what we are probably seeing is double peak, but could be weaker than cycle 24.
norman…”You know what EMR is. It is oscillating electric and magnetic fields that move through space. A proton will emit EMR if it is accelerated. The moving charge in a molecule takes place because of uneven charge distribution. The vibration produces the EMR because there is a oscillating charge. The vibrational part of the molecule can absorb the energy of the EMR as well”.
***
I don’t use the acronym EMR since in my field, EM suffices, You know immediately that EM is radiation and I find it redundant to add the R.
I mentioned in a recent post that protons as positive charges should emit EM as well, however, everything we do in the electronics/electrical field is based on electrons, not protons.
An atom or molecule moving through space is surrounded by the negative charges of electrons, but that won’t generate an electromagnetic field with a frequency since linear motion is not a vibratory motion. It might produce a stationary EM filed, like around a magnet, but it won’t have a frequency associated.
Within the atom, it’s a different matter. Electrons are moving in orbits at incredible speeds. However, it’s not till the electron drops down to a lower orbit that it emits a quantum of EM equal to the potential difference between orbital energy levels and the angular frequency of the electron at the higher orbital.
The frequency imparted to emitted EM is based on the number of times the electron orbits the higher energy level per second. When it does make the jump downward, the frequency emitted is totally discrete, measurable at one frequency or wavelength.
It makes no sense to claim the same for protons since they don’t change energy levels in a nucleus.
The uneven charge distribution to which you refer is caused by electronegativity. The more protons an atom has the more it can attract electrons to it. In the CO2 molecule, there are two oxygen atoms at either end of bonds to a carbon atom. The O-atom is more electronegative therefore electrons it shares with carbon tend to be found closer to the oxygen atom, making the bond polarized with its negative end at the O-atoms. The C-atoms side is not positive, it is less negative, meaning it is positive only wrt the O-atom electron charge.
Here again, that won’t generate EM because the electrons in the covalent bonds are orbiting both atoms and a static accumulation of charge won’t generate EM. EM emission occurs only at one discrete frequency related to electrons dropping from one particular orbital energy level to another.
Gordon,
Niels Bohr would like to contradict you.
You said:
“The constituent atoms can dictate the shape of the molecule, its atomic weight, obviously, it particular charge, etc., but nothing is added that can deal with EM separate from the electrons already making up the atoms.”
Bohr said:
“furthermore, hydrogen atoms at ordinary conditions combine into molecules, i.e., into system in which the electrons have frequencies different from those in the atoms”
On the Constitution of Atoms and Molecules Niels Bohr, 1913 (p. 15)
As we keep telling you, it is the structure of molecules that determine the frequencies at which the electrons operate, and which determines the spectra at which radiation is absorbed.
The section that quote comes from, by the way, is titled “Ab.sorp.tion of Radiation.”
You need to re-read what you think you’ve learned.
barry…”Bohr said:
furthermore, hydrogen atoms at ordinary conditions combine into molecules, i.e., into system in which the electrons have frequencies different from those in the atoms”
***
Glad you are reading Bohr but you are cherry-picking him. The two atoms making up the hydrogen atoms in the hydrogen molecule are still two proton nucleii and two electrons. Naturally, the bonding will involve different orbitals hence difference frequencies.
Here’s info on the straight hydrogen atom with one obvious error, they claim the Bohr model was replaced by quantum theory, Bohr uses quantum theory as the basis of his model.
https://en.wikipedia.org/wiki/Hydrogen_spectral_series
There are a lot of snobs in the quantum field who tend to follow sci-fi versions of quantum theory. Bohr became guilty of that later in his career and alienated Einstein and Schrodinger.
When you combine two hydrogen atoms you can have several isotopes like deuterium and tritium. Deuterium differs from singular hydrogen since it has a neutron in its nucleus making it heavier. Apparently that affects it emission spectra but very little.
“In this projects, we calculated three of the visible wavelengths in the hydrogen spectrum to be 656.478 nm, 486.542 nm, and 434.415 nm. For deuterium we calculated that these wavelengths shift to 656.296 nm, 486.409 nm, and 434.295 nm respectively due to the additional mass in the neutron in the nucleus.
http://myslu.stlawu.edu/~jmil/physics/legacy/student_projects/2001/fiacco.shtml
No matter how you look at it, there are only two charged particles in any atoms, protons and neutrons, and they account for all vibration and rotation. The electrons deal with the EM.
GR: How can a hydrogen atom or molecule have a range of incremental temperatures that can be measured remotely via EM(R)? Surely it can only show discrete temperatures according to you?
The electrons will follow any fibrational movement in the protons.
Hydrogen atoms should only have one proton. H2 molecule should have two. Electrons have a charge that counteracts the proton’s positive charge.
You guys are funny the way you quote Wiki all the time. EMR occurs when a photon is emitted from a molecule due to a change in energy state. These energy states are quantized. Photons are emitted when it goes from a higher energy state to a lower energy state. Absorp.tion of photons or kinetic energy elevates atoms or molecules to a higher energy state. The absorbing energy must match the change in quantized energy levels.
“EMR occurs when a photon is emitted from a molecule due to a change in energy state”
EMR is also produced when electric charges move.
“Electrons have a charge that counteracts the protons positive charge”
What is the mass ratio between electrons and protons?
Protons have a lot more mass of course. They are essentially hydrogen ions. Protons have an atomic mass of 1 whereas electrons are 10 to the minus twenty-something, going from memory. Smaller than Avogadro’s number.
So if protons vibrate they will move the electrons around, not so much in the other direction.
>EMR is produced when electric charges move.
In order to emit a photon, energy has to change from a higher state to a lower state. Energy has to be conserved. Even with an X-ray machine energy has to be conserved. Those are high energy state (high frequency) electrons created from applied voltage.
“In order to emit a photon, energy has to change from a higher state to a lower state”
So all that guff about moving charges producing changing electromagnetic fields are wrong, or are those fields carried by something other than EM?
Sorry, I meant inverse of Avogadro’s number-10^0/10^23.
No, not guff. Charges moving through a magnetic field would be like a car skidding on asphalt. The magnetic field would act as resistance to the charge, changing its energy state. A photon could be emitted but energy/mass must be conserved.
Also, if a proton or electron flips, like in NMR, this is a change in the energy state.
Charges moving even without a background magnetic field produce EM.
Give me an example.
I mean for instance if you had a proton stream. They’re produced at high energy and immediately start decelerating so I can see where the change in energy produces a photon. Charged particles in a zero-gravity field, and vacuum, have no interactions produce no EM.
Charged radioactive decay daughters produce gamma rays but they are at a higher unstable state and go to a lower state, emitting a photon. Again, energy is conserved.
“Give me an example”
Electrostatic charges.
“Glad you are reading Bohr”
But you aren’t Gordon.
He explains that when the atoms form molecules, this changes the frequencies of the atoms:
“furthermore, hydrogen atoms at ordinary conditions combine into molecules, i.e., into systems in which the electrons have frequencies different from those in the atoms”
This accords perfectly with the link I gave you describing how molecules of different structure absorb differently, and the empirical database of spectra for different atoms and molecules, where different molecules comprised of the same variety of atoms have different spectral lines.
There is no object in the universe that has a single spectral line.
There is no object in the universe that emits and absorbs at one frequency or that has a single energy state. every object, molecule and atom has a broad range of wavelengths at which it emits, and energy states it can attain.
That is why warmer objects can absorb radiation from colder ones – cold objects emit at frequencies and energies which overlap with those of warmer ones.
Bohr offers you some advice:
“Experiments on the phenomena of X-rays suggest that… the emission and ab.sorp.tion of radiation cannot be treated by the help of the ordinary electrodynamics…
…the theory of the stationary states possibly may afford a simple basis of representing a number of experimental facts which cannot be explained by help of the ordinary electrodynamics, and that assumptions used do not seem to be inconsistent with experiments on phenomena for which a satisfactory explanation has been given by the classical dynamics and the wave theory of light.”
I gather from phrases and concepts you’ve used here that you are conversant with the physics of electricity. The same rules do not apply equally to EM radiation, though some generalities do. You cannot analogise radiative ab.sorp.tion with electronics, nor mistake one for the other.
In the same way that one cannot mistake heat transfer per classical thermodynamics with radiative transfer per statistical mechanics.
All that keyboard extravaganza just to attempt to cover his perversion of physics. barry keeps trying to boil water with ice cubes — “That is why warmer objects can absorb radiation from colder ones…”
Warmer objects can ALSO reflect photons. There is NO natural mechanism that requires an object to absorb photons. Photons get reflected all the time. That’s why we see things. Our eyes are detecting reflected photons. For photons to be absorbed, a surface has to have a compatible molecular structure and a compatible temperature, with the arriving photons.
barry doesn’t understand the relevant physics. He didn’t even realize his beliefs meant that ice cubes could boil water. He probably still doesn’t understand that because he’s braindead.
Actually it is you, Clint R, that doesn’t understand the physics.
Barry, who clearly has a better understanding of quantum physics, is correct.
You are wrong, wrong, wrong.
I’m not wrong, troll Ken. I just go with reality, which is counter to your cult beliefs. As I recall, you even supported the nonsense that ice cubes can boil water!
There’s NO evidence you understand any of this.
But keep trolling in support of your fellow cult idiots. They need all the help they can get….
Clint R
Complete bullshit!
There is nothing in physics that has IR reflecting off a surface off a surface based on temperature of the surface. You just make up stupid things and call them reality. You suffer God Complex. You think your mind creates reality. Show us where there is an equation that has reflectivity of IR based on surface temp. If you can’t provide this then kindly shut-up!
Hi Norman.
If I provide you with a source, will you agree to not comment here for 90 days?
(You need a break from your meltdown anyway. You’re frothing at the mouth.)
Clint R
You will never provide proof. Evidence is not in yor agenda of misleading the ignorant. No you are not capable of proving any of your false points. It does not prevent you from intentional deceit.
Once again we see your aversion to learning, Norman.
Likely that’s why you’re always angry and frustrated.
“barry keeps trying to boil water with ice cubes”
Liar. Dirty liar, actually, as it’s been repeated so often.
If you don’t like the label, please quote me “trying to boil water with ice cubes.”
I’ll state (once more *1) that I completely disagree this is possible to do with the radiative flux emitted by ice cubes. And I’ll save this comment to demonstrate that you have been told (again *2), and also to refer to when we see below that you either:
a) don’t quote me
b) fail to respond
Thus demonstrating your lie.
barry, you don’t understand any of this and you don’t even understand that you don’t understand. Let me try to explain, again.
* You believe that fluxes add.
* An ice cube emits 315 W/m^2
* You believe two 315 W/m^2 fluxes arriving the same surface add to 630 W/m^2.
* If that surface has emissivity = 1, and is perfectly insulated on the back, it will be emitting 630 W/m^2 at equilibrium, you believe
* That means the surface is at 325 K, due to the two 315 W/m^2 irradiances
It follows then that three 315 W/m^2 fluxes would result in 945 W/m^2 and then, 359 K. And 4 315 W/m^2 fluxes would result in 1260 W/m^2, 386 K.
386 K = 113C = 235F, is plenty enough to boil water.
You believe ice can boil water, but you’re too braindead to realize it. And your lame insults confirm your devotion to your cult.
That’s why this is so much fun.
barry, Clint R hasn’t ever been able to understand ice cubes emit diffuse radiation into a hemisphere of directions from their surfaces. That type of radiation cannot be focused onto one surface in such a short distance.
Dr. Spencer proved Clint’s 6:45 am comment wrong using experiments years ago but Clint persists in writing humorously wrong physics comments creating “so much fun” as Clint writes.
Braindead4, are you now denying all of your previous comments where you stated ice can boil water?
No humorous Clint 8:27 am, Dr. Spencer’s experiments showed how to boil water with added ice cubes.
Dr. Spencer must be a great scientist.
Thank you, Clint. you did not quote me saying the radiative flux from ice cubes could boil water. So you are indeed a liar.
“You believe that fluxes add.”
Inasmuch as I trust physics texts saying so over your unsubstantiated announcements to the contrary? Certainly.
“An ice cube emits 315 W/m^2”
No. An ice cube emits 306 W/m2, because it is not a blackbody. Ice has emissivity of 0.97, not 1. But let’s keep to the same ol’ wrong numbers for convenience.
“You believe two 315 W/m^2 fluxes arriving the same surface add to 630 W/m^2.”
Yep. But that flux arriving at the same surface could not be emitted by 2 ice cubes, because view F < 1. You are, as always, completely neglecting view factor with yer daft ice cubes thing.
"If that surface has emissivity = 1, and is perfectly insulated on the back, it will be emitting 630 W/m^2 at equilibrium, you believe"
Nope. You have not factored in the rest of the environment F < 1.
"That means the surface is at 325 K, due to the two 315 W/m^2 irradiances"
Nope. You have not factored in the rest of the environment. Two ice cubes or 3 ice cubes or 100 ice cubes won't irradiate a surface to 315 W/m2. The only way this could happen is if the entire hemisphere of view was one big dome of ice, and the resulting irradiance on the surface could then be only 315 W/m2 (or more properly, 306 W/m2), maximum.
For just one ice cube to irradiate a surface at 315 W/m2, the view factor has to be unity. And if you're thinking that subdividing that unitary dome of ice into a dome of ice cubes will present a confounding issue for summing, then you will have neglected to account for the subdivision of the area component as well.
View factors, Clint. Learn about them.
View factors is why two fluxes yielding 315 W/m2 to a surface must come from sources each with a radiosity (emission + reflection) greater than 315 W/m2.
This is why 2 lightbulbs can provide 2 independent fluxes that can be summed higher than 315 W/m2, but 2 ice cubes can't. The temperature of ice is obviously capped. The temperature of the lightbulbs will be whatever they need to be to provide 315 W/m2 each to the surface, depending on view factor.
Sorry barry, but I didn’t read it all. It seems you are trying to deny your own nonsense, while still clinging to it.
You can waste more time on your keyboard than Norman.
And, that’s saying a lot….
“View factors, Clint. Learn about them.”
Oh, the irony.
” You believe that fluxes add.”
Actually Barry’s legitimate source showed that, and Clint acknowledged it.
“* An ice cube emits 315 W/m^2”
OK
“You believe two 315 W/m^2 fluxes arriving the same surface add to 630 W/m^2.”
Again, the source showed just that, and Clint acknowledged it.
Clint has no source that disputes this.
Oh well, facts don’t matter to this loser.
Yeah DREMT, I missed that part about “view factors”. It’s just more evidence barry doesn’t understand any of this. He reads something on wiki, and believes he understands it!
View factors have NOTHING to do with my comment. I’m clearly talking about the flux arriving at the surface.
And barry keeps making a big deal about the exact flux an ice cube emits. That’s just another distraction. If the arriving flux is not enough, he’s allowed to add more ice. Because, in his perverted cult, flux simply adds. So if one ice cube only brings 300 W/m^2 to the surface, a second ice cube would bring the total to 600 W/m^2, in his perverted “thinking”. I’ve always said they can use all the ice they want. They STILL can’t boil water with only ice.
Must be frustrating for barry to be constantly undermined in his arguments by Ball4 and bobdroege, who are both happy to brazenly state that ice cubes can boil water, and believe it is proven by experiment. Of course, bob’s experiment involves blocking convective cooling using an ice lid, so it has absolutely nothing to do with radiative heat transfer and thus proves absolutely nothing of any relevance to the discussion…and God only knows what experiment of Dr Spencer’s Ball4 is talking about, because he never says…but still, must be frustrating for the barryster.
DREMPTY,
Yes, once in a while a blind pig finds an acorn.
You are correct that my claim to be able to boil water using an ice lid is irrelevant.
That’s because Clint R’s claim that the greenhouse effect is like trying to boil water with ice is also irrelevant.
It stems from a misunderstanding of the Wien displacement law and the inference that CO2 in the atmosphere acts like a blackbody.
Both of which are straw man arguments against the greenhouse effect theory and have no merit.
DREMT 7:05 am, surely even you can type the word “experiment” into this blog’s search engine.
Yes, Ball4, I did that the last time you mentioned it. Which of the many results are you referring to as the particular experiment in which Dr Spencer "showed how to boil water with added ice cubes"?
All hits that have the word “experiment” in the post title.
Braindead bob gets it all WRONG, again.
Believing that CO2 can heat the surface is like believing ice cubes can boil water. The false beliefs come from the false beliefs that fluxes simply add. In the case of CO2, the false belief is flux from CO2 in the atmosphere adds to solar to raise Earth’s temperature. But, we know from radiative physics and thermodynamics, that fluxes do NOT simply add.
The braindead cult idiots can’t understand this. That’s why it’s so much fun.
“We” meaning DREMT and Clint wrongly know from using incorrect radiative physics and incorrect thermodynamics; proven once the experiments reported on this blog are properly understood.
OK, I looked at “all hits that have the word “experiment” in the post title”, and in none of them did Dr Spencer show “how to boil water with added ice cubes". Ball4 is lying again. He does that a lot.
Yes, I believe that is Troll Trick #26 — “Claim a link or source says something it doesn’t say”.
Ball4 is infamous for using that trick a lot. He used it extensively with his “real 255 K nonsense”. Norman has learned to use it also.
Sure, those wrong answers are expected from DREMT and Clint R who both repeatedly incorrectly claim the 1LOT has been debunked.
All “experiment” hits on Dr. Spencer’s posts mean: “Experiment Results Show a Cool Object Can Make a Warm Object Warmer Still”
An ice cube is an added cool object compared to warmer object such as water about to boil on surface at 1bar in Alabama summer. Dr. Spencer experimentally shows how to boil water adding ice cubes thus the 1LOT has NOT been debunked as DREMT and Clint R repeatedly claim.
Clint R.
“But, we know from radiative physics and thermodynamics, that fluxes do NOT simply add.”
Maybe you could find a source that supports that thought, or maybe you could admit that they do add, but like vectors.
And that the Trenberth diagram does add them that way.
Nah, you are not man enough to do that.
You are hiding behind your real 255 degree surface.
So, according to Ball4, unless you agree that an experiment by Dr Spencer involving convection proves that ice cubes can boil water, you are claiming that 1LoT has been debunked!? I’m not sure, it’s hard to make sense of what he’s saying. It’s like he’s drunk, most of the time.
“Must be frustrating for barry to be constantly undermined in his arguments by Ball4 and bobdroege”
Is that’s what’s happening?
Well I thought that they were referring to but not explaining how they reckon ice could be used to boil water, probably through an apparatus where the ice is used to reduce convection from a heated area. Igloos do that. I haven’t paid much attention to that conversation, and it happened way before this thread.
I’m pretty sure they would agree that it is impossible for the radiative flux of any number of ice cubes to boil water, as I’ve been saying. Maybe someone could ask them?
Sure, barry, you can try getting a straight answer out of Ball4 if you like.
barry, refer to Dr. Spencer’s past posts titled: “Experiment Results Show a Cool Object Can Make a Warm Object Warmer Still” to learn how added ice cubes can increase the temperature of surface water several inches deep overnight in summertime Alabama both theoretically and practically.
Ball4 undermines barry again.
Dr. Spencers testing completely undermines the often physically wrong “so much fun” Clint R.
Ball4 keeps undermining barry.
We have the by NASA the satellite measured mean temperatures at 1 bar level for gaseous planets.
Gaseous Planets Jupiter, Saturn, Neptune at1bar level mean temperatures T1bar 165 K, 134 K, 72 K comparison.
Gaseous planets Jupiter, Saturn and Neptune average at 1bar level (satellite measured) temperatures T1bar relate (everything else equals) as their rotational spins’ (N) sixteenth root.
It happens the same exactly way as the rocky inner planets Mercury, Moon and Mars average surface temperatures, and also as the Earth with Europa average surface temperatures.
It is a demonstration of the Planet Rotational Warming Phenomenon.
Please visit my site at page “JupiterSaturn165/134” where I have demonstrated the temperatures comparisons.
Link:
https://www.cristos-vournas.com/445559910
“The internal heat generation of Jupiter is about 6 Watts per square meter. The amount of sun energy that falls onto Jupiter is about 10 watts per square meter. So unlike the case on Earth Jupiter’s output due to internal processes (contraction) is about half as large as the input due to sunlight falling on its clouds.”
https://scienceline.ucsb.edu/getkey.php?key=65
Agree or disagree?
Thank you, gbaikie, for you respond.
Yes, I disagree with the concept Jupiter or the other gaseous planets having any significant (comparable with the incident solar flux) the inner source energy output.
https://www.cristos-vournas.com
Ok. I don’t have any specific opinion about the amount internal heat generated which is in turn emitted to space from Jupiter, but do you disagree with number of about 5 watts per square meter and that Earth number is about .01 watts per square meter or compared to Earth the difference being Jupiter emits about 500 times more per square meter.
Yes, I disagree.
https://www.cristos-vournas.com
https://www.nature.com/articles/s41467-018-06107-2#:
IIRC Jupiter is a net emitter of radiation. The extra energy is thought to come from two main processes.
1) Radioactive decay.
2) The planet is shrinking slowly, converting gravitational potential energy into heat. A similar process was once suggested to explain global warming on Earth, but the maths didn’t work out.
A basic energy budget for Jupiter looks like this.
Input:-
Solar irradiance 50W/m^2
Insolation at TOA 50/4= 12.5W/m^2
Albedo 0.5.
Absorbed at top of atmosphere 12.5*0.5= 6.25W/m^2
Output:-
Brightness temperature 109K
Radiant emission 7.6W/m^2
https://www.spectralcalc.com/blackbody_calculator/blackbody.php
The planet absorbs 6.25W/m^2 and emits 7.6W/m^2. That is a net emission of 1.35W/m^2. Jupiter is emitting more energy than it receives.
Your “energy budget” is as flawed for Jupiter as is the one for Earth, Ent.
“Brightness temperature 109K”.
Planets are not blackbodies…
But let’s, for discussion sake, let’s calculate the Jupiter’s planet blackbody effective temperature (the brightness temperature):
Te = [(1-a)S /4σ]∕ ⁴
let’s substitute a =0,503
S = 50 W/^2
Te = [(1-0,503)50(W/m^2) /4*5,67*10⁻⁸(W/m2K⁴)] ∕ ⁴ =
Te = (0,497*50 /4*5,67*10⁻⁸) ∕ ⁴ =
Te = (109.569.901) ∕ ⁴ = 102,3 K
So we have Jupiter’s brightness temperature Te =102,3 K
https://www.cristos-vournas.com
Earth’s a gray body. Just as is CO2. And, everything else that isn’t black.
While there are no known perfect blackbodies, our sun is a close approximate. Its radiation profile is very close to that of a blackbody at the same temperature.
The Sun emits radiation over the entire spectrum. Black bodies don’t.
By definition blackbodies emit perfectly at the designated temperature. Every object in the known universe at a given temperature emits less perfectly than a blackbody at the same temperature.
That is why emissivity is expressed as the fraction of a blackbody in the math. The sun’s emissivity is approx 0.99. A blackbody is 1.
https://open.library.okstate.edu/rainorshine/chapter/11-2-radiation-basics/
Thus, a blackbody would emit in as broad a spectrum as the sun, if not slightly broader, and would have no defect in the radiation spectrum, whereas the sun does.
https://cseligman.com/text/sun/blackbody.htm
That doesn’t really make sense to me. A black body at around 288K emits mostly infrared. To emit other wavelengths the body’s temperature has to change. The Sun, at over 5000K, emits the entire spectrum. This isn’t due to blackbody emission but fusion, magnetic fields, gravity, loss of mass and energy, and all the other crap going on inside. It isn’t blackbody emission.
Stephen, that’s in part incorrect, a 288K ideal blackbody with emissivity 1.0 conforming to Planck’s law emits non-zero radiation at every frequency according to that law’s function. No hedging here, every means every.
You are correct though that our sun emits over the entire spectrum but is not emitting blackbody radiation because it is not enclosed in an opaque cavity.
I agree with that, and it is intuitively sensical since you’d expect a black body to absorb all radiation and re-emit, and it would have to be in thermal equilibrium. The predominant radiation would depend on temperature. This phenomenon has nothing to do with Earth.
You understand that a blackbody can be any temperature, and that a blackbody object at the same size and temperature of the sun would emit light just as brightly as the sun? Like a blackbody at the same temperature, the sun’s peak emission band of wavelengths is in the spectrum of light visible to our eyes.
I would think Jupiter having stuff fall into it causes more than heat as compared planet’s shrinking. But when a space rock impacting creating far energy than nuclear bombs, such intense energies would cause an immediate expansion in upper atmosphere {would not much effect entire planet] and one would get a slow shrinkage of atmosphere [adding heat] from this.
Wiki:
“For these reasons Jupiter has the highest frequency of impacts of any planet in the Solar System, justifying its reputation as the “sweeper” or “cosmic vacuum cleaner” of the Solar System. 2018 studies estimate that between 10 and 65 impacts per year of meteoroids with a diameter of between 5 and 20 meters (16 and 66 ft) can occur on the planet. For larger objects capable of leaving a visible scar on the planet’s cloud cover for weeks, that study gives an impact frequency of one every 212 years. Even larger objects would strike Jupiter every 630 years. 2009 studies suggest an impact frequency of once every 50350 years for an object of between 0.5 and 1 km (0.31 and 0.62 mi) in diameter; hits from smaller objects would occur more frequently. Another study, from 1997, estimated comets 0.3 km (0.19 mi) in diameter collide with Jupiter once in approximately 500 years and those 1.6 km (0.99 mi) in diameter do so once in every 6,000 years.”
https://en.wikipedia.org/wiki/Impact_events_on_Jupiter
Earth gets about 10 small impactor per year [small being 1 to 10 meter diameter- and not 5 to 20 meter like Jupiter. If Earth was hit like Jupiter, it would be a problem.
Plus any space rock hitting Jupiter would have more than twice the average velocity as most space rocks hitting Earth.
Just a 5 meter diameter rock going Jupiter’s impact velocity would be quite exciting if hit Earth- comets can hit earth at such velocities, but it’s rare, unless looking at meteor showers which are stuff from comets [though tend to much smaller than 5 meter in diameter].
I can’t recall having ever said anything against the use of good filters:
https://i.postimg.cc/PJnd8QTy/Arctic-sea-ice-anoms-daily-2020.png
… and it shows.
Yet you prefer (13 month) running means.
Filter 1: Savitzky-Golay
Filter 2: simple running mean
Notice how the S-G is ‘closer’ to the center of the actual data. It is not as though S-G is not used with good reason in many other disciplines. No-one else uses simple running means.
Ask Vaughn Pratt which is better. Perhaps he will say CTRM.
Linsley-Hood
You are not only an incompetent boaster: you are a bad loser as well.
You don’t seem to have understood, despite your apparent age, that the more we try to save face, the less successful we are at doing so.
*
As I told many times, I use running means ONLY to help people in building an abstraction of the raw time series which keep like the tree hiding the forest, especially when unnecessary using dot plots like you do.
*
And it should be evident to anybody – you of course included – that for this purpose it doesn’t matter whether I use the spreadsheet calc’s running mean or any low pass filter, because the difference is absolutely too small.
But you are a bad loser, Linsley-Hood, and will never admit that IN THAT USE CONTEXT, the tiny difference between the two doesn’t matter at all.
Your only goal here is to appear as the all-time-better-knowing, major poster.
For people like e.g. Robertson, you most certainly are, even if you keep calling him an idiot.
Ask Vaughn Pratt which is better. Perhaps he will say CTRM.
You don’t care about accuracy. That is clear in everything you write.
“using dot plots like you do”
You understand vey little do you. Dot plots as you call them are the actual data. Your little lines you draw between those points do not represent any real measurements, they are just an illusion just like the rest of your thinking.
“tiny difference”
Like mean v median, gaussian v bimodal data, skewed v symmetrical, accurate filters, inevitable rounding errors if you use already rounded figures as the basic for any further calculation, different reference periods, different methodology, different instruments, measurements above and inside the SBL, etc.
They all just merge together and produce answers that are ‘accurate enough’ for you.
….You understand very little do you….
Nice cartoon in last week’s New Scientist comparing the effectiveness of two messages encouraging you to stop using fossil fuels.
Less successful :-
Stop using fossil fuels; they harm the planet.
More successful :-
Stop using fossil fuels; they are very expensive.
Meanwhile, out in the real world:
And your future estimations are based on scenario 1 or scenario 2?
What part of “out in the real world” do you not understand?
Hint:
So scenario 1 then.
Entropic man
It also looks like “green energy” harms the planet.
https://wattsupwiththat.com/2022/06/08/is-it-ethical-to-purchase-an-ev-lithium-battery-powered-vehicle/
If you measure it by environmental damage all energy use harms the planet.
The best way to minimise environmental damage is to minimise your energy use.
What we really need is comparative data.
For example,to compare the total environmental damage of building and driving comparable petrol and electric cars 100,000 miles.
La Nina explains superdeveloping La Nina is the most intense at this time of the year since 1950 and the effect of it
https://youtu.be/5vWwxOaXNUg
Bindicast La Nina gone by April LOL ,
Did you save some ha ha has for this ??? I did.
https://www.drroyspencer.com/2022/01/uah-global-temperature-update-for-december-2021-0-21-deg-c/#comment-1140812
Linsley-Hood
You wrote above, cowardly as usual:
” Like mean v median, gaussian v bimodal data, skewed v symmetrical … ”
” … inevitable rounding errors if you use already rounded figures as the basic for any further calculation … ”
And the eternal lies continue, don’t they?
*
I repeat: stop lying, and start proving that your claims play any role in my computations.
Neither were you able until now
– to prove that the middle aka (Tmin+Tmax/2) would be worse than the median when compared to the true 24h average – the median is always farer from the true average than the middle, in both USCRN and Meteostat evaluations
nor were you able
– to show that the hourly data is skewed – it is not at all
let alone were you able
– to accurately prove on this blog that using rounded hourly data averaged into grid cells and then months would give inaccurate results.
I have shown you the spatiotemporal problems using the median (wrt latitude as well as wrt seasons) and you were unable to disprove that.
*
When will you finally give us all (not only me), using computation instead of guessing, the proof of your nonsensical, insidious claims?
How is it possible to be so dishonest, Linsley-Hood?
Who will believe you on this blog?
Apart from the La Nina Ebaby, Robertson (because he loves people denigrating what I do), and a few others keeping in the background?
The mean is not considered a robust statistic. The median is.
“Robust statistics is statistics with good performance for data drawn from a wide range of probability distributions, especially for distributions that are not normal”
“The mean is not a robust measure of central tendency”
“The median is a robust measure of central tendency”
“when outliers are present, the standard deviation cannot be recommended as an estimate of scale”
“Robust statistics …. work well in a wide variety of probability distributions, particularly non-normal distributions”
“The standard deviation is similar to the mean because its calculations include all values in the data set. A single outlier can drastically affect this statistic. Therefore, it is not robust.
The range is the difference between the highest and lowest value in the dataset {alternatively you could consider the middle}. If you have a single unusually high or low value, it can greatly impact the range {and the middle}. Its also not robust.
The interquartile range (IQR) is the middle half of your dataset. It is similar to the median in that you can replace many values without altering the IQR. It has a breakdown point of 25%. Consequently, of these three measures, the interquartile range is the most robust statistic”
rlk…”The mean is not considered a robust statistic.”
***
Binny can be mean, does that mean he’s a statistic?
Look up why having a robust statistic is consider a good thing.
Still not published the normals that your abnormalities rely on. In any of your series.
“to show that the hourly data is skewed it is not at all”
Liar.
Various USCRN stations in histogram form of their average hourly daily profiles
https://imgur.com/a/UW6VnCx
https://imgur.com/a/62XLL5S
https://imgur.com/a/hMQbQuw
https://imgur.com/a/Sc0mK5L
This post disappeared on me earlier in its correct place so I don’t know if it will be duplicated. If so, sorry about that.
rlh…”GR: How can a hydrogen atom or molecule have a range of incremental temperatures that can be measured remotely via EM(R)? Surely it can only show discrete temperatures according to you?”
***
Richard, I don’t pretend to understand this stuff at a deep level. I do know there is no way to give the temperature of an individual atom, or electron. I want to be clear that when I talk about heat or temperature related to a single atom, I am talking in a purely hypothetical sense. I am using it simply to illustrate how electrons moving to higher energy states, which are higher levels of kinetic energy, when taken en mass, should relate to the heat level, hence the temperature of a mass.
As far as measuring temperatures via EM remotely, the frequency generated at each transition is specific. The lower frequency in the Balmer series in hydrogen is about 656 nm, which is found in the lower visible spectrum in the reds. That frequency is related to the kinetic energy level from which the electron jumped to a lower level.
Then again, you’d expect to see Balmer lines in the spectrum of a star, or other hot object containing hydrogen. Not something you’d expect to see in our atmosphere.
Based on that info, one ‘should’ be able to infer the temperature of a body where the energy originated.
**************************
“The electrons will follow any fibrational movement in the protons”.
***
I presume that should be vibrational. I once had a Scottish physics teacher who pronounced a ‘v’ as an ‘f’.
I don’t know why protons should vibrate in the nucleus. Schrodinger’s wave equation does not allow for such vibration, as far as I know. It is based, in part, on the distance from the nucleus to the first orbital energy level, the Bohr radius, but I have seen nothing indicating that radius varies.
According to Bohr’s model, the electrons must stay in discrete, quantum orbits and that kind of rules out the orbits varying with proton vibrations.
“I do know there is no way to give the temperature of an individual atom, or electron.”
The body that they are part of can have a temperature which varies in a linear fashion.
You could measure the atom’s kinetic energy, mv^2/2.
For a single electron, why not electron volts?
Gordon,
You must have missed that day in class when they covered the Schrodinger’s equation, or actually the whole semester.
If you say this, and you did
“Schrodingers wave equation does not allow for such vibration, as far as I know.”
Certainly you might peruse this wiki article,
https://en.wikipedia.org/wiki/Schr%C3%B6dinger_equation
The Schrodinger equation is useful when dealing with things that do vibrate, it most certainly does not disallow such vibrations.
bobdroege, please stop trolling.
It does not seem that Earth has warmed much in last 20 years- or warmed much in the 21 century. Or in terms of progress, it seems to have stalled.
It seems it would useful to have witches which could predict the weather.
Maybe witches were burned because they predicted the weather, wrong.
The news story was they caused cold and bad weather.
I tend to think one should follow the money, and witches were about predicting the future, because people do pay money to know the future.
Witches were burned as a remedy for black plague
I’m surprised that it wasn’t considered as a remedy for COVID. The needed levels of ignorance and popular delusion certainly were there.
Has Earth warmed in the 21st century?
Let’s check the indicators:
Global lower tropospheric temperature linear trends:
UAH v6 – 0.143 C/decade (+/- 0.130)
RSS v4 – 0.206 C/decade (+/- 0.135)
Global near-surface linear temperature trends:
METO v4 – 0.145 C/decade (+/- 0.088)
GISS v4 – 0.212 C/decade (+/- 0.098)
BERKLEY – 0.213 C/decade (+/- 0.083)
Worth mentioning that Berkeley has completely different methods and a far larger data set than Met Office, GISS, NOAA.
Global Sea level [data]
3.6 mm/yr (+/- 0.5)
……
It was getting onerous gathering data sets and verifying, but suffice to say…
Global ocean heat content 0-700 meters and 0-2000 meters up
Annual global sea ice down
Global glaciers down
These are just some of thee indicators that all verify the earth has warmed during the 21st century.
Please note that a lot of natural cycles have been rising/falling since 1980 or so. They all appear to have reached their maximum/minimum recently.
https://climatedatablog.files.wordpress.com/2022/05/sam.jpeg
https://climatedatablog.files.wordpress.com/2022/05/soi.jpeg
https://climatedatablog.files.wordpress.com/2022/05/pdo.jpeg
https://climatedatablog.files.wordpress.com/2022/05/amo.jpeg
This may well explain the recent rise in global temperatures. The future will tell.
I like Carl Otto Weiss explanation. Climate is due to natural cycles. When several natural cycles are rising there is a rise in global temperatures. When they fall there is global cooling.
Weiss warns that if his analysis of cycles is correct from now to 2070 we should be observing cooling, and significant cooling of 2 -3C.
It should start getting obvious by 2030.
If that is true the preparations we as a society are making regarding warming projections are all about getting ready for the wrong crisis.
Climate is mostly due to natural cycles.
“Cycles may well explain the recent rise in global temperatures.”
If ‘cycles’ are putting heat into the lower troposphere, where is this heat coming from?
Is it coming from the oceans? That would seem to be your answer, as the cycles you tend to show us are oceanic.
Where is the heat coming from?
The heat comes from the sun. There is a solar cycle that causes changes in solar irradiance and electro-magnetic coupling.
The ocean cycles are about how energy from the sun is stored transferred and emitted from the earth.
“The heat comes from the sun.”
The source of all heat on earth (bar a miniscule leakage from the core) is the sun. The lack of correlation between solar cycles and global temps makes the sun an unlikely candidate for a significant forcing to global temps.
But I’m asking RLH which cycles have given heat to the lower troposphere.
Because the next step is to see if the data matches what he conjectures.
Global OHC
https://www.data.jma.go.jp/gmd/kaiyou/english/ohc/ohc_global_en.html
Sampled at what interval horizontally and vertically and with an uncertainty from that?
RLH says: Sampled at what interval horizontally and vertically and with an uncertainty from that?
Their error analysis is referenced at the bottom of the linked page in the off chance that you’re asking a good faith question.
So you should have no problems with answering those questions.
Nor should you.
So much for good faith.
Well an Argo float has an average horizontal resolution of ~4.69 km on a 10 day cycle.
Vague.
Lets see you combine them in some sensible way to account for the global T record.
Are you saying that the combination has not changed for the positive since 1980?
Here are cycles combined in some sensible way to account for global temperature record: https://schillerinstitute.com/media/carl-otto-weiss-le-changement-climatique-est-du-a-des-cycles-naturels/
An example of using long period cycles against OLS trends to try and predict the future.
Anything not in video form?
Try comparing
https://imgur.com/a/Nh6x5Ao
https://imgur.com/a/LNV8BwZ
The underlying paper is here: https://pdfs.semanticscholar.org/1f40/518ec1619da3becae93c13f29b8253f515a7.pdf
Ken says: The underlying paper is here: https://pdfs.semanticscholar.org/1f40/518ec1619da3becae93c13f29b8253f515a7.pdf
I don’t think so.
The punchline graphic in the video comes from figure 3 here:
https://notrickszone.com/2015/02/02/german-analysis-current-warm-period-is-no-anthropogenic-product-major-natural-cycles-show-no-signs-of-warming/
Wherein a 230 and 65 year cycle are fitted to the Had series ending in 2005 beyond which the fit seems to diverge from what happened in the last 17 years.
In your link, Weiss etal fit a different set of cycles to their own rather dubious 2000 year paleo reconstruction using a completely different set of cycles. This one ends in the year 2000 after which the realized temperature diverges from their cyclic fit.
So the issues here include at least the following:
1) Mutually inconsistent cycle periods in the two analyses
2) A 230 year cycle “detected” in a 165 series which is not what some might call “statistically robust”.
3) Apparent divergence from the hypothesized cyclic behavior since the end of the analysis period.
My problem is that the 230 and 65 year cycles are not going to be pure sinusoids. That is they are not simple sine waves. It would have been better if they were considered to be around 230 and 65 years periods instead.
For instance there have been other who suggest that 70 or even 75 years is a better fit than 65 and even then not on a precise sinusoid at that.
Why is it that GISS and Had5 show a linear rise since 1990 but UAH does not?
https://climatedatablog.files.wordpress.com/2022/06/uah-1.jpeg
https://climatedatablog.files.wordpress.com/2022/05/giss.jpeg
https://climatedatablog.files.wordpress.com/2022/05/had5.jpeg
For instance, compare the peak in 1998 (the El Nino) on all of the graphs.
GISS and Had both recon there was no El Nino in 1998
https://imgur.com/a/O2IBVld
https://imgur.com/a/oTG9bSm
https://imgur.com/a/uwj0jeR
UAH since 1990?
A statistically significant warming trend.
https://www.woodfortrees.org/plot/uah6/from:1990/trend/plot/uah6/from:1990/every/trend/offset:0.1/plot/uah6/from:1990/offset:-0.1/every/trend
Compared to GISS and Had
https://imgur.com/a/O2IBVld
I meant that some years (1998 for instance) both GISS and Had differ quite considerably from UAH.
Yes. As atmospheric measure UAH greatly exaggerates the temperature changes due to ENSO. One reason for Tthe large standard deviation of UAH annual means.
Are you saying that ENSO is not an important driver of global temperatures?
Strange how they all agree in 2018 and 2020.
Oops, Typo
https://imgur.com/a/O2IBVld
2016 and 2020
RLH needs to be reminded that the UAH data is not surface data. The temperature at the tropopause is relatively constant, according to UAH, so the LT at a lower pressure height could be expected to show a lesser trend line than the surface data. Also, the LT is mostly the MT data, which has well known contamination from the stratosphere. Of course, you continue to ignore the results from other groups that have analyzed the MSU/AMSU data, results which show greater warming than UAH.
As usual, your plots are deliberately confusing, for example, using a different period on the X axis comparing the surface data with UAH. For a proper comparison, you should use the same time period for the surface data as that for UAH, Dec 1978 thru May 2022. Doing so would change your filtered data results.
ES: You need to be reminded that I have long acknowledge that looking at things from inside the SBL and outside it can produce different values for the same thing.
https://imgur.com/a/O2IBVld makes the current data the same for all the series and shows the same time periods.
4 series, 2 surface, 2 satellite aligned to ‘today’
https://imgur.com/a/Nh6x5Ao
ENSO pattern since 1992
https://imgur.com/a/LNV8BwZ
Notice how 1998 and 2016 are shown in each graph.
And 2010
I see that RLH continues his annoying habit of posting multiple replies instead of thinking before hitting the send button. Your posted graphs don’t include an analysis using your smoothing functions, limiting the data input to 1978 thru 2022.
Tell us, why does the RSS TTS data begin in 1986. Is there a problem with the earlier data, perhaps? If so, how does UAH complete their corresponding TP series, which was well known to exhibit lots of missing data in the early MSU years.
https://imgur.com/a/Nh6x5Ao
Are you looking at the same image I am?
That data is from woodfortrees and covers what they show from 1980 to 2022.
ES: Current RSS for May 2022
https://climatedatablog.files.wordpress.com/2022/06/rss.jpeg
ES: Note the differences between RSS and UAH for 1998, 2010 and 2016 when compared to
https://imgur.com/a/LNV8BwZ
https://climatedatablog.files.wordpress.com/2022/06/rss.jpeg
https://climatedatablog.files.wordpress.com/2022/06/uah_lt.jpg
I see that RLH continues his annoying habit of posting multiple replies instead of thinking before hitting the send button.
You still haven’t shown a comparison of the sat data with the surface data starting with 1978, then applying your filters. Your other plots of surface data include data points before 1978, so these points are included in the filtered result.
Throwing up two graphs showing UAH and RSS data with different base periods doesn’t prove anything except that you don’t have a clue why they appear to be different.
I see that ES does not actually look at the graphs, just posts what he thinks are in them.
https://imgur.com/a/Nh6x5Ao
RLH, You still havent shown a comparison of the sat data with the surface data starting with 1978, then applying your filters. Those wood-for-trees overlays aren’t the same as your usual posts of filtered graphs. Of course, you continue to ignore the known reasons that UAH LT and RSS TLT differ, simply taking the UAH data as absolute truth in order to ignore the greater warming found by the other groups that have analyzed the identical data.
barry
There is not much debate about warming in 20th Century. At the margin maybe a few tenths are being debated but overall warming is accepted. The debate is about the proportionality between AGW and natural variability. That makes sense because we are coming out of the Little Ice Age. Sea level rise began early 19th Century. We have been in the AMO warm period recently. Current warming is a short term oscillation on a long term gradual warming due to background of recovering from LIA.
There shouldnt be debate about the LIA and AMO. So we are left with allocation of the amount of warming since 1850-1900. I dont know and in spite of the proclamation by IPCC and cultists in climate science, neither does anyone else. Here are the uncertainties for me.
1. Small fraction of global coverage for SST and land T in base period. SH land coverage pre 1900 about 10-15%. Very skimpy in situ direct measurements of the oceans for SST.
2. Land use changes. Destruction of wetlands and deforestation probably had some impact.
3. Amount of warming from Urban Heat Island effect. Who knows. Whatever estimates themselves have large uncertainties.
4. Uncertainties in adjustments of temperatures. Maybe they are valid. But there have been so many investigations in specific areas that should raise questions about their validity.
5. Looking at the tidal gauges graphs with little acceleration just cant be reconciled with the satellite data of an acceleration. It is inconsistent. There are many papers that find no significant acceleration in global SLR.
6. Beginning T pre 1900. No one knows. Many people think they know. It is unknowable. Within a few tenths of C ok. Beyond that is a guess.
I accept warming. I accept some AGW. I accept some natural variability. Beyond that it is all speculation even by the most knowledgeable climate scientists.
I accept warming. I accept some AGW. I accept some natural variability”
Agreed.
I’d add that the warming, be it natural variation, AGW, or both, is insignificant.
Denny appears to have a scientific approach. That’s good.
Whatever the reason for the warming, we know from REAL science that CO2 can’t cause it.
denny…”Uncertainties in adjustments of temperatures. Maybe they are valid. But there have been so many investigations in specific areas that should raise questions about their validity”.
***
We can be more specific about that. In the Climategate email scandal, an IPCC Coordinating Lead Author, Kevin Trenberth, lamented that the warming had stopped and that it was a travesty that no one knew why. When the emails were made public, he quickly back-pedaled, eventually claiming the missing heat was being stored in the ocean.
A few years later, the IPCC released AR5, confirming Trenberth’s observation by stating there had been no warming over the 15 years from 1998 – 2012. Almost immediately, NOAA, who had shown the same flat trend, retroactively rewrote the SST to produce a trend during that period.
In 2014, NOAA and NASA GISS declared 2014 the warmest year ever based on a probability of 48% and 38% respectively. Such Vegas-style odds is not science, its basis has to be in climate alarm propaganda.
During the Climategate scandal, Michael Mann was front and centre. When he was not ranting about interfering in peer review, he was being applauded by another IPCC Coordinating Lead Author, Phil Jones of Had-crut, who bragged he had used the same trick devised by Mann to hide declining temperatures. Jones also bragged that he and Kevin would see to it that certain skeptic papers did not reach the IPCC review stage.
When this came out, Mann and Gavin Schmidt were partners running realclimate, and Schmidt defended Mann to the hilt. Now Schmidt is head of NASA GISS. Both of them were editors on the Journal of Climate.
Back to Trenberth. He was involved with forcing a journal editor to resign because the editor had published a paper by a skeptic. Don’t recall who wrote the paper, it was either Roy or John Christy from UAH. Again, Trenberth, and his partner, Jones, of Had-crut, have been poobahs on IPCC reviews, selecting lead authors and deciding which papers should reach the review stage.
Then there was Thomas Karl, then head of NOAA. He knew about the controversy in Mann’s hockey stick re the hiding of declining temperatures and said nothing.
There is no doubt that NOAA, GISS, Had-crut and others have been openly involved with fudging the surface temperature series.
Hahahaha. You’ve memorised every hatchet job on this subject. Well done.
> I accept warming. I accept some AGW. I accept some natural variability.
Aye aye:
https://web.archive.org/web/20140329053516/http://climatechangenationalforum.org/your-logic-escapes-me-by-john-nielsen-gammon/
If you assume that there are no natural cycles longer than 60 years.
The easterly circulation along the equator in the Pacific will strengthen in mid-June as the polar vortex in the lower stratosphere in the southern hemisphere strengthens. As the solar cycle develops, the stratospheric polar vortex may be strong during winter in the southern hemisphere.
https://earth.nullschool.net/#2022/06/13/1900Z/wind/isobaric/70hPa/orthographic=-128.16,-10.00,281
Currently no spots in the northern solar hemisphere, weak spots in the southern.
https://i.ibb.co/LgD4HZZ/AR-CH-20220608.png
I wouldn’t wonder much if Gosselin’s TricksZone published these days at WUWT their much appreciated ‘Woooah! TEN cm snowfall in June in the Alps!’.
Happened really last night, but… at about 2,500 m of course, what is not unusual at all.
Conversely, I would wonder very much if the very same TricksZone published that since May, Southern parts of Portugal and Spain experience absolutely unusual warmth.
So are they, these tricky Coolistas.
Tiniest signs of cold mean ‘Care! The Globe is cooling!’; bigger signs of warm mean ‘All natural, don’t care; it was warmer in the Holocene’ or so.
https://xkcd.com/1321/
Bindidong is now complaining about imaginary posts on WUWT that do not exist , that he only constructs them in his own fantasy,
What else are the voices in your head telling you ???
Is it Warmistas or Coolistatas that are saying that we have had more La Nina than El Nino in the last 25 years?
Sorted out if the hourly USCRN data is a skewed, bimodal distribution yet or not?
https://www.drroyspencer.com/2022/06/uah-global-temperature-update-for-may-2022-0-17-deg-c/#comment-1312144
Linsley-Hood
Before I answer to your bunch of usual non-sequitur replies to my last comment, I have a simple question about your
” Still not published the normals that your abnormalities rely on. In any of your series. ”
{ I prefer to ignore your Robertson-like discrediting of what I do when using such stupid wording like ‘abnormalities’, which do not at all elevate the level of your communication. }
But let us come back to your ‘normals’.
When discussing time series, we usually speak on this blog about ‘reference periods’ and the ‘climatologies’ (or ‘baselines’) calculated out of them, which in turn are used to construct the anomalies as departures from the local means of the time series’ units within the reference periods.
UAH’s reference period and their climatologies for the four observed atmospheric layers, for example are well known to me.
What exactly do you understand with ‘normals’?
For example: where does the UAH team publish these ‘normals’ for the Lower Troposphere?
“‘reference periods’ and the ‘climatologies’ (or ‘baselines’) calculated out of them” aka normals.
“UAH’s reference period and their climatologies for the four observed atmospheric layers, for example are well known to me”
So you have them then? (at least for the current reference period). Why not publish them?
You STILL didnt answer my question. I repeat it.
For example: where does the UAH team publish these normals for the Lower Troposphere?
https://www.drroyspencer.com/2022/06/uah-global-temperature-update-for-may-2022-0-17-deg-c/#comment-1312604
You said you had already done it. For this reference period and the last.
You didn’t answer my question. I repeat it.
” For example: where does the UAH team publish these normals for the Lower Troposphere? ”
Where can I then finally see exactly what you mean?
Because if the ‘normals’ you expect me to publish within each graph were the same as their climatology, I then would ask you why YOU don’t publish these ‘normals’ in each of your UAH graphs.
Well you published the Feb absolute data for a range of years at
https://www.drroyspencer.com/2022/03/uah-global-temperature-update-for-february-2022-0-00-deg-c/#comment-1195816
so presume ably you will not have problems with the whole year reference periods instead (both current and past).
….so presumably….
Sorted out if the hourly USCRN data is a skewed, bimodal distribution yet or not?
https://www.drroyspencer.com/2022/06/uah-global-temperature-update-for-may-2022-0-17-deg-c/#comment-1312144
You STILL didnt answer my question. I repeat it.
For example: where does the UAH team publish these normals for the Lower Troposphere?
You have admitted that you have. Why not publish them yourself?
No reply to
https://www.drroyspencer.com/2022/06/uah-global-temperature-update-for-may-2022-0-17-deg-c/#comment-1312590
Linsley-Hood
Will you now finally answer my question
” Where does the UAH team publish these normals for the Lower Troposphere? ”
I still do not know what you exactly mean with your ‘normals’.
*
Where do I see these ‘normals’ you miss in my charts when I look at e.g.
https://climatedatablog.files.wordpress.com/2022/06/uah-1.jpeg
You have the climatology for the various reference periods. You have admitted it. Why not publish that data?
What is the reason for me to publish things in my charts which you omit to publish in yours?
Because you have wrongly said things like hourly temperatures, although based on a sinusoidal pattern, are not a skewed, bimodal histogram and making your post your own data shows that you are wrong a lot more that you are correct.
You keep dodging as I see.
Where do I see these normals you miss in my charts when I look at e.g.
https://climatedatablog.files.wordpress.com/2022/06/uah-1.jpeg
I have asked Roy for a url for you.
The UAH TLT absolute gridded temperatures are here.
To my knowledge they don’t publish a gridded anomaly baseline, but it can be computed from that file. Graphically it looks something like this, but beyond showing gross seasonal changes, it isn’t a very informative graphic.
MB: As a global time series it will be a sinusoidal pattern.
“it can be computed from that file”
which Blinny has already said he has done. For some strange reason he won’t publish it.
Here is the 2016 normals from Roy
https://imgur.com/a/R7WssHc
as found at
https://www.drroyspencer.com/2016/03/uah-v6-lt-global-temperatures-with-annual-cycle/
Also includes
https://www.drroyspencer.com/wp-content/uploads/UAH-v6-LT-thru-feb-2016-with-anncyc-1.jpg
Which as a histogram turns into
https://imgur.com/a/UukZJUB
https://www.drroyspencer.com/2021/08/uah-global-temperature-update-for-july-2021-0-20-deg-c/#comment-783207
https://www.drroyspencer.com/2022/06/uah-global-temperature-update-for-may-2022-0-17-deg-c/#comment-1312730
A very strong low below Iceland will close the path of warm air from the Atlantic to the Arctic.
You do understand how low pressure systems in the Northern Hemisphere work don’t you?
https://imgur.com/a/lopBPAH
Linsley-Hood
” Sorted out if the hourly USCRN data is a skewed, bimodal distribution yet or not? ”
You can name me a liar as long as you want.
No one on this blog – except those few who enjoy you denigrating what I do – believes that the USCRN hourly data is skewed:
https://drive.google.com/file/d/1TFosZhWOev-Xv4DyHx0j5C3XSOffWizw/view
Any REALLY educated statistician (what you are NOT AT ALL) would tell you how skewed data REALLY looks like:
https://miro.medium.com/max/1262/1*mr47HGudLMqtzGXRyK1yrg.png
*
And by the way: I still await your technical contradiction (made of course by doing the very same job) concerning my USCRN monthly time series comparing
– (Tmin+Tmax)/2 aka middle
– median
– full 24h average
https://drive.google.com/file/d/1BhgrAn-eVrX9JZUhr_y4ceVWAKsXtqml/view
*
If you would be able to do the very same job: should you then not obtain, when comparing the monthly absolute differences
– |full 24h average minus median|
and
– |full 24h average minus (Tmin+Tmax)/2 aka middle|
something like
https://drive.google.com/file/d/1Ic44M37QzUhAtf6nxBYXzEAytASur7Z1/view
Maybe you explain us why a monthly histogram of these absolute differences (i.e., distances) looks like
https://drive.google.com/file/d/1pO9Lpi9xxxNkHRBQkhqkiTUvffV7KCqn/view
*
But… maybe you prefer not to do the same job, and to keep denigrating what I do instead?
Liar.
Various USCRN stations in histogram form of their average hourly daily profiles
https://imgur.com/a/UW6VnCx
https://imgur.com/a/62XLL5S
https://imgur.com/a/hMQbQuw
https://imgur.com/a/Sc0mK5L
RLH says: Various USCRN stations in histogram form of their average hourly daily profiles
https://imgur.com/a/UW6VnCx
Can you explain how these chart were generated?
My understanding is
1) For each day in the station record, take the arithmetic average for the day.
2) For each day of the year, take the arithmetic average for each day above across all years for the station. e.g. [Jan_1 = average(Jan_1_2022, Jan_1_2021, …, Jan_1_2005), Jan_2 . . .]
3) Plot histogram of these daily average temperatures.
1). Take the average for each hour of the day over the whole year from a particular station.
2) Plot those data as a histogram.
” Take the average for each hour of the day over the whole year from a particular station. ”
You seem to still not have understood that I did exactly the same, but not for a single year – for all years…
https://drive.google.com/file/d/1pXoGG8rKukT3tAia0ok9R2OrzvD6P7Hv/view
https://drive.google.com/file/d/1ktkIhpWH_L0-ubXEdSf2YTpPYjKOLpVt/view
So did I.
I’ll reword it for you
1). Take the average for each hour of the day over the whole year and the whole period reported from a particular station
P.S. You do understand there is a difference between a bar chart and a histogram don’t you?
https://drive.google.com/file/d/1TFosZhWOev-Xv4DyHx0j5C3XSOffWizw/view
Now do a histogram of those plots. A Histogram is the only way to show a distribution,. A time series does not.
Are you kidding us here, Linsley-Hood?
https://drive.google.com/file/d/1TFosZhWOev-Xv4DyHx0j5C3XSOffWizw/view
are histograms made out of three time series for the common period (that of AK_Kenai_29_ENE, 2010-2021) – in plot form – for
– Kenai
– Everglades
– all stations.
*
The histograms for the average of the 138 active USCRN stations for the period 2002-2021:
https://drive.google.com/file/d/1MZlIa_a-SKRxA72v1UOB7HrNpEr9EGqO/view
This is the average of all days having full 24 hours of hourly data.
Similarly, the horizontal lines are the averages of all values computed for
– (Tmin+Tmax)/2 aka middle
– median
– full 24h average
Here is the histogram in bar chart for:
https://drive.google.com/file/d/1cZR95joG5IakNDAnJMe1vDuMk8RAPucI/view
*
And you want to continue claiming that this is ‘skewed’ data?
Then, sorry: the liar here is Linsley-Hood.
Blinny not knowing the difference between a time series and a histogram.
For instance a histogram would tell you how many 10C occurred in each day.
“Here is the histogram in bar chart”
A bar chart of a sinusoid is not a histogram. One shows a time series, the other a distribution.
“A histogram is a graphical representation that organizes a group of data points into user-specified ranges. Similar in appearance to a bar graph, the histogram condenses a data series into an easily interpreted visual by taking many data points and grouping them into logical ranges or bins”
“Histograms are used to show distributions of variables while bar charts are used to compare variables”
https://miro.medium.com/max/1262/1*mr47HGudLMqtzGXRyK1yrg.png
Oh look, a histogram! All sinusoidal time series will produce a bimodal histogram. A sine wave will be symmetrical. A temperature series one will be skewed.
“No one on this blog except those few who enjoy you denigrating what I do believes that the USCRN hourly data is skewed”
Only those who do not believe their eyes.
https://imgur.com/a/UW6VnCx
https://imgur.com/a/62XLL5S
https://imgur.com/a/hMQbQuw
https://imgur.com/a/Sc0mK5L
Any REALLY educated statistician (what you are NOT AT ALL) would tell you how skewed data REALLY looks like:
https://miro.medium.com/max/1262/1*mr47HGudLMqtzGXRyK1yrg.png
By using a histogram.
For the last time: this is the USCRN histogram in plot form for all stations since Jan 2002:
https://drive.google.com/file/d/1MZlIa_a-SKRxA72v1UOB7HrNpEr9EGqO/view
No statistician on Earth will accept that a histogram shows skewed data when the data’s median differs from the true average by no more than laughable 3 %.
This is your manipulative interpretation, Linsley-Hood
Wrong, it is a time series not a histogram.
For instance, how many buckets are in the graph and what ranges does each bucket cover?
https://www.drroyspencer.com/2022/06/uah-global-temperature-update-for-may-2022-0-17-deg-c/#comment-1312690
Bucket = bins for this discussion.
https://www.drroyspencer.com/2022/06/uah-global-temperature-update-for-may-2022-0-17-deg-c/#comment-1312689
My conclusion for this endless discussion about median vs. (Tmin+Tmax)/2 vs. full 24h average, initiated last year by Linsley-Hood aka RLH himself, is that he never will be able to technically contradict my job, and will continue to stalk me ad nauseam, and to discredit what I did without being able to prove it wrong.
I have enough of this insidious, disingenuous manipulation.
https://www.drroyspencer.com/2022/06/uah-global-temperature-update-for-may-2022-0-17-deg-c/#comment-1312684
Sorry, Linsley-Hood: you can continue your manipulation as long as you want.
Do the job like I did, and present all results like I presented mine.
Basta ya.
Blinny still not knowing the difference between a time series and a histogram.
And Linsley-Hood still not having enough balls to enter a fair contest proving my USCRN results wrong.
What cowardice…
Blinny still not knowing the difference between a time series and a histogram. What an idiot.
https://www.drroyspencer.com/2022/06/uah-global-temperature-update-for-may-2022-0-17-deg-c/#comment-1312689
Blinny: Sorted out the differences between time series and histogram plots yet?
Or should that be bar graphs and histograms.
Your words:
” Take the average for each hour of the day over the whole year from a particular station. ”
You seem to still not have understood that I did exactly the same, but not for a single year for all years…
Here is the stuff restricted to AK_Kenai_29_ENE:
https://drive.google.com/file/d/1pXoGG8rKukT3tAia0ok9R2OrzvD6P7Hv/view
https://drive.google.com/file/d/1ktkIhpWH_L0-ubXEdSf2YTpPYjKOLpVt/view
Will you get it one day, Linsley-Hood?
As did I. But I presented that as a histogram which you still seem to have a problem with, thinking that it is just a bar graph.
Line plot
https://drive.google.com/file/d/1pXoGG8rKukT3tAia0ok9R2OrzvD6P7Hv/view
Bar graph
https://drive.google.com/file/d/1ktkIhpWH_L0-ubXEdSf2YTpPYjKOLpVt/view
2 plots of the same thing.
Now do a histogram. You do know what that is don’t you?
https://www.drroyspencer.com/2022/06/uah-global-temperature-update-for-may-2022-0-17-deg-c/#comment-1312690
You do understand the difference between a bar chart and a histogram don’t you?
” A histogram is an approximate representation of the distribution of numerical data. The term was first introduced by Karl Pearson.
To construct a histogram, the first step is to “bin” (or “bucket”) the range of values – that is, divide the entire range of values into a series of intervals [HERE: THE 24 HOURS OF THE DAY] – and then count how many values [HERE: THE TEMPERATURES MEASURED DAY AFTER DAY FOR THE DIFFERENT HOURS] fall into each interval.
The bins are usually specified as consecutive, non-overlapping intervals of a variable. The bins (intervals) must be adjacent and are often (but not required to be) of equal size. ”
Will you now stop your dumb, ignorant stalking?
So will you actually plot things as a histogram rather than a bar
graph?
https://www.excel-easy.com/examples/histogram.html
Now plot your time series as a histogram.
Or I suppose you could ask Willard instead.
For an individual station that is. Mixing together all 138 together just adds a Latitude smear.
“THE TEMPERATURES MEASURED DAY AFTER DAY FOR THE DIFFERENT HOURS”
Actually the temperatures across the whole day divided into the separate buckets. You really don’t understand any of this do you?
As here as example for Everglades with buckets as labeled from 19.5 to 28.5 at 1 degree intervals. Thus the first bucket counts the number of temperatures in the day that fall between 18 and 19.
https://imgur.com/gallery/zjtZRNy
2010/11/16 CRND0103-2010-AK_Kenai_29_ENE
Daily Average = -6.70 Count = 1
Hourly Average = -6.76 Count = 24
SubHourly Average = -6.74 Count = 288
Notice how one rounds up but the other down?
But you are too arrogant to read things closely or understand any of it.
–FAST TIMES AT BEN BRADLEE HIGH: The Washington Posts week from Hell.
The paper known for its slogan Democracy Dies in Darkness should perhaps be more concerned about its own well-being after the disastrous week it had.
The Washington Post, the once-revered news organization that famously exposed the Watergate scandal leading to a presidents resignation, is still highly respected in the Beltway but has lost its way in recent years among most Americans. From declaring the coronavirus lab-leak theory was a debunked conspiracy to quickly rejecting the Hunter Biden laptop scandal in the final weeks of the 2020 presidential election, the Post of today is simply not the same as the Post of the Nixon era.
But the events that occurred over the past week may be some of the worst that have plagued the Washington Post in its 144-year history.–
https://instapundit.com/
I don’t follow these things, but I thought Bezos ex-wife owns the Washington Post.
And thinking of Miss Turd, and since Bezos managed cut loose from it,
can I be overly optimistic about Bezos doing something useful regarding space exploration??
The complement of the hourly temperature distribution
https://drive.google.com/file/d/1cZR95joG5IakNDAnJMe1vDuMk8RAPucI/view
is the hourly measurement distribution.
Here, you don’t average the measured temperatures into the day’s 24 hours; you count, e.g. for each temperature rounded in full C, the number of measurements showing that temperature.
Below is the histogram of the temperature measurement distribution for all 138 active USCRN stations over the period 2002-2021:
https://drive.google.com/file/d/1GCAlYwQzP6-fF6DxpgfTbyb2MFx1WALq/view
*
Looks nice, but is exactly what we are NOT looking for when comparing
– (Tmin+Tmax)/2 aka middle
– median
– full 24h average
for a set of measurement points able to record hourly data (weather stations, buoys, some satellite soundings, etc).
Yet another untitled, un-sourced, amateur propaganda piece by Binny.
Robertson the dumbie
We are discussing this USCRN stuff since months.
Apart from you, who reads comments only to discredit them, really interested people know what I’m talking about, and where that data comes from.
https://tinyurl.com/32mm4asb
Do your best to access it, interested people know how to do.
Blinny still doesn’t understand how to construct daily histograms for each individual station.
e.g. https://imgur.com/gallery/zjtZRNy
THE TEMPERATURES MEASURED DAY AFTER DAY FOR THE DIFFERENT HOURS
Actually the temperatures across the whole day divided into the separate buckets. You really dont understand any of this do you?
As here as example for Everglades with buckets as labeled from 19.5 to 28.5 at 1 degree intervals. Thus the first bucket counts the number of temperatures in the day that fall between 18 and 19.
https://imgur.com/gallery/zjtZRNy
“Below is the histogram of the temperature measurement distribution for all 138 active USCRN stations over the period 2002-2021”
Oh wow. So you include all the 138 Latitudes for the USCRN as though that actually proved something.
For each individual station the distribution is a skewed bimodal one as I claimed.
Your reply shows that you are ideologically fixated on single stations (like are others on single tide gauges).
What I’m interested in, is the inverse, namely to compare the averages of different measurement series, e.g. the USCRN stations with all the thousands of GHCN daily stations located in the same 2.5 degree grid cells:
https://drive.google.com/file/d/1ETUaQ04KRyyGRvjjHmZH6QPEBnLG0dI2/view
*
You want to criticize that, for this and that and other reasons, Linsley-Hood?
I answer: do the same job, and come back then with the result.
The data sources are as usual.
I claimed that each individual station had a skewed, bimodal daily distribution. How, other than by showing that, would what I claimed by supported?
“What Im interested in, is the inverse, namely to compare the averages of different measurement series, e.g. the USCRN stations with all the thousands of GHCN daily stations located in the same 2.5 degree grid cells”
Other than pointing out that GHCN daily stations are not as accurate as the USCRN ones are, I have not said anything on that aspect.
binny…”…TEN cm snowfall in June in the Alps!.
Happened really last night, but at about 2,500 m of course, what is not unusual at all”.
***
Point is, Binny, we are supposed to be amidst catastrophic warming but things seem to get cooler. No doubt, it’s La Nina causing the early June antics.
What if we get 20 years of mainly LNs rather than EN’s? Will the alarmists then claim it was predicted by AGW theory?
Gordon there isn’t anyone other than millions of idiots who have been brainwashed by public schools and with the Al Gore movie who imagine catastrophic warming is possible.
A comet of death could hit us at any time, and kill everyone, but ice sheets can’t suddenly fall into the ocean.
One could hope all people living on beach are going to be killed, but only way that going to happen is with something like earthquake or space rock impacting Earth’s oceans.
If millions die from living on the beach, then maybe will get more civilized, and build ocean settlements.
But in terms of climate, we in the coldest period of 34 million year Ice Age, wiki:
“The Late Cenozoic Ice Age, or Antarctic Glaciation began 33.9 million years ago at the Eocene-Oligocene Boundary and is ongoing.
It is Earth’s current ice age or icehouse period. Its beginning is marked by the formation of the Antarctic ice sheets.
The Late Cenozoic Ice Age gets its name due to the fact that it covers roughly the last half of Cenozoic era so far.
Six million years after the start of the Late Cenozoic Ice Age, the East Antarctic Ice Sheet had formed, and 14 million years ago it had reached its current extent. It has persisted to the current time.
In the last three million years, glaciations have spread to the northern hemisphere. It commenced with Greenland becoming increasingly covered by an ice sheet in late Pliocene (2.9-2.58 Ma ago).
During the Pleistocene Epoch (starting 2.58 Ma ago), the Quaternary glaciation developed with decreasing mean temperatures and increasing amplitudes between glacials and interglacials. During the glacial periods of the Pleistocene, large areas of northern North America and northern Eurasia have been covered by ice sheets.”
https://en.wikipedia.org/wiki/Late_Cenozoic_Ice_Age
{And it provides a graph showing how cold we are}
15 C air temperature is cold. Being a Canadian you might not be aware that it is cold. Canada average temperature yearly temperature is well below freezing. If we had some global warming, more people might live in Canada, and most Canadian would not clustered so close to US- Canadian border.
Also if had enough global warming, the arctic ocean might be ice free in terms of polar ocean sea ice.
And it might nice if arctic had ice free polar sea ice in the winter, but such a thing was only common a few million years ago.
But back in the warmer part of the Holocene interglacial, the ocean was warm enough to have summer ice free polar sea ice, and Sahara Desert was green because there was a higher amount of global water vapor.
Anyhow, the whole “catastrophic warming” story was involved some Canadian criminals, who might wanted to increase real estate values in Canada, but Canada is cold and will remain cold.
US average temperature is about 12 C, and since 15 C is cold, 12 C is colder.
China average temperature is about 8 C, and China has burning a lot coal, but reached a wall and can’t significantly increase amount burn per year. But per capita China can burn more coal because their population is decreasing. And any chinese will any sense as fled this hell hole, and having an average temperature of 8 C is only a tiny part of why it’s a hell hole.
Meanwhile the hottest continent in world continues to have high economic growth, mostly due to Russia not screwing these countries as much.
Dr Naomi Wolf, mentions Canada:
— The democratic protections of the formerly free nations of the world Canada, the Republic of Ireland, the United Kingdom, Australia, New Zealand have been shut down with the ease of someone switching off a light, and with almost no resistance from citizens. Yes, there have been protests, and there have been petitions, and innumerable complaints online; and a few brave legislators have spoken up, if only to echoing chambers.
But the fact remains that when the unidentifiable police or mercenary forces, as in Canada, are violent, and the protesters have nothing but the moral high ground with which to deter their violence, then even the bravest of resistances is fleeting. —
https://naomiwolf.substack.com/p/rethinking-the-second-amendment?s=r
Also from: https://instapundit.com/
Colorado police: ‘Stop trying to take selfies’ with loose moose
“June 8 (UPI) — Police in a Colorado town are pleading with the public to “stop trying to take selfies” with a moose on the loose in the area.
The Erie Police Department posted a short video to Facebook showing the moose that wandered into town walking down a road with a police escort. ”
https://www.upi.com/Odd_News/2022/06/08/Erie-Police-Department-moose-selfies-Colorado/3501654706395/
Never in the history nature worship, have people been so stupid with animals.
gb…”A comet of death could hit us at any time, and kill everyone…”
***
The remaining few climate alarmists would say the comet was predicted by AGW.
For Mark B, barry, Antonin Querty and some others
After re-reading the comment I posted above (June 9, 2022 at 3:43 PM) I thought it would not be so bad to add, to this hourly temperature measurement histogram
https://drive.google.com/file/d/1GCAlYwQzP6-fF6DxpgfTbyb2MFx1WALq/view
a daily temperature measurement histogram in which not the hours with the same temperature are counted, but rather their three different daily means
– (Tmin+Tmax)/2 aka middle
– median
-full 24h average
https://drive.google.com/file/d/1JHRa6niBNs3hN7TzFpnpevrPQv-JtJcf/view
{ This is of course based on hourly data averages because USCRN daily data does not provide for a median temperature. }
This time, the histogram is in plot form because the differences are a bit too tiny for a display in bar mode.
Below is the histogram of the temperature measurement distribution for all 138 active USCRN stations over the period 2002-2021
Oh wow. So you include all the 138 Latitudes for the USCRN as though that actually proved something.
For each individual station the distribution is a skewed, bimodal one as I claimed.
“This is of course based on hourly data averages because USCRN daily data does not provide for a median temperature”
You mean you cannot create a median for each day even though you have the hourly temperatures?
Or a median for each hour given the 5min data?
That is really the dumbest reply I could imagine.
1. YOU are the one who claims about me using hourly data, while being unable to prove that it leads to alleged ’rounding errors’ compared to subhourly data, by generating the same time series as I do, with subhourly instead of hourly data.
2. I’m 101 % sure that if I had used
– USCRN daily data for (Tmin+Tmax)/2 aka middle and 24h average
– USCRN hourly data for the median
you would have complained and criticized as well and would have said it would have been better to use hourly data as common basis for the sake of homogeneity.
3. If I would have used subhourly data wherever possible, you would have claimed I would have done it wrong, because USCRN has no subhourly data before 2006, and would have said that the mix of subhourly and hourly led to biases.
“YOU are the one who claims about me using hourly data, while being unable to prove that it leads to alleged rounding errors compared to subhourly data”
Using already rounded hourly data (from 5min data) will produce rounding errors. That is a fact. As was proved a long time ago.
“you would have complained and criticized as well and would have said it would have been better to use hourly data as common basis for the sake of homogeneity”
Nope. I am on record as saying that you should never down size time data. If you have 5min you should use that. You could also use daily data that has been directly composed from that as USCRN do.
https://imgur.com/gallery/zjtZRNy#
For a single station. Of course if all 138 are mangled together then we will get a latitude smear.
Strange that people are so dominated by the idea that the Globe is cooling just because
– we had a global bunch of warm during the last El Nino, and
– we have now a (not at all global) bunch of cold during the current La Nina.
*
” … but things seem to get cooler. ”
List of the years in the UAH6.0 LT record with a yearly anomaly average lower than their five preceding years:
1985
1992
2000
2008
2021 isn’t even in the list because 2018’s yearly anomaly was lower.
I plot what the data says.
https://climatedatablog.files.wordpress.com/2022/06/uah-1.jpeg
says it is cooling right now.
Not only it is cooling, but I predicted it, It was 4 years ago when I predicted the temperature would go down from there on , and it is
S-G is used in a lot of other disciplines for good reason.
Wow Ebaby, you are a genius.
Because it was simple to predict that:
– 2016 was the warmest year in the entire UAH history
– the chance for a subsequent, stronger El Nino was statistically low.
Thus, the probability to obtain warmer anomalies than in 2016 was near zero dot zero.
You are this blog’s best Predicterminator!
You are just an idiot who did not know the difference between a bar graph and a histogram.
And you, Linsley-Hood, are just a coward lacking courage AND skill to technically contradict what I did.
All what you are able to do is to polemically discredit what others do, without ever proving them wrong.
Blinny some who does not recognize that smearing together 138 USCRN stations data just smears the result across many Latitudes.
Blinny: Are you actually saying that the results for a single USCRN station are not the skewed, bimodal histograms that I claimed?
” Blinny some who does not recognize that smearing together 138 USCRN stations data just smears the result across many Latitudes. ”
Strangely, the supergenius Linsley-Hood does not recognize that smearing together 9,504 UAH grid cells’ data smears the result across many latitudes in exactly the same way.
Blinny never addresses what I actually claimed. That for each individual station the daily histogram is a skewed, bimodal data set.
P.S. Blinny: That is why the UAH global figure is further broken down into separate areas to minimize the latitude smear.
https://climatedatablog.files.wordpress.com/2022/06/uah.jpeg
https://climatedatablog.files.wordpress.com/2022/06/uah-tropics.jpeg
https://climatedatablog.files.wordpress.com/2022/06/uah-north-pole.jpeg
https://climatedatablog.files.wordpress.com/2022/06/uah-south-pole.jpeg
… and I repeat: this cooling happened already four times in UAH’s history.
Rendez-vous in three or four years, when the next El Nino drains from the Equatorial Pacific everything that the current La Nina is dumping in.
So what?
El Nino are less frequent that La Nina in the last 25 years, soon to be statistically significantly so.
“An Associated Press statistical analysis of winter La Ninas show that they used to happen about 28% of the time from 1950 to 1999, but in the past 25 winters, they’ve been brewing nearly half the time. There’s a small chance that this effect could be random, but if the La Nina sticks around this winter, as forecast, that would push the trend over the statistically significant line, which is key in science, said L’Heureux. Her own analysis shows that La Nina-like conditions are occurring more often in the last 40 years. Other new studies are showing similar patterns”
Bindidebil can always predict the past , never the future.
Good history of his predictions on this board to remind him
Blinny did not know the difference between a bar chart and a histogram.
binny…”List of the years in the UAH6.0 LT record with a yearly anomaly average lower than their five preceding years:”
***
Does that include the flat trend from 1998 – 2015 and 2016 – present. And the re-warming trend from 1979 – 1998?
CO2 sure acts in an unpredictable manner. Seems to strike every decade or more to sudden cause an upward glitch.
Some imagine Venus is hot due to the internal heat of the rocky planet.
I think it’s possible, but it seems to me, there would need to be a lot of internal heat.
Now, it’s thought that Venus surface is young [but not as young as our rocky surface of Earth’s oceans] and if Venus rocky surface was molten it seems open the possibility of rocky surface heating the atmosphere of Venus.
Anyhow, I think I understand why Venus surface air is so hot, and it’s not due to internal heat of planet nor from recent impactor hitting Venus. Instead I think it’s heated at it’s cloud surface which about 50 km above rocky surface.
Related to this, is question, does Earth ocean cause Earth to have warmer a molten ball of rock, or colder. Or more unlikely, have no effect of cooling or warming the molten ball of rock.
Now it seems everyone would agree, that Venus huge Atmosphere would keep Venus molten rock, warmer.
But if you say, yes.
The question is by how much.
But if say the 92 bars of atmosphere cools the molten core or doesn’t have any effect, then you not required to say by how much.
“Some imagine Venus is hot due to the internal heat of the rocky planet.”
Who are these whacky creatures, and do they show themselves on our board?
Some colourful souls here imagine that the strong atmospheric pressure near the surface of Venus causes the heat strong enough to melt lead. But they can’t explain why I can pick up a full scuba tank, at twice that pressure, with my bare hands and it is cold.
Most understand that Venus is hot at the surface because of the powerful greenhouse effect there. Of course, this is controversial with some of our locals.
barry…”Most understand that Venus is hot at the surface because of the powerful greenhouse effect there”.
***
As astronomer Andrew Ingersol once commented, a greenhouse effect causing a surface temperature of 450C would contradict the 2nd law.
https://agupubs.onlinelibrary.wiley.com/doi/abs/10.1029/JA085iA13p08219
“Pioneer Venus observations of temperatures and radiative fluxes are examined in an attempt to understand the thermal balance of the lower atmosphere. If all observations are correct and the probe sites are typical of the planet, the second law of thermodynamics requires that the bulk of the lower atmosphere heating must come from a source other than direct sunlight or a thermally driven atmospheric circulation. Neither the so-called greenhouse models nor the mechanical heating models are consistent with this interpretation of the observations”.
“Most understand that Venus is hot at the surface because of the powerful greenhouse effect there.”
How much sunlight reaches Venus rocky surface?
And since you here, if Venus was at Earth distance from the sun,
how much sunlight reaches the rocky surface?
gbakie,
Did you know that the average surface temperature of Mercury is less than Venus, despite being closer to the sun, and despite Venus getting much less sunlight at the surface?
And that the diurnal temperature range on Venus is tiny compared to Mercury?
You’d think that it would get warmer as you go upwards in the atmosphere towards ever increasing fractions of sunlight. But even during Venusian day, it gets colder as you go upwards, much like what happens in the troposphere on earth.
The inverted temperature gradient is a feature of greenhouse atmospheres.
Wrong again barry.
An atmosphere cooling with altitude is how heat transfer works (Earth troposphere). An atmosphere warming with altitude (Earth stratosphere) is an “inverted temperature gradient”.
You don’t understand any of this, and the fun part is, you can’t learn!
>You’d think it would get warmer as you go up in the atmosphere.
I wouldn’t think that. The surface heats the atmosphere or the atmosphere cools the surface. I’d think it gets cooler due to less conductive and convective heat transfer.
“Youd think that it would get warmer as you go upwards in the atmosphere towards ever increasing fractions of sunlight. ”
The sunlight gets warmer, but temperature of air is related to mass of air and it’s velocity. For you think the air would get warmer when mass of air is getting less with elevation, you have imagine the velocity of air molecules is getting faster as you go higher.
And in the troposphere the speed of sound is about the same, or velocity of air molecules are about the same. While the density of air gets significantly less.
“An atmosphere cooling with altitude is how heat transfer works (Earth troposphere).”
The oceans get cooler with depth because sunlight is filtered. What is it about the troposphere that transfers heat in the opposite direction despite sunlight also being more filtered at depth? I’d be curious to know how you explain it.
The answer is about 24 watts average reaches Venus rocky surface:
https://rmets.onlinelibrary.wiley.com/doi/full/10.1002/qj.2704
But it’s probably less than this.
And at Earth distance from sun, Venus surface the number would even closer to zero.
There are idiots which believe in catastrophic warming.
Why aren’t they moving to Canada?
Is it because they are mentally below the age of 12?
Or does Canada has immigration policies which make it too hard to do?
It seems likely that Canada laws make it too hard for idiots
to move to Canada.
I think we need to make easier for people to move anywhere they want to move. This of course, includes planet Mars.
Scott Adams thinks we should make an effort to make moving out of bad neighborhoods to other places in US, easier.
I think we make easier for people to move to ocean settlements.
{and Scott or other people don’t understand how we could make ocean settlements. I think we will make ocean settlements if people live on Mars. But we don’t need to wait for tens of thousands of people living on Mars, to make ocean settlements}.
Anyhow, it seems if Canada cared about catastrophic warming, they make easier for people worried about catastrophic warming to move to Canada. I also think Russia should make easier for those worried about warming, to move to Russia [where is colder than Canada}.
Now, certainly there is argument that you don’t a bunch of idiots.
Scott’s plan is to make it a form of entertainment. It seems to me, that very popular entertainment to watch people acting like idiots on TV.
Scott believe that there is problem related to global warming. But he not moving to Canada. He has faith that we will suck the CO2 out of air, and/or use nuclear energy.
So, Scott doesn’t think he needs to move from one the warmest State in the United States, he thinks bat shit government will allows some kind of solution to the problem of global warming [which isn’t a problem- other governments are trying and being successful in cause more CO2 emissions- it’s pretty simple to do, even for an idiotic government, all got to do is more taxes and more oppression which they can do- they like to do this endlessly- it helps them with their self esteem- they even ignore laffer curve- the most amount one tax people- and get to most amount government revenue]
You’re a Star Trek kind of guy. You seem to think we’re going to technology ourselves out of our mess. I don’t.
–You seem to think were going to technology ourselves out of our mess. I dont.–
You have to define our mess.
Let’s start with low population growth
Meh.
Bad education.
It’s possible.
But it seems teacher unions are committing suicide, which is wonderful direction for them to take- and it’s not really related to technology.
Corruption of FBI, CIA, and etc. They have always been very corrupt-
it’s just more obvious to everyone.
Same goes elections- always corrupt.
Technology: “…can’t stop the signal, Mal”.
In that sense.
But it’s not particularly “high technology” or something.
In terms space exploration, I just don’t want NASA to continue to commit suicide. But I been thinking lately, it might be best if NASA were to simply die.
Apollo inspired, if you go to the Moon, then you do X.
As in war on Poverty and war on Drugs- both aren’t working.
And so, if most popular bureaucracy, does impossible of committing suicide, maybe other bureaucracy far less popular will also do the impossible of killing themselves. The FBI might get the credit, but NASA might help it along.
Technology is related as rocket launch is lower in costs. But Musk might get most of the credit.
We are still living in the best time in history of Humankind, so
I think you should define the mess which I think will be fixed with technology, other than technology got us, where we are.
I think AI would be better politicians and lawyers.
I agree about NASA. It needs to die. When I’m talking mess, I’m talking financial mess. Civilizations collapse when too many are supported by too few. The Romans, the Greeks, the Mayans, the Incans, etc. They collapse due to their own largess. We’re at that point. This collapse will last centuries.
Well the Roman collapse is something to ponder as is the Little Ice Age.
But we had Spanish and French collapse and British Empire ended.
US has destroyed a lot Empires, and they seemed quite happy to end them- and Soviet Union was fairly recent.
But French, Spanish, and Soviet were not really civilization worth much mention. Unlike say Roman or Brit which still casts their shadow.
Empire die. America should avoid their globalism silliness.
The issue is what replaces it. I tend to think India and Africa are doing better.
In the Northern Hemisphere the waves are moving West. It started with Asia and moved West to Mesopotamia, Greece, Rome Europe, UK, US. The next great empire should be West of us. I predict either Japan or Korea, not China.
Or, could be India.
“Or, could be India.”
India at some point. But I think it will be more gradual, they have a lot of history, some might seem frantic, but steady progress seems more likely. Whereas Africa could be in more in a hurry, and I think should focus on uniting- and going “somewhere” is a way to unite.
The world will affect India, Africa will affect the world.
I too want to move because of climate change. From Canada to Mexico.
I am afraid the wall will prevent my getting in.
Does Russia care what other countries think?
https://www.youtube.com/watch?v=2m_bmq6hD8s
{never have, can’t imagine why they would start- Politicians
are evil- power corrupts, absolute power corrupts absolutely.
Not only do russian pols not care, neither do any other pols}
Russia TV make s like CNN, better. How far can humans fall?
Just watch Russian talking heads, CNN could fall another few miles,
to reach such utter stupidity.
gb…Russian broad.casters don’t have a choice, they can either preach the party line or go to a gulag. CNN has no excuse, other than they are loaded with perverts and misfits. They support the Democrats and there must be some kind of message in there.
Ask me again , where is the superdeveloping La Nina ???
Looking at monthly averages, May 2022 was the second-strongest La Nia month on record, and by far the coolest of the eight two-year La Nia events that have occurred since 1950.
https://www.climate.gov/news-features/blogs/june-2022-enso-update-how-does-your-garden-grow
May 2022 was the warmest May during a double-dip la Nina.
But should we wait 5 months to make the comparison?
January 2022 was the warmest January during a double-dip la Nina, but I don’t think this la Nina was breaking any records then.
There’s a little typo there in the article. May 2022 was the 2nd strongest la Nina in May of a calendar year. The article had been focussing on that month and the previous so maybe thy didn’t feel necessary to clarify. You only have to look at the graph to see that there have ben many times last May’s value has ben strongly eclipsed in some other month.
Here is the monthly data for anyone interested in checking it out.
https://www.cpc.ncep.noaa.gov/products/analysis_monitoring/ensostuff/detrend.nino34.ascii.txt
Yup, May 2022 is the second strongest May ka Nina in the record. The coldest was May 1950.
Almost unprecedented, then.
Being an index climate.gov’s graph does not show temperatures directly as such. It does mention as a left hand axis ‘Difference from average temperature (C)’. That is for Nino 3.4, not a global figure.
https://www.climate.gov/media/14589
That shows that for this month in a multiyear La Nina cycle, we are experiencing a unprecedented (read record) situation with only one previous cycle even coming close to the current state.
“by far the coolest of the eight two-year La Nia events that have occurred since 1950.”
“Being an index climate.gov’s graph does not show temperatures directly as such. It does mention as a left hand axis ‘Difference from average temperature (C)’. That is for Nino 3.4, not a global figure.”
The monthly values for the ‘difference from average temperature (C)’ for NINO3.4 region are in the link I posted, on the right column.
https://www.cpc.ncep.noaa.gov/products/analysis_monitoring/ensostuff/detrend.nino34.ascii.txt
In the centre column is the sliding 30-year monthly averages from which the anomalies are calculated expressed as absolute temps. The left column is the absolute temps for SSTs in the NINO3.4 region.
The anomalies make up the ONI index, on which NOAA base their ENSO status.
1870 is earlier than 1950.
I have no idea why you said that. I am citing the values that NOAA uses for its ENSO index. The one NOAA relies on for its ENSO advisory. They don’t use any 1870 index for that purpose.
NOAA data goes back to 1870.
“by far the coolest of the eight two-year La Nia events that have occurred since 1950.”
Yep, unprecedented since 1950.
You need to go back to 1870?
https://www.drroyspencer.com/2022/06/uah-global-temperature-update-for-may-2022-0-17-deg-c/#comment-1313303
It’s unprecedented in a double dip La Nina as the climate.gov graphic shows.
https://www.climate.gov/media/14589
Notice the purple line is below other lines for most of the year and totally below them for the last 2 months.
“by far the coolest of the eight two-year La Nia events that have occurred since 1950.”
Again the obsession with a single month’s noise.
Then later focusing on applying 15 y low pass filters that remove all of it.
Weird.
A single month of weak La Nina does not amount to a hill of beans.
Integrated over the the whole season, which is what matters, this La Nina was weak/moderate, well inside the middle of pack of La Nina’s.
That is why, after this whole two-year La Nina, the global temps are just barely below an extension of the long-term upward trend line.
Now, go ahead and continue obsessing, dreaming, hoping for cooler times ahead.
Always just around the corner.
“Again the obsession with a single months noise”
Again the obsession to denigrate climate.gov ESNO blogs image.
https://www.climate.gov/media/14589
“A single month of weak La Nina”
https://www.climate.gov/media/14589
shows the true picture. It is below other lines on the graph for most of the year and completely below them all for the last 2 months.
“It is below other lines on the graph for most of the year”
Yes and well above others. Lame.
As I said, well inside the middle of the pack.
Looks like we are now headed for neutrality.
https://www.cpc.ncep.noaa.gov/products/analysis_monitoring/enso_update/heat-last-year.gif
https://www.tropicaltidbits.com/analysis/ocean/nino34.png
And the month or two of delay in that will not amount to much global cooling.
The DJF season is a bit more than a couple of months off Nate.
https://iri.columbia.edu/our-expertise/climate/forecasts/enso/current/
Make that the JFM season! Like 7 months and even then Neutral is only slightly favored over La Nina.
Bill you are confused. I said nothing about DJF!
OK what is your prediction for neutral. Last year MJJ and JJA and AMJ and JAS was right on the line at -.05
Is your prediction that it is going to be warmer than that?
Here is the same NOAA data in a different form
https://psl.noaa.gov/gcos_wgsp/Timeseries/Data/nino34.long.data
which is what I use for my graphs.
See https://psl.noaa.gov/gcos_wgsp/Timeseries/
Yes.
Although it’s not the coldest ONI SST during a la Nina by far, nor nearly the coldest ONI SST in the second leg of a double-dip la Nina, nor the coldest ONI SST in May during a double-dip la Nina…
It is most definitely the lowest ONI anomaly in the second leg of a double-dip la Nina for the particular time of calendar year!
Also for global temps in 2022:
January was the warmest ever January in a double-dip la Nina
February was the warmest ever February in a double-dip la Nina
March was the warmest ever March in a double-dip la Nina
April was the warmest ever April in a double-dip la Nina
May was the warmest ever May in a double-dip la Nina
I keep telling you, mate, it’s unprecedented! I hope you are as excited as I am.
“It is most definitely the lowest ONI anomaly in the second leg of a double-dip la Nina for the particular time of calendar year!”
So setting a record is not unprecedented. Who knew?
“April was the warmest ever April in a double-dip la Nina
May was the warmest ever May in a double-dip la Nina”
Not in the climate.gov graphic.
https://www.climate.gov/media/14589
Read more carefully.
“Also for global temps in 2022…”
To repeat,
January was the warmest ever January in a double-dip la Nina
February was the warmest ever February in a double-dip la Nina
March was the warmest ever March in a double-dip la Nina
April was the warmest ever April in a double-dip la Nina
May was the warmest ever May in a double-dip la Nina
I keep telling you, mate, its unprecedented! I hope you are as excited as I am.
“January was the warmest ever January in a double-dip la Nina
February was the warmest ever February in a double-dip la Nina
March was the warmest ever March in a double-dip la Nina
April was the warmest ever April in a double-dip la Nina
May was the warmest ever May in a double-dip la Nina”
And yet that is simply disproved by
https://www.climate.gov/media/14589
“An Associated Press statistical analysis of winter La Ninas show that they used to happen about 28% of the time from 1950 to 1999, but in the past 25 winters, they’ve been brewing nearly half the time. There’s a small chance that this effect could be random, but if the La Nina sticks around this winter, as forecast, that would push the trend over the statistically significant line, which is key in science, said L’Heureux. Her own analysis shows that La Nina-like conditions are occurring more often in the last 40 years. Other new studies are showing similar patterns”
My God, you really are trapped inside your mind, aren’t you?
Do you actually not realize that I am talking about global temperatures, and you are countering that with an ENSO index which represents SSTs from less than one half a percent of the globe and saying I’m wrong?
Wow. Just wow. You have a problem.
So do you recon that the Tropical data will follow ESNO more closely than the Global figures do?
ซีรี่ย์เกาหลี 5 เรื่อง ที่ชาว slotxoth ต้องดู วันนี้เราจะมาเเนะนำ ซีรี่ย์เกาหลีที่น่าดู 5 เรื่องที่ชาว slotxoth ต้องดูห้ามพลาดๆ เพราะเดี๋ยวจะตกเทรนด์ คุยกับเขาไม่รู้เรื่อง pgslot https://pg-slot.game/
The Planet Mean Surface Temperature New equation:
Tmean = [ Φ (1-a) S (β*N*cp)∕ ⁴ /4σ ]∕ ⁴ (K)
is based both, on precise radiative
energy in = Φ (1-a) S estimation and
on the Planet Rotational Warming Phenomenon.
We are capable now for the THEORETICAL ESTIMATION of the planetary mean surface temperatures.
https://www.cristos-vournas.com
I agree.
Science has been capable of the THEORETICAL ESTIMATION of the planetary mean surface temperatures since Dr. Sagan did it for Venus reasonably well before the Russians landed their Venera series.
Venus even has an atm. which Christos’ equations ignore & Dr. Sagan did not ignore.
Planet Earth has a very thin atmosphere…
Compare the figures:
1 bar with 0,04% CO2 for Earth, and 92 bar with 96% CO2 for Venus.
How much more CO2 Venus has?
Let’s calculate: 92 bar * 96% / 1 bar * 0,04% =
and we shall have
92*96*25 = 220.800 times more CO2 Venus’ atmosphere has compared to Earth’s.
So what we compare is 1 to 220.800 !
For someone living on the Venus the conclusion would be the planet Earth doesn’t have any CO2 in its atmosphere.
That is why we confirm here that yes, Venus has a runaway greenhouse effect because of its very thick atmosphere, Venus has a very strong greenhouse effect.
https://www.cristos-vournas.com
If the someone living on Venus had the required instrumentation, the someone would reasonably well know the composition of the earthen atm. without an earthen lander.
Actually its Venus’ very thick atmosphere which causes the high temperatures. PV=nRT
Assuming a similar IR radiation spectrum as earth, the greenhouse effect from CO2 should be pretty small portion of that temperature, way less than 33K we get due to absence of water vapor.
The 91bar Venus atm. is the main contributor to the surface atm. being IR opaque; the Venus atm. composition has much less to do with Venus’ surface temperature than on Earth since the 1bar earthen surface atm. is not IR opaque.
Ken
“Actually its Venus very thick atmosphere which causes the high temperatures. PV=nRT”
No, Ken, that’s not how it works.
Entropic Man, please stop trolling.
Curious about whether there have been more la Ninas, I did a simple regression based on NOAA’s monthly ONI values (anomalised SSTs in the NINO3.4 region).
First for the period 1950 to May 2022.
https://i.imgur.com/m6pxxW6.png
And then for the roughly 25 year period 1997 to May 2022.
https://i.imgur.com/MSv90k1.png
There is a downward trend suggesting more la Nina-like conditions over time for both periods, or that the relative strength of el Ninos/la Ninas are shifting towards la Ninas.
From 1950: -0.02 C/decade [-0.050 to 0.004]
From 1997: -0.04 C/decade [-0.177 to 0.104]
Neither are statistically significant trends, but the 1950 figure is close.
However, the slope is very small, so statistical significance isn’t going to mean a whole lot for the longer period.
Perhaps if we isolated el Nino and la Nina months only, we could get a clearer picture. But that’s too much effort for me.
Here’s the monthly data if anyone else wants a go.
https://www.cpc.ncep.noaa.gov/products/analysis_monitoring/ensostuff/detrend.nino34.ascii.txt
El Ninos/la Ninas are characterised as sustained 3-month averages beyond the +/- 0.5 threshold for 5 consecutive 3-month averages.
You can get an easy fix on that in this chart.
https://origin.cpc.ncep.noaa.gov/products/analysis_monitoring/ensostuff/ONI_v5.php
So you disagree with Michelle that if the current La Nina keeps going until the end of this year (which it is most probably going to do) that the La Nina/El Nino ratio over the last 25 years will not become statistically significant.
https://i.imgur.com/m6pxxW6.png
So you agree that La Nina has become more frequent that El Nino since 1950.
Do you think that might have had some effect on Tropical temperatures?
Nino graphs since 1870 to date
https://climatedatablog.files.wordpress.com/2022/06/nino12.jpeg
https://climatedatablog.files.wordpress.com/2022/06/nino3.jpeg
https://climatedatablog.files.wordpress.com/2022/06/nino34.jpeg
https://climatedatablog.files.wordpress.com/2022/06/nino4-1.jpeg
“So you…”
Put together a post looking at linear trend of ENSO values per the NOAA methodology and gave the uncertainty.
When I said,
“Perhaps if we isolated el Nino and la Nina months only, we could get a clearer picture.”
That was a nod to whatever “Michelle” did.
If you want to have a conversation stop leading the fucking witness or buy me a drink.
Or you could just do the work that you are suggesting others do.
You’re a pompous twat, Richard. All you know how to do is play climateball. You’ve forgotten how to enquire.
I research things constantly and plot the data as I find it. I don’t play climateball.
Yeah you do. Eg, your reply about natural cycles when I’m saying there is a dataset that removes non-ENSO signals (like warming) is climateball. It’s utterly beside the point.
But you can’t see that point because you’re fighting some fight. Cyclicity or not is irrelevant to the point. Natural or not is also irrelevant to my point.
The point is that the sliding 30-year method removes any signal not ENSO, be it warming cooling, cyclical, natural, fake tits or whatever. The point is about removing non-ENSO signals from the data.
The 30-year average shifts every 5 years. This period chosen as a good max period for an ENSO ‘cycle’.
The averaging is also done on a month by month basis, to remove the seasonal component.
“Yeah you do”
No I don’t.
“The averaging is also done on a month by month basis, to remove the seasonal component”
An HQLP 12 month filter does the same thing.
“So you agree that La Nina has become more frequent that El Nino since 1950.”
No. As I said, it’s not statistically significant, via my cursory look. And the trend is so shallow that even if it were statistically significant, it wouldn’t have much impact on anything.
“Do you think that might have had some effect on Tropical temperatures?”
Richard, you know how to plot UAH data, you know where to find it. You’ve shown the graphs here before.
How about you come to the party and show the tropical temp trend for the last 25 years? Reply to my post above with that and then we will be actually having a conversation where we both make an effort.
I mad a post in good faith, no agenda. Wacha gonna do?
So you disagree with climate.gov ENSO blog then.
uh-huh. That’s whatcha gonna do.
I prefer to consider all sources.
Bin&Barry forecasting – both ENSO experts who could not see the La Nina coming even when it was right in front of them, but now tell you all about it
http://www.drroyspencer.com/2021/06/biased-media-reporting-on-the-new-santer-et-al-study-regarding-satellite-tropospheric-temperature-trends/#comment-726374
Eben, you simply must stop being a fuckwit.
And then for the roughly 25 year period 1997 to May 2022.
https://i.imgur.com/MSv90k1.png
The data source you’ve identified on this plot is apparently a detrended dataset. I haven’t looked into what exactly this means, but that might be relevant if one is looking at trends.
My understanding is that ONI (which is essentially Nino3.4) uses a sort of sliding 30 year baseline that is centered for 15 years before the baseline end date (currently 2020), so there would be end effects on more recent data.
Perhaps better to use non-detrended data for this exercise?
As far as I know, the data used to create my graphs from 1870
https://www.drroyspencer.com/2022/06/uah-global-temperature-update-for-may-2022-0-17-deg-c/#comment-1313303
is not detrended.
If you give me a link to the data I can try to find out for you.
https://psl.noaa.gov/gcos_wgsp/Timeseries/
SST Indices
Nio 3.4: Standard PSL Format
https://psl.noaa.gov/gcos_wgsp/Timeseries/Data/nino34.long.data
Not
Nio 3.4 (anomaly; 1981-2010 mean removed): Standard PSL Format
As it says on the graphs for data source.
I wasn’t going to type out a whole string when you could just link it for me. Did you notice how I did that for the post I made, inviting anyone to make use of it? That’s how you do it, Richard.
I’ve checked for you. I’m fairly sure that is, as the description says, SST values for NINO3.4 region.
These values are not detrended, so they will include a warming trend. You will not be able to assess whether la Ninas have become more frequent, as the data is not tailored for ENSO study – I think. The attached study makes no mention of NINO3.4, so I believe it is not a dedicated dataset.
If you do the same analysis I did, you will likely end up with the result that SSTs in that region have warmed, giving you a spurious result.
The ENSO index that NOAA use is the one I have linked just above. It has been detrended to remove any climate change signal (warming or cooling) so that what is left is just the periodic fluctuation.
https://www.cpc.ncep.noaa.gov/products/analysis_monitoring/ensostuff/detrend.nino34.ascii.txt
And there I was thinking that including the data source that I used in the graphs was sufficient.
You make an assumption that any ‘trend’ is a continuously upwards OLS value instead of the quite possible > 100 years natural cycle.
All global SST data sets show warming over the century, and warming over the period from 1950.
This is also true for the NINO regions.
The methodology also removes any long-term cyclicity (if it exists).
If you want to isolate ENSO activity from other signals, then the 30-year sliding average is a good method.
NOAA doesn’t us HadiSST for its SST analysis of the NINO regions. They use ERSST v5, and they detrend it.
The reason I’m letting you know is because you frequently cite NOAA’s ENSO forecasts and alerts, and you go by their metrics re current conditions. The data I provided is their ENSO index.
“So you’re saying other indices can’t be used?”
Is the crap I fully expect you to come out with next. Can you just stop swinging at me? It’s so boring.
Did you ignore the > 100 years bit?
Did you ignore everything I just wrote to you?
So you did ignore the > 100 years bit?
“An Associated Press statistical analysis of winter La Ninas show that they used to happen about 28% of the time from 1950 to 1999, but in the past 25 winters, they’ve been brewing nearly half the time. There’s a small chance that this effect could be random, but if the La Nina sticks around this winter, as forecast, that would push the trend over the statistically significant line, which is key in science, said L’Heureux. Her own analysis shows that La Nina-like conditions are occurring more often in the last 40 years. Other new studies are showing similar patterns”
Sure is interesting.
Jesus Christ. You don’t want to discuss anything, you just want to push your narrative over and over. Just keep repeating the same stuff, like a robot.
So I went and got some data to have a quick peek at the notion of increasing la Ninas. And rather than see that as an opening to a discussion, which was the intention, you came along to try and shut it down and push the article I’ve already quoted from and which kicked off the little probe I had.
I did that with no agenda other than to discuss, if anything. You are a complete boor.
So reporting some observation that are repeated in lots of the press does not impress you because why?
Is it because they suggest that
a) the models are wrong.
b) things look like getting colder rather than warmer.
“push the article Ive already quoted from”
So do you agree with LHeureux and if not why?
If you could link to the study done by l’Hereux or explain their methods, then I could form a better opinion. The article doesn’t have those details. The article gets the research community’s view of future ENSO patterns wrong, so naturally I’m a little skeptical of the reporting.
FYI, I don’t give much shrift to any news reporting on science, and particularly climate science. Do you have a more formal document to share?
If you want to ask about LHeureux’s methods and data, why not ask her on the ENSO blog or via email?
“Her own analysis shows that La Nina-like conditions are occurring more often in the last 40 years. Other new studies are showing similar patterns”
You think she is a bad enough scientists to allow them to report her work like that if is was not correct?
“The article gets the research communitys view of future ENSO patterns wrong”
So LHeureux studies are not enough for you? You don’t like them because they show a different result to what you are expecting.
Very open mind that.
“Theres a small chance that this effect could be random, but if the La Nina sticks around this winter, as forecast, that would push the trend over the statistically significant line, which is key in science, said L’Heureux”
Do you object to the direct quote by L’Heureux?
“You think she is a bad enough scientists to allow them to report her work like that if is was not correct?”
You think scientists have authority over what journalists print?
“So LHeureux studies are not enough for you?”
Are you saying I should not consider other sources?
“You don’t like them because they show a different result to what you are expecting.”
Are you saying I am expecting a different result?
“At this point we just dont know,” L’Heureux said.
Do you object to this direct quote by l’Hereux?
Do you agree that she also said that it was very likely that the result would be statistically significant by the years end?
No, I don’t agree she said that.
Perhaps it would be helpful to quote her from the article:
“They (La Ninas) don’t know when to leave”
“At this point we just don’t know”
“Scientists are watching and I know, are actively studying. But it’s really important because of regional conditions. We need to get this right”
“These are very impressive values for April”
If I missed anything she is quoted as saying, or where it is made clear she is the source of the commentary, please let me know.
Article here: https://tinyurl.com/4eevcu3y
“An Associated Press statistical analysis of winter La Ninas show that they used to happen about 28% of the time from 1950 to 1999, but in the past 25 winters, they’ve been brewing nearly half the time. There’s a small chance that this effect could be random, but if the La Nina sticks around this winter, as forecast, that would push the trend over the statistically significant line, which is key in science, said L’Heureux. Her own analysis shows that La Nina-like conditions are occurring more often in the last 40 years. Other new studies are showing similar patterns.
What’s bothering many scientists is that their go-to climate simulation models that tend to get conditions right over the rest of the globe predict more El Ninos, not La Ninas, and that’s causing contention in the climate community about what to believe, according to Columbia University climate scientist Richard Seager and MIT hurricane scientist Kerry Emanuel.”
And here
https://www.independent.co.uk/news/ap-atlantic-scientists-weather-el-nino-b2089441.html
and here
https://tallbloke.wordpress.com/2022/05/29/weathers-unwanted-guest-nasty-la-nina-keeps-popping-up-confounding-climate-modellers/
and here
https://vervetimes.com/nasty-la-nina-keeps-popping-up/
and here
https://www.weatherbug.com/news/Weather-s-Unwanted-Guest-Nasty-La-Nina-Keeps-Popp
I looked at the quote you posted, Richard, and I can’t see l’Hereux saying she thinks it very likely that the trend will become statistically significant by year’s end.
Can we now agree she didn’t say that, or would you prefer to move on without acknowledging that?
Mark,
It is indeed a detrended dataset.
https://origin.cpc.ncep.noaa.gov/products/analysis_monitoring/ensostuff/ONI_change.shtml
To figure out any change in ENSO itself (per the NOAA metrics), that’s the one to use. The sliding 30-year baseline is to remove any climatic component and just leave the quasi-periodic signal.
https://psl.noaa.gov/gcos_wgsp/Timeseries/
SST Indices
Nio 3.4: Standard PSL Format
https://psl.noaa.gov/gcos_wgsp/Timeseries/Data/nino34.long.data
and
Nio 3.4 (anomaly; 1981-2010 mean removed): Standard PSL Format
are not detrended.
I believe that is correct. The long-term warming signal remains in the dataset you are using.
Subject to it being (or not) a long term natural cycle (>100 years) instead of a continuously upwards OLS trend.
If you prefer your ENSO data contaminated with other signals, then keep using the dataset you are using. If you want to isolate ENSO from any other signals, the ONI dataset is easy to access, and it’s not the only one, if you have an aversion to it.
“ONI (5N-5S, 170W-120W): The ONI uses the same region as the Nio 3.4 index. The ONI uses a 3-month running mean, and to be classified as a full-fledged El Nio or La Nia, the anomalies must exceed +0.5C or -0.5C for at least five consecutive months. This is the operational definition used by NOAA”
For a HQLP pass filter the 2 (ONI and Nino 3.4) are indistinguishable.
I have no idea what a HQLP pass filter is, but I think maybe you are not interested in ENSO, only in cycles in SST data.
As I said, if you use just the SST data, then you will not isolate ENSO.
If you run the same analysis as Michell, you will get a different result. She uses the detrended data.
I already tested the non-detrended data. 0.5 C warming 1950 to present. Maybe you’ll try some tests on ENSO with the dataset you’re using.
“I have no idea what a HQLP pass filter is”
High Quality Low Pass.
“maybe you are not interested in ENSO, only in cycles in SST data”
On one had you admit that El Nino and La Nina effect global temperatures and on the other hand you say that changing the ratio between them occurring will have no effect. Make your mind up.
Yes, ENSO events affect global temperature. A change of 1%, for example, in relative strength is not going to have a noticeable effect. Variability of ENSO would swamp that small change.
Why are you always in combat mode? What is wrong with you?
“0.5 C warming 1950 to present.”
Caused by what? Do you proof that your explanation is correct?
Why are you always in defensive mode? Is it that the models are failing to follow what is actually happening?
“Variability of ENSO would swamp that small change”
So a statistically significant change in the ratio between El Nino and La Nina would not worry you?
Are you saying you don’t know what “for example” means?
Are you saying that a statistically significant change in the ratio between El Nino and La Nina would not worry you?
So you’re not sure of what I mean by “for example”?
“Why are you always in defensive mode? Is it that the models are failing to follow what is actually happening?”
THIS is climateball, Richard. You just can’t help yourself.
You don’t want to “consider other sources” as you credited yourself recently, you just want to collect material that buttresses your preferred outlook and ignore those that don’t.
You’re not objective, not by a long shot, which is why you project views onto me that I don’t hold. You need to characterise me as an opponent in the endless climateball debate, so you invest in me the opinion that el Ninos will increase, which I don’t hold, an attachment to climate models that I don’t have and all sorts of projections that you run in our conversations that are about an imaginary opponent, not about what I am actually saying. The majority of your responses are blind to what I’ve actually said and where I’m coming from, and totally about your agenda.
This is why you continually talk past me (and others). This is why you are not direct, but endlessly implying. You’re trying to corner people rather than exchanging frank views with them. That’s why you regularly begin a post with “So you’re saying,” and leading the witness instead of sitting down and having a candid chat.
It’s obvious and it’s tedious. But I don’t think you can stop doing it.
There is so much I am not attached to that you think matters to me. I am not an activist. I don’t care if we get more la Ninas. It doesn’t matter if the UAH anomalies dip below the zero line in the near future. I’m not alarmed, nor an alarmist.
What matters to me is accurate science and accurate representations of the science. I see that you’re not going to help us get there.
Barry falls into the ‘lies, damned lies and statistics’ model.
Are you saying that the last 5 months are not the warmest globally to have occurred during a double dip la Nina?
I said: “0.5 C warming 1950 to present.”
You said: “Caused by what? Do you proof that your explanation is correct?”
Why did you ask me that question if you are not playing climateball? It has absolutely nothing to do with what we are talking about, but everything to do with the background arguments about climate change and its causes.
It’s possible you don’t realize you are playing climateball, but it is patently, transparently obvious that it is what you are doing.
https://climatedatablog.files.wordpress.com/2022/06/nino34-4.jpeg
See any 0.5C rise in the peak temperatures there?
https://www.cpc.ncep.noaa.gov/products/analysis_monitoring/ensostuff/detrend.nino34.ascii.txt
Link is to the monthly NINO3.4 SSTs that Michelle l’Hereux and the other researchers at NOAA rely on to monitor ENSO. These are the NINO3.4 region values published by the CPC, for which l’Hereux works.
You can get the undetrended values and the detrended anomalies at that link. I got 0.4C over 70 years looking at it again just now. Must have made an error before (0.5C).
Barry is now in contest with Bindidong for who can type out the most useless blabber.
Great example, Eben.
“An Associated Press statistical analysis of winter La Ninas show that they used to happen about 28% of the time from 1950 to 1999, but in the past 25 winters, they’ve been brewing nearly half the time. There’s a small chance that this effect could be random, but if the La Nina sticks around this winter, as forecast, that would push the trend over the statistically significant line, which is key in science, said L’Heureux. Her own analysis shows that La Nina-like conditions are occurring more often in the last 40 years. Other new studies are showing similar patterns”
Reported in lots of places.
“An Associated Press statistical analysis of winter La Ninas show that they used to happen about 28% of the time from 1950 to 1999, but in the past 25 winters, theyve been brewing nearly half the time.”
And that resulted in what? A cooling trend during those 25 y, RLH??
https://www.woodfortrees.org/plot/gistemp/from:1971/to:1996/mean:12/trend/plot/gistemp/from:1997/mean:12/trend
There is a song by Kraftwerk called, “We are the Robots.”
There are also idiots that post on here. Are you one?
I think I might be an idiot for trying every now and then to have a reasonable conversation with you, and then reacting to your endless disinterest in having a reasonable conversation.
Barry is the sort of person that the ‘lies, damned lies and statistics’ quote was made for.
I do think that it more than ironic that Blinny in his attempt to disprove what I said about single stations producing a skewed, bimodal daily histogram created an even more skewed, bimodal dataset himself.
https://drive.google.com/file/d/1JHRa6niBNs3hN7TzFpnpevrPQv-JtJcf/view
Let us help him out with how he got that graph/histogram.
Firstly he included all the active USCRN station (138) without considering that also includes Hawaii and Alaska. If he had restricted himself to just CONUS, things would be a lot clearer.
Then we have the adding of all of the 2.5 Latitude bands across the dataset without considering the numbers in each band (care to plot that histogram Blinny, now you have found out how to do them?).
Of course he could just verify what I claimed, that each individual station will produce a skewed, bimodal histogram but that is not Blinny’s way.
I also think that it ironic also that peak to peak (min to max) data has long been derided in audio and that industry well recognizes that RMS (which has no direct equivalent in climate AFAIK) is the way thing are generally compared.
After all voltage (temperature) into a resistive/capacitive/inductive load (thermal sensible/latent load) are broadly the same, aren’t they.
Superdeveloping La Nina in the newz for the masses
https://www.foxweather.com/weather-news/la-nina-likely-to-stubbornly-cling-to-life-into-2023-forecasters-think
It’s a record for this month in a double dip La Nina but not unprecedented. Apparently.
It’s also a record for global temperatures every month of 2022 so far.
Not all time records, no.
But for this stage in a double-dip la Nina period, we’ve never had a warmer January, February, March, April and May.
5 in a row!!!
I’m not sure you’ve noticed this, RLH. Isn’t it exciting, tho?
https://imgur.com/gallery/8AC3rda
tells what climate.gov ENSO blog has for the last 4 months.
“But for this stage in a double-dip la Nina period, weve never had a warmer January, February, March, April and May”
Wrong. As climate.gov shows.
https://www.climate.gov/media/14589
“An Associated Press statistical analysis of winter La Ninas show that they used to happen about 28% of the time from 1950 to 1999, but in the past 25 winters, theyve been brewing nearly half the time. Theres a small chance that this effect could be random, but if the La Nina sticks around this winter, as forecast, that would push the trend over the statistically significant line, which is key in science, said LHeureux. Her own analysis shows that La Nina-like conditions are occurring more often in the last 40 years. Other new studies are showing similar patterns”
Sure is interesting.
https://www.drroyspencer.com/2022/06/uah-global-temperature-update-for-may-2022-0-17-deg-c/#comment-1313548
You are so wrapped up in yourself you can’t see that I’m talking about global temperatures for the first 5 months of the year, despite saying so clearly the first 4 times.
Which are the warmest to have occurred during a double dip la Nina.
Unprecedented, are they not?
The tropics (30N to 30S) cover 50% of the globes area.
The NINO3.4 region covers less than 0.5% of the globe.
Christ you are dense. You are repeating values based on that region of the globe – the ENSO index per NOAA – and saying that they disprove global temps.
SMH
Question. Which do you think is likely to follow the ENSO more closely? The Tropics or the Global figures?
Question: what is the likelihood that you will have a conversation where you understand the points being made and respond directly to them?
What is the likelihood that you will answer questions without resorting to claims worded in a way to leave a different impression to what has actually occurred?
Thank you for admitting – very obliquely and couched in blame – that you misunderstood what I was saying.
Shall we now speak of the meaning of unprecedented?
The lines to the right hand edge say otherwise.
https://climatedatablog.files.wordpress.com/2022/06/uah.jpeg
https://climatedatablog.files.wordpress.com/2022/05/had5.jpeg
https://climatedatablog.files.wordpress.com/2022/05/giss.jpeg
“global temperatures for the first 5 months of the year”
that is.
For ESNO tropics are more useful than global data
https://climatedatablog.files.wordpress.com/2022/06/uah-tropics.jpeg
After half a dozen times saying the same thing you still don’t get it. Amazing.
https://www.drroyspencer.com/2022/06/uah-global-temperature-update-for-may-2022-0-17-deg-c/#comment-1313778
Barry is a warmista and proud of it. Don’t let things like data get in the way of his claims.
“The first 5 months of 2022 mark the warmest months of global temperature in the record”
Liar.
This is what your brain thinks I said, Richard.
“The first 5 months of 2022 mark the warmest months of global temperature in the record”
And this is what I actually said.
“The first 5 months of 2022 mark the warmest months of global temperature in the record to have occurred during the second leg of a double-dip la Nina.”
Now, I find it pretty incredible that you carefully cut out the last half of that sentence, and yet didn’t realize it was there.
I find it pretty incredible that I have said the same thing many times – to you – always including the qualifier, which is the point of the remark. And you just haven’t noticed it?
Are you a liar, Richard?
Or is your mind not capable of holding more than two phrases of a sentence together?
Or are you so wrapped up in your own agenda that your mind does not want to process what doesn’t suit it?
I’m leaning towards the 3rd option.
Liar in the sense of ‘Lies, damned lies and statistics’.
You try to leave the impression that temperatures are rising continuously whereas
https://climatedatablog.files.wordpress.com/2022/06/nino34-4.jpeg
shows that peak temperatures in Nino 3.4 area have not changed much in a century.
“You try to leave the impression that temperatures are rising continuously”
Regarding the NINO3.4 region? Nope. I’ve run the linear trends for the NINO3.4 region and while they are positive (based on your data) they are not statistically significant, which I’ve said quite clearly below. The trends are also extremely shallow, adding credence to the notion that there is no discernable (linear) trend for the NINO3.4 region.
But I think you mean my comments on global temperatures? No, I haven’t given that impression either.
Stop projecting stuff onto what I’m saying and just deal with what I’m saying. You’re not good at that and you’re good at not being direct. Please turn that around so we can have a better exchange.
barry…”Its also a record for global temperatures every month of 2022 so far”.
***
You mean, fudged global temperatures. Real global temperatures from sats are not showing such records.
I took the temps from UAH, Roy Spencer’s dataset. I didn’t realize you thought thy were fudged, Gordon.
barry…just looked at Roy’s graph above and I don’t see any record temperatures. They are well down from 2016.
Barry: Your ‘record first 5 months’ claim is incorrect.
I am becoming more amazed the longer you misunderstand what I wrote, Richard. Gordon just joined the club. I’ll quote myself and see if illumination comes.
“But for this stage in a double-dip la Nina period, we’ve never had a warmer January, February, March, April and May.”
followed closely by
“You are so wrapped up in yourself you cant see that I’m talking about global temperatures for the first 5 months of the year, despite saying so clearly the first 4 times.
Which are the warmest to have occurred during a double dip la Nina.
Unprecedented, are they not?
“But for this stage in a double-dip la Nina period, weve never had a warmer January, February, March, April and May”
I know what you said. You leave the impression that this is not unprecedented by using the rare double-dip La Nina to filter the results.
https://climatedatablog.files.wordpress.com/2022/06/nino34-4.jpeg
shows that despite your manipulations the peak El Nino temperatures have not changed in more than a century.
Why are you talking about el Ninos?
Of course I’m looking at temps during a double dip la Nina. That’s because you’ve been focussed on the topic with your cry of ‘unprecedented’.
Just as the May la Nina anomaly was not the lowest la Nina anomaly ever, nor the lowest May anomaly during a la Nina, but it IS the lowest May anomaly during a double dip la Nina….
May global temperature was not the warmest ever, nor thee warmest during a la Nina, but it IS the warmest May during a double dip la Nina.
Which makes both of them unprecedented, right?
It’s taken two days to get you to see the point.
Apparently it’s fine for you to exclaim that for this time in the evolution of a double dip la Nina we have an ‘unprecedented’ anomaly.
When others criticise that, you requalify that it has never happened at this point in the evolution of a double dip la Nina
Why is it then illegitimate for me to exclaim that for this time in the evolution of a double dip la Nina we have an ‘unprecedented’ anomaly – namely global temps.
When you criticise that, I requalify that it has never happened at this point in the evolution of a double dip la Nina.
Both points are not th coldest/warmest ever, but they are for the particular NSO conditions (ied/d la Nina).
It’s a pain in the arse to make a clear analogy only to have you completely not get it for ages.
I’m saying what is the value of the term ‘unprecedented’, when I can whip out some more unprecedenteds based on the same qualifying conditions you are using?
If you can point to any global temp anomalies during during th second leg of a double dip la Nina that were warmer than the last 5 months, then do so. Otherwise you will have to concede that they are unprecedented.
When you’ve done that, I’ll be happy to chat about how unprecedented the May la Nina anomaly is, secure that we have some context around the usage of that language.
I said quite clearly that the various graphs on the climate.gov ENSO blog show unprecedented data for the last 2 months. Do you disagree with that observation?
https://imgur.com/gallery/8AC3rda
Any time you have to qualify your position in statistics you deserve the ‘lies, damned lies and statistics’ quote.
When it was pointed out that the May anomaly for la Nina was not a record, that there were other months with lower la Nina values, you qualified that this was the lowest May anomaly during a double dip la Nina, and therefore unprecedented for the time of year.
When later it was pointed out that there was an even colder May la Nina value during May (1950), you affirmed your qualification that these was the coldest la Nina values for the time of year during a double dip la Nina.
And now you are saying:
“Any time you have to qualify your position in statistics you deserve the ‘lies, damned lies and statistics quote.”
You don’t seem to realize that I have used exactly the same qualifying criteria for my announcement of ‘unprecedented’ global temps. That is, during a double dip la Nina, for this time of year. Same. Exact. Qualifying. Criteria.
But we both have finally come to agreement.
This sort of shimmying to claim ‘unprecedented’ is only after heavy qualification, and is thus in the lies, damned lies and statistics category.
Which is why I copied your shimmying qualifiers. That’s the point I’ve been trying to make. We’ve finally got there together, Richard!
Global temperatures are very different to Tropical ones which is much more relevant to ENSO.
But irrelevant to my point, Richard.
But your ‘warmest ever 5 months’ claim is factually incorrect.
This is the real first few months of the year data since 2018
https://imgur.com/a/WRFSNPv
That’s not what I said. Read again.
And
Jesus H C on a crutch, how could you not understand what I wrote? It’s not complicated.
‘Lies, damned lies and statistics’ was created for people like you.
Do you realize you’ve been objecting to something you mistakenly imagined I’ve said this whole time? You still haven’t got it right. Incredible.
I think it’s dawning on you that you misunderstood, but you can’t allow yourself to lose that much face by admitting it.
I know precisely what you said.
The ‘lies, damned lies and statistics’ saying is to show that you are being disingenuous with what you quote.
Pleas clearly state what I’ve been saying. Just to assure me you understood.
Because there is no error in what I’ve reported. And I reported it based on the same qualifying conditions you did for the unprecedented May la Nina values. The whole point was to analogise.
Are you saying that global temps are unaffected by ENSO?
30N to 30S is 50% of the Earth’s surface.
This the real first few months of the year data since 2018
https://imgur.com/a/WRFSNPv
So you are saying that global temps are unaffected by ENSO?
The AMO has a greater weight in my opinion. I covers a larger area for a start.
Are you saying that any trend in increased la Ninas will not necessarily impact global temperatures, then? That AMO will swamp such a signal?
I said that the AMO covers a larger area (0 to 70N). The Tropics (30N to 30S) cover 50 % in the globes surface (of which ENSO is a much smaller subset). Perhaps the answer is a blend of both.
https://climatedatablog.files.wordpress.com/2022/05/amo-trended.jpeg
https://climatedatablog.files.wordpress.com/2022/06/uah-tropics.jpeg
You reckon PDO is a good proxy for long-term ENSO changes?
I think it is still not clear whether N Atlantic temps are leading or lagging (and thus aliasing) global temperatures.
Dinglebarry is the same piece of scum as Bindidong , always trying to twist the subject into argument nobody argued about,
So what even if this La Nina didn’t break any record (yet), it is still very big one and the whole point is your fuckwit duo Bin&berry forecasting could not see it and argued against it when me and RLH were predicting it.
The biggest problem is not that La Nina is here but that the models predicted more and more El Nino.
I think that that notion is journalistic sensationalism. The last few IPCC reports have made it clear there is no consensus on the future of ENSO patterns. So the journalist (AP) has created a controversy where there is none. Perhaps a result of who they spoke to.
AR4 Regional Projections:
“The El Niño-Southern Oscillation significantly influences rainfall, drought and tropical cyclone behaviour in the region and it is uncertain how ENSO will change in the future.”
“Atmosphere-Ocean General Circulation Models exhibit large model-to-model differences in ENSO and NAO/Arctic Oscillation (AO) responses to climate changes.”
AR5 Technical Summary:
“There is high confidence that the El Niño-Southern Oscillation (ENSO) will remain the dominant mode of natural climate variability in the 21st century with global influences in the 21st century, and that regional rainfall variability it induces likely intensifies. Natural variations of the amplitude and spatial pattern of ENSO are so large that confidence in any projected change for the 21st century remains low.”
AR6 Technical Summary:
“It is virtually certain that the El Niño–Southern Oscillation (ENSO) will remain the dominant mode of interannual variability in a warmer world. There is no consensus from models for a systematic change in amplitude of ENSO sea surface temperature (SST) variability over the 21st century in any of the SSP scenarios assessed (medium confidence).”
The IPCC on future ENSO does not jive with the reporting in the article. There is not a research community expectation that el Ninos will dominate into the future.
barry…”It is virtually certain that the El NioSouthern Oscillation (ENSO) will remain the dominant mode of interannual variability in a warmer world”.
***
Ironically, the IPCC idiot machine cannot bring themselves to admit the problem with warming is ocean cycles like ENSO. Their mandate is to find evidence of anthropogenic warming and ocean ccyles are a major inconvenience.
When the IPCC idiots claim ‘it’s virtually certain’, they are offering nothing more than an opinionated guess. They are truly legends, in their own minds.
Jez, Gordon, it’s a pretty safe bet that ENSO will continue to be, as it has, the lading cause of interannual global temperature variability. The rest of your remarks are the usual story-telling.
Barry, as usual, does not consider anything not following the IPCC and the models as being anything other than delusion. Later this year will shall see won’t we.
Oh do please tell us what you think is the likeliest candidate is for being the leading cause of interannual global temperature variability into the future. If not ENSO, what could it be, Richard? Am I overlooking a viable contender?
NOAA.
https://climatedatablog.files.wordpress.com/2022/06/nino34-4.jpeg
“the leading cause of interannual global temperature variability into the future”
AMO.
Do you know what ‘interannual’ means?
It means year to year.
And you are saying that AMO will stop being the (possible) cause of multidecadal variability in global temps, and will become the primary driver for year to year variability.
What makes you think AMO will start to affect variability on a year to year basis like ENSO currently does?
Do you think AMO will stop oscillating on decadal time scales and start oscillating on yearly time scales?
I have never considered that possibility, and can think of no reason why that change should occur. Why do you think this oscillation might speed up so drastically?
(Assuming of course that AMO even affects global temps on any time scale)
Interannual differences that show a 60-70 year cycle. Idiot.
Detrended
https://climatedatablog.files.wordpress.com/2022/05/amo.jpeg
Trended
https://climatedatablog.files.wordpress.com/2022/05/amo-trended.jpeg
“Interannual differences that show a 60-70 year cycle. Idiot.”
So you are saying that ENSO is NOT the leading cause of INTERANNUAL variance in global temperatures? That AMO is?
You would be pretty much alone in the world with that view.
Consequently, I am not troubled that the IPCC projects ENSO to continue to be the leading cause of interannual global temperature variance over the 21st century. I think that’s is a VERY safe bet.
But I reckon you didn’t notice the word “interannual” when you leapt to criticise, and are now calling me names to cover your blindness.
“I think that that notion is journalistic sensationalism”
Are you accusing L’Heureux of sensationalism?
“Are you accusing LHeureux of sensationalism?”
Are you accusing me of accusing her of sensationalism?
“Are you accusing me of accusing her of sensationalism?”
Yup.
So you’re saying that scientists are responsible for how journalists write their articles?
Do you see her using the climate.gov ENSO blog to put the record ‘straight’?
I don’t think she’s posted recently, but please link me to where she says that the international ENSO community have been expecting el Ninos to dominate into the future.
If you are confused, this IS the point that I was saying is sensationalism, or just poor journalism.
At least 7 leading scientists were quoted in that AP article, are they all wrong?
Did any of them say anything abut the international consensus of the future of ENSO? Pleas quote where they did, because I’m pretty sure that was journalistic commentary attributed to no scientist.
Here’s what I reckon happened. One of the scientists mentioned something about models projecting more el Ninos, and the journalist ran with that as the universal view.
But we don’t know because that information is not in the article.
That’s why I went to the IPCC to check, because that is the international view. It was also my recollection, that there was not a consensus on future ENSO states. There is a discrepancy of views here. Wacha gonna do?
“There is not a research community expectation that el Ninos will dominate into the future”
But there is one that thinks that La Nina will dominate instead.
That’s not what the article says. It’s fall of maybes.
‘ “At this point we just dont know,” L’Heureux said. ‘
Why do you push an agenda all the time?
You can come away with that conclusion if you like. Anyone else reading that story thinks that the models are not all they are cracked to be be and that scientists are coming to terms with it.
https://imgur.com/a/WRFSNPv
Which research community thinks that la Nina will dominate into the future, RLH? Was it the one where Hereux said, “We don’t know,” or were you thinking of a different research community?
Please help me interpret your comment.
“Which research community thinks that la Nina will dominate into the future”
Well I don’t know if you consider climate.gov ENSO blog as a research community.
Is this the blog that l’Hereux participates in, the researcher who said, “We don’t know,” regarding the continuance of la Ninas?
Perhaps you could quote something from the article or ENSO blog substantiating that a research community thinks la Ninas will dominate into the future. You know, an actual quote?
Perhaps you could just accept that a range of scientific sources were approached for the article and all thought that La Nina was becoming more frequent. Or is that you just don’t want to accept that?
In case you have forgotten at least 7 leading scientists were quoted in that AP article, are they all wrong?
“…a range of scientific sources were approached for the article and all thought that La Nina was becoming more frequent.”
Now that is accurate.
Well done.
It’s worth noting that not all the scientists mentioned in the article study ENSO.
Do you think I care whether we get more la Ninas or not? You seem to.
“a range of scientific sources were approached for the article and all thought that La Nina was becoming more frequent”
Tsk, there’s still a little hedge to what you want to be true there.
“was becoming more frequent”
One scientist said they expected continued la Nina dominance. The rest said there have been more la Ninas lately, but the jury is out on what this means for the future.
“The last few IPCC reports have made it clear there is no consensus on the future of ENSO patterns”
Looks like the IPCC is behind the times then.
“Her own analysis shows that La Nina-like conditions are occurring more often in the last 40 years. Other new studies are showing similar patterns”
Did you forget its not statistically significant?
And as the last IPCC report was completed last year, as you know, you are once again having a dig just to have a dig. You can’t help punching, can you, climateballster?
Did you forget its not YET statistically significant? As the article says.
I have told you before. I don’t play climateball.
https://imgur.com/a/WRFSNPv
2018, 2019, 2020, 2021
Are not the second leg of a double dip la Nina years.
“Did you forget its not YET statistically significant?”
No, I remembered that. I’m glad to see that you have too.
Did you see the graphs for NOAA Nino 3.4 anomalies I posted earlier?
https://climatedatablog.files.wordpress.com/2022/06/nino34-4.jpeg
See any significant upwards peak trend in that?
Let’s pick up this conversation here:
https://www.drroyspencer.com/2022/06/uah-global-temperature-update-for-may-2022-0-17-deg-c/#comment-1315069
Or here.
https://www.drroyspencer.com/2022/06/uah-global-temperature-update-for-may-2022-0-17-deg-c/#comment-1315555
The Financial Times reports that energy firm Centrica “has submitted a formal application to the North Sea energy regulator to reopen Rough, Britain’s biggest natural gas storage site, as ministers race to secure more domestic energy supplies in time for winter.” It continues: “The British energy company wants to convert the site 18 miles off the Yorkshire coast to hydrogen at a cost of 2bn Euros but, for now, natural gas could be reinjected in a matter of months if the license application is successful.”
Also this week, the UK government “got together with Shell…to talk up North Sea oil and gas,” reports Bloomberg, in what it calls “the latest sign of the country’s pivot back toward domestic fossil fuels since Russia’s invasion of Ukraine.” It reports: “Comments by Shell chief executive officer Ben van Beurden and UK business secretary Kwasi Kwarteng underscore the deep shift in energy policy. A government that was focused on renewables in the run-up to last year’s COP26 climate talks is now working to boost investment in oil and gas fields.”
Reality always wins.
Drill, baby, drill.
The Russians are just mopping up in the Donbas region, natural gas and oil should be back online soon. The Ukrainians are out of ammo and the West will be lined up with cap in hand asking for oil. Such is hypocrisy.
The rebels in western Ukraine are bent on making a serious mistake by executing 2 Brits and a Moroccan who fought with the Azov battalion in Mariupol. If they do anything that stupid and evil it will undo anything good they have achieved for themselves, exposing themselves as serious idiots. It could also escalate this war to a new level.
I have little sympathy for anyone who willingly fought for a known neo-Nazi battalion. No German soldiers belonging to Nazi divisions were executed in WW II for simply fighting. There are rules of engagement that need to be followed and these rebels need to be straightened out.
Maybe they are bluffing, hoping for a prisoner exchange. Let’s hope so. Such a bluff would be seriously cruel to the men under a death sentence. We are dealing with idiots on both sides of the Ukrainian civil war, as claimed by Amnesty International, and it is now being exposed in this equally ugly war.
Gordon Robertson
I know you are not very intelligent and fall for any crackpot tells you as long as it goes against what the majority accepts.
But even you might start seeing how duped you are. Probably not, you will still believe Putin’s endless lies. He is one evil human and complete liar. I am hoping that Russia is soundly defeated and the evil liar Putin is removed from power and disgraced. Why you support this evil person makes no sense to me. But you think Lanka is a good guy, he is in the same evil lying sphere as Putin.
Here read this and see how duped you are. Maybe you can change but that is highly unlikely. You are attracted to evil people that lie. Not sure why only you can understand these things about yourself.
https://www.yahoo.com/news/putin-undermined-own-rationale-invading-093128419.html
The southern hemispheres 2022 ski season the first that looks like it might be close to normal since 2019 has got underway with some huge snowfalls.
Excitement levels are particularly high in Australia where most ski areas opened a week earlier the planned, last weekend after a big pre-season snowfall last week. The snow has now started falling again and several areas have now had more than a metre of snowfall in the past week, making it now one of the snowiest weeks of all time in the country.
Do you think that the models predicted this?
“There has been heavy snowfall in the Andes and other mountainous areas of South America over the past week, and Cerro Catedral reports theyve had a 1.5 metre (five foot) accumulation. This is unprecedented for April which is still early autumn in the southern hemisphere”
ren…”Excitement levels are particularly high in Australia where most ski areas …”
***
That’s Oz for ski hills. They have no mountains, just Ayers rock, which they seem content to ski down without snow.
Just kidding Barry. ☺ ☺ I think Bob Droege is from OZ as well but he denies it.
I once saw a snowboarder carve a tiny hillock in Bondi Beach after an intense hailstorm blanketed Eastern Sydney. Three guys in their 30s waited for a bus to pass and launched hail-packed ‘snowballs’ at it, like teenagers. A fun day.
Are you saying that large snowfalls in both South America and Australia are not happening?
Appreciate the attempt at humour, RLH.
Don’t appreciate you trying to confuse things.
https://imgur.com/a/WRFSNPv
I believe we were talking about skiing. Who is being confusing?
So you are not saying that the skiing season across the Southern Hemisphere is going better (or worse) than expected.
“So you are not saying…”
I am indeed saying that I saw a snowboarder carve a hillock on Bondi Beach after a hailstorm.
The three guys who launched the snowballs actually smirked like teenagers when they hit the bus.
I enjoyed Gordon’s friendly jab. It made a change from the usual stoush, and that’s good for anyone. It lightened me up to enough to share the remembrance of hailstorms past.
I don’t think we need to joust in every thread. And no, don’t take this as a concession to your off-topic point in the eternal climateball you cant help playing. This subthread was not about proving any points. It was fun. Try to get into the spirit of that from time to time, Richard.
If you labour your gate-crashing point, you will be made fun of. Fair warning. I may even throw a snowball at you.
1). I don’t play climateball.
2). You don’t dispute that there have been large snowfalls in both Southern and Northern Hemispheres and a La Nina but you seek to imply that temperatures are getting warmer regardless.
I have paid a whole car full of clowns to roll a snowball down a mountain at you.
During previous glaciations, CO2 change followed temperature change. Since about 1850 CO2 has been increasing with hardly any temperature change https://drive.google.com/file/d/1C1zOIE0po0IzFrjCW4eajDVTjEgCErS1/view?usp=sharing. Water vapor has been increasing at 1.44% per decade and can explain all of the climate change attributable to humanity. The WV increase is faster than possible from just temperature increase as shown at Sect 7 of https://watervaporandwarming.blogspot.com which rules out that CO2 has caused any warming.
dan…”Water vapor has been increasing at 1.44% per decade and can explain all of the climate change attributable to humanity”.
***
I paid my 5 pounds at the door and I am looking for a good argument. ☺ ☺ ća;
Nothing against you personally, Dan, I enjoy your posts in general. However, WV is still a trace gas and could not possibly explain 1C warming since 1850. Apply the Ideal Gas Law to the atmosphere. WV makes up only 0.3% of the entire troposphere and can supply no more than about 0.3C per 1C rise in temperature of the troposphere.
We don’t even know how much the entire troposphere has warmed since 1850 since our measuring instruments are found slightly above the surface in the rlh zone. Perhaps Richard will be good enough to supply the name.
We already have the explanation for the warming, recovery from the Little Ice Age as well as natural variability related to ocean oscillations like ENSO, PDO, AMO, etc.
WV is active mainly in the Tropics where water is heated most by solar energy. As Lindzen explained, the heated air, of which WV may be 4% in the Tropics, rises high into the atmosphere and is moved poleward north and south. At the same time (not Lindzen) warmer water from the Tropics is moved north and south. WV likely has little or no effect in the more northerly latitudes.
We are witnessing the effect of La Ninas at the moment. It’s not WV that is the concern it’s the way LNs disturb the jet stream, producing all kinds of weather havoc, like increased precipitation, heat domes, and droughts.
There is simply no correlation between WV and warming that can be proved scientifically.
ps. don’t know why the ća; did not come through.
Oh, I see it’s U+0263A unicode and ☺ HTML.
The code is ***☺*** remove asterisks
oops…&***#9786; remove asterisks
You could also try
https://mothereff.in/html-entities
rlh…you mean like…
Foo © bar 𝌆 baz ☃ qux
SBL (Surface Boundary Layer). The contents of which changes quite dramatically in any 24 hour period.
–Nothing against you personally, Dan, I enjoy your posts in general. However, WV is still a trace gas and could not possibly explain 1C warming since 1850.–
A ocean warming from say, 3.4 C to 3.5 would explain 1 C warming.
A .1 C rise in average ocean temperature, would also cause more global water vapor.
The question is what caused the cooling of Little Ice Age. Or same question, what caused the ocean to cool by .1 C
Which centuries did the ocean cool by .1 C
{the ocean can not cool or warm by .1 C quickly- it would require at least many decades, but could have cooled over several centuries]
It is claimed that over 90% of all global warming warmed the Ocean and it’s claim .05 C of ocean warming occurred with 50 years.
Gor, I’ll start by nit picking my statement. The 1.44% per decade is simply the measurements by NASA/RSS; Jan 1988 to Dec 2021. I say CAN explain because I did it in Sect 17 to 19 of http://globalclimatedrivers2.blogspot.com . I did not say DO explain because there might be something that no one has discovered yet. I also say ‘attributable to humanity’. There are the two natural factors that I consider and probably other natural factors, including whatever caused the LIA and if it’s undoing would be contributing to the recovery, that have contributed to climate change since before humans were even noticed. The part attributable to humanity that results is not more than 0.7 C° since 1895 (Table 1 in the link).
The object of all this is to find out what humanity has done to contribute to climate change and if it actually presents a threat, what might be done to mitigate the threat. First, remember that 71% of the planet is covered by oceans and humans have had negligible direct effect there or near the poles, land above about 3 km or unirrigated deserts. Volcanoes are usually small and transient, an exception being Tambora in 1815 with a VEI of 7.
The main contenders for human influence are water vapor increase and CO2 increase. The dry lapse rate is fixed at about 9.8 K/km and the moist adiabatic lapse rate stretches that out to an average of about 6 K/km. At ground level, WV molecules average about 10,000 ppmv or about 1%. They outnumber CO2 molecules about 24 to 1. I don’t see how Ideal Gas Laws add anything to understanding climate change.
As a pragmatic Mechanical Engineer my interest in the upper atmosphere is limited to how it might affect the climate down where the people are. Whatever caused the LIA might still be going on and the slight warming that has been measured and reported might be in spite of it. Oscillations are just that; oscillations. Over a full period, their net effect is zilch.
The water vapor (TPW) measurements are average for non-cloud covered oceans between latitudes 60N and 60S. They claim accuracy of 1 W/m^2 which is about 3% and call it average global. I consider the average rate of change as being most important with the levels themselves of lessor importance. I developed an algorithm to calculate what the WV increase would be as a result of just temperature increase (Sect 8). Comparison shows that measured WV has been increasing substantially faster than possible from just planet warming. This raised the question of where does the extra WV come from. Section 9 is an analysis which shows the extra WV to be about 90% from increased irrigation. Later I discovered that my finding corroborated an earlier assessment. Irrigation has been increasing since way before the industrial revolution.
Remember that evaporation is exponential wrt the temperature of the water. Warm water exists in the tropics and also in shallow irrigation water in hot, arid irrigated areas which cover more than four times the area of France.
Temperature increases from WV increase and CO2 increase are in parallel, not series. The increase from WV is greater which renders the smaller increase that would have occurred from CO2 irrelevant. If it was an auction, the WV increase outbids the CO2 increase. This shows that the war on fossil fuels will have no effect on climate.
Oops, accuracy of 1W/m^2 should be accuracy of 1kg/m^2.
I have made a correlation which shows the relation between WV increase and temperature increase. The WV increase wrt time and the temperature increase wrt time exist so a scatter-gram of temperature vs WV was made; shown at: https://drive.google.com/file/d/1pJEMxS6fES5TDinm5L8hWD2rBUsyrg4O/view?usp=sharing Solve the regression equations for each simultaneously to eliminate time.
barry…”I have no idea what a HQLP pass filter is…”
***
I know what it means in electronic circuits re filters and bandpass circuitry. Don’t know how it is used in statistics. Maybe Richard could offer an explanation.
HQLP means high Q low pass, which doesn’t make much sense to me re electronic filters. However, even though low pass and high pass filters are shown with a flat, mecca-like feature with a region sloping down ward, in reality, all filter circuits in electrons have ‘pole’ frequencies, a frequency at which the filter responds best. At that pole frequency there can be a brief amplification producing a bandpass-like response which could be interpreted as having a Q value.
It’s discussed here for a typical RLC filter…
https://electronics.stackexchange.com/questions/221887/does-q-factor-matter-for-low-pass-and-high-pass-filters
The Q of a filter describes how sharply its response acts to attenuate undesired frequencies. For example, if I have a range of frequencies around 1 kilohertz and I want to control which frequencies pass through an amplifier below and above 1 khz, I can control that by varying the Q of a bandpass filter.
Bandpass, as opposed to high pass and low pass means the filter will pass frequencies in a band around a centre frequency. High pass means the filter will pass frequencies above that frequency and attentuate those below it. Low pass is the opposite, it passes frequencies below the frequency and attentuates those above it.
With HP and LP the centre frequency is usually called a cutoff frequency.
Anyway, with a bandpass filter, the faster it rolls off the higher the Q. If the BP passes only a few frequencies either side of the centre frequency it has a high Q. If it passes a broad range of frequencies either side of the centre frequency it has a low Q.
Q comes from quality factor. I guess they presumed at one time that a higher Q filter had a higher quality mainly because greater precision was required in its construction.
Today, with the application of Fourier analysis in electronics, computers can apply Fourier transforms to synthesize filters. A signal is then digitized to a set of binary codes, which can be applied to an algorithm and manipulated as if the codes were an actual physical signal comprised of voltages.
How that works in statistics is not clear to me and thus far I have been too lazy to figure it out.
“HQLP means high Q low pass”
Not quite
HQLP means High Quality Low pass, such as a gaussian CTRM or an S-G low pass filter.
rlh…”HQLP means High Quality Low pass…”
***
I did address that in my novella. Q comes from ‘quality’ and it is a reference in electronics to the construction of an inductor, in particular, used in a filter.
There’s a really good video here by a guy who knows what he is talking about. All you need to know, re the equation presented, is that a j-value refers to an inductive or capacitive value which is frequency dependent and will change the phase of a signal, depending on the frequency.
He ends up with Q/j and explains the meaning clearly.
Don’t know if that applies in statistics. I have a slightly better idea now of what is going on in statistics re annual or regular changes in a value. Also, I wonder if it is related to Roy’s running average on his graph.
In the video, the guy states that Q applies only to 2nd order filters. A first order filter will have only an RC or RL component set and low pass and high pass filters will roll off at 3 dB/octave. By running the signal through two cascaded filters, the roll off increases to 6 dB/octave.
Filters can also use amplifiers and that introduces pole frequencies, that is, frequencies at which the amplifier, responds best, which can be significantly higher than the average signal amplification. No amplifier responds to frequencies with an even amplification. Realistic responses look like a camel’s back.
I am thinking, that when this is applied in statistics, a person using the theory needs to be very aware of the limitations of applying it to raw data.
sorry, forgot the link…
https://www.youtube.com/watch?v=gsSXd7W-XXo&ab_channel=AnalogDevices%2CInc.
High Q refers to inductance, not quality.
“I wonder if it is related to Roys running average on his graph”
Simple running means are not used by anyone other than climate scientists as they are a very poor quality of low pass filter.
“Simple running means are not used by anyone other than climate scientists”
Bullshit, professor. They are used in a variety of disciplines from demographics to economy and investment. And even more broadly for creating simple graphs, like the one at the top of this blog, in a host of fields. As a visual aid, such as above, their use is widespread. Often the running mean is presented graphically without the underlying data accompanying (unlike the graph above).
Running mean or moving average
https://en.wikipedia.org/wiki/Moving_average
is a type of of finite impulse response filter.
“Simple moving averages are easy to construct, but prone to distortion: they tend to ‘bark twice'”.
This is well understood in all disciplines except for Barry it seems. Those who are interested in low distortion data do not use them.
S-G filter is used in a lot of other disciplines
https://en.wikipedia.org/wiki/Savitzky%E2%80%93Golay_filter
and is considered much more accurate than SMA.
LOWESS is used in statistics and is very similar to S-G (it uses a similar algorithm).
“SG filters have been extensively used in such research areas as spectroscopy (Li et al., 2015, Turton, 1992), voltammetry (Jakubowska & Kubiak, 2004) and biomedical signal processing (Acharya et al., 2016, Goel et al., 2016, Hargittai, 2005), among many others”
“The idea behind SG filtering was recently extended, in a generalized form, to identification of time-varying systems (Niedźwiecki & Ciołek, 2019b)….The resulting identification procedure has very good parameter tracking capabilities, favorably comparing with the state-of-the art multi-wavelet estimation scheme proposed in Wei, Liu, and Billings (2002)….Additionally, it is computationally simple and numerically robust”
“disciplines from demographics to economy and investment”
All of which are SO related to climate. Not.
While you were talking to yourself you lost the point.
“Simple running means are not used by anyone other than climate scientists”
Which was bullshit when you said it and remains bullshit.
And yes, professor, other disciplines also use other statistical models, and so does the climate community.
If you weren’t so keen to rubbish climate science in your eternal game of climatball, you wouldn’t say such easily debunked generalisations. I mean, all I have to do is come up with a single counter-example and your announcement evaporates.
https://www.researchgate.net/figure/Five-year-running-means-indicating-medium-term-trends-for-the-number-of-fatalities-per_fig5_226792669
“Which was bullshit when you said it and remains bullshit”
I forgot to add ‘high quality versa low quality’ to my comment about HQLP and SRM.
You need to look up what Vaughn Pratt said about just that subject (he was comparing SRM v CRTM).
Is this simple 5-year running mean from a published study in a non-climate discipline a “high quality” running mean?
https://www.researchgate.net/figure/Five-year-running-means-indicating-medium-term-trends-for-the-number-of-fatalities-per_fig5_226792669
It’s no different except in n years from Roy’s graph above, and from the occasional infernal climate scientist.
If you make mindless absolutisms you’ll come a cropper with a single piece of evidence. As if anyone believes you have actually sifted through reams of statistical analysis in dozens of scientific disciplines and now have the authority to proclaim that no other discipline in the world uses simple running means.
You’d have to be stupid to think we are that stupid.
Statistics use LOWESS which is the same as S-G which other disciplines use.
I’m actually familiar with the concept, Gordon, but not familiar enough that the acronym automatically resolved for me.
Although I have still not grasped the concept of weighting functions in UAH satellite AMSU instrumentation, they appear to be similar to filters responses. They seem to show the response of the AMSU units to microwave radiation from oxygen molecules at various altitudes.
There has to be a human element in that, however, since an instrument could not tell which altitude at which an O2 molecule is located. The channel microwave reception has to be related, by humans, to a certain altitude, hence a temperature.
There is a set of weighting functions at this link which resemble bandpass filter functions curves.
https://tropic.ssec.wisc.edu/real-time/amsu/explanation.html
“Simply put, the weighting function for AMSU-A Channel 7 (54.94 GHz) has a maximum amplitude (i.e., contribution to upwelling microwave radiation sensed by the AMSU-A instrument) at approximately 250 hPa (~12km above the earth’s surface) whereas Channel 5 (53.6 GHz) has a maximum weighting function at approximately 550 hPa (~5km above the earth’s surface)”.
This suggests to me that each channel, represented by a weighting function, responds best at the stated centre frequency for the bandpass curve. However, it can also receive frequencies from other altitudes at a lesser amplitude. Channel 5, for example, has a leg of its bandpass extending to the surface, and should receive microwave radiation from near the surface.
Roy pointed out they do not use frequencies from right at surface due to other issues.
Where these weighting function overlap, or with any overlapping bandpass functions, the frequency amplitudes can be added. I don’t know if they do that with the AMSU unit channels, however.
“they appear to be similar to filters responses”
Try thinking of a gaussian band pass that is tilted due to air pressure/temperature vertically.
Gordo wrote:
You got that right.
Message coming to your from E. Swanson who thinks the weighting functions in UAH are wrong because it underestimates Arctic warming during the summer time when the reanalysis services show a cooling trend in the arctic summer. The warming occurs when the ice refreezes and snow on top of the ice slows transmission of heat to space. And of course when summer comes and the sun begins to shine the first thing to go is the snow.
Hunter wrote:
All sources use a function based on lapse rates from the surface to TOA.
Some use it from just above the surface to predict what is happening higher up in the atmosphere (and average out the SBL they are sitting in for fluctuations during any 24 hour period). Others do it from higher up in the atmosphere looking downwards.
Both are likely to suffer from similar inaccuracies.
I gave you the link to that last month Swanson.
https://www.drroyspencer.com/2022/05/uah-global-temperature-update-for-april-2022-0-26-deg-c/#comment-1279608
There has been some excitement that the current double-dip la Nina has shown SST values in the NINO3.4 region that are lower than any other for the particular time of year (around May). There have been plenty of lower la Nina values, and even a lower one in May of another year (1950), but not in May during the second leg of a double-dip la Nina.
It's unprecedented!
But check this out!
UAH v6 global temperature anomalies 2022
Jan 0.03
Feb 0.00
Mar 0.15
Apr 0.26
May 0.17
The first 5 months of 2022 mark the warmest months of global temperature in the record to have occurred during the second leg of a double-dip la Nina.
5 consecutive, record-breaking, unprecedented global temperatures, being not the warmest ever, nor all the warmest during a la Nina, but the warmest during the second leg of a double dip la Nina!
Does it sound like I'm straining to create excitement?
Yep, this is all sarcasm. It's also all true.
Unprecedented, baby!
Warmest months of global temperature in the record does not infer unprecedented global temperatures. The record is far too short to make any such claim.
I see that you did not appreciate my sarcasm. Nevertheless, if you would kindly make the same comment to RLH, who inspired my post, I would be ever so grateful.
I’m not sure where the discussion started because the thread appears to start here, but the statement applies for anyone making claims of ‘unprecedented’ given the shortness of the record, particularly when we are talking about ‘unprecedented’ by 1/100ths of a degree.
That kind of claim is just one reason why I think the whole AGW climate change claptrap is complete nonsense.
By that logic, Richard convinced everyone here that AGW was real and carries enough risks for us to do something about it.
Willard is an idiot.
Lies by Barry will make it that people do not believe warmistas.
This is the real first few months of the year data since 2018
https://imgur.com/a/WRFSNPv
751/2018
That was from ‘lies, damned lies and statistics’.
“Lies by Barry”
Are you saying that the first 5 months of 2022 are not the warmest global temps to occur during a double dip la Nina?
The Nino data does not seem to support your conclusions.
https://www.drroyspencer.com/2022/06/uah-global-temperature-update-for-may-2022-0-17-deg-c/#comment-1314771
Such a massive rise in peak Nino 3.4 temperatures between 1876 and 2016. Not.
….1878 and 2016….
You still don’t understand what I’ve said.
You’re still objecting to something else you imagine I said.
It’s fascinating. Your mind simply won’t countenance what I actually said, and you’re making up a different claim to object to. It has to be because of whatever agenda drives you. I don’t think you are being deliberately slippery.
“The first 5 months of 2022 mark the warmest months of global temperature in the record to have occurred during the second leg of a double-dip la Nina.”
If you focus on the bolded parts, does that bring illumination to you?
Does ‘lies, damned lies and statistics, mean anything to you?
Does lies, damned lies and statistics’ mean anything to you?
Yes, it means that you are lobbing pejorative slogans at me in an effort to ‘win’ after realizing you didn’t understand what I said for 2 days.
Does it look exactly like the La Nina you didn’t see coming ???
Are you saying I predicted this la Nina wouldn’t come?
Did you?
Are you saying you’re interested in whether I predicted this la Nina wouldn’t come?
No, I didn’t predict this la Nina wouldn’t come. I don’t forecast ENSO events. I’m content to leave that to the various expert groups.
Eben likes to pretend that I predict ENSO events. He’s angry because I called him a fuckwit ages ago, and that’s how he gets his revenge.
“I don’t forecast ENSO events”
Yet you are prepared to predict future events based on past history, especially where this concerns OLS trends.
“Yet you are prepared to predict future events based on past history, especially where this concerns OLS trends.”
I’m afraid that is complete bullshit, Richard. This is an idea that you have in your head that you project onto people. It’s part of the climateball syndrome.
You are welcome to go hunt for any post of mine that predicts the future based on trend analysis of the past. I hope you do, because it will tie you up for a very long time.
But you could save yourself the determined effort to prove the “alarmist” wrong. You may remember that I said some months ago that I expect future long-term warming based on the physics of greenhouse gases, not on any trend analysis.
Have you forgotten you were there for those comments?
You remember something different? Fine. You really should go look for a quote of mine to skewer me with, and expose me for the trend-loving alarmist you believe me to be.
Question: Do you quote OLS trends? If so do you therefore imply that they have relevance over anything other than the time period they cover? Remember that OLS trends are not predictors of either the past or the future.
“Do you quote OLS trends?”
Yes, quite regularly.
“If so do you therefore imply that they have relevance over anything other than the time period they cover?”
No. It’s a look back at what has happened.
I want to crack a bottle of champagne because you asked me a direct question instead of leading the witness.
In 2017:
barry: “The trends we’re talking about tell us little about what will happen, only what has happened.”
Hopefully this put paid to your mischaracterisation of what I think about observed trends.
“The first 5 months of 2022 mark the warmest months of global temperature in the record”
As usual Barry likes to confuse things. Here he quotes GLOBAL figures against ENSO data.
ENSO data shows that this period in a double dip La Nina is a record (unprecedented) for this period in the cycle.
Fact.
“2021 1 263.302
2021 2 263.463
2021 3 263.423
2021 4 263.795
2021 5 264.530”
He is not even correct in his “first 5 months of 2022” claim.
“2020 1 263.598
2020 2 263.859
2020 3 263.772
2020 4 264.099
2020 5 264.865
2020 6 265.394
2020 7 265.723
2020 8 265.530
2020 9 265.037
2020 10 264.319
2020 11 263.800
2020 12 263.336″
It has to be the satellite data he is referring to as the land based series have not published 5 months this year yet.
Sorry got the year wrong. Here is the up to date anomaly data.
“2022,1,0.03
2022,2,-0.00
2022,3,0.15
2022,4,0.26
2022,5,0.17”
“2021,1,0.12
2021,2,0.20
2021,3,-0.01
2021,4,-0.05
2021,5,0.08”
“2020,1,0.42
2020,2,0.59
2020,3,0.35
2020,4,0.26
2020,5,0.42”
Still the same error.
“Warmest months of global temperature in the record” for 2022 is incorrect.
https://imgur.com/a/WRFSNPv
This the real ‘first few months of the year’ data since 2018
https://imgur.com/a/WRFSNPv
Missing word, see below.
This is the real first few months of the year data since 2018
https://imgur.com/a/WRFSNPv
“As usual Barry likes to confuse things.”
No, barry is quite correct about what he said. Richard, quite amazingly, has simply misunderstood, despite this being repeated many times above. It’s not even complicated.
I didn’t say that the last 5 months were the warmest months in the (UAH) global temp record. In fact I said they were not.
So if I didn’t say that, Richard, can you figure out what I actually said?
Hint: if you copy and paste the whole sentence, instead of half of it, you will see what an absolute buffoon you’ve been.
And you may even get the irony about this being ‘unprecedented’. Which was the point.
Barry is someone who likes to confuse with statistics. I do not.
The data I use is straight from NOAA and is not detrended in any way unlike the ONI.
https://www.drroyspencer.com/2022/06/uah-global-temperature-update-for-may-2022-0-17-deg-c/#comment-1314669
The dataset I’m using is the one Michelle L’Hereux uses to check the frequency of ENSO events.
Are you saying she’s using the wrong dataset?
I have plotted the NOAA absolute anomaly dataset/ Are you saying that it is wrong?
https://www.drroyspencer.com/2022/06/uah-global-temperature-update-for-may-2022-0-17-deg-c/#comment-1314771
The dataset I’m using is also straight from NOAA, straight from their ENSO database.
You are using the ONI which has a varying reference period. That does muddy the picture somewhat.
The series I am using has no such skew added so it is easier to compare old records with new data. It also goes further back in time too.
The data I am using is the same data that Michell l’Hereux and colleagues use for ENSO, which her employers, the CPC publish.
Could you just accept that and not a read an opening to have an argument about it? It’s tedious. What prize are you trying to win, anyway?
The reason I am using it is that we have been discussing her views on recent la Ninas (and the meaning of ‘unprecedented’). Seemed quite appropriate to use the same index she does.
Just checking that my microphone is working, tap tap tap…
The dataset I’m using is the one Michelle L’Hereux uses to check the frequency of ENSO events.
Are you saying she’s using the wrong dataset?
Are you saying that the data you use is not derived from the data I am using?
That would be quite a feat, as the data come from two different monitoring systems.
Your data is the HadISST global sea surface temperature data maintained by the Hadley Centre of the United Kingdom Meteorological Office.
https://www.metoffice.gov.uk/hadobs/hadisst/
The NOAA Climate Prediction Centre, where l’Hereux is employed, publish NINO3.4 values from the ERSSTv5 dataset, which is maintained by NOAA.
https://psl.noaa.gov/data/gridded/data.noaa.ersst.v5.html
If you’re doubtful, read the 2nd sentence on the CPC Enso Table page.
Because of the high frequency filter applied to the ERSSTv5 data (Huang et al. 2017, J.Climate), ONI values may change up to two months after the initial “real time” value is posted
https://origin.cpc.ncep.noaa.gov/products/analysis_monitoring/ensostuff/ONI_v5.php
Are you saying that either HadISST or ERSSTv5 is wrong somehow?
They both measure the same global sea surface temperatures.
“ONI values may change up to two months after the initial ‘real time’ value is posted”
So the last 2 months may vary, but the data before that should not.
“Are you saying that either HadISST or ERSSTv5 is wrong somehow?”
No. What gave you that impression, Richard?
I am saying they are different. I am answering your question:
“Are you saying that the data you use is not derived from the data I am using?”
They are 2 different datasets built from some common data and some non-common data, and processed quite differently.
So, no, the data I am using is not derived from the data you are using. They are separate end products. You have the links to the data descriptions if you need more information.
To be clear, the data I am using is the same that Michell l’Hereux uses.
I am more interested in how Blinny shows below there is a nearly 1:1 match between Nino 3.4 and ENSO.
https://drive.google.com/file/d/1AeK8oGGqzX27K60aYAn4JWDho-8lhwMl/view
and
https://climatedatablog.files.wordpress.com/2022/06/nino34-4.jpeg
match almost perfectly.
Do they? I counted nearly twice as many l Ninos in Bin’s set than yours, just for starters.
In Bindidon’s set the warmest recent l Nino is 1982, and peaks generally descend from there, while 1982 is the 3rd highest el Nino in recent times in your dataset and l Nino peaks generally seem to rise from there.
Apart from being built from different indices, Bin’ data is ‘detrended’, which may partly account for these differences.
What must happened for a global average temperature of 25 C?
The average temperature of the ocean must be much warmer than our cold ocean.
Nothing else could cause earth global average temperature to be 25 C other than a warm ocean.
You can’t have our cold ocean, and add greenhouse gases to cause Earth to be this warm.
Earth has had average temperature of 25 C, because Earth has had a much warmer ocean.
The only question is how warm does the ocean have to be?
What is the coolest the ocean could be to have average global surface air temperature of 25 C.
It seems it would depend the Milankovitch cycles.
So one ask how warm does ocean have to be with our present Milankovitch cycle in order to have global average surface air temperature of 25 C. Or select the best moment in Milankovitch cycles
and what would minimum ocean temperature need to be to have global average surface temperature of 25 C.
gb…”What must happened for a global average temperature of 25 C?”
***
A whole lot of hot air, and not from the atmosphere.
Well I was wondering of average ocean was a cool as 8 C [or 4.5 C warmer than present ocean] whether in right Milankovitch cycle we could get average global surface temperature of 25 C.
Of course these “right” Milankovitch cycles can’t last that long, but 8 C ocean is probably too cold. But really matters ocean temperature of say top 2000 meters of ocean.
But anyhow it seems more likely ocean would have be about 15 C
https://www.boatsafe.com/wp-content/uploads/2020/11/Thermocline-Everything-You-Need-to-Know-1-700×560.jpg
From a link posted by Eben earlier…
“La Nia is part of the El Nio Southern Oscillation, which sees a three to seven year pattern of warming and cooling of the waters in the central Pacific Ocean. La Nia refers to the cool phase, and this cool phase has been around since 2020”.
***
Question is, what causes the cyclic warming/cooling of the oceans? The Sun is an obvious answer, but why the oscillations? Seems to me, as John Christy of UAH once implied, there are processes going on in the planet we simply don’t understand.
Most of the warming claimed since 1850, when the Little Ice Age ended, has been from 1970 onward. How do we know this is not another cycle and that we are headed for a period of cooling? Don’t know when, but it could be coming.
Because ocean evaporation in the tropics depends on atmospheric pressure, the temperature of the open ocean cannot be higher than 31 degrees C. At 30 degrees, high convection immediately sets in and clouds prevent the surface temperature from rising. Only a significant increase in the mass of the atmosphere can cause the surface temperature of the ocean to rise.
https://coralreefwatch.noaa.gov/data/5km/v3.1/current/animation/gif/sst_animation_90day_large.gif
Why Milankovitch (Orbital) Cycles Can’t Explain Earth’s Current Warming
“Over the last 150 years, Milankovitch cycles have not changed the amount of solar energy absorbed by Earth very much. In fact, NASA satellite observations show that over the last 40 years, solar radiation has actually decreased somewhat.”
“Finally, Earth is currently in an interglacial period (a period of milder climate between Ice Ages). If there were no human influences on climate, scientists say Earths current orbital positions within the Milankovitch cycles predict our planet should be cooling, not warming, continuing a long-term cooling trend that began 6,000 years ago. ”
https://climate.nasa.gov/ask-nasa-climate/2949/why-milankovitch-orbital-cycles-cant-explain-earths-current-warming/
Or NASA is certain we have cooling effects.
And NASA [or anyone] does not know how much warming is done by doubling CO2 levels.
Anyhow, it assumed Milankovitch cycles can cause Earth which covered by ice sheet to rapidly warm within very short time period- as shown by ice cores, or go from global average of 10 to 20 C, and more than 100 meter of sea level rise. Now NASA claiming we cooling, but is any kind of Milankovitch cycle which causes faster cooling.
Of course I think the Milankovitch cycles just help cause this massive warming which takes us out of the deepest depths of a glaciation period. But you think it’s strong one way, why not the other way?
Anyways, NASA say 6000 years of cooling and I like to say 5000 years of cooling. But one could say 6000, 8000 or 10,000 years of cooling.
Or the point when Holocene was warmest, could said to point where started cooling- though such a point is not clear, but somewhere around 8000 to 10,000 years ago.
But I tend to think a green Sahara causes warming, and I think it ended about 5000 years ago.
Solar activity ripples strongly, as seen by the increase in galactic radiation.
https://i.ibb.co/p2kvbPM/onlinequery.gif
We’re someone’s experiment. It is the only thing that makes any sense. This big ball is too perfect and we’re surrounded by all the imperfections.
Or it could just be that scientists do not understand all of it.
And, they never will.
Its all about control.
They want the power then they will dole it out as they see fit. One can see the whole enchilada at work in the response to the pandemic and the Patriot Act. First they gain the power via an emergency then they will fight tooth and nail against giving up the power.
Or it could be just about funding.
Alright, it’s my experiment.
Monkeys on a cold planets, and will complain it’s too hot.
Of course they would, and a completely unnecessary experiment,
but the squids wouldn’t believe it.
Since it is clear that the GHE model is not a ‘forcing’ model that means another process has to modify the warming. Certainly that process could include CO2 variability. However, when looking at how saturated the spectrums are the most likely variable is closing say the atmospheric window via heavy cloud cover and variability of clouds. Estimates have been made of the shoulders of the CO2 blocking and they put it at one or two tenths of a degree. Its very hard to accept the lapse rate argument because it is precisely because of greenhouse gases that cool the upper atmosphere that provides the opportunity for for convection rewarm the atmosphere with a lapse rate. So its hard for me to imagine how CO2 first fixes the problem it created to allow for convection then passively causes it to warm more since the ‘forcing’ model has no clothes.
It is the strong easterly wind along the equator that causes the mixing of water in the western Pacific. Now the wind has weakened, but not enough heat has been accumulated to end La Nia.
http://www.bom.gov.au/archive/oceanography/ocean_anals/IDYOC007/IDYOC007.202206.gif
https://www.tropicaltidbits.com/analysis/ocean/nino34.png
It takes a while for cold water to heat up.
https://coralreefwatch.noaa.gov/data/5km/v3.1/current/daily/gif/cur_coraltemp5km_ssta_large.gif
Looks like things are not getting any warmer overall in the Southern Hemisphere in the last 7 days.
https://www.tropicaltidbits.com/analysis/ocean/cdas-sflux_ssta7diff_global_1.png
Japan Is Dropping a Gargantuan Turbine Into The Ocean to Harness “Limitless” Energy
Deep beneath the waves there’s a source of power quite unlike any other. To tap into it, Japanese engineers have constructed a true leviathan, a beast capable of withstanding the strongest of ocean currents to transform its flow into a virtually limitless supply of electricity.
The 330-ton prototype is called Kairyu. Its structure consists of a 20 meter (66 foot) long fuselage flanked by a pair of similar-sized cylinders, each housing a power generation system attached to an 11 meter long turbine blade.
When tethered to the ocean floor by an anchor line and power cables, the device can orient itself to find the most efficient position to generate power from the push of a deep-water current, and channel it into a grid.
Kairyu was designed to hover roughly 50 meters below the waves – as it floats towards the surface, the drag created provides the necessary torque on the turbines. Each of the blades rotates in an opposing direction as well, keeping the device relatively stable.
In a flow of two to four knots (around one to two meters per second), Kairyu was found to be capable of churning out a total of 100 kilowatts of power.
If successful at withstanding what nature can throw at it, Kairyu could soon have a monster sibling swinging 20-meter-long turbines to generate a more respectable 2 megawatts.
A note of caution – Attempts to wring watts out of the tides, waves, and currents of the open ocean (Marine Hydro-kinetic power) typically end in failure. High engineering costs, environmental limitations, proximity of coastal areas to the grid… all manner of challenges need to be overcome to see projects like this through.
https://www.ihi.co.jp/var/ezwebin_site/storage/original/application/5a7bd9898dee90868aa1e1e085beb50b.pdf
Have to make them out of titanium, but can test it with metals that corrode faster.
It seems they might chew up a lot of fish.
Yep thats just a start!
Wait till you see the tons of marine growth that attaches themselves to everything in sight and clogs up every crevice. To temporary forestall that they will need to put poisonous coating on every exposed surface and that will only retard growth as the poisons slowly slough off. Already we have pollution problems in harbors with bottom paints on boats to forestall marine growth.
Now they can sink these down into the aphotic zone that will retard growth due to the lack of light, but the currents are slower here because they are not subject to water movement from winds and are less vulnerable to tidal movement as well. So along with less growth you generate less energy. What you can practically guarantee is that the proposal for this grossly underestimates the maintenance and grossly over estimates the power generated. Like wind power but with bad estimation on steroids.
About the only thing you can bet the farm on is in today’s environment it will be done with OP money.
Bill Hunter at 5:24 PM
Spoken like the accountant that you are, opining on an engineering project.
It’s perplexing that you would say “About the only thing you can bet the farm on is in todays environment it will be done with OP money.“ You should know that engineering projects are massive, complex undertakings that should [almost] always be financed with OPM to spread the risk and improve the return.
It is pleasing to see such interest in the pollution and ecological destruction caused by energy production.
Shall we make a list of pollution and ecological destruction by energy type? I wonder what we might learn?
Just trying to think of other marine activity connected with energy production.
Oil rigs, oil tankers. It’s early, and I’m not firing on all cylinders yet. Anyone want to throw in a few more?
I’m not absolutely certain that oil rigs and oil tankers pollute the ocean or cause ecological destruction. As I say, I’m just waking up.
“Recent estimates are that one-third of all oil pollution of the world’s oceans is caused by activities generally characterized as ‘marine transportation’. Tankers understandably are the single largest contributor of such pollution.”
330 tons is a leviathan? That’s essentially 1/15th the size of a WWII sub. That’s nothing.
“The 330-ton prototype“
I can think of a couple of reasons for failure. One is the salt water environment which is very corrosive for metal. Another is keeping the salt water out of the electronics controls not to mention any high voltage circuitry.
I can’t find anything on the voltage it operates at but typically these kinds of generators use a high voltage and low current to cut down on power losses. If the voltage is high, I’d hate to be anywhere near this thing if it leaks through salt water to ground. People have been killed swimming near boats with a lot lower voltage producing current through them.
It’s been going for 3.5 years now as a prototype.
AR6 Climate Muddels ?
https://clivebest.com/blog/?p=10281
“based on a new article in Nature by Zeke Hausfather et al . Some of the latest models in AR6 are running far too hot. The more sophisticated they try to become so the hotter they seem to run”
“I cant understand why no-one is prepared to follow Feynman and state that some models are simply wrong and should therefore be discarded. It makes no sense to continue model democracy over such an important issue. At the very least those Hot models should be recalibrated so as to agree with data” Clive Best.
Yep create an institution to educate give it money and there is no question that they will want to educate everybody on everything.
Liberal morons think only private enterprise wants to do that.
The difference is private enterprise can’t force you to buy any of it. In the public sector you will have found you bought it by putting a deposit down in advance without knowing what you bought and forget about getting a break on the mortgage you signed up for with the advance you didn’t know you advanced.
> It makes no sense to continue model democracy
It actually does, Clive. Fund managers have no access to crystal balls. So theyll try not to predict market trends too much and prepare for the worse by allocating with prudence. They might overweight what works and rotate stocks that underperform, but theyll always try to make sure to get returns everywhere they might be without compromising too much on risk. On what grounds should we think that the historical run ought to be representative of what should always happen, BTW?
Oh, and assigning different weights to votes isnt exactly how democracy works.
https://andthentheresphysics.wordpress.com/2022/06/10/the-hot-model-problem/#comment-208398
“I cant understand why no-one is prepared to follow Feynman and state that some models are simply wrong”
All models are wrong. You heard it here first.
Actually barry, it’s only your cult’s models that are wrong. Models built on actual science are typically reliable.
The key is adherence to reality.
“Actually barry, it’s only your cult’s models that are wrong.”
That is completely untrue. When we sacrifice the goat, it is ALWAYS at the equinox, and we don’t need no stinking internet to tell us when that is.
Glad to see you admit your devotion to your cult, barry.
How does it feel to finally be “out of the closet”?
I have always been a proudly open member of the Shakti cult of oversexed zealots. We welcome anyone who is fit enough to participate.
I want to make it clear, though, that we only use goats for sacrifice.
https://en.wikipedia.org/wiki/History_of_Shaktism
We love enthusiastic people! If you want to join you need a medical certificate.
I don’t believe in religion. Why should your God be any better than any other?
The fact that I’m kidding around here should be as obvious as clown at a funeral. Richard, loosen up and enjoy the circus.
In everything you post or just here?
It doesn’t matter that I know you, if that’s what you’re hinting at. We’ve got an atrocious health and safety record and the rest of the cult need to see a medical certificate.
I was thinking of you as a clown.
And kidding around.
You are not allowed to flirt with cult members until after you are invested.
So you are still a clown.
We’re Going to Get More Familiar with Heat Waves. Might as Well Start Naming Them.
Meteorologists are starting to name heat waves the same way they have named Hurricanes, and more recently, Winter Storms.
There’s also talk of rating heat waves for intensity, the way we do Hurricanes and Tornadoes.
Why it matters: Heat waves are the deadliest type of weather emergency in the U.S. They’re bigger killers than floods, tornadoes or hurricanes – and they’re growing in frequency and intensity. Excessive heat – which hits low-income communities the hardest – doesn’t lend itself to dramatic TV coverage, so people sometimes underestimate the risk.
Proponents of a more formal public warning system say it could save lives and trigger measures like opening community cooling stations and asking people to stay indoors. Some of the places least accustomed to heat are the most at risk.
This month Seville, Spain is poised to become the first city to start naming severe heat waves.
Five other cities – Los Angeles; Miami; Milwaukee; Kansas City, Missouri; and Athens – have also started piloting a similar initiative, using weather data and public health criteria to categorize heat waves.
Each participating city has a different set of formulas that will determine what the categories look like, based in part on their urban structure.
Any of the designations would ideally prompt city pools to open, outdoor sports to be curtailed, emergency heat lines to be activated, and workers to go door-to-door checking on the elderly and at-risk.
maguff…”Heat waves are the deadliest type of weather emergency in the U.S. Theyre bigger killers than floods, tornadoes or hurricanes and theyre growing in frequency and intensity”.
***
Propaganda!!! There’s not a shred of scientific evidence to back that sci-fi. The so-called excessive heat dome we experienced in Vancouver, Canada last summer was produced by a La Nina stalling a heat dome over the Pacific NW. Natural variability all the way.
There is not a shred of evidence that anthropogenic warming has anything to do with heat waves. Anthropogenic warming has incorrectly been claimed to raise the global average by 1C over 170 years, not 10 to 15C overnight. There is no way CO2 or WV can produce that kind of temperature increase in a short period of time.
Besides, the record for heat waves, by far, in North America, was produced in the 1930s decade.
Why are you telling him that? He’s part of the propaganda machine.
stephen..I am not replying to maguff, I am correcting his propaganda for others who may drop by and read it. There are lurkers who simply want to read but not participate. Nothing against that, I just want them to know there is an alternative opinion.
Gordon Robertson at 7:07 PM
Your “alternative opinion” is duly noted. There’s plenty of evidence for your “lurkers” to read (see Norman’s comment below).
It is the poor and ignorant (such as you deniers) that are most vulnerable during heat waves; it behooves the kindhearted among us to look out for y’all.
Thank you kindly for your consideration.
AGW has caused more La Nina. You heard it here first.
Gordon Robertson
Again with the “not a shred of evidence”. Those claims of yours are wrong. There is some evidence. Some researchers have put in time and effort to look through available data to monitor heat wave trends. Not sure why you make these claims. You may not agree with the evidence, that is one thing. It is wrong to say there is “not a shred of evidence” because that is a false statement. Please correct your use of terms or do some of your own research before making sweeping incorrect statements.
https://www.nature.com/articles/s41467-020-16970-7
Norman, “monitoring heat wave trends” does not mean anything. We know Earth is in a warming trend. REAL scientists know the warming is NOT related to CO2.
It’s only cult idiots like you that believe ice cubes can boil water.
Did you ever find a technical reference that two 315 W/m^2 fluxes can warm a surface to 325K?
How about your “real 255 K surface? Where is it?
Clint R
You are one dumb BOT! You assimilate a few words but you have not ability to process the content.
You seem compelled to post.
No I do not believe ice cubes boil water.
There would be no direct link to the exact fluxes. I have already told you that but you are a BOT and just repeat. Roy Spencer experiment I linked to did describe how two fluxes add and create a higher temperature on a surface. Since I have already linked you to this experiment I am not going to do it again. Since it does not matter you only repeat the same things over and over anyway. It is what programmed BOTS do.
Clint R programmer please remove your annoying program (mostly because it just endlessly repeats the same things over and over). This program is glitched in a loop. You need to reprogram if you want posters to think it is a “real” human. Thanks.
Sorry Norman, but that is all wrong. Your meltdown has you tangled up with your bogus claims you can’t support and your “bots”. You don’t understand any of this.
Like barry, you don’t realize that your false beliefs mean ice can boil water. Study this:
https://www.drroyspencer.com/2022/06/uah-global-temperature-update-for-may-2022-0-17-deg-c/#comment-1312486
Also, you STILL haven’t produced a technical reference that two 315 W/m^2 fluxes can warm a surface to 325K?
How about your “real 255 K surface”? Where is it?
You’ve got a lot of work to do to have any type of credibility. You’re such a phony.
Clint R (bot)
I have answered your points. You are a nonhuman with limited ability to process language. For fluxes adding again refer to Roy Spencer experiment it has the information. Not more can be done until your programmers step in and rewrite some of your information proceeding ability. CCan your routines understand this?
Sorry Norman, but that is all wrong. Your meltdown has you tangled up with your bogus claims you can’t support and your “bots”. Spencer NEVER said any such thing. You don’t understand any of this.
Like barry, you don’t realize that your false beliefs mean ice can boil water. Study this:
https://www.drroyspencer.com/2022/06/uah-global-temperature-update-for-may-2022-0-17-deg-c/#comment-1312486
Also, you STILL haven’t produced a technical reference that two 315 W/m^2 fluxes can warm a surface to 325K?
How about your “real 255 K surface”? Where is it?
You’ve got a lot of work to do to have any type of credibility. You’re such a phony.
“Like barry, you dont realize that your false beliefs mean ice can boil water”
You’re still a liar, I see.
https://www.drroyspencer.com/2022/06/uah-global-temperature-update-for-may-2022-0-17-deg-c/#comment-1312231
barry is so incompetent he can’t understand even when it’s explained to him:
https://www.drroyspencer.com/2022/06/uah-global-temperature-update-for-may-2022-0-17-deg-c/#comment-1312486
That’s what being a braindead cult idiot is all about.
Norman,’
More CO2 is good for the plan(e)t. Also, warm is good. Much better than cold. We can feed people during warm. Stop being a Myrmidon.
Stephen p Anderson
To a degree you are correct. Carbon Dioxide is essential for plant growth. A warmer planet may be beneficial, that opinion is not solid at this time. Heat waves are dangerous to human life so that risk should not be ignored. My comment was a counter to Gordon Robertson’s claim there was not a shred of evidence. There is some evidence heat waves have increased globally since 1950 (the extent of the study I linked to).
Norman,
Ever read
? It was written before 1950. Nothing new happening. It is the planet we live on.Stephen p anderson
The 1930’s US heat wave was not a global event and it was highly destructive. As one who has studied Chemistry you would understand the science of the GHE. Visible light is not inhibited by atmosphere from reaching surface but surface generated IR is restricted making a radiant barrier causing the surface to reach a higher average temperature with equivalent solar input.
“A warmer planet may be beneficial, that opinion is not solid at this time”
The plants show that they are best suited to a higher CO2 concentration. They may also help explain why water vapor is decreasing with higher temperatures rather than increasing as rising temperatures would suggest (effects on stomata).
“For the majority of greenhouse crops, net photosynthesis increases as CO2 levels increase from 3401,000 ppm (parts per million). Most crops show that for any given level of photosynthetically active radiation (PAR), increasing the CO2 level to 1,000 ppm will increase the photosynthesis by about 50% over ambient CO2 levels”
….340-1,000 ppm….
Damned parser.
Norman believes: “…causing the surface to reach a higher average temperature with equivalent solar input.”
Higher temperature than what, Norman? An imaginary sphere?
Earth reaches the temperature it is supposed to have. Your cult believes ice can boil water. You’re a braindead cult idiot that believes anything from your cult. You don’t understand ANY of this.
Supposed to have according to what, Pup?
Please stop suggesting that Sky Dragon Cranks rely on modulz too.
The cult idiots are confused because they believed comparing Earth to an imaginary sphere meant something. They don’t understand any of the science.
The fact that Earth’s average temperature is 33k warmer than an imaginary sphere means NOTHING. Compared to a real sphere like Sun, Earth is about 5750K cooler! Neither comparison means anything.
The cult idiots don’t understand ANY of the science. They don’t realize that adding fluxes means ice can boil water. It has to be explained to them, as here:
https://www.drroyspencer.com/2022/06/uah-global-temperature-update-for-may-2022-0-17-deg-c/#comment-1312486
Then, they STILL can’t understand because they’re braindead.
That’s why this is so much fun.
Here, Pup:
https://www.drroyspencer.com/2022/06/uah-global-temperature-update-for-may-2022-0-17-deg-c/#comment-1307476
Why do you keep repeating yourself?
Yes Willard, bob is as immature and uneducated as you.
Good find.
Oh, Pup.
Willard, please stop trolling.
mega slot เป็นแหล่งรวมสล็อตทุกค่าย เกมสล็อตออนไลน์ ค่ายเกมสมาชิกใหม่ปี 2022 รวมเกมสล็อตอันดับที่หนึ่งของโลกมาเอาไว้ภายในค่ายเกมเมก้า จากสถิติผู้เล่นสล็อตออนไลน์ทุกค่ายเกมเมก้า megaslotgame
The concern for me is the source of the convective currents that reverse to change a La Nina into an El Nino. The following article offers a partial explanation.
“The interaction of the atmosphere and ocean is an essential part of El Nino and La Nina events (the term coupled system is often used to describe the mutual interaction between the ocean and atmosphere). During an El Nino, sea level pressure tends to be lower in the eastern Pacific and higher in the western Pacific while the opposite tends to occur during a La Nina. This see-saw in atmospheric pressure between the eastern and western tropical Pacific is called the Southern Oscillation, often abbreviated as simply the SO.
Since El Nino and the Southern Oscillation are related, the two terms are often combined into a single phrase, the El Nino-Southern Oscillation, or ENSO. Often the term ENSO Warm Phase is used to describe El Nino and ENSO Cold Phase to describe La Nina”.
https://iridl.ldeo.columbia.edu/maproom/ENSO/ENSO_Info.html
Elsewhere in the article it talks about the dep.th of the thermohaline level. Looked that up for a brief explanation…
This link may not work…will try to post it later, If not, look up thermohaline and there should b a link to NOAA ocean services.
Link won’t post,,,remove asterisks *
https://oceanservice.noaa.gov/education/tut*o*r*i*a*l_currents/05conveyor1.html
So, now we have a conveyor belt system transporting water around the oceans based on its density.
The plot thickens. It appears the conveyor belt system may behave like the jet stream, hence being variable.
I did not realize that winds can affect the oceans up to 100 metres in dep.th.
Gordon, use tinyurl, like this.
https://tinyurl.com/9dkus455
Then everyone can just click on the tinyurl to go to the webpage you want to direct people to.
https://tinyurl.com/app
Just copy your link into the box there and it will pop out an alternate link to the same destination.
Of course, if the tinyurl itslf has forbidden strings, then you’ll have to revert to the technique you used above. But this is a time-saver overall, and better for recipients.
Thanks, Barry, I’ll check that out.
testing..
tinyurl.com/zrdnemkf
oops….
https://tinyurl.com/zrdnemkf
yay!!!!
thumbs up and smiley emojis
Don’t know what wordpress doesn’t like about tut*o*r*i*a*l
There has been some confusion among the Richards at this board about the unprecedented global temperatures recently, during a double-dip la Nina.
It has been pointed out that the recent ENSO value (NINO3.4 SSTs) for May is the coldest May to have occurred during a double dip la Nina.
To clarify, it is not the coldest la Nina anomaly to have occurred ever, not the coldest la Nina anomaly in a double-dip la Nina, nor even the coldest May anomaly during a la Nina (1950 gets that distinction).
But it IS the coldest May anomaly to have occurred during a double dip la Nina. Since 1950.
This is why it is ‘unprecedented’.
At the same time, recent monthly global temperatures have been the warmest to have occurred during a double dip la Nina.
To clarify, they are not the warmest to have occurred ever, nor the warmest anomalies to have occurred during a la Nina.
But they ARE the warmest global temperature anomalies to have occurred during a double dip la Nina. Since 1950.
And that is why thy are ‘unprecedented’.
(This is the case for UAH, RSS, Had.CRU, GISS and NOAA monthly global data sets, rated per NOAA’s ONI values for ENSO)
Confusion happens so easily, so I’ll just define terms.
ONI values = Tri-monthly average sea surface temperatures in the NINO3.4 region in the South Pacific.
Double dip la Nina = a second la Nina that forms shortly after a prior la Nina has ebbed, typically within a few months, and where the ENSO values have remained negative between the 2 la Ninas, but not at the levels of a full blown la Nina event.
I use the Nino data direct from NOAA which does not have the changing base that ONI has.
The points are the actual absolute anomaly data for each month, base period 1981-2010, (I don’t like putting lines between the points as we do not know what trajectory happened during each month and it tends to distract the eye if you add them).
https://climatedatablog.files.wordpress.com/2022/06/nino12-1.jpeg
https://climatedatablog.files.wordpress.com/2022/06/nino3-1.jpeg
https://climatedatablog.files.wordpress.com/2022/06/nino34-1.jpeg
https://climatedatablog.files.wordpress.com/2022/06/nino4-2.jpeg
If you look at the points you will see each La Nina and El Nino going back to 1870 across the whole pacific.
The 12 month and 15 year HQLP filters I use are similar (but more accurate) to simple running means.
The data is taken from
https://www.psl.noaa.gov/gcos_wgsp/Timeseries/
under the SST Indices heading
e.g. https://www.psl.noaa.gov/gcos_wgsp/Timeseries/Nino12/
Nio 1+2 (anomaly:1981-2010 mean removed) : Standard PSL Format
and is NOT detrended in any manner.
Nio 1+2 SST Index
Calculated from the HadISST. It is the area averaged SST from 0-10S and 90W-80W.
Time Interval: Monthly
Time Coverage: 1870 to Sep 2021
If you look at 1878 under Nino 3.4 then you will see that the excursions for EL Nino (positive temperatures) is nearly the same as for 2016, 1998, 1982, 1972 and 1886.
The coldest La Nina month on record is for 1890.
The data itself goes up to April this year, but the Time Coverage heading has not kept up.
https://climatedatablog.files.wordpress.com/2022/06/nino34-1.jpeg
NINO3.4 el Ninos peaks look like they are getting stronger, or warmer, take your pick. There’s one large anomaly near the beginning, then the peaks are a bit lower, rising fairly steadily thereafter, the highest peak being in 2016.
It’s a little tougher to see a downward trend in la Nina troughs for the 3.4 region, even for the last 25 years. One of the lowest troughs in the record is in 1989, then the troughs seem to rise thereafter.
Do you concur, Richard?
Compare 1878 with 2016.
The 15 year LP shows the lowest average temperatures for La Nina is around 1950 and 1890.
I might add in a 15 S-G to see the recent average temperatures.
Now done (added the S-G) for the various Nino areas.
https://climatedatablog.files.wordpress.com/2022/06/nino12-3.jpeg
https://climatedatablog.files.wordpress.com/2022/06/nino3-3.jpeg
https://climatedatablog.files.wordpress.com/2022/06/nino34-3.jpeg
https://climatedatablog.files.wordpress.com/2022/06/nino4-4.jpeg
Moved the Nino 3.4 caption placement to bottom right hand corner to stop overwriting data points.
https://climatedatablog.files.wordpress.com/2022/06/nino34-4.jpeg
“Compare 1878 with 2016.”
Yes, that’s the large anomaly I mentioned.
I’ve looked at it again, and aside from 1876, el Ninos seem to be getting more peaky through the record in the 3.4 region, and la Ninas seem to have become less potent over the last 25 years.
Dunno how to resolve the chart style anomalies in excel to do a regression, so I’ll just use annual averages. I want to get a sense of any general trend in ENSO over the last 25 years and since 1950.
HadISST NINO3.4:
1950 to 2022 OLS = 0.03 C/decade for a total 0.2C increase
Not statistically significant, but FWIW that’s the same sign I got using ERSSTv5 SSTs for the same region and period. ERSSTv5 trend was also not statistically significant over this period.
HadISST NINO3.4:
1997 to 2022 OLS = 0.17 C/decade for a total 0.4C increase
This result is not statistically significant either, but also corroborates the sign of the mean trend with ERSSTv5 data for the NINO3.4 region.
Both sets of data (HadISST, ERSSTv5) are not detrended, and include a rising trend for the last 25 years that would skew a straight comparison with the data l’Hereux and NOAA use to assess ENSO. So while the OLS results suggest a discrepancy with the trends reported in the article, the SSTs used here retain a warming signal that would not be present in the data l’Hereux and NOAA use to assess ENSO. Also, it’s very likely l’Hereux’s analysis, and perhaps that of the other research groups mentioned, uses methods that include isolating la Nina and el Nino events/values.
Just to complete the set of OLS, the trend for the whole period is 0.016 C/decade for a total of 0.24C, also not statistically significant.
“Yes, thats the large anomaly I mentioned”
A large EL Nino you mean.
A similar large La Nina happened in 1892.
Nothing in the record exceeds those 2 peak values in a statistically significant fashion.
“aside from 1876”
Actually it is 1878 and you cannot just discard values you don’t like and then continue onwards as if nothing has happened.
But I didn’t discard it. I plotted a trend for all the data, as I said, and gave the result.
We’re also interested in a vouched change in la Ninas over the past 25 years. Have a look at the peaks and troughs and tell me you don’t see a rising trend for el Ninos over that period. I certainly can’t see a lowering trend of la Nina troughs in the NINO3.4 region. That’s why I ran a regression for the last 25, to see if there was a statistically significant change.
https://climatedatablog.files.wordpress.com/2022/06/nino34-4.jpeg
I see no change in peak high temperatures (El Nino) over the whole graph.
I also see a non linear pattern to low temperatures, c.f. the 15 LP line which highlights just that figure.
It as at its lowest and both 1952 and 1888.
….It as at its lowest at both 1952 and 1888….
See, you’re talking past me again. I pointed out the last 25 years and you completely ignored it.
This is the time period on which your la Nina news article is based. You don’t seem to be interested in the data that covers the period of “more la Ninas.” It’s strange.
I am quite interested in how the peaks, both low and high, have not significantly changed for the whole period in the central Pacific. AGW? Looks like a fail in that regard.
It is worth noting that by choosing a shorter time period you can come to completely different conclusions that the longer period shows up.
“I am quite interested in how the peaks, both low and high, have not significantly changed for the whole period in the central Pacific. AGW? Looks like a fail in that regard.”
AGW??
Who said anything about…?
Ah yes. The guy who is not playing climateball.
:eyeroll:
You obviously do now want to address the fact that min and max have not increased significantly in the Nino 3.4 record.
Max
1878 2.41 2.43
2016 2.56 2.11
Min
1890 -2.49 -2.11
1988 -2.18 -1.98
….You obviously do not want to address the fact….
Damn cut and paste.
Did not realize it was Newton who first noted that the rate of cooling of a body is proportional to the difference in temperature between the body and it’s environment.
Newton’s Law of Cooling
Heady stuff considering heat was not studied officially till into the 1800s.
rlh…[GR]they[AMSU weighting functions) appear to be similar to filters responses
Try thinking of a gaussian band pass that is tilted due to air pressure/temperature vertically”.
***
I can understand the relationship between pressure, temperature and altitude, but the satellite AMSU units don’t understand it. All they can do is use various frequency-sensitive channels to gather O2 microwave radiation in different frequency bands, not being able to detect the altitude of emission. Ergo, the AMSU channel receiver are sensitive to frequency only.
The weighting functions seem to be a human-based function that correlates data received per channel frequency band into the altitude associated with each channel. Further work would be required to convert that to temperature per altitude.
Swannie has taken a shot at me over this but he fails to grasp that each channel measures temperature over a large swath of altitudes and not simply at 4 km. Each weighting function correlates the microwave emission received with a certain altitude. The AMSU channels receive over a wide band of frequency/altitudes, not just at 4 km.
I know how radio receivers work. I also understand about tuned receivers. Now take a normal gaussian response for each channel and apply the differing temperature vertically and change an individually symmetrical plot into an asymmetrical one. Note that the vertical spread of each passband will change as the frequency centers/temperature do with height. And thus you get the AMSU plot.
Gordo (and RLH), The MSU scans represent microwave intensity at a particular frequency. They don’t measure “temperature”, the individual scans are referenced to the intensity at scan positions at each end of the swaths which view emissions from known temperature sources. The intensity is said to be linearly related to the temperature, which then is used to define a temperature scale. There’s no change in the frequency being measured, as you have previously claim. There’s no measure of “temperature over a large swath of altitudes”, only the total intensity seen from above TOA.
The weighting functions are theoretical calculations of the absorp_tion and emission from the surface to the satellite. As far as I know, they can’t actually be measured in the atmosphere.
“They don’t measure ‘temperature'”
In the same way that the expansion of a column of mercury doesn’t measure temperature directly either. They are both proxies for it.
“In the same way that the expansion of a column of mercury doesnt measure temperature directly either. They are both proxies for it.”
Thermometers measure temperature from within the medium being monitored.
Satellites are isolated from the target medium by vacuum.
Measuring directly and indirectly are fundamentally different.
Thermometry is not proxy measurement.
And the proxy is the physical object being measured, not the instrument measuring it.
“Satellites are isolated from the target medium by vacuum.
Measuring directly and indirectly are fundamentally different.”
Linear interpolation can be used in either case. As Roy shows.
https://www.drroyspencer.com/wp-content/uploads/radiometer-calibration-graph.gif
“the individual scans are referenced to the intensity at scan positions at each end of the swaths which view emissions from known temperature sources”
Now define the difference between marks engraved on a glass tube containing mercury at 0C and 100C.
….between that and marks engraved….
I see that RLH continues his annoying habit of posting multiple replies instead of thinking before hitting the send button.
Well DUH. But, the difference is that a mercury in glass thermometer or a thermcouple measure the average temperature of the medium in which they are located, while the MSU measures a non-linear combination of emissions along a path from the surface to the instrument. Those IR emissions are the result of both upward emission with altitude and absorp_tion along the entire path, which is a complicated physical process. To calculate the theoretical weighting functions, the downward “back radiation” emissions must also be included.
So distinguish for me how a non linear marking on a glass tube that was conical (or any other cross section) instead of linear would in any way differ from the markings on ‘a non-linear combination of emissions along a path from the surface to the instrument’.
RLH, Are you really so ignorant? The calibration of the instrument has nothing to do with the weighting functions. The instrument only responds to the total intensity received at each scan position. For the AMSU, the “scale” is actually tested on the ground in a thermal vacuum chamber and a calibration curve is determined. The actual measurements are later adjusted by applying the calibration curve before getting to UAH or RSS for their analysis.
The weighting functions are a mathematical construct which is claimed to represent the fractional proportion provided by each layer in the atmosphere which ultimately are measured by the instrument. The same sort of layer-by-layer computation is used for modeling the effects of greenhouse gasses, the difference being that there’s a wide range of frequencies included in the GHG calculations.
“The calibration of the instrument has nothing to do with the weighting functions”
Calibration is what changes a reading into a temperature.
RLH, +the application of the calibration curve corrects for non-linearities in the instrument. The result is called “brightness temperature” by most workers because it does not represent the temperature which might be measured by a thermometer or thermocouple at one point in the column of air.
https://en.wikipedia.org/wiki/Brightness_temperature
and
“The brightness temperature is a measurement of the radiance of the microwave radiation traveling upward from the top of the atmosphere to the satellite, expressed in units of the temperature of an equivalent black body”
https://www.remss.com/measurements/brightness-temperature/
“By choosing measurement frequencies where the atmosphere is (almost) opaque, the upwelling radiation measured by microwave sounders is representative of the temperature of thick layers of the earths atmosphere. We use a temperature weighting function to describe the relative contribution of each atmospheric layer to the observed brightness temperature
…
where Ws is the surface weight, T(z) is the temperature at height z, and W(z) is the temperature weighting function, and the integral extends from the surface to the top of the atmosphere (TOA)”
https://journals.ametsoc.org/view/journals/atot/26/6/2008jtecha1176_1.xml
RLH, So what? From your reference to RSS, they also wrote:
The weighting curves are still a theoretical calculation. there’s lots more information if one reads the whole paper, including a discussion of the effects of pressure broadening on the emission lines. If you care to attack the math, read the references.
“The weighting curves are still a theoretical calculation”
That everybody uses.
RLH, Have you any evidence that RSS and UAH use the same weighting functions and what assumptions do the respective groups use to perform the calculations? For RSS, it appears that they used the U.S. Standard Atmosphere for their calculation, which would not necessarily fit real world conditions in the Tropics or during NoPolar winter. What did UAH use, fan boy?
The basis of each channels weighting function for altitude is the same. Regardless of who uses it.
RSS uses various models of the atmosphere to tune this. UAH uses empirical calculations.
Do you have any evidence (other than your preference for RSS) that their method is more accurate that UAH?
Whilst you are at it, explain the small differences between UAH and RSS which are using the same data.
https://climatedatablog.files.wordpress.com/2022/06/rss.jpeg
https://climatedatablog.files.wordpress.com/2022/06/uah_lt.jpg
In particular the changes between 2002 and 2008.
(We can assume that you have adjusted for the different reference periods).
RHL wrote:
Prove it. Plot the UAH weighting function data on the same graph as that of RSS. Note that RSS provides their weighting curves in a file on the RSS site. Where’s the UAH data you claim to be the same? You also wrote:
You appear to be confusing the calculation of the weighting functions with the sat-to-sat merging process to produce the MT, TP and LS stuff.
As for the differences between the TLT and the LT, recall that RSS removes the data poleward of 70S, which is a problem due to the high elevations over the Antarctic and the effects of the Ozone Hole. And, recall that the merging between the respective series going from the MSU to the AMSU is different around ~2002.
https://www.drroyspencer.com/2022/06/uah-global-temperature-update-for-may-2022-0-17-deg-c/#comment-1315244
Any comment on the El Nino in 1998, 2010, 2016 and 2020 in the RSS and UAH datasets.
https://climatedatablog.files.wordpress.com/2022/06/rss.jpeg
https://climatedatablog.files.wordpress.com/2022/06/uah_lt.jpg
The issue is that the satellite measured temperature requires complicated analysis, correction, and various assumptions go into it.
As a result, there are multiple analyses of the data giving VERY different results for T trend.
That huge uncertainty makes the data much less useful for science.
https://climatedatablog.files.wordpress.com/2022/06/rss.jpeg
https://climatedatablog.files.wordpress.com/2022/06/uah_lt.jpg
show 2 different methodologies for the same instruments. Care to explain the differences you see and what causes them?
Updated RSS to include 15 year LP.
https://climatedatablog.files.wordpress.com/2022/06/rss-1.jpeg
Used thin blue pen to correspond to UAH LT.
https://climatedatablog.files.wordpress.com/2022/06/rss-2.jpeg
Round the world superdeveloping La Nina effect
https://youtu.be/K40fy4TGAlw
https://coralreefwatch.noaa.gov/data/5km/v3.1/current/daily/gif/cur_coraltemp5km_ssta_large.gif
The left hand edge (West) of La Nina is not abating.
In July, Earth is the farthest from the Sun in orbit. With La Nia underway, will summer temperatures at the North Pole remain below the 1958-2002 average?
https://i.ibb.co/dp1JX7M/mean-T-2022.png
But it is the warmest year ‘evar’.
This, but unironically.
I know that Willard relies on unicorns but….
I know that Richard still holds that satellites “measure” temperatures…
They have instruments which can be determined to measure air temperature over various altitudes due to the emissions that the oxygen molecules transmit.
Mind you, it could be little green men that are responsible instead.
Willard’s a little green something.
Let’s be really clear about this: satellites do not measure air temperature. Temperatures are inferred from the reading of microwave emissions from O2 molecules involving a fairly complex process that involves several layers of calibration, from the in situ regular calibration of the target instrument, to inter-satellite calibration across different satellites over several decades, each of which have different drift variables that must be calibrated for.
The raw satellite data goes through more processing steps (including adjustments) than surface temperature data.
https://www.drroyspencer.com/wp-content/uploads/radiometer-calibration-graph.gif
Roy seems to differ.
“The raw satellite data goes through more processing steps (including adjustments) than surface temperature data”
There is a significant difference between whole Earth (nearly) area coverage with depth and irregular point sampled interpolated calculations inside the SBL.
Both adjustments and grid infilling are arguably more aggressive than what the surface station datasets are doing.
Me: “The raw satellite data goes through more processing steps (including adjustments) than surface temperature data”
You: “There is a significant difference between whole Earth (nearly) area coverage with depth and irregular point sampled interpolated calculations inside the SBL.”
You just had to smash a counter out, didn’t you? Had to start another fight.
Climateball. Boring.
UAH doesn’t even have whole Earth coverage. They ignore scan angles 1 and 11 which are both 178 km wide. Then scans 3-9 will be selectively ignored if it is 0.5 C cooler than the linear interpolation of the adjacent scans. This leaves several unfilled cells requiring infilling from up to 15 2.5 degrees cells and 2 days away using simple linear interpolation. At the equator that is a spatial distance of 15 * 2.5 * 111 km = 4160 km. For point of comparison GISTEMP infills using data up to 1200 km away and does not employ a temporal strategy at all. See Spencer & Christy 1992 and for details. Spencer & Christy 1990 is relevant as well.
“UAH doesnt even have whole Earth coverage”
That’s why I said nearly.
Do you understand the problems with irregular point sampling inside the SBL?
“Me: “The raw satellite data goes through more processing steps (including adjustments) than surface temperature data”
You: “There is a significant difference between whole Earth (nearly) area coverage with depth and irregular point sampled interpolated calculations inside the SBL””
You seek to differ on that observation?
For how UAH v6 is actually handled see
https://www.drroyspencer.com/2015/04/version-6-0-of-the-uah-temperature-dataset-released-new-lt-trend-0-11-cdecade/
I’m not sure I’d describe UAH’s coverage with the word “nearly”. There are so many unfilled cells in their grid that not only do they have to resort to branching out to cells very far away to infill them, but they have to infill them by looking at cells on different days. And when I look at the coverage depicted in Spencer & Christy 1990 I get the exact opposite impression of “nearly” though that depiction also excludes scans 2 and 10 as opposed to just 1 and 11 documented in the official UAH publication.
Spencer & Christy 1990 covers before v6.
N.B. “including a new method for monthly gridpoint averaging; a new multi-channel (rather than multi-angle) method for computing the lower tropospheric (LT) temperature product; and a new empirical method for diurnal drift correction. We also show results for the mid-troposphere (MT, from MSU2/AMSU5), tropopause (TP, from MSU3/AMSU7), and lower stratosphere (LS, from MSU4/AMSU9)”
There’s no doubt there were significant coverage changes in v6. I just can’t tell what they are or how the grid infilling procedure differs exactly based on the Spencer et al. 2016 publication. There are certainly hints in there that it was improved significantly given new attention to regional metrics. They do say “While the previous method has been sufficient for global and hemispheric average calculations, it is not well suited to gridpoint calculations in an era when regional — rather than just global — climate change is becoming of more interest.”
Read
https://www.drroyspencer.com/2015/04/version-6-0-of-the-uah-temperature-dataset-released-new-lt-trend-0-11-cdecade/
and if you need further clarification ask Roy.
Or alternatively you could try
https://www.drroyspencer.com/wp-content/uploads/APJAS-2016-UAH-Version-6-Global-Satellite-Temperature-Products-for-blog-post.pdf
or
https://link.springer.com/article/10.1007/s13143-017-0010-y
> Climateball. Boring.
https://i.kym-cdn.com/photos/images/newsfeed/000/903/458/f7b.gif
More srsly – Climateball is what we make of it.
That Richard cannot refrain from turning every single thread into a food fight does not imply that Climateball is all about food fights.
“arguably more aggressive than what the surface station datasets are doing”
Do you have any knowledge of the SBL and how much it changes over 24 hours?
https://nature.berkeley.edu/biometlab/espm129/notes/Lecture_17_Wind_and_Turbulence_Part_2_Surface_Boundary_Layer_Theory_and_Principles_Notes_2014.pdf
Of the wiki view of the PBL
https://en.wikipedia.org/wiki/Planetary_boundary_layer
Remember that all 2m thermometers sit within this (and don’t get me started on Nyquist limits on sampling intervals in all that mess).
“Climateball is what we make of it”
Go away and play Willard.
I already do, dearest Richard, and No U.
Me: “The raw satellite data goes through more processing steps (including adjustments) than surface temperature data”
You: “There is a significant difference between whole Earth (nearly) area coverage with depth and irregular point sampled interpolated calculations inside the SBL”
You again: “You seek to differ on that observation?”
No, Richard, it is you who seek to differ on everything, as handily demonstrated in the brief exchange quoted. I’m not interested in playing Climateball with you.
Willard: Dumb has a U it in and applies to you as an idiot.
Barry: Different methodologies have different errors. Together they can show something similar. The SBL/PBL complexity is something that all measurements should consider.
“Different methodologies have different errors.”
You reckon this is news to anyone here?
Why are you lecturing us, professor? Feels like I can’t say a damn thing without you having a shot at it.
Do you accept that conditions vary quite considerably inside the SBL/PBL over quite a short distance?
The science of global warming can not tell you how much increase in global air temperature will result from a doubling of CO2.
Nor can say how soon any warming of global air temperature would occur, ie within 10 years or within 50 years, nor within 500 years.
And the science of space exploration can’t tell you how much water in the polar region. Could be sheets of solid ice or less than 5% concentration. Though what is important is amount of mineable lunar water within some region.
One could say that both of these things are impossible- and for a number of reasons. But one can make progress in either. It seems to me in terms of progress in global warming, it seems to me, we arrived
at lukewarmer point of view of only moderate amounts of warming is possible from rising CO2 levels.
My opinion is that rise of CO2 levels may have caused about .2 C to global air temperature and by 2100 AD might add as much as .5 C.
But it possible these values are closer to zero and it’s possible it’s more than this. But a problem is amount increase from rising CO2 levels is close to not measurable. Now, it would be more measurable with more time {and better measurements} and both these a possible.
But since we in an ice house climate, 1 C of warming from CO2 is not bad outcome. Nor is even 2 C. Nor even 3 C.
With the Moon, there hasn’t been any particular, improvement in assessing how much water there is in polar region. And like the difficulty measuring warming effect of doubling CO2, this changes odds of there being much water on the Moon. But one thing one could say about lunar water mining, there has significant improvement in Earth launch capabilities. Or if you can lower the cost of getting to the Moon, one could mine a drier moon for water. Also another factor is estimates of lunar water is mostly water which could found in first 1 or maybe as deep as 2 meter below the surface, due to inability to “measure/estimate” deeper.
My view about to Moon is that lunar “could have been” mineable 20 years ago, if it had been explored, but also that when it’s explored
it could be that it’s not immediately mineable but could become mineable 20 year after exploring the Moon- due to number different factor, and one factor is the trend of ever lowering of Earth launch costs. And exploration results from Mars, will change whether the Moon is mineable in terms of water or mining something else on the Moon.
In simple terms, if there are Mars settlements, the Moon will be mined, and if moon is mined, there greater chance of having Mars settlements, sooner.
Most space cadets agree, the argument was which do you explore first, and Congress decided to do the Moon, first. Or in terms of government exploration programs, Moon first make a lot more sense.
I would add, in terms of private exploration, Mars first, could make more sense- more practical/doable. But as Musk says, expect that people will die in effort to establish a settlement on Mars.
Which is realistic expectation.
And I would say NASA Mars exploration, could lower the death toll- which I think is a very good idea.
SPACE TRAVEL
Left in the dust: The first golden age of citizen travel to outer space
by Staff Writers
Albuquerque NM (SPX) Jun 10, 2022
” The first civilian in space was a Japanese newspaper reporter in 1990, Toyohiro Akiyama. Then, six months later, Helen Sharman, a distinguished British chemist won a radio contest, beating out more than 13,000 other British men and women. However, both have been denied inclusion in the commercial space tourism club.
“Citizen access to space is, tremendously important as a tourism niche and more importantly to the future of mankind.” – Dirk Duran-Gibson, UNM Professor Emeritus”
https://www.spacedaily.com/reports/Left_in_the_dust_The_first_golden_age_of_citizen_travel_to_outer_space_999.html
Well, I think first civilian would that Russian guy who first went into orbit. Though one argue it was American guys in X-15.
But I think the distinction should be first commercial passengers/crew to space- which really has not happen, yet.
One could talk first adventurer into space, and could that been done.
Commercial is someone buying ticket for a trip, like on Airliner or train trip.
Or people aren’t selected [for various reason] rather there is ticket price and anyone can buy it. Or Boeing doesn’t select people going somewhere, anyone can buy what is offered- a seat from LA to London or whatever.
Or we are “working towards that”, I think joyrides are working towards that. I am a fan of joyrides.
What I call a pipelauncher would be large diameter pipe, 10 or 20 meters in diameter and 100 meter or more tall.
The pipe would be thin walled [made of titanium] and have one end capped. And if put in the ocean, water go into open end of pipe, and as fills with water, the open end part sinks, and capped end goes vertical. And acts similar to a spar bouy.
Once vertical, one let more air out and have top capped end be a few meter above waterline. And if dump/pour liquid air into the top, the liquid will vaporize when hit the water inside of pipe. This rapidly add air inside the pipe, and can cause pipe to go up vertically, very fast. And could put rocket on top of capped end, add liquid air, and make rocket go up, fast.
Breakwaters for ocean settlement.
Lots of pipelauncher type pipes, which also be 10 or 20 meter in diameter, but much shorter 100 meter tall, say 30 meter tall.
Or something a bit different. Have pipe which has flotation at the top, so top is about 1 meter above waterline. And waves go over the top and fall into the pipe opening- wave water falls in, but to go out the water falls down the pipe. Or each meter of water above waterline will have 1.47 psi of pressure. So 1/2 meter higher: 1.47 / 2 = 0.735 psi of pressure pushing water out bottom of pipe.
So flotation part can a slope which allows wave ride up it, then fall into the pipe.
If you want warm Earth, same thing but can pipe become smaller diameter and be 100 meter or more, so pushes water down 100 meter or more into the ocean. So causes warmer and more buoyant water under ocean with the .735 psi of pressure.
So, one can pump water using wave energy.
Climate models are 100% fudged to produce the desired results, have no predictive value whatsoever
https://youtu.be/XltFOh7Cg2U
A conference held at the very neutral European Institute for Climate and Energy, which is not a science institute, and whose slogan includes the sentence, “The climate is not at risk, but our freedom!”
A real scientist, John Christy recounts his views on models. As you can read about it rather than watch a 45 minute video, I suggest saving the time and googling his views.
Can you refute anything he says? Point by point please.
Why do you think that would interest me, Richard? What’s your point in asking?
Well if you cannot refute it….
Are you saying if I do not refute, therefore it is valid?
I am saying if you cannot refute it point by point then you are accepting it by default.
“I am saying if you cannot refute it point by point then you are accepting it by default.”
You’re kidding me. That is a concept that your brain thinks is valid?
Are you 12? Jesus Christ. This is some deeply dumb shit you’ve said here.
barry says: I am saying if you cannot refute it point by point then you are accepting it by default.
Youre kidding me. That is a concept that your brain thinks is valid?
This is the fundamental issue with unmoderated social media. If someone makes a dubious claim then one is faced with the choice to leave it unchallenged or to engage. If left unchallenged then other onlookers may presume the claim to be valid. If one engages with a bad faith actor, they are drawn into a food fight for which the bad actor gets to make up the rules. “Climateball”, if you will.
Inevitably such forums come to be dominated by actors engaging in trollish behavior. When it becomes clear that someone is not engaging in good faith and the conversation is unproductive, the best move is probably to disengage.
Sadly, I don’t have an attribution, but many years ago (USENET era?) someone made that observation to the effect, “The goal of internet forums is to show that you’re smarter than everyone else.” Sometimes the smart move is to walk away.
I’ve learned two things in the last couple of years here. 1) A cult has formed around the AGW nonsense. 2) A cult has no respect for reality.
Then, throw in the trolls that have NOTHING to do in life but spew their comments here, like RLH and Willard, who are always at the top of the list.
I don’t think they’re fooling everyone. They mainly just fool each other.
“That is a concept that your brain thinks is valid?”
Lack of refutation of a point must mean you accept it.
“If left unchallenged then other onlookers may presume the claim to be valid”
Do you accept what
https://climatedatablog.files.wordpress.com/2022/06/nino34-4.jpeg
shows? Especially as to the highs and lows of temperature.
It certainly shows what adding three months to a filter can do…
Make that 168 months!
Are you saying that the 15 year S-G is incorrect? Please post your version instead.
Or are you saying that the little blue boxes are? Remember where that data comes from.
“Lack of refutation of a point must mean you accept it.”
What if I tell you that I neither accept or deny it because I haven’t considered it? Or that I refuted it ages ago and I’m not interested in repeating myself?
If this doesn’t work for you, then the implication is that everything left unchallenged is true.
“Sometimes the smart move is to walk away.”
A good lesson I have forgotten in spades recently.
You obviously do not want to address the fact that min and max have not increased significantly in the Nino 3.4 record.
Max
1878 2.41 2.43
2016 2.56 2.11
Min
1890 -2.49 -2.11
1988 -2.18 -1.98
All he does is smudging zshit on this board , that’s his purpose here
Ralph Ellis in the comments. That reminds me:
https://judithcurry.com/2016/10/02/dust-deposition-on-ice-sheets-a-mechanism-for-termination-of-ice-ages/#comment-815238
Willard, please stop trolling.
Superdeveloping Triple La Nina Update
https://youtu.be/rQPKeGUYTGw
Does a La Nina mean that it is getting colder or warmer in the Tropics?
rlh…moved reply re weighting functions down here. Trouble posting.
rlh…your explanations sounds good to me but still not clear on why you bring in asymmetrical Gaussian curves. Are you possibly using the concept of weighted averages?
Found this relatively ancient paper on weighting functions from the 1960s. It goes into the initial theory long before the AMSU unit was formed. It explains how pioneers Meekes and Lilley derived the weighting functions using brightness temperature in 1963.
It’s still not clear to me why the abscissa has no units. That’s why I am being careful not to associate weighting functions directly with the AMSU units. If they were, the graph would associate microwave intensity with frequency per channel. Since that’s not the case, it becomes more obvious, as explained in the following link, that weighting functions are based on more obfuscated reasoning involving blackbody theory.
https://dspace.mit.edu/bitstream/handle/1721.1/53022/34089780-MIT.pdf?sequence=2&isAllowed=y
The person writing the article in the 1960s freely mixes absor.p.tion with emission. I don’t think he was that conversant with electron transition theory, even though he mentions it.
It appears the weighting function theory was based initially on O2 absor.p.tion of solar energy. There is plenty of information on the O2 spectrum. See Table 12 in index of article at link above. However, they don;t make it clear that the spectrum involves much higher frequencies that the gigahertz frequencies emitted by oxygen re AMSU units.
see…
https://hal.archives-ouvertes.fr/hal-00124609/document
If you haven’t seen it already, Roy’s primer on how its done might provide some useful info:
https://www.drroyspencer.com/2010/01/how-the-uah-global-temperatures-are-produced/
I had missed that. Thanks.
Yeah, thanks Barry…clarified a few points I’d missed.
Had not gotten the fact there is a difference in altitude between an AMSU unit scanning vertically and one scanning toward the horizon, it essentially increases the altitude of channel 5 distance-wise. Roy’s weighting functions are listen in pressure and I’m not sure how pressure would vary with the longer scan to the horizon.
Roys weighting functions are listen…
should be…
Roys weighting functions are listed…
Greater distance through the atmosphere at longer scans towards the horizon.
Symmetrical Gaussian curves are the response of any typical receiver for a single band. As the Earth’s atmospheric temperature varies with height this will create an asymmetrical pattern for any one single channel over the altitude/pressure/temperature it covers.
Different channel centers for each slightly different frequency will therefore cover different altitudes/pressures/temperatures. Put it all together and you have the AMSU chart as shown.
AMSU weighting curves
https://www.researchgate.net/profile/Ju-Hye-Kim/publication/264185361/figure/fig6/AS:670359808405513@1536837641234/AMSU-A-Weighting-function-for-standard-atmosphere.png
Lapse rate
https://imgur.com/a/TYfkNJT
Superdeveloping Triple La Nina – Official
La Nina Gone by April – not
https://34pejf387dm41c0xgyzoml71-wpengine.netdna-ssl.com/wp-content/uploads/2022/06/12jun22_mei-474×300.png
https://climateimpactcompany.com/monthly-enso-outlook-a-robust-la-nina-climate-continues-through-q3-2022-2-2/
Which April?
I’m only seeing two -1.5 MEI La Nina’s.
Or are you thinking we’ll trip dip into another -1.5 MEI La Nina by April of next year?
And why didn’t either of the strong La Nina’s take us below the 1981-2010 baseline like what many (including you) were predicting?
Was La Nina as bad as 1890?
I have no idea. AFAIK MEI has only been reconstructed back to 1950.
NOAA data goes back further, to 1870.
https://climatedatablog.files.wordpress.com/2022/06/nino34-4.jpeg
Isn’t that just SST anomalies from HadSST?
Are you saying that the data that NOAA publishes is wrong or that the original data from Had is?
I’m saying I don’t think it is MEI that you are looking at. The graph Eben post is of MEI showing a -1.5 in July 21 and May 22. I don’t know what the MEI was in 1890 or why it even has any relevance to my post here.
Are you saying that the MEI reports a different sea surface to the data I quoted?
MEI is a actually composite of SST, SLP, U wind vector, V wind vector, and OLR in the box bounded by 30S-30N and 100E-70W. So I think the answer is more of a yes to your question. It is definitely different than the simple detrended SST anomaly.
The data I quoted is not detrended.
“Isnt that just SST anomalies from HadSST?”
As published by NOAA, yes.
Oh okay. Got it. It is just the SST anomalies.
Which as Blinny shows below have a nearly 1:1 match between Nino 3.4 and ENSO.
https://drive.google.com/file/d/1AeK8oGGqzX27K60aYAn4JWDho-8lhwMl/view
and
https://climatedatablog.files.wordpress.com/2022/06/nino34-4.jpeg
match almost perfectly.
” It is just the SST anomalies”
Complexity does not always add to accuracy.
“climate models’ projections of future temperatures have gotten worse over time. As new generations of supposedly improved climate models are produced and refined, the accuracy of their temperature simulations decreases. Each new generation of general circulation models fails to track or correspond to a greater degree with measured temperature changes and trends than the previous generation”
Based on the information provided below I think we can answer the question. MEI in Jan/Feb of 1890 peaked at -1.73. In Apr/May of 2022 it is -1.68. By that metric the 1890 La Nina was deeper than 2022 by a hair.
So much for peak trends (both high and low) being x.yy degrees per decade.
I’m not sure I’m following you here. Can you clarify what you’re saying? How does that relate to the possibility of a triple dip La Nina and excursions below the 1981-2010 baseline?
Well there have been those on here who quote peak temperatures regularly.
It seems to me, when I look at the discussion above, that not everybody knows that NOAA’s MEI, the Multivariate ENSO Index
https://psl.noaa.gov/enso/mei/
has been, like was their NCEP data, extended back to 1871, with in both cases the help of Hadley’s HadISST1 data:
https://psl.noaa.gov/enso/mei.ext/
{ By the way: a very interesting detail of that extension in both the NCEP and MEI time series was to include one of the greatest ENSO signals since 150 years: the El Nino in 1877/78:
1983 5 2.89
1983 4 2.79
1983 2 2.74
1983 3 2.68
1983 1 2.57
1998 4 2.55
1878 3 2.50
1982 12 2.48
1998 2 2.43
1878 2 2.36 }
*
Since barry seems to have had some interest in a separation of La Nina and El Nino signals (MEI index = +0.5) I thought the best would be to present the entire MEI (v1 historical + v2 contemporary on the same baseline) with such a separation:
https://drive.google.com/file/d/1AeK8oGGqzX27K60aYAn4JWDho-8lhwMl/view
*
Having had a closer look at all historical doube/triple dip la Ninas in the extended MEI, I saw that some of them still were missing in my historical La Nina superposition. Thus, ‘dissecting the past’ {/sarc} once again gave this:
https://drive.google.com/file/d/1OFB3GczUOmJ-T1IwbmVFa3NuRaWpSIaO/view
*
This picture tells you not only that May 2022 was a really strong La Nina May month:
1893 5 -1.94
1910 5 -1.91
1876 5 -1.88
1971 5 -1.76
1917 5 -1.75
2022 5 -1.70
1892 5 -1.57
1890 5 -1.55
1911 5 -1.55
1955 5 -1.50
It also tells you that there were much stronger months before:
1893 7 -2.56
1893 8 -2.52
1893 9 -2.43
2010 7 -2.43
2010 8 -2.40
1893 6 -2.36
2010 9 -2.28
1975 10 -2.27
1974 2 -2.19
1975 11 -2.19
and that July 2010 was in the MEI record the fourth strongest of ALL months since 1871, on par with… September 1893 (2022 appears at position 62 in this all month sort).
*
Moreover, when I blogged years ago about how strong some El Ninos are (higher peak, longer duration), I was told by an educated Skeptic that the only correct way to compare events like ENSO consists of taking the sum of their indices and using it to compare something like their “integral” over the time series.
Here it is for the stronger 2 or 3 dip La Ninas in the superposition chart since 1871:
1892 -54.67
1908 -52.22
1973 -48.71
1954 -40.45
1915 -38.97
1998 -37.66
1873 -36.82
2010 -32.99
2020 -28.45
1970 -25.29
2007 -24.58
1949 -24.45
Means that until 2020-2022 reaches the average (-37.11) or median (-37.24) level in this list (between 1998 and 1873), it will have to ‘try a little bit harder’.
Malaysia called , La Nina not gone by April, they want their money back
https://youtu.be/g4887-1IDXY
Ebaby
Could you stop your 6-year old blah blah when we are discussing?
I know all you can predict is past but at least you could have enough sense to wait for the present La Nina to finish before you compare it to the past ones.
If you had a bit of courage, Ebaby, you would ask the NCEP and the MEI scientists about how much they have to observe and analyze the past in order to obtain a bit of prediction of the future.
But all you have is… crude polemics.
Like you did ? was it them MEI scientists who told you there was no sacond year La Nina coming ?
was it them MEI scientists again telling you it would be gone by April ???
Good one Bindiboy good one
NOAA’s un-trended anomaly Nino 3.4 data
https://climatedatablog.files.wordpress.com/2022/06/nino34-4.jpeg
Oh. Nice. I had no idea MEI reconstructions extended that far back.
If Nino 3.4 data extends that far, MEI will do also. See Blinny’s graph.
I’m not following you here. MEI requires a fully ocean-atmosphere coupled global reanalysis to calculate correctly.
MEI is strongly connected to Nino 3.4 as is shown by the graphs.
bdgwx, the 1871 to present reconstruction of ENSO is based on only SSTs and sea level pressure. The dataset from 1950 to present applies principal component analysis of 6 components, and the dataset beginning 1979 uses the ocean atmosphere models.
Still shows that peak temperatures (min and max) have not changed significantly over the whole period of record.
Does this mean that l’Hereux and co are mistaken about increased la Ninas recently? And what does the dataset you’ve been using suggest about that?
You obviously do now want to address the fact that min and max have not increased significantly in the Nino 3.4 record.
Max
1878 2.41 2.43
2016 2.56 2.11
Min
1890 -2.49 -2.11
1988 -2.18 -1.98
….You obviously do not want to address the fact….
“You obviously do now want to address the fact that min and max have not increased significantly in the Nino 3.4 record.”
I have already run trends for NINO3.4 and said they are not statistically significant. During our conversation. Which you presumably saw, as you replied to those posts.
You can’t derive a general trend from 2 data points.
. . . the only correct way to compare events like ENSO consists of taking the sum of their indices and using it to compare something like their integral over the time series. . .
Thanks for posting this. I don’t know about “only correct way”, but I was wondering what such a comparison might look like and hadn’t gotten around to working it out.
For a more ‘scientific’ approach, if you are going to do integrals, then it should be either side of 0 rather than the human chosen +-0.5 surely.
It is interesting that neither Blinny’s nor my graph show that there is much in the way of peak trends (high or low) over the whole period of time from 1870 to today.
Thanks for looking through the MEI data, Bin.
I’ve just been reading on how the data sets are made, and didn’t realize that there are 3 different methodologies for 3 of their data sets. I knew they’d gone from 6 components to 5 in MEIv2.
The dataset running from 1979 to present has 5 components incl zonal winds, air pressure, SSTs and OLR.
https://agupubs.onlinelibrary.wiley.com/doi/full/10.1029/2019GL083946
The dataset from 1950 has 6 components, no OLR component, and includes cloudiness fraction.
https://psl.noaa.gov/enso/mei.old/WT1.pdf
The dataset from 1871 rests on 2 components, SSTs and sea level pressure.
https://rmets.onlinelibrary.wiley.com/doi/full/10.1002/joc.2336
As datasets are being compared, thought it was good to understand that there are methodological differences, as you alluded to.
Any comment on the lack of peak trends over the whole series?
There was no analysis on this, just graphs to look at.
I’d be quite pleased to s some analysis of it from the MIO dataset. Yet another alternative dataset to test several contentions up in the air.
My keyboard is dying – sorry for typos
On those graphs it shows quite clearly that what I said is true. Do you dispute that?
As soon as you speak about trends on variable data, you need to show some work. Eyecrometer is debatable. Let’s have analysis. I’ve done some preliminary stuff.
I already said that there is a large anomaly (el Nino) early in the record, followed by what appears to be an inclining set of el Nino peaks. You have pointed at the same early anomaly, and appear to be claiming that this means there is no trend for the whole record.
I point out the last 25 years (per the article on recent la Ninas) and you ignore that and instruct me to pay attention to the early big el Nino. I’ve done some simple analysis, whether you want to discuss that period or not.
I’m not sure what you’re trying to prove, but it seems little related to anything I’m saying.
I am looking at the min and max temperatures over the whole 3.4 record from 1870 to 2022.
Max
1878 2.41 2.43
2016 2.56 2.11
Min
1890 -2.49 -2.11
1988 -2.18 -1.98
Not so much a large x.yy per decade trend there.
Sorry, what was the trend for what period?
To make things clear to those who don’t like to think: when I write
” Means that until 2020-2022 reaches the average (-37.11) or median (-37.24) level in this list (between 1998 and 1873), it will have to ‘try a little bit harder’. ”
this means that even bypassing the 2010, 1873 and 1998 editions needs a lot of consecutive negative MEI indices.
And to bypass 1973 means for example a -1.5 index during at least 13 months.
Are we really on that road, right now?
https://i.postimg.cc/3RfwHxns/nino34-Mon140622.gif
And here I was thinking that min and max (and middle) were much more important than either mean or median.
Why don’t you explain and describe the process how you use this to produce persistently wrong forecast ???
The best way to understand why and how the recent records for NCEP’s NINO3+4 and MEI differ, is to look at NCEP’s record for NINO1+2, whose window (0S-10S — 90W-80W) is contained in MEI’s far more extended ENSO window (30N-30S — 100E-70W versus 5N-5S — 170W-120W for NCEP’s NINO3+4).
1. NCEP: NINO1+2 vs. NINO3+4 for 1982-2022
https://drive.google.com/file/d/1AVnVuURIXzmFVcJnkvaBwty4qKW8toQH/view
2. MEI V2 for 1979-2022
https://drive.google.com/file/d/104-NTnvbIKC5h9LNuH7XfAAoEtbPzYEw/view
In NCEP’s NINO3+4 data, centred around the SSTs in that small region, the 2016 El Nino is highest.
MEI however shows 1982 highest, immediately followed by 1998, and then by 2016: exactly like in NCEP’s NINO1+2.
This is interesting in so far as the average NINO1+2 temperature for 1982-2022 is 23.2 C, a lot lower than NINO3+4 average: 28.5 C.
MEI is much, much more than NINO3+4′ SST.
But
https://drive.google.com/file/d/1AeK8oGGqzX27K60aYAn4JWDho-8lhwMl/view
and
https://climatedatablog.files.wordpress.com/2022/06/nino34-4.jpeg
match all most perfectly.
Here is a Savitzky-Golay smoothing of the historical NCEP NINO3+4 data, with a 30-year window (180 months before, 180 after):
https://drive.google.com/file/d/1_P-AJeGfRiqLf7PYmpeXiNnran5LCWqe/view
Here is the Nino 3.4 data with a 15 year HQLP (High Quality Low Pass) filter added. The S-G portion for recent trends is also added.
https://climatedatablog.files.wordpress.com/2022/06/nino34-4.jpeg
Nice to see someone other than me using S-G in climate. S-G is a HQLP filter rather though than just a ‘smoothing’ one which is often used in a derogatory fashion.
15 years as a choice of LP corner comes from the fact that there is little energy in the system at that frequency and it shows well all frequencies above that point.
….all frequencies that are longer than that point….
15 year?
This filter plot is way too flat for a 15 year window.
Plot a 15 year SRM instead then.
Too smooth you mean?
1. ” Nice to see someone other than me using S-G in climate. ”
You behave like how you name others: an arrogant twat.
People involved in climate science are using SG since mucvh longer time than you yourself know about it.
Google helps.
*
2. ” S-G is a HQLP filter rather though than just a smoothing one which is often used in a derogatory fashion. ”
You seem to behave as if you yourself would know a lot more about the Savitzky-Golay filter than the two chemists/physicists who invented and implemented it:
Savitzky, A., Golay, M. J. E.
Smoothing and differentiation of data by simplified least squares procedures.
Analytical Chemistry, 1627–1639(1964).
And above all: you love to discredit anything that does not fit your egocentric narrative.
Smoothing is often used in a derogatory fashion. Especially on here.
“People involved in climate science are using SG since mucvh longer time than you yourself know about it.”
On here?
“In attempting to analyze, on digital computers, data from basically continuous physical experiments, numerical methods of performing familiar operations must be developed.
The operations of differentiation and filtering are especially important both as an end in themselves, and as a prelude to further treatment of the data.
Numerical counterparts of analog devices that perform these operations, such as RC filters, are often considered.
However, the method of least squares may be used without additional computational complexity and with considerable improvement in the information obtained. The least squares calculations may be carried out in the computer by convolution of the data points with properly chosen sets of integers. These sets of integers and their normalizing factors are described and their use is illustrated in spectroscopic applications”
It would appear that your implementation of S-G is letting through too much high frequency (the line wobbles a lot in the short term).
This is probably either because your implementation is faulty or you are using a much higher order of curve to fit to the points.
I verified my 15 year S-G implementation against a 15 year CTRM to validate its accuracy.
You really mean your CTRM stuff, that shown in
http://wattsupwiththat.files.wordpress.com/2010/07/uah-with-annual-ctrm.xlsx
Really? That one?
https://i.postimg.cc/KjyK2qHw/LH-UAH-CTRM-orig.png
*
Strange things happen these days!
Because both a running mean and the SG filter show that your alleged ‘annual’ filter
https://i.postimg.cc/vTDKGhx7/LH-UAH-CTRM-with-RM-SG-12-month.png
in fact behaves rather like a 16 month filter:
https://i.postimg.cc/90qBxnqk/LH-UAH-CTRM-with-RM-SG-16-month.png
But, as usual: the entire world, especially Libre Office Calc and a 12 year old SG implementation: all that is wrong because Linsley-Hood is by definition right.
How could it be else?
Yup. The same good old CTRM that Vaughn Pratt showed is near gaussian in its overall response curve. He also showed it has a better frequency response to Simple Running Mean.
You can test the outputs against SRM if you like but that has known defects.
Here is an up to date UAH LT.
https://climatedatablog.files.wordpress.com/2022/06/uah_lt.jpg
Notice the similarities to those posted a long time ago now.
As your S-G implementation has been shown to be very inaccurate elsewhere….
Where was that?
See above. How can an long term S-G show such small deviations on such a short timescale?
I implement a 12 month CRTM with the values 12, 10, 8 months as the nearest integer values that correspond to the
12
12 / 1.2067 = 9.94447667191514 = ~10
12 / 1.5478 = 7.752939656286342 = ~8
values that VP suggested.
P.S. Here is a SRM (12 month) and some 12 month CTRMs
https://climatedatablog.files.wordpress.com/2022/06/uah.jpeg
P.P.S. Sorted out the difference between a bar chart and a histogram yet?
Managed to finally having enough technical skill and ‘cojones’ to start a fair contest concerning a comparison of monthly USCRN data processing?
1. Absolute temperatures
https://drive.google.com/file/d/1BhgrAn-eVrX9JZUhr_y4ceVWAKsXtqml/view
2. Anomalies
https://drive.google.com/file/d/1_F00TcPvlRBk4NQ8GR_Q6cdhUtQ4CUIQ/view
Where is your monthly averaging of subhourly data for middle, median and mean, Linsley-Hood?
*
Whether a temperature distribution is or is not a histogram doesn not matter that much. What matters is the significance of the distribution.
And until now, you weren’t even able to present such a distribution contradicting mine.
This is so poor, Linsley-Hood…
Sorted out the difference between a bar chart and a histogram yet?
“Whether a temperature distribution is or is not a histogram”
A time series is not a histogram or a distribution.
Sorted out the difference between a time series and a distribution yet?
Can you say that your S-G really smooths things (to use your preferred terminology) when it leaves so much unsmoothed data in its 30 year output?
I’m wondering since years why some people think that the ENSO record could ever show a trend like does e.g. the global sea surface temperature.
Nevertheless, the more or less neutral ENSO balance observed since the 1870’s (La Nina somewhat over 50%, El Nino somewhat below) is changing.
If we count, beginning with different years, the absolute ratio
La Nina / (La Nina + El Nino)
out of the MEI values below/above the corresponding treshold for the corresponding period from these years till now, we obtain:
1871 56 (%)
1901 53
1931 53
1951 54
1981 53
1991 59
1996 68
2001 71
2011 72
This looks like a major change.
No idea what this exactly does mean, except the trivial idea that in the Equatorial Pacific, increasingly more heat might be dumped from the atmosphere into the ocean than is conversely extracted.
No se.
Some will know…
If the sea surface peak temperatures do not change and the ratio alters towards the colder end then global air temperatures will surely follow that trend. Eventually.
I thought you said that AMO outweighs ENSO?
In terms of area it does.
Me: So you are saying that global temps are unaffected by ENSO?
Thee: The AMO has a greater weight in my opinion.
Were you not speaking of the relative impact on global temps here, based on the notion of greater area?
Well there is this to consider.
https://imgur.com/gallery/jtDg4ir
Ok, so we don’t have to wait? The AMO is already the leading cause of interannual variability?
Here’s my comparison of AMO and global temps – no need to detrend.
https://tinyurl.com/2f5dytxk
I see what seems to be a strong correlation between the two. But which leads the other?
It looks like most of the time global temps lead the interannual changes, sometimes not.
I wish I knew how to determine that statistically.
Adding detrended PDO.
https://tinyurl.com/3dpj3mad
Plenty of eyeball correlation interannually, but doesn’t seem as good as with AMO.
PDO and Had
https://imgur.com/a/92m6X5x
do not seem to lead or lag each other consistently.
I think that is so.
People who monitor the AMO say:
“The AMO is an ongoing series of long-duration changes in the sea surface temperature of the North Atlantic Ocean, with cool and warm phases that may last for 20-40 years at a time and a difference of about 1°F between extremes. These changes are natural and have been occurring for at least the last 1,000 years.”
They don’t think that interannual variation is a signature of the AMO, just the long-term stuff.
You are the only person I’ve ever seen who thinks that AMO operates on ENSO time scales.
I’m just going to flat out say you’re wrong about that.
There is no reason to anticipate that AMO might start oscillating on interannual scales (if indeed the oscillation is a fact).
This is predictions
https://twitter.com/mazemoore/status/1536353154731745280
As forecasted here:
https://www.drroyspencer.com/2022/06/uah-global-temperature-update-for-may-2022-0-17-deg-c/#comment-1315570
Willard, please stop trolling.
Professor John Christy Interview
https://youtu.be/Fwi_WtQmjuo
thanks Eben…good one.
John Christy should be required watching for politicians but I fear his wisdom is wasted on them. I recall him testifying at a Senate hearing in which Hilary Clinton sat with folded arms glaring at him. That’s why, when she lost to Trump in 2016, I stood and cheered, due to her rudeness to John. She is typical of the dumbasses out there who lack the brains to understand the simply message John is delivering.
At one point in another interview, he had to remind the interviewer that his science is based on real data. Politicians today are stupidly mesmerized by IPCC bs, based on pseudo-data from unvalidated climate mpodels. As John pointed out, it’s not the major part of the reviews that is at issue, it’s the political views offered by the Summary that is the problem.
While searching for something unrelated, I came across the equation for radiative forcing…
RF = 5.35ln(CO2now/CO2orig)
Obviously the units for CO2 cancel leaving a dimensionless value for the forcing. This is utter nonsense because it has no scientific basis, only the opinions of alarmists.
The definition of forcing itself is vague. The IPCC seems to define it roughly as the difference in the energy budget due to anthropogenic gases. In other words, the AGWs are warming the planet according to the formula above.
I tried following through a derivation of that formula (there are several) and gave it up as an exercise in futility due to the pseudo-science involved.
Basically it comes down to one, or both, of the prevalent AGW theories. One is that CO2 is adding a flux to incoming solar to increase the warming effect of the Sun. That is sheer nonsense for several reasons.
The most glaring fault is that it contradicts the 2nd law. In order to get around the 2nd law, which requires that no heat be transferred from a cooler atmosphere to a warmer surface (that warmed the atmosphere, according to AGW theory), alarmists invented the dubious theory of a net energy balance. If that mysterious net balance is positive, the 2nd law is deemed to be satisfied.
A third fault is that the terrestrial IR spectrum is pretty well off the end of the solar spectrum. That means, even if back-radiated IR could be absorbed by the surface and warm it, it could not be added to solar energy.
The net balance of energy is never explained. The sticking point is that the 2nd law is about thermal energy only. It states very clearly, that heat can never, by its own means, be transferred from a cooler region to a hotter region. There is no ‘net’ in the 2nd law, and if there was, it applies only to heat. Therefore, it holds that heat can never be transferred from a cooler atmosphere, or one in thermal equilibrium, to a warmer surface.
If the surface does supply the heat to GHGs, for them to back-radiate some of it to the surface so that the surface warms to a higher temperature than it is warmed by solar energy, we have heat amplification. It doesn’t matter what explanation is offered, the heat amplification represents perpetual motion.
Not only the 2nd law is contradicted, the considerable losses in the cycle are being completely ignored. For one, only 5% of surface radiation is absorbed by GHGs, and of that 5%, probably only about 2% of the absorbed energy is back-radiated. Yet that 2% is meant to make up for the losses of the 95% surface radiation escaping the GHGs.
*****
As for the other AGW theory, that GHGs in the atmosphere slow heat dissipation from the surface, that is a direct contradiction of Newton’s Law of Cooling. Newtons law of cooling states clearly that heat dissipation is directly proportional to the difference in temperature between a body and the temperature of its environment.
The temperature of Earth’s surface environment is the temperature of the entire atmosphere, which is 99% nitrogen and oxygen. Therefore, it is the temperature of the nitrogen and oxygen in the atmosphere that determines the rate of heat dissipation, not the trace amounts of GHGs.
It is argued by alarmists that GHGs are responsible for heating the atmosphere, which is nonsense. This notion comes from a myopic and incorrect application of the Stefan-Boltzmann equation applied to the Earth surface as if it were a blackbody.
It is unknown, given the conditions of a trace gas in a gas mix where two other gases make up 99% of the mixture, what kind of effect one CO2 molecules in 2500 N2 and O2 molecules would have. The Ideal Gas Law gives us an idea. With CO2 at 0.04% of the mixture and N2/O2 at 99%, the CO2 could not warm the mix any more than its mass percent, of about 0.04%. That would mean about 0.04C per 1 C warming of the entire gas mix.
Alarmists conveniently ignore the fact that nitrogen and oxygen absorb heat directly from the surface via conduction. That heated air rises and is replaced by cooler air from above. Once heated by the surface, N2/O2 cannot radiate the heat away and it is retained for a considerable period of time.
That heating of N2/O2 is essentially the greenhouse effect, as it occurs in a real greenhouse. GHGs have little or nothing to do with the process, since radiation at terrestrial temperatures represents a poor means of heat dissipation. In a home, heat loss due to radiation is ignored since it is insignificant.
Anther Gordo blast of previously debunked garbage, especially this concluding crap:
The vertical convection in the atmosphere is the result of the interaction of warmth of the air near the surface plus the fact that water vapor is less dense than O2 or N2. a parcel of air “rises” as the result of hydrostatic pressure from the cooler, denser surrounding air, which lifts the parcel upwards. As the parcel rises, pressure drops and the WV can condense and rain out. As the WV condenses, it warms (heats) the parcel, promoting more upward lift. Eventually, the now dry parcel cools and mixes with the surrounding air.
Question for Gordo. What process cools the parcel and the rest of the upper air? Where does the energy go? HINT: The only mode of cooling left is IR radiation to space by greenhouse gasses.
swannie…”Question for Gordo. What process cools the parcel and the rest of the upper air? Where does the energy go? HINT: The only mode of cooling left is IR radiation to space by greenhouse gasses”.
***
Ever heard of the Ideal Gas Law? Apparently it is out of vogue.
PV = nRT
Keep V constant and n constant.
P becomes directly proportional to T.
What happens to pressure versus altitude, it decreases? That means temperature decreases without any radiation to anywhere.
We are so hung up on the notion of energy conservation that we have overlooked several factors. Thermal energy can dissipate naturally simply by changing the pressure in a constant volume. If you consider heat to be the average kinetic energy in a gas, what happens if the gas molecules slow down naturally?
The gas cools.
Why? When an amount of gas is forced into a volume, the molecules collide with the container surfaces much more often and with each other. Pressure increase; temperature increases. Increase the volume and the pressure decreases and the temperature decreases.
The atmosphere creates the container with constant volume while changing the pressure with altitude. As you go higher in altitude in the troposphere, the pressure decreases and it gets colder….naturally.
gordo’s ignorance of the atmospheric sciences is profound. He wrote:
His reply proves that he has no clue about how the convection in the atmosphere actually works. His rant ignores the well known “adiabatic” lapse rates, both moist and dry, and how they figure in the flow of energy from the Sun thru the atmosphere and than out to deep space. His world view precludes any cooling in the troposphere, which is necessary for the presence of the colder upper air which he points to. Without that loss of energy (i.e., “cooling”) his scenario falls apart.
Gordo the troll would be as dangerous as Mr. Trump, with his incessant claims that he won the 2020 election, if anyone actually paid attention to his rants.
Swanson, please stop trolling.
It seems consistent with observations: Giss_vs_CO2.png
Note that this figure estimates temperature change rather than surface energy change, but the log relationship looks more than reasonable.
mark…do you mean you are one of those brave souls who take GISS seriously?
I regard them as fudgers of the highest order. Tony Heller and chiefio have revealed their chicanery in great detail.
Come on, Gordo.
Do you mean you are one of the few cranks who take Teh Goddard and Chiefio srsly?
I regard them &c.
https://www.drroyspencer.com/2022/06/uah-global-temperature-update-for-may-2022-0-17-deg-c/#comment-1315870
https://www.drroyspencer.com/2022/06/uah-global-temperature-update-for-may-2022-0-17-deg-c/#comment-1315930
Willard: Do you think the models are inaccurate despite real data showing otherwise?
Willard: Do you think the models are accurate despite real data showing otherwise?
(Removed the double negative).
Which part of “all models are wrong, but some are useful” you do not get, Richard?
Which part of ‘if you rely on models that are wrong it can get very expensive’ did you not get?
The part where you show how to access reality without a model, dummy.
Most of us can access reality without a model. It’s called real life.
Good luck with that:
https://www.theatlantic.com/science/archive/2016/04/the-illusion-of-reality/479559/
But even if you are granted direct access to reality through your real life experiences, this has nothing to do with climate, which spans on a 30-year time frame.
Reference periods span 30 years (typically), not climate.
The illusion of reality seems to operate quite well if a human being meets a very large object traveling at speed in the opposite direction.
The point you cannot dodge is that experience is more or less immediate whereas climate is not, Richard.
Egocentrism coupled with a lack of empathy and rigid verbal behaviour may not always help grasp statistical concepts.
Being an idiot such as you are does not help with rational discussion either.
Figured out yet that rationality is not an everyday concept, Richard?
Figured out how not to be an idiot yet Willard?
Did you know how we conceive rationality, Richard?
With models:
> Some models of human behavior in the social sciences assume that humans can be reasonably approximated or described as “rational” entities, as in rational choice theory or Downs’ political agency model.[4] The concept of bounded rationality complements “rationality as optimization”, which views decision-making as a fully rational process of finding an optimal choice given the information available.[5] Therefore, bounded rationality can be said to address the discrepancy between the assumed perfect rationality of human behaviour (which is utilised by other economics theories such as the Neoclassical approach), and the reality of human cognition.
https://en.m.wikipedia.org/wiki/Bounded_rationality
Models, Richard! Models!
Do you think they are *accurate*?
You are an idiot, Willard.
No U, my dearest Richard.
Ready to acknowledge that you rely on models like everybody else?
Willard, please stop trolling.
“The illusion of reality seems to operate quite well if a human being meets a very large object traveling at speed in the opposite direction.”
Yes indeed. Like an asteroid. Or a hurricane.
Knowing ahead of time about an encounter with either one of these depends largely on modeling. Imperfect modeling.
Imperfect, but useful, if we decide not to ignore them.
Of course we have seen how often people ignore Hurricane forecasts, and often regret it.
Mark B, the consistency you’re observing is called “correlation”. It is well known that rising temperatures cause increased atmospheric CO2. But we know from the laws of physics that CO2 can not cause an increase in temperatures. Some people believe that CO2 can raise temperatures, but they don’t understand any of the science. To believe CO2 can warm the planet you must believe ice can boil water.
Not that again, Pup.
Willard, please stop trolling.
That equation is attributed to Arrhenius. He was involved with the creation of the Nobel Prize Committee. He managed to get himself a Nobel Prize. He was the Michael Mann of his time!
They do attach units to the “forcing” — Watts/m^2. The same units as solar flux! The bogus equation creates energy out of thin air, literally.
But we shouldn’t be surprised. The cult isn’t interested in science. They have their agenda, and reality doesn’t matter. They even believe you can boil water with ice cubes!
clint…”They do attach units to the forcing Watts/m^2″.
***
That’s the humourous part, you can clearly see that all units cancel level no units. The real hilarity comes trying to explain the relationship between the mythical forcing and the CO2, a trace gas.
Gordon Robertson
Once again you show a very shallow research ability. You demonstrate you are not out to find the truth of anything but more interested in deception and falsehood. Sad you are like that, at least the dishonest Alex Jones (as stated by his coworkers) does it to make money. You seem to lie just because it is in your nature to lie and deceive.
Here:
https://www.acs.org/content/acs/en/climatescience/atmosphericwarming/radiativeforcing.html
The equation has Watts/m^2. In some versions they eliminate writing it as it is assumed by earlier works that the 5.35 is in the units Watts/m^3 and not a dimensionless unit.
If you want to make claims about dishonest people (like the scientists you denigrate) maybe clean up your own act and first you try to be honest and truthful then your criticism of others will have more impact. As it stands you seem to lie and distort on a daily basis with no obvious reason.
Norman, since you’re trying to pass yourself off as an expert on research, did you ever find any science to support your belief that Earth has a “real 255 K surface”? How about your belief that two 315 W/m^2 fluxes can heat a surface to 325 K?
Or, exactly pertinent to your comment, where does the 5.35 W/m^2 come from?
The correct answers are:
* Earth does NOT have a “real 255 K surface”.
* Fluxes don’t simply add, so two 325 W/m^2 fluxes can NOT heat a surface to 325 K.
* The “5.35” value is entirely made up.
Gordon Robertson
This article concerns a Conspiracy Theorist. Evidence is of no value. It does explain why people like you think the way they do and why it is impossible to change your false beliefs.
https://www.yahoo.com/news/sandy-hook-conspiracy-theorist-says-022537752.html
From Article: “Moving the goalposts of an argument in this way is a common tactic among conspiracy theorists, who are often driven by feelings of superiority and specialness and think they know something other people don’t.”
You are stuck in your false ideas by feelings of specialness and superiority. Nothing can change this state it seems, the woman was losing her family but the sense of being “special” was more valuable then here family.
You’re moving the goalposts again, Norman.
Your problems are related to you being inadequate and incompetent. You seem to be seeking acceptance by clinging to the cult. That’s why you’re always interested in personalities over substance. You swallow anything Folkerts or Ball4 put out.
Did you ever find any science to support your belief that Earth has a “real 255 K surface”?
How about your belief that two 315 W/m^2 fluxes can heat a surface to 325 K?
You’ve still got NOTHING, huh?
Did you ever find the ‘real’ surface of a cloud or a fog bank?
RLH, do you even have a clue what this is about?
You seem to want a ‘surface’. I am asking you where that ‘surface’ is in a similar fashion.
Yeah, as I figured. You don’t even understand the issue.
You are here all the time. You need to learn to follow the issues before commenting.
You are asking for a radiation ‘surface’. I am too.
WRONG, RLH. You don’t have a clue about what the issue is.
The “issue” is Earth does NOT have a “real 255 K surface”. Go back and research my previous related comments before commenting further.
It has a real 255K surface in the same way that a cloud or a fog bank has a surface as well.
Failing to follow and understand the related comments means you are uninformed about the issue, RLH. And that means your comments are missing the point.
I predict nothing will change.
https://www.physics-in-a-nutshell.com/article/17/surface-temperature-of-the-earth
RLH proves me right, again.
It’s not that I’m clairvoyant, it’s that he’s so easy to predict. He always behaves the same.
For example, he will have to get the last word in here, even though he has NOTHING to add.
https://www.drroyspencer.com/2022/06/uah-global-temperature-update-for-may-2022-0-17-deg-c/#comment-1317440
“Obviously the units for CO2 cancel ”
Er… no. They are two different values.
But wait. You couldn’t possibly be…. are you?
RF = 5.35ln(CO2now/CO2orig)
Please tell me you are not saying that the term ‘CO2’ cancels in this equation.
barry, this is just another example that you don’t understand ANY of this.
In the equation, CO2 has the “units” of “ppm”. The units cancel because of the division.
Your understanding of the science here is so bad that you have to resort to insults and false accusations, just like the others.
CO2_now / CO2_orig is a unitless ratio.
The coefficient 5.35 has units of W/m^2.
The formula is presented as an approximation to CO2 forcing from Myhre, et al 1998.
The models that are based on CO2 concentrations are running too hot. Especially in the Tropics.
https://www.drroyspencer.com/2022/06/uah-global-temperature-update-for-may-2022-0-17-deg-c/#comment-1315870
> The models that are based on CO2 concentrations
As opposed to which ones?
The ones that aren’t.
How many of them do you know?
The ones that the IPCC say are not distorted in future projections on temperature. Oh, and natural cycles.
So you do not know any.
Got it.
So the IPCC models are accepted by them as being wrong but we should use them anyway.
Sorted out why min and max temperatures have not increased that much since 1870ish in the central Pacific yet?
RLH, we don’t have to use the CMIP suite of models. If there is an alternative that provides the same climate metrics that performs better than the CMIP suite I’d like to know about. If you have a link I’d be more than happy to download the data and plug it into my spreadsheet for review.
“we dont have to use the CMIP suite of models”
Good.
Do you know of an alternative that can be used?
Why use models at all?
That’s one of the most important points of science. We create models to observe, explain, and predict the world around us.
They are only useful models if they are accurate, and IPCC has admitted they are not accurate.
Your model is not better because you cannot admit anything, Richard.
Sorry, did I say model? I meant analysis.
I don’t do models, only measurements.
What are your filters measuring, Richard?
Measurements themselves require models. The method that UAH uses for measuring atmospheric temperatures is a complex model that is itself a web of models built upon models built upon models and so on. Even just measuring temperature with a PRT requires a model to map material and electrical properties to meaningful temperature values.
And models don’t have to be perfect to be useful. No model is perfect and they never will be. That does not mean we should abandon them for nothing at all.
“What are your filters measuring”
Changes in the data.
“Measurements themselves require models”
Only if you define linear interpolation as a model.
https://en.wikipedia.org/wiki/Linear_interpolation
A model is anything that accepts inputs and produces outputs using heuristics, equations, algorithms, etc. Linear interpolation is a simplistic model, but a model nonetheless. That’s moot though since UAH goes way beyond simple linear interpolation. Even just the MSU radiometric output calibration using PRTs requires more than just a simple linear interpolation since their are heuristic involved. And that doesn’t even take into account the instrument body temperature effect which requires the use of yet another model to determine the magnitude of the effect and how to resolve it. And that’s only for the MSU calibration itself which is but a small part of the bigger method. You’ve got radiative transfer models, limb darkening correction models, linear diurnal drift models, non-linear diurnal drift models, deconvolution models, gridding models, etc. UAH and its dependencies is a smorgasbord of model use. If you don’t like models then you probably aren’t going to be satisfied with UAH or anything insights and understanding that science gives us in general.
bdgwx, you are limiting your discussion of models to computer models. There are other models.
For example, a ball-on-a-string is a model of “orbital motion, without axial rotation”.
Astrologers don’t like that model….
… as viewed by the person swinging the ball.
… as viewed by the person swinging the ball around.
And, as Ball4 reminds us, astrologers AND braindead cult idiots don’t like that model.
Sorted out how these changes in the data are established, Richard?
The LP filters show how the data has changed. The ups and downs cannot be CO2 related, so natural factors must be responsible instead.
“Linear interpolation is a simplistic model, but a model nonetheless”
So simple that it has been used since time immemorial. So much so that few regard it as a model, simply an observation of fact.
“MSU”
We are using the AMSU nowadays on a stable satellite which has a lot less problems with its interpretation between readings and temperatures.
All of which have been verified against both balloon and reanalysis sources.
A ball-on-a-string is only a model of a stick rotating around one end. aka, a section of a disc.
RLH, you can try to pervert the simple ball-on-a-string all you like. You can claim it is something it isn’t. You can claim it’s a model of a disc, or a stick.
But, it’s still only ONE motion. A ball on the edge of the stick would always have the same side facing the center. The ball would not be rotating on its axis.
You can’t pervert reality no matter how hard you try.
But, you’ll keep trying….
Clint’s ball would not be rotating on its own axis as observed by the operator.
Figured out that if a model was a structure with an interpretation that is exactly what you are relying on for your cycle nut stuff, Richard?
A HQLP, such as S-G, filter applied to the data is quite normal in a range of scientific fields.
“you can try to pervert the simple ball-on-a-string all you like”
One thing leads to another quite simply.
Thus:-
A ball-on-a-string leads to a stick-rotating-about-one-end.
A stick-rotating-about-one-end leads to a section-of-a-disc.
Protest all you like. Those are the facts.
…sure, and it changes absolutely nothing. Your point is pointless.
barry…”Lets be really clear about this: satellites do not measure air temperature. Temperatures are inferred from the reading of microwave emissions from O2 molecules involving a fairly complex process that involves several layers of calibration…”.
***
It’s not an inference. Oxygen emits the microwave radiation based on its temperature, otherwise there would be no point using the emissions. If there is an inference it’s that the temperature indicated by the colour temperature of the O2 emissions is related to a certain altitude.
As Roy indicated in his explanation of AMSU units, they use two set points: one is a temperature source within the AMSU unit and the other is deep space, estimated at 2.7K. The frequency of microwave emission is interpolated in between those set points as a temperature, just as with a thermometer.
That’s about all a thermometer does with the exception it uses a different methodology. It has two set points: the temperature at which water freezes and the temperature at which it boils, related to the expansion of mercury with temperature. The interval between those set points is divided into 100 on a Celsius thermometer and indicates relative heat levels between those points.
With the AMSU units, the frequency expected from 2.7K should be known and that of the temperature source within the AMSU unit. The frequency of the received microwave radiation is apparently correlated between those two set points.
The trick is to correlate the microwave frequencies with altitude to get the temperature at that altitude. Apparently it works since UAH is able to correlate the sat temps with radiosonde data.
“The trick is to correlate the microwave frequencies with altitude to get the temperature at that altitude”
The various reception bands within the AMSU unit do that along with a lapse rate curve and the results can then be verified against balloon data.
Gordo blows it again, writing:
Gordo continues to display his inability to understand the science. The MSU and AMSU instruments use a change in received IR intensity, NOT FREQUENCY to define a scale of brightness temperature. Each channel measures intensity at a single, precisely set frequency, that intensity said to represent the total temperature related emission and absorp_tion from the surface to the instrument.
“Each channel measures intensity at a single, precisely set frequency”
Actually each channel is not a single frequency but a gaussian spread that covers frequencies near the central value that it is ‘tuned’ to. That measurement directly translates into a temperature (see Roy’s graph elsewhere). As temperatures decreases with height (lapse curve) each slightly different central frequency will ‘see’ values higher and higher up in the atmosphere.
rlh…”each slightly different central frequency will see values higher and higher up in the atmosphere”.
***
And lower than the central frequency. Look at channel 5, the channel used primarily by UAH. The central frequency is around 4+ km but it receives microwave frequencies above and below that altitude. Channel 5 reception goes all the way to the surface although Roy explained there are issues using the data right to the surface.
“but it receives microwave frequencies above and below that altitude”
Yup.
….As temperatures decreases with height (lapse curve) each slightly different central frequency for each channel will see values higher and higher up in the atmosphere….
And…as the scanner sweep toward the extremes, east to west, or maybe west to east, the apparent altitude changes due to the longer beam length. Therefore the centre frequency changes a bit too and represents a slightly higher altitude. .
Neat stuff.
It is more the actual numbers that are in different latitudes for each slice changes.
The received intensity in each channel is the integral of the full atmospheric column emission as attenuated by the integrated path loss at the particular channel frequency. As the microwave path loss becomes greater (channel frequencies closer to the nominal 60 GHz absorp_tion peak) emissions further from the satellite receiver (lower in altitude) are more attenuated than nearer emissions (higher in altitude), thus on average represent higher altitude emission.
It’s conceptually similar to the “effective radiating altitude” abstraction albeit in a relatively narrow band.
See Global Atmospheric Temperature Monitoring with Satellite Microwave Measurements: Method and Results 197984 / Spencer, Christy, Grody 1990
https://www.drroyspencer.com/2010/01/how-the-uah-global-temperatures-are-produced/
RLH, FYI, The instruments measure the intensity of received microwave energy. There is no change in frequency.
For the AMSU-A, the channel measurement frequencies are fixed (GHz):
5 53.596 0.115
7 54.940
9 57.290
The bandwidth at 3dB down are (MHz):
5 168,168 – ?
7 380
9 310
“The instruments measure the intensity of received microwave energy. There is no change in frequency”
The center frequency for each band changes as you move from band to band. The individual bands are directly related to the altitude measured.
Thus the AMSU diagrams as shown.
RLH, Yes, each channel (MT, LT and TP) are measures of intensity at discrete frequencies as listed above. It’s the atmospheric transmission / absorp_tion which determines the intensity which is the actual variable measured. The weighting functions are theoretical calculations of the altitude weighting resulting from the sum total of these effects. This complex physics results in the single value recorded at each scan position.
So why does each band in the ASMU relate to different altitudes?
RLH needs to read his references more closely. The channels are selected for different frequencies near 60 GHz in the O2 spectrum because the theoretical physics says that the emission peaks at these frequencies occur at different pressure levels. This theory is based on those calculated weighting functions.
Misplaced response that should have been here: https://www.drroyspencer.com/2022/06/uah-global-temperature-update-for-may-2022-0-17-deg-c/#comment-1317218
https://www.drroyspencer.com/2010/01/how-the-uah-global-temperatures-are-produced/
“the theoretical physics says that the emission peaks at these frequencies occur at different pressure levels”
Are not pressure/temperature/altitude directly related?
the theoretical physics says that the emission peaks at these frequencies occur at different pressure levels
Would be better stated as, the theoretical physics says that the emission peaks as observed from the satellites at these frequencies occur at different pressure levels
The ability to observe different altitude distributions is driven by the atmospheric transmittance as described in equation 2 of Spencer et al 1990 linked above. In particular the scheme has chosen a set of frequencies with different different transmittance specifically to enable coarse altitude resolution. It’s really quite clever albeit a bit technically obscure.
To use the fog bank analogy you trolled Clint R with elsewhere in the thread, this is as if one could control the apparent fog density to change the depth of field in viewing a landscape.
RLH,
Grody 1983 [https://tinyurl.com/3tfvz6mm] is another good source. Figure 2 uses the Rosenkranz 1973 oxygen absor.p.tion model with Liebe et al. 1977 parameters for the US standard atmosphere. You can see how the different microwave frequencies peak at different heights.
BTW, Spencer and Christy use a “deconvolution” model they developed to derive the LT temperature value from the MT, TP, and LS datasets. You can actually calculate the LT values yourself using the formula LT = 1.538*MT – 0.548*TP + 0.010 * LS. This is the current model as documented in Spencer et al. 2016 for v6 which is slightly higher up in the atmosphere than previous versions.
RLH,
It is also important to note that the LT temperature and trend is sensitive to the selection of deconvolution model used. And UAH’s simple one-size-fits-all model of LT = a1*MT + a2*TP + a3*LS is sensitive to the selection of a1, a2, and a3 parameters. Even small changes in these parameters can have a disproportionately large effect on the final trend (C/decade) of LT. This is something Swanson has discussed many times. Who’s to say if UAH’s choice of parameters is right? Why apply a one-size-fits-all model as opposed to a cell-by-cell model or at least region-by-region?
All measures from inside or outside the SBL/PBL use methods that are trying to predict what happens in or outside it.
“the theoretical physics says that the emission peaks as observed from the satellites at these frequencies occur at different pressure levels”
and pressure/temperature/altitude are directly related.
swannie…”The MSU and AMSU instruments use a change in received IR intensity, NOT FREQUENCY to define a scale of brightness temperature”.
***
They don’t measure in the IR band, Swannie, they measure in the microwave band around 60 Ghz (53.596 Ghz for channel 5), which corresponds to a peak in the oxygen spectrum. If they were simply measuring intensity, they’d measure every frequency from every source and pick out the strongest signal. That would accomplish nothing.
The rated bandwidth for channel 5 is 170 Mhz, meaning the AMSU channel receivers receive frequencies between 53.426 Ghz and 53.766 Ghz at the 3 dB point, which is 0.707 of max amplitude.
You have to know what signal you are looking for and they are looking for signals in the 60 Ghz range, which is a microwave frequency range. So, each channel’s receiver is tuned, as Richard has pointed out, to a central frequency, and the response of the channel is a Gaussian curve around that central frequency. The curve represents an instantaneous amplitude (intensity) of a specific frequency at a particular point on the curve.
In other words, the curve is a plot of frequency versus intensity, with frequencies plotted along the baseline. I am talking here about the tuned AMSU channel telemetry, not the weighting functions. However, if you look up the right weighting function chart it shows that each channel covers a different centre frequency.
It’s apparent that oxygen changes its emission frequency with the temperature experienced by the molecule. If it did not, it would be of no use in determining temperature based on the altitude of the molecule.
The weighting function is defined as the relative contribution of each atmospheric layer to the measured radiance. Spectral radiance is a measure of frequency.
Gordo’s confusion continues as he claims that:
No, Gordo, the instruments all measure intensity at fixed frequencies. For your engineering mind, That’s rather like a signal strength meter.
Gordo continues with his confused rant:
Gordo still can’t understand the emission/absorp_tion of radiant energy in gasses. The frequencies used for the 3 AMSU channels are selected to correspond to specific “lines” in the O2 spectrum which are NOT A FUNCTION OF TEMPERATURE.
As I noted above (sorry, the +/- didn’t make it thru), Channel 5’s frequency is 5 53.596 GHz +/- 0.115 GHz, that is, it measures at two frequencies around 53.596 GHz, or 53.711 GHz and 53.481 GHz. Channels 7 and 9 measure at only a single frequency.
ES: Are you going to ignore the fact that pressure/temperature/altitude are directly related?
RLH, Are you going to continue to ignore the fact that the channel frequencies are fixed in the instrument’s design, i.e., there’s no temperature impact to the channel frequencies in the operational data? The theoretical weighting functions are calculated from an assumed temperature vs pressure height, such as the U.S. Standard Atmosphere.
Gordon,
Temperatures are inferred from voltage counts relating to intensity – not frequency – of microwave missions at a set frequency band.
O2 molecules emit at the same frequencies all the time. It is the intensity that changes with temperature. AMSU units measure oxygen microwave emissions specifically in the 50-60 GHz range, because that is the peak emission/absorp.tion band for O2.
But the main point about “inferred” is that this is not a direct measure of atmospheric temperature in situ, but a remote measurement of emissions of one atmospheric gas to derive temperatures.
I’m not saying one method is better than another, just that they’re different.
It is, in fact, spurious to compare the validity of each method, as they are each measuring an object that the other does not.
“O2 molecules emit at the same frequencies all the time”
No they don’t. The frequency the emit is related to the temperature they are at.
….The frequency they emit is related to the temperature they are at…..
WRONG
Are you saying that the frequency emitted by the Oxygen molecules does not relate to temperature/pressure/altitude?
https://www.drroyspencer.com/2010/01/how-the-uah-global-temperatures-are-produced/
RLH, The frequencies emitted by O2 molecules is fixed by the various oscillation modes. These frequencies do not change, only the width of the emission lines changes with pressure, called “pressure broadening”. See Figure 1 from your reference, Mears and Wentz, 2009.
So frequencies are fixed unless that are broadened.
….So frequencies are fixed unless they are broadened….
And no-one bothers that temperature/pressure/altitude are closely related.
RLH,
The fact that UAH gleans temps from changes in intensity of O2 microwave missions at specific wavelengths is mentioned in the documentation. We’re not making this up, and I’ve quoted Dr Roy Spencer on it here already.
If you have an issue with this, why don’t you take it up with Dr Spencer? I don’t think you are ever going to be convinced by anything I or Swanson say.
Updated
CPC
Though La Niña is favored to continue through the end of the year, the odds for La Niña decrease into the Northern Hemisphere late summer (52% chance in July-September 2022) before slightly increasing through the Northern Hemisphere fall and early winter 2022 (58-59% chance).
CFSv2
The CFS.v2 ensemble mean (black dashed line) indicates a transition to ENSO neutral during the Northern Hemisphere summer, with borderline La Niña conditions favored during the fall and winter.
https://www.cpc.ncep.noaa.gov/products/analysis_monitoring/lanina/enso_evolution-status-fcsts-web.pdf
JMA
In conclusion, La Niña conditions are likely to continue (70%) until early boreal summer, and subsequently it is more likely to transfer to ENSO-neutral (60%) by the end of summer than to continue (40%) until boreal autumn
https://ds.data.jma.go.jp/tcc/tcc/products/elnino/outlook.html
We shall see later on this year won’t we.
Dinglebarry claims he doesn’t make any enso forecast so why the copy/paste exercise now ???
Because he doesn’t want to answer the question about min and max in the central Pacific since 1870.
“barry claims he doesn’t make any enso forecast”
That’s right. You may be interested in the range of forecasts made by expert groups above. Full disclosure – I helped in producing none of them.
So what is your answer to the peak temperatures, both high and low, in the various Nino areas as seen in the central Pacific since 1870?
Vietnam called – La Nina not gone by April, they want their money back
https://youtu.be/dVF0Ua5uNLk?t=285
Which April?
https://judithcurry.com/2022/05/31/biases-in-climate-fingerprinting-methods
Ross McKitrick
“Optimal fingerprinting is a statistical method that estimates the effect of greenhouse gases (GHGs) on the climate in the form of a regression slope coefficient.
The larger the coefficient associated with GHGs, the bigger the implied effect on the climate system.
In 2003 Myles Allen and Simon Tett published an influential paper in Climate Dynamics recommending the use of a method called Total Least Squares in optimal fingerprinting regression to correct a potential downward bias associated with Ordinary Least Squares
The problem is that in most cases TLS replaces the downward bias in OLS with an upward bias that can be as large or larger
Under special conditions TLS will yield unbiased estimates, but you cant test if they hold
Econometricians never use TLS because another method (Instrumental Variables) is a better solution to the problem”
TLDR: TLS is worse than OLS.
“How to judge a model beauty contest?”
https://metamodel.blog/posts/model-meritocracy/
“Every 67 years, major climate modeling centers around the world submit their climate simulations to an organization called the Coupled Model Intercomparison Project (CMIP). CMIP distributes the simulation data so that scientists around the world can analyze and compare the models. But what criteria should we use to judge or rank models? How do you decide whether one model is better than another?”
IPCC giving less weight to models that project hotter temps in the future, thus lowering multi-model mean projections?
There are all sorts of ways to spin this. For me, it is another nod to how conservative the IPCC is. For someone else, no doubt this is evidence that the IPCC exaggerates future warming.
I know. Let’s rely on models that have been shown to be wrong instead. That way the temperatures will always rise. Hurray!
Got any model where temps do not rise, Richard?
Interesting RT by the author:
> Reading this @McKinsey_MGI report… A headline finding, highlighted numerous times throughout the report, is that hundreds of millions of people will be exposed to unsurvivable heatwaves by 2030.
https://twitter.com/PatrickTBrown31/status/1536411202397409280
Nothing to see, move along, but but but.
“This would be incredibly concerning, particularly because warming through 2030 is practically locked in. Fortunately, it doesnt appear to be correct”
Read to the end of the thread, Richard.
You should see how real scientists talk, which should be instructive for you considering who you cite.
I did. It was apparent that you had not read beyond the first part.
“It seems that they make a mistake in their calculation that majorly inflates the occurrence of unsurvivable heat waves.”
“Lethal heatwaves in the 21st century are of great concern, and we need the most accurate information on them as possible. It is unfortunate that we’re not getting it in this case”
Sorted out the position of the IPCC on this matter, Richard?
The IPCC says the models are inaccurate, but we should continue to use them anyway.
So you have yet to figure it out, dummy:
> So not surprisingly, the @McKinsey_MGI conclusions are inconsistent with the IPCC statements on this issue who dont project exposure to unsurvivable heat waves by 2100 under the RCP4.5 emissions scenario (RCP4.5 in 2100 is warmer than RCP8.5 in 2030).
https://mobile.twitter.com/PatrickTBrown31/status/1536411211188736000
You said you read that thread. Did you miss that tweet?
Nope. Care to explain why you only quoted the first in the series of tweets which led people to believe that that data was correct when it clearly wasn’t?
To make you look, Richard, and to see if you would ignore every science bit Patrick said.
Figured out how are playing Climateball by omission yet?
Looks like I omitted you between how and are.
Looks like you omitted that you are an idiot.
Found the paper Patrick cited yet?
Willard, please stop trolling.
Let’s go over some stuff.
The only way higher CO2 level can increase global water vapor is to increase the ocean temperature, and average ocean temperature is about 3.5 C. Or increased CO2 levels can green deserts, and life add water vapor {from CO2}.
Higher CO2 levels [unless making deserts green] can’t increase water vapor in the tropics [where the most water vapor is. Or hot spot idea, has been disproven. 60% of rest of planet’s temperature is relate to average ocean temperature [which is and continue to be about 3.5 C. In a lot of time, CO2 “might” increase the average ocean temperature, and some think that over about 50 years of time, CO2 might have added .05 C to average ocean temperature.
Added .1 or say .2 C to ocean temperature does have significant effect upon global average surface temperature.
It’s not the end of the world, but could cause an ice free polar sea ice in Arctic in the summer.
trouble posting…
barry…”Temperatures are inferred from voltage counts relating to intensity not frequency of microwave missions at a set frequency band.
O2 molecules emit at the same frequencies all the time. It is the intensity that changes with temperature”.
***
How do you explain a change in intensity at the same frequency?
And how do you explain the AMSU channel receiver being heterodyne sets that mix incoming microwave with a local oscillator? If they were simply measuring changes in intensity, a heteroydyne receiver would not be required. It is required because there is a broad band of frequencies received (170 Mhz bandwidth for channel 5) and the local oscillator mixes with them to produce an intermediate frequency.
The IF is detected by a square law detector and converted to a varying D.C voltage, which is then digitized by an A/D converter. Therefore, they are looking at a spectrum of frequencies all produced by the O2 molecule. It is obvious, based on the use of heterodyning in the receivers that the O2 molecule must change its frequency based on temperature.
Gordo, Please apply your engineering knowledge to describing the actual electronics, not what’s in your imagination thereof.
https://www.drroyspencer.com/2010/01/how-the-uah-global-temperatures-are-produced/
“The instrument actually measures a voltage, which is digitized by the radiometer and recorded as a certain number of digital counts. “
In a linear relationship to temperature as the diagram shows.
https://www.drroyspencer.com/wp-content/uploads/radiometer-calibration-graph.gif
RLH, There’s a (nearly) linear relation between the received “counts” and “brightness temperature”. But brightness temperature is the sum of all the absorp_tion and emission effects along the path thru the atmosphere from the surface emissions to the instrument. The weighting functions are the result of model calculations of these effects, layer by layer, between the surface and the TOA.
“Theres a (nearly) linear relation between the received ‘counts’ and ‘brightness temperature'”
Is brightness temperature directly related to actual temperature or has the cross confirmation via balloon data been inaccurate?
https://www.drroyspencer.com/wp-content/uploads/radiometer-calibration-graph.gif
https://www.drroyspencer.com/2019/04/uah-rss-noaa-uw-which-satellite-dataset-should-we-believe/
“Is brightness temperature directly related to actual temperature or has the cross confirmation via balloon data been inaccurate?”
It’s not a purely linear relationship.
“The response of the AMSU is slightly non-linear, so the calibration curve in the above graph actually has slight curvature to it. Back when all we had were Microwave Sounding Units (MSU), we had to assume the instruments were linear due to a lack of sufficient pre-launch test data to determine their nonlinearity. Because of various radiometer-related and antenna-related factors, the absolute accuracy of the calibrated Earth-viewing temperatures are probably not much better than 1 deg. C.”
Cross-confirmation depends on which sonde dataset you use.
“Cross-confirmation depends on which sonde dataset you use”
Or if you like UAH and its supporting information apparently.
RLH,
Keep in mind that the radiosonde comparison Spencer refers to in that blog post uses a method by which they “adjust the radiosonde to match the satellite” (their own words) when shift points are detected. At the very least it is a weird way of making a comparison.
When you look at straight comparisons we see a completely different result. https://tinyurl.com/5n88xt7f
https://i.imgur.com/a31C7Ky.png
So you want to challenge
https://www.drroyspencer.com/2019/04/uah-rss-noaa-uw-which-satellite-dataset-should-we-believe/
but you do not want to approach either John or Roy directly.
RLH says: So you want to challenge (UAH) but you do not want to approach either John or Roy directly.
Speaking for myself it’s more about recognizing that others, far more qualified and invested than myself, have concerns. Further, that other groups, apparently with similar qualifications as the UAH group, have gotten significantly different results based on the same raw observations.
I don’t know that UAH is any better or worse than other temperature time series, but I know that its trend is lower than most others. I know also that it’s one of the few major temperature time series for which there is no published error analysis.
RLH,
I’m not saying the Christy et al. 2018 method of comparison is necessarily bad. I just think it is an odd way of doing it and noting that it is but one among many comparisons that can be made. And as is the case for any scientific topic it is best to form positions around the consilience of all available lines evidence.
Mark B,
There actually is a rigorous uncertainty analysis provided by Christy et al. 2003 [https://tinyurl.com/4pbsn4p5] for v5. It is older, but it is most recent AFAIK. The 2-sigma uncertainty is 0.20 C for monthly anomalies. That is actually pretty close to my own type A evaluation using comparisons of UAH and RSS together of 0.16 C. Christy et al. 2003 also estimate the trend uncertainty at 0.05 C/decade.
bdgwx, I stand corrected with regard to Christy’s error analysis. Thanks for the reference.
“I know that its trend is lower than most others”
and that means that its conclusions MUST be suspect.
“I’m not saying the Christy et al. 2018 method of comparison is necessarily bad”
It just doesn’t produce the answer you are looking for.
“Christy et al. 2003 for v5”
UAH is on v6 currently.
Outliers should always be given at least the same amount of scrutiny if not more. And the fact that UAH is an outlier should automatically make it suspect. Don’t hear what I’m not saying. I’m not saying it is wrong or that it should not be given equal weight among its peers. I’m only saying that it should not be treated as the be-all-end-all temperature record.
RLH said: It just doesnt produce the answer you are looking for.
I’m not looking for any particular answer. I always form my position around the abundance and consilience of all available lines of evidence. If that changes then my position changes as well.
RLH said: UAH is on v6 currently.
Yes. I know.
“the fact that UAH is an outlier should automatically make it suspect”
Or an accurate source which others will catch up on.
“Yes. I know”
So why persist in using old versions to support your position?
RLH said: Or an accurate source which others will catch up on.
Which one is more likely?
A) Many other datasets from different groups using different subsets of available data and different processing methodologies (some wildly different) all made different mistakes that somehow caused them to get consistent results.
or
B) UAH is an outlier because of an unidentified bias.
RLH said: So why persist in using old versions to support your position?”
First…I have not presented a position regarding the UAH uncertainty in this subthread.
Second…I cited Christy et al. 2003 as it is the most recent uncertainty analysis they provide AFAIK. If you know of a more recent publication then by all means post it.
Which is more likely.
1) The Nino 3.4 not detrended data shows that min and max have not changed significantly since 1870.
2) Complex models show that min and max have risen significantly in that time.
“Christy et al. 2003 as it is the most recent uncertainty analysis they provide AFAIK”
Have you asked John Christy for his latest opinion?
“How do you explain a change in intensity at the same frequency?”
Ummm … dim a lightbulb. You can literally see the intensity changing at each frequency (color) as the filament changes temperature.
For example, when the filament is cool, there is almost no yellow emitted. As it gets hotter, more and more yellow is emitted. You could easily design an instrument that ONLY measures yellow light and determine the temperature just from that.
Same idea works for IR or microwaves.
Don’t be dim, Tim.
The situation is “change in intensity at the same frequency“, not “change in intensity while changing frequency”.
Dimming a lightbulb changes both the intensity and the emitting frequency.
As all well-informed people know, there is no such thing as “the emitting frequency” of a lightbulb filament. Filaments emit over a broad range of frequencies. (Just look through a diffraction grating.)
Yellow light stays the same frequency (about 510 – 520 THz) no matter how hot the filament. Red light stays the same frequency. Blue light stays the same frequency.
Dimming a bulb changes the intensities of EACH of the MYRIAD frequencies emitted by the filament.
It is amazing to read comments telling you that the temperature derived from O2 emissions in the GHz band depend from the emission’s frequency.
Amazing.
Some people prefer to claim what they merely guess instead of simply publishing information.
But their problem is that when the information dares to contradict their guess, they choose to discard the information instead as an ‘appeal to authority’ (e.g.: the lunar spin, time dilation, viruses etc etc).
*
From
https://learningweather.psu.edu/node/72
we can read that the frequency is used for determining the altitude of the observed atmospheric layer:
– Channel 8 (55.5 GHz) approximately 100mb (about 15 kilometers)
– Channel 7 (54.9 GHz) approximately 200mb (about 12 kilometers)
– Channel 6 (54.5 GHz) approximately 350mb (about 10 kilometers)
– Channel 5 (53.6 GHz) approximately 550mb (about 5 kilometers)
Best shown when looking at
https://www.e-education.psu.edu/meteo241/sites/www.e-education.psu.edu.meteo241/files/Lesson2/weighting_function0207.gif
Because frequency of emission of O2 molecules is related to altitude which is related to temperature which is related to pressure.
Blinny: Sorted out the difference between a time series and a distribution yet?
Superdeveloping triple La Nina Hurricane season forecast
https://www.cfact.org/2022/06/14/40578/
> If I see something I saw something.
Words of wisdom, Joe.
Words of wisdom.
Bad Atlantic hurricane season caused by La Nina, not by global warming.
Why are you talking about global warming, Richard?
Because it is likely that people will blame global warming on the upcoming Atlantic hurricane season. Are you going to be one?
Figured out hat your baits and switches fool no one here, Richard?
So you wont say that any hurricanes we get are caused by global warming then.
Found out what the IPCC says about that, Richard?
The IPCC says that the models they use are inaccurate, but we should continue to use them anyway.
That is not what the IPCC says, Richard, for that would misapply the concept of accuracy.
Figured out yet?
Sure. Idiot.
Even the lowest climate projections would imply we manage risks properly.
So for cycle nuts they MUST be wrong.
I am not a cycle nut which is your characterization. I am someone who believes that all large physical systems have oscillations in them that are not simply described by pure sine waves.
If it is all natural, it is all cycles, dummy.
“Because it is likely that people will blame global warming on the upcoming Atlantic hurricane season. Are you going to be one?”
That’s what I thought. You, sir, are playing climateball.
It’s as obvious as a clown full of cars. Apparently you are completely unaware you are doing it.
So you wont say that any hurricanes we get are caused by global warming then.
“So you wont say that any hurricanes we get are caused by global warming”
Global warming doesn’t cause hurricanes.
Stop playing climateball.
I know. But you and your friends in the press will claim that it does or makes things worse.
But the Press.
Richard is definitely not playing Climateball.
“you and your friends”
is what I said.
You want to bet that there will not be stories that portray the upcoming hurricane season as the fault of global warming?
*You and your friends in the press* is what you said, dummy.
And here is the bingo square:
https://climateball.net/but-the-press/
“you and your friends in the press”
Climateball yet again.
What “my friends” in the press are saying about global warming, La Nina, and hurricanes.
La Nia heads for rare “triple dip,” dampening global temperatures
Grand solar minimum update – preppers version
https://youtu.be/g1Sizd_Ujuk
Well it seems this grand solar minimum is going to short- but long enough mess with Mars exploration.
And we had huge volcanic eruptions back then.
Huge volcanic eruption seem like they are more of problem than just the weather, particularly, near where they are occurring.But they can be global in terms of anyone living near the beach.
It would probably be better if you lived in an Ocean settlement.
But in terms of risk, it seems the crazy Russians are more of problem.
” Survive the Grand Solar Minimum. Severe Weather Events. Prepare. ”
I confess that I didn’t know that in the US, some people would be dumb enough to establish a correlation between the size of hailstones and a Grand Solar Minimum:
https://i.postimg.cc/rpYfJ3rt/Screenshot-2022-06-15-at-23-15-36-Survive-the-Grand-Solar-Minimum-Severe-Weather-Events-Prepare.png
Now I know that such people really exist.
{sarc} Thanks Ebaby for having highlighted this. {/sarc}
*
This phenomenon has been known for decades in all areas where very warm air masses flow from the south onto a mountain or hillside.
A process then arises in which the air masses condense and water drops rain down, which, however, enriched with water vapor, are pushed up again and so on, until then sometimes huge hailstones fall down.
A well-known example of this is the Ligurian coast in Italy.
*
Solar flux update
https://drive.google.com/file/d/10QX3O6JIK3RIhUJgiqdhim4yUaG9ZwfR/view
Sorted out the difference between a time series and a distribution yet?
— Bindidon says:
June 15, 2022 at 3:43 PM
Survive the Grand Solar Minimum. Severe Weather Events. Prepare.
I confess that I didnt know that in the US, some people would be dumb enough to establish a correlation between the size of hailstones and a Grand Solar Minimum:–
Well I would be concerned about baseball size hail, never had it, and don’t want it. I never been in Cat 3 [or higher] Hurricane either.
Both should wreck solar panels.
But it’s uncertain we are in or going to get into Grand Solar Minimum, but not likely I will get hail size of baseballs or Cat 3 hurricane, resulting from it.
But generally politicians do much more harm than any weather or global climate could do. The insanity of Putin is a larger issue.
I do find it extraordinary that Nino 3.4/ONI/PDO are accepted to balance around 0 long term, but that AGW is also touted as an explanation for everything. Does it not operate at the Tropics?
And for the PDO, in the NH Pacific.
https://climatedataguide.ucar.edu/sites/default/files/styles/node_lightbox_display/public/key_figures/climate_data_set/Deser-PDO1.png?itok=duVw74Nl
https://climatedataguide.ucar.edu/sites/default/files/styles/node_lightbox_display/public/key_figures/climate_data_set/oni.monthly.smoo_stro.png?itok=RzOs089F
https://psl.noaa.gov/enso/mei.ext/ext.ts.jpg
RLH, you seem to have missed some key information before you posted. These ‘balance to zero’ because they are designed that way. Climate change is built into the indices!
ONI:
“Calculate a monthly average sea surface temperature in the Nino 3.4 region (5S-5N, 170W-120W).
Calculate a monthly 30-year climatological value, updated every 5 years (1856-1885, …, 1986-2015, 1991-2020).
Calculate a monthly anomaly with years centered in the climatolog (1871-1875 uses 1856-1885 climo, …, 2001-2005 uses 1986-2015 climo, 2006-2010 uses 1991-2020 climo, 2011-2025 also uses 1991-2020 climo because 1996-2025 climo does not exist yet).”
http://bmcnoldy.rsmas.miami.edu/tropics/oni/
PDO
“The Pacific decadal oscillation index is the leading empirical orthogonal function (EOF) of monthly sea surface temperature anomalies (SST-A) over the North Pacific (poleward of 20N) after the global average sea surface temperature has been removed.”
From Wikipedia.
That’s a really good job of copying/pasting/linking, Folkerts.
Think you could do as well with some valid source for your claim that two 315 W/m^2 fluxes can warm a surface to 325 K?
It’s been months now. Some people are starting to believe you’re a phony like Norman.
Interesting. The ONI is indeed de-trended. But the Nino 3.4 (and the ocean temperature data it is based on) it is based on is not.
This suggests that whatever it is that is being removed from the ONI is NOT ocean surface temperatures.
….is NOT ocean surface temperatures at the Tropics….
Huh?
The ONI is NINO3.4 region SSTs, anomalised from a moving baseline.
The baseline is the 30-year average for each month, and the baseline is recalculated every 5 years.
This is how long term trends, cycles or whatever, are removed to leave just the ENSO signal.
NOAA uses the detrended data for ENSO, so does BoM and some other modeling groups. JMA uses NINO3 only, also detrended.
NOAA’s CPC, for which Michelle l’Hereux works, publishes the ONI index for ENSO, and bases their ENSO announcements on it.
Yes, you use the non detrended data. So your data retains non-ENSO signals. That’s fine if you want to look at SSTs in the NINO3.4 region, but not so great if you want to compare ENSO events with ENSO events.
You understand?
Have you compared the ONI data (detrended) with the Nino 3.4 data (not detrended)?
What hope for AGW if the central Pacific sea surface data does not show significant trends in only that data?
https://imgur.com/a/ReAYhwi
Who knew that 1950 was the lowest point (one of anyway) in the whole data series?
“Have you compared the ONI data (detrended) with the Nino 3.4 data (not detrended)?”
Yes, while we have been having this conversation. Those posts sparked replies from you.
Linear trends for your data (HadISST) from 1870, 1950 and 1997 (last 25 years) are all positive and not statistically significant.
Linear trends for ONI from 1950 and from 1997 are negative and not statistically significant.
What are the linear trends for the min and the max over the period of record?
“What are the linear trends for the min and the max over the period of record?”
I’m not savvy enough to do the analysis without a LOT of menial data sifting in Excel, which I’m just not interested enough to spend a couple of hours doing. I am curious to see anyone else have a go, and mentioned this when I did the linear trends with all the ONI data.
https://www.drroyspencer.com/2022/06/uah-global-temperature-update-for-may-2022-0-17-deg-c/#comment-1313253
Have you not been interested enough to try this yourself?
“The Pacific decadal oscillation index is the leading empirical orthogonal function (EOF) of monthly sea surface temperature anomalies (SST-A) over the North Pacific (poleward of 20N) after the global average sea surface temperature has been removed”
Why would you remove the GLOBAL figure from a North Pacific dataset?
RLH,
I didn’t set up the system, but it makes pretty good sense. If you are trying to determine how “anomalous” a value is, you need a baseline. And a global baseline seems one obvious choice.
For example, if the North Pacific was warming at an average rate of 0.1 C/decade (with of course variations from month to month and year to year) and the entire ocean was warming at 0.05 C/decade, then this index would show an overall upward slope — indicating the North Pacific was becoming more and more anomalous in general (again, with variations from week to week and month to month).
If it was only compared to itself, then the trend would by definition be zero. In this case, a graph like this would ALWAYS average to zero over any 30 year period, and the unusually cool condition from ~1000 – 1400 CE would not be evident.
https://en.wikipedia.org/wiki/Pacific_decadal_oscillation#/media/File:PDO1000yr.svg
Either one could be an interesting metric. This metric chooses to look allow for long-term trends in the North Pacific to be detected.
“a global baseline seems one obvious choice”
For a global position only. It does not make sense for a central Pacific one.
It adds things that are outside area of interest, the central Pacific.
Nino 3.4 (not detrended) shows that there is no significant alteration in min/max data since 1870.
That there maybe significant changes in high latitude data does not alter that fact.
Adding in things that bring that into the picture just muddies the overall picture.
“Nino 3.4 (not detrended) shows that there is no significant alteration in min/max data since 1870.”
No. Look here:
https://www.cpc.ncep.noaa.gov/products/analysis_monitoring/ensostuff/ONI_change.shtml
The 30 year averages have risen about 0.5 C over the past 5 or 6 decades. There IS a clear upward trend in the Nino 3.4 region.
“It adds things that are outside area of interest, the central Pacific.”
The analysis gets complicated (and my previous comment was a bit oversimplified). I can see how either approach (“just north Pacific” vs “global change”) might be valuable. You can choose your favorite, but that doesn’t stop the other from ALSO being useful and/or interesting.
https://climatedatablog.files.wordpress.com/2022/06/nino34-4.jpeg
is the non detrended Nino 3.4 data straight from NOAA
(see data source at https://psl.noaa.gov/gcos_wgsp/Timeseries/Data/nino34.long.anom.data). It is only adjusted to make an anomaly from the absolute data for the reference period. Remove the .anom. from the link if you want the absolute data.
Posting ENSO data in response just shows that the differences between that and ENSO are nothing to do with Nino 3.4.
If you want the base url for that series see
https://psl.noaa.gov/gcos_wgsp/Timeseries/
and look under ‘SST Indices’ and then choose either
Nio 3.4 (anomaly; 1981-2010 mean removed): Standard PSL Format
or
Nio 3.4: Standard PSL Format
Ever heard of “If you are trying to determine how “anomalous” a value is, you need a baseline”?
RLH: Interesting.
The data you found for Nino 3.4 goes back much further (1872) than the data I found (1936). I don’t always trust the really old data to be as accurate, but we can assume it is good for sake of discussion.
The shorter data shows a clear upward trend. But looking at the longer data, this could be mostly a longer ‘oscillation’.
1890 LOW
1930 HIGH
1950 LOW
1990 HIGH
2020 Continues High
We would more and better data to truly sort out the trend in this region vs long-term oscillations. The slope is upward by ~0.3 C since ~1890), but this is smallish compared to monthly and decadal variations.
On the other hand, the GLOBAL trend is pretty clear — upward by ~1.5 C.
https://www.epa.gov/climate-indicators/climate-change-indicators-sea-surface-temperature
Then the interesting question becomes “Why are global oceans warming, but this particular region is staying relatively constant?” [I can think of one hypothesis, but it would be just speculation.]
“The data you found for Nino 3.4 goes back much further (1872) than the data I found (1936)”
This is just non detrended data for Nino 3.4 from NOAA (based on Had SST).
https://www.metoffice.gov.uk/hadobs/hadisst/data/download.html
Still shows that over the period of record that there has been no significant trend in min and max data.
At the Tropics or the very small slice of it that is the Nino 3.4 area. Outside that there may well have been an upwards trend but that is a very different story.
Tim: I think you will find that
https://climatedatablog.files.wordpress.com/2022/06/nino34-4.jpeg
is a very good way to look at the data and its trends and limits.
1890 LOW
1930 HIGH
1950 LOW
1990 HIGH
seems a fair assessment.
Notice the 60 year low to low, high to high periods.
“Notice the 60 year low to low, high to high periods.”
But also notice:
1) The 1st low was lower than the 2nd low, and the 1st high was lower than the 2nd high. The overall trend is upward.
2) The current high seems to be persisting. A “60 year pattern” should have a new low in 1950+60 = 2010. Any low there is weak at best And the projection is for an increase moving forward.
“Still shows that over the period of record that there has been no significant trend in min and max data.”
In highly variable data like this, looking just and min and max data is a poor analysis tool. Even so, I played around just a bit and find that basically all metrics shower more high values near the end and more low values near the beginning. I can’t say these were ‘statistically significant”, but there was a trend.
“looking just and min and max data is a poor analysis tool”
Hmmm. Never the less, min and max are strongly represented in air temperature data elsewhere. Indeed preferred by some.
I’m not sure how you get a trend out out that. The 1930 peak is, after filtering/smoothing at 15 years, basically around 0 which is the same as the reference period of 1981-2010.
There is also more than a simple 60 year sine wave in there on the thicker blue 15 year filtering/smoothing line, so trying to treat it as a simple pattern is doomed to failure.
Tim: Notice also that the underlying pattern is more a 1:3 asymmetrical sawtooth.
1930 HIGH
1950 LOW
Care to remove that from the data and then wonder why it is that this most recent high might be delayed by 10 years or more. Perhaps it might be due to frequencies other than 60 and 20 years.
Also I think it is interesting that the El Nino in 1998 shows up so well in
https://climatedatablog.files.wordpress.com/2022/06/nino34-4.jpeg
and
https://climatedatablog.files.wordpress.com/2022/06/uah_lt.jpg
but is well down in
https://climatedatablog.files.wordpress.com/2022/06/rss-3.jpeg
https://climatedatablog.files.wordpress.com/2022/05/had5.jpeg
Any comments on that?
RLH says:
“Notice also that the underlying pattern is more a 1:3 asymmetrical sawtooth.”
I noticed that sawtooth too — a double-bump rise (1890-1930) and a single larger fall (1930-1950); then another double-bump rise (1950-1990). There are several problems.
1) There is not yet any clear sign of a second “larger fall”. So we have less than two full cycles
2) There could well be another ‘bump’ at the very beginning. The first 6-7 years are all exceptionally low (But we would need some preceding years to do the 15 year smoothing). That would would give — a triple-bump rise (1870-1930) and a single larger fall (1930-1950). That would predict we are due for another ‘bump’ (2010) followed by a dip into 2030.
3) Given the extremely noisy data and the lack of theoretical support, none of these patterns seem to rise to the level of anything more than conjecture.
RLH: there is no significant alteration in min/max data since 1870.
ME: looking just and min and max data is a poor analysis tool
RLH: Never the less, min and max are strongly represented in air temperature data elsewhere. Indeed preferred by some.
I think we are talking about two very different things. Yes, daily min and max are often used to find ‘typical’ temperature for the day, and that data is used for various analysis.
But when you are looking at the Nino3.4 data, I think you mean something like “the max data point was near the end, but the next largest was near the beginning, which shows there is no trend.” *That* is the weak sort of analysis I meant.
“Never the less, min and max are strongly represented in air temperature data elsewhere. Indeed preferred by some.”
Anyone who prefers to use a 2-point max to max or min to min to glean a trend is doing it wrong. Who are these people?
RLH, the indices for these fluctuations are designed to remove any longer term trends/long-term cyclicity.
That’s because thy want to indices for these phenomena that record only these phenomena and not other phenomena.
Whenever you cite NOAA on ENSO behaviour, past present or future, the information is based on purely the ENSO indices, stripped as best as possible, of non-ENSO influences.
But the Nino 3.4 is NOT detrended.
And is NOT used as a dataset by NOAA for identifying ENSO or comparing ENSO events.
[RICHARD] I don’t play climateball.
[ALSO RICHARD] I do find it extraordinary that Nino 3.4/ONI/PDO are accepted to balance around 0 long term, but that AGW is also touted as an explanation for everything. Does it not operate at the Tropics?
Willard it sounds like you are asking Richard to stop thinking altogher like you apparently have.
Willard: Sure.
If Richard thinks as much as you suggest, Bill, how come he missed the few things Tim underlined before posting?
I missed nothing but did notice that global data was being removed from central Pacific data.
Sure, Richard.
You missed nothing but.
I missed nothing.
Sure, you missed nothing, but:
https://www.drroyspencer.com/2022/06/uah-global-temperature-update-for-may-2022-0-17-deg-c/#comment-1317532
“after the global average sea surface temperature has been removed” from a central Pacific only dataset.
Tell me again how come a non detrended Nino 3.4 shows that the min and max has not changed much since 1870.
Sure, Richard.
You do not play Climateball, but.
You are an idiot. No but needed.
I should not have included the PDO.
https://imgur.com/a/eMGJIsZ
The Shen PDO reconstruction from rainfall data does not say it is detrended.
For the abstract of Shen PDO reconstruction
https://agupubs.onlinelibrary.wiley.com/doi/full/10.1029/2005GL024804
The full paper, not the abstract.
“The Shen PDO reconstruction from rainfall data does not say it is detrended.”
It’s based on flood/drought data. I’m not sure what their methodology achieves WRT non-PDO signals.
Try pdo-shen2006.txt for what Shen does and does not cover.
How about for once you acknowledge a fair correction?
“Here we used a data set of the drought/flood index (a proxy of summer rainfall) since 1470 AD to reconstruct the annual PDO index.”
I discussed this with RLH before. There are reconstructions of PDO based on the East side of the Pacific, that totally disagree with Shen who is based on the West side of the Pacific.
The phenomena is apparently not globally robust.
“I do find it extraordinary that Nino 3.4/ONI/PDO are accepted to balance around 0 long term”
ONI and PDO indices are designed to remove long term trends that are NOT representative of those signals. Thus long term trends are filtered out.
NINO3.4 is a simply a small region of the Pacific and SSTs there are NOT expected to balance to zero long term.
Yes, AGW operates in the tropics. But as the greenhouse effect is already strong at that latitude (more water vapour), the enhanced GHE is expected to be weaker than in more arid latitudes. The earth is not a billiard ball, and global climate change (of any cause) does not bring uniform change at the same rate everywhere.
While the NINO3.4 region joins with other locations in the Atlantic and Antarctic area that have minimal long term warming, the decadal warming in the whole tropics is only slightly lower than the global trend…
Based on that infallible dataset, UAH v6.0.
John Christy on The Economics and Politics of Climate Change
“When you understand the system you can predict its behavior”
On the other hand, when all you do is collect rows of numbers and draw straight lines through them without any understanding what they mean and why they are what they are, you keep getting your forecast exactly backwards, just like Bindidong who doesn’t have the slightest clue how climate works.
https://youtu.be/ttNg1F7T0Y0
Straight lines do not occur in nature.
Nor do pure sine waves.
swannie…”Please apply your engineering knowledge to describing the actual electronics, not whats in your imagination thereof”.
***
Swannie,you old curmudgeon. you’re never happy till I lead you through the technical info. Here ya go.
The antenna in a microwave system is usually a horn device at the end of a waveguide. As our microwave prof used to claim, a waveguide is nothing more than Campbell soup cans soldered end to end. Turned out they were more rectangular, about an inch wide and half an inch high at the frequencies we were working with.
The horn is shaped to match the impedance of space to the impedance of the waveguide. When the collected waves head down to the waveguide, they go through an amplifier which increase the signal to noise ratio.
It’s similar in the AMSU units. When the amplified signal exits the amp, it enters a mixer where the signal is beat against a local oscillator. Since the mixer is non-linear, it produce an addition of frequencies and a subtraction of frequencies both at lower, intermediate frequencies. The lower IF frequency is desired because it’s tough to deal with raw signals in the microwave range. Also, it’s easier to apply filtering to the lower frequencies using tunable circuits.
When the signal emerges from the IF stage it is an alternating voltage at high frequency and it consists of many different frequencies of EM. That’s the job of the detector, or demodulator, excep.t here, there is no information to decode, just a wildly varying signal representing a multitude if frequencies.
It’s no good in that form, it needs to be a varying D.C voltage that can be converted to digital via an A2D converter. The A2D converter will take a voltage in an instantaneous sampled windows and convert it to a digital code. The range of the code, say from 000 to 128 represents different voltage levels.
The thing you and Barry have to latch onto is what exactly is received at the microwave antenna, what is the local oscillator beating against to produce and intermediate frequency, and what dos the detector convert to a varying D.C?
Is it…
1)peanuts
2)rice,
3)tiny elephants
4)a low frequency voltage
5)a voltage varying at gigahertz frequencies.
I’m going with 5. A high frequency oscillator will only convert similar high frequency signals to an intermediate frequency. It would not work with 4, and definitely not with 1,2 and 3. It would not detect intensities as you suggested previously, only frequencies.
That’s not the voltage we want to represent temperatures, it needs to be in a varying, low frequency D.C format.
Meanwhile, back at the ranch, the mixer, we don’t want every channel frequency in the signal going down the same IF chain. So, we use filters tuned to the centre frequency of each channel to redirect the frequency data related to each channel. Each goes down it own IF chain and is detected as a varying D.C voltage which is proportional to each frequency in the channel.
That goes back to your Gaussian-shaped channel response. The voltage going through the channel filters is proportional to the frequencies received above and below the centre frequency of each channel and is indicated as a voltage amplitude. However, the voltage is still in RF format, meaning it is varying at Ghz frequencies and is AC.
If you wanted to view this on an oscilloscope in the IF stage, providing the frequency was low enough to be viewable on scope, you’d use a demodulator probe that would convert the signal bandwidth to a varying D.C voltage, giving you a nice Gaussian shape on your scope display. Provided, of course, the IF bandpass transformers were tuned properly.
It is worth noting that pressure/temperature/altitude are directly related.
6) Channel power
Your post prompting Swanson’s question suggested some sort of spectral analysis of the signal within the receiver pass band and I’ve seen no indication that there is any pre or post-detection frequency analysis.
As near as I can tell, the product is just something proportional to RMS amplitude of the received signal at a set of observation angles along with calibration observations.
As a minor aside, I haven’t seen anything that specifically says the pass band has a Gaussian transfer function. That would be unusual for a communications receiver, but maybe not for this sort of application. If you have specific information confirming this, I’d be interested in a reference.
All receivers at a given central frequency exhibit a gaussian response envelope around that central frequency usually quoted at +-3dB.
Gordo, The MSU / AMSU instruments employ a particular type of device which measures radiance at specific frequencies. Your description does not fit that type of device. Do try to do a tiny bit of reading on your own. When you find it, tell us the name given to that device and what it was first used for.
RLH, don’t tell old Gordo the answer, if you find it. Let him find it himself, if he can…
You mean this?
https://www.drroyspencer.com/2010/01/how-the-uah-global-temperatures-are-produced/
Care to translate the vertical scale into altitude instead of pressure?
https://www.drroyspencer.com/wp-content/uploads/AMSU-weighting-functions.gif
Let me help you.
1 hPa = 32,435m
10 hPa = 25,907m
100 hPa = 15,790m
1000 hPa = 110m
No.
You mean the translation of pressure into altitude is incorrect?
Yes. The conversion is not exact, down to the meter, as you have implied. Also, the relationship changes with latitude and season.
But it is broadly correct thus showing that altitude and pressure are directly related and labeling in one is just a substitute for the labeling in the other.
1 hPa = approx 32,500m
10 hPa = approx 25,100m
100 hPa = approx 15,800m
1000 hPa = approx 100m
Sorry
10 hPa = approx 26,000m
For example, consider this map for 500mb pressures vs altitude:
https://weather.uwyo.edu/cgi-bin/uamap?REGION=nh&OUTPUT=gif&TYPE=an&LEVEL=500&date=2022-06-17&hour=0
I am saying that pressure decreases consistently with altitude. Are you disputing that?
Please note the range that differences in altitude/pressure covers at 500 mb.
RLH, I pointed out that your post with high resolution correspondence between altitude and pressure height was bogus. You now apparently agree that there’s no absolute fixed relationship everywhere and for all seasons.
Hunter
Before trying to teach Richard Swanson, you should have a closer look at what you post: namely the
” Daily mean temperatures for the Arctic area north of the 80th northern parallel .
This has few in common with the Arctic as is understood when mentioning UAH’s NoPol: 60N – 82.5 N.
There is a huge difference between the two.
And if I well do recall, the weather station trend for 70N – 80N is even lower than above or below.
*
Moreover, regardless what kind of data you are talking about, it should be evident to you that simply ‘flipping through the archived annual DMI Arctic temperature charts’ can’t be an alternative to the look at a time series.
Unfortunately, I lost the link for DMI’s surface temperature data
*
I propose that you go a bit deeper into that, by e.g. reading:
Role of Polar Amplification in Long-Term Surface Air Temperature Variations and Modern Arctic Warming (2010)
Roman V. Bekryaev, Igor V. Polyakov, and Vladimir A. Alexeev
https://journals.ametsoc.org/downloadpdf/journals/clim/23/14/2010jcli3297.1.xml
There you’ll read something quite different from the Lansner stuff posted at WUWT
https://wattsupwiththat.com/2010/08/05/dmi-polar-data-shows-cooler-arctic-temperature-since-1958/
Sorted out the difference between a time series and a distribution yet?
Sorted out that a Savitzky-Golay output starting at year 15 never and never is coming from specifying a 15 year window for the smoothing?
*
Btw: I don’t care about whether or not my hourly temperature distribution averaging is a histogram or not.
https://drive.google.com/file/d/1MZlIa_a-SKRxA72v1UOB7HrNpEr9EGqO/view
And no one on Earth except you names such a distribution a time series. No one!
What matters, Linsley-Hood, is that you stalk me about wording, but lack both technical skill and courage to contradict me.
Just like you endlessly stalked me about me using wrong, rounded USCRN data, but carefully avoided until now to give us a proof for this ridiculous allegation.
All you are able to is, like do Robertson, Clint R and a few others, to discredit and denigrate what I do.
My implementation comes from a C# inclusion of
Implements a Savitzky-Golay smoothing filter, as found in Sophocles J.Orfanidis. 1995. Introduction to Signal Processing. Prentice-Hall, Inc., Upper Saddle River, NJ, USA.
and yours?
“no one on Earth except you names such a distribution a time series”
No-one else claims that is what is obviously a time series is a distribution because they know the difference.
“give us a proof for this ridiculous allegation”
Look back in time for discussions about last place rounding errors to do with Kenai USCRN station.
2010/11/16 CRND0103-2010-AK_Kenai_29_ENE
Daily Average = -6.70 Count = 1
Hourly Average = -6.76 Count = 24
SubHourly Average = -6.74 Count = 288
Notice how one rounds up but the other down?
-6.8 or -6.7 if you do not get it.
Bindidon, how am I discrediting and denigrating what you do? You’re a braindead cult idiot fixated on centuries-old astrology, rejecting science and reality. And, you seem to be really good at it. If you’re happy with that, why should I care?
” 2010/11/16 CRND0103-2010-AK_Kenai_29_ENE
Daily Average = -6.70 Count = 1
Hourly Average = -6.76 Count = 24
SubHourly Average = -6.74 Count = 288 ”
When will you stop your nonsense with this ridiculous difference between hourly and a daily data I use nowhere in my USCRN processing?
When will you finally start to generate monthly time series out of hourly data, like I did, and compare the time series for middle, median and mean, as I did?
https://drive.google.com/file/d/1BhgrAn-eVrX9JZUhr_y4ceVWAKsXtqml/view
https://drive.google.com/file/d/1_F00TcPvlRBk4NQ8GR_Q6cdhUtQ4CUIQ/view
As long as you are not able to do the job… I keep laughing.
You are exactly how you name me: an arrogant twat.
You were the one who came up with the differences at Kenai. Saying that your daily from hourly data was more accurate that USCRNs own daily figures.
I just proved you wrong and you never accepted it.
Much the same as your S-G at 30 years allows through wriggles that would never show in even a 30 year SRM.
Let alone a 30 year CTRM.
” Saying that your daily from hourly data was more accurate that USCRNs own daily figures. ”
… and Linsley-Hood continues lying, instead of starting a fair competition, proving my monthly comparisons of middle, median and mean wrong.
Publish a distribution histogram of your times series data over the 24 hours then.
“continues lying”
What, by paraphrasing your own words!
My Savitzky-Golay filter was made by a Swedish nanotechnology specialist.
The problem is not which implementation is the better one.
The problem is that you don’t understand that your use of your filter is incorrect, and that you never will admit that.
Because you never admit anything.
Go with your filter output and ask a real specialist in statistics what s/he thinks about your alleged 15 year filter plot, compared with
https://tinyurl.com/srhj6djb
And best of all, you are trying to tell us in your strange chart
https://climatedatablog.files.wordpress.com/2022/06/nino34-4.jpeg
that the end of the data generated by the Savitzky-Golay filter is supposed to be a ‘projection’, although everyone can see that the output does not extend beyond the source data processed by the filter.
That is so bold and incompetent!
“My Savitzky-Golay filter was made by a Swedish nanotechnology specialist”
Yeah sure. The output of your 30 year S-G shows deviations on a monthly basis. Give me a break.
“that the end of the data generated by the Savitzky-Golay filter is supposed to be a ‘projection’, although everyone can see that the output does not extend beyond the source data processed by the filter”
Heard of ‘end effects’?
If you stray within 1/2 of the window of an S-G filter you become very dependent on the latest data.
That is why the S-G filter, if taken to the full dataset, whips around like a caterpillar searching for a new leaf on new data.
https://upload.wikimedia.org/wikipedia/commons/thumb/8/89/Lissage_sg3_anim.gif/400px-Lissage_sg3_anim.gif
Only after we get to where the round circles are does the output not change later with any new data.
Stop dodging.
Go with your filter output and ask a real specialist in statistics what s/he thinks about your alleged 15 year filter plot.
Shall we try Vaughn Pratt? You know, the one who came up with the factors in the CTRM I use.
Or Nate Drake
“I ran a 5 pass-multipass with second order polynomials on 15 year data windows as per the Savitzky-Golay method.” Nate Drake PhD
who is my inspiration for the use in climate of S-G.
The last snow storm over the Greenland ice sheet brought the SMB back to boringly average.
http://polarportal.dk/fileadmin/polarportal/surface/SMB_curves_LA_EN_20220615.png
https://www.youtube.com/watch?v=h4B8HIdyW1E
Hunga Tonga Volcano Update; The Cause of Unusual Sunsets around the Globe
From the Adaptation files.
Soaring heat and humidity hit northwest Kansas this week, killing thousands of cattle across the state. Final death numbers are still being reported, but some news sources put it at around 10,000 animals – and these deaths come as a particular hit to the industry after producers already reduced herds due to drought and feed costs.
This week, temperatures reached up to 108 degrees Fahrenheit with little cooling factor from wind. Continued high temperatures are a serious threat to continued losses throughout the coming days.
It’s not uncommon to see issues with heat stress this time of year. However, when there is a “perfect storm” of too much heat and no opportunity for nighttime cooling, cattle can accumulate heat and die from the stress. It’s a situation that can hit both feedlot and grazing animals.
Heat stress doesn’t happen all at one time. Cattle accumulate heat during the day, and then over the nighttime hours, it takes four to six hours for them to dissipate that heat. As long as we have a cooling effect at night, cattle can mostly handle the heat. Where we run into issues is where we have two to four days in a row of minimal nighttime cooling, and we start the day with the heat load we accumulated the day before still there.
Also contributing is the hair coat. Cattle can adapt to almost any environment on earth, but they need time. At this point in the season, a lot of them have not fully shed that winter hair coat and slicked off.
Many of the animals also appeared close to going to processors. They were fat.
Kansas is the third-largest producer of cattle, following Texas and Nebraska. The state has over 2.4 million cattle on feed.
Yea, this record La Niña is brutal.
Sun is working 24/7 to heat the oceans back up….
The ice (melting and freezing) at the poles is trying to cool the oceans down.
clint…not only from La Nina, from the Little Ice Age as well. Old Sol has to keep pumping out the energy to melt glaciers formed in the LIA and to get sea levels back to normal.
Kansas, that’s where Dorothy of Oz and Toto hail from, no pun intended. Seems droughts have been the norm in Kansas for as long as anyone can remember.
Gordon Robertson, the compulsive fantasist, probably can’t tell a cow from a horse. But I digress.
I lived in Southwest Kansas during the late 70s and early 80s while working in the Hugoton field, at the time still the largest Natural Gas filed in the world. It’s beautiful country. My oldest son was born there. Those are some of the hardest working, hardiest folk I’ve ever had the honor to meet.
“Old Sol has to keep pumping out the energy to melt glaciers formed in the LIA and to get sea levels back to normal.”
1) What is “normal”?
2) How do we tell if we have got their yet? How would we know if we hadn’t already ‘recovered’ from the LIA?
When (and if) the temperatures start downwards?
“How do we tell if we have got their yet [end of LIA]?”
“When (and if) the temperatures start downwards?”
Cool!
Had.CRU4, BST, GISS and NOAA global temp data has negative trends 1877 to 1919, even statistically significant negative trends around that time. And this well covers the classical 30-year climate period.
Does this mean the ‘recovery’ from LIA occurred no later than the 1870s?
When (and if) the temperatures start consistently downwards
So no mechanism needed, no cause, just ‘recovery’, and it’s over when temperatures drop but only when you decide how long that should happen for.
No stated cause, no predictive quantity, and is thus an unfalsifiable proposition.
Colour me convinced!
A potential European Commission (EC) act to classify lithium as a Category 1A reproductive toxin in this year’s fourth quarter could undermine the European Union (EU)’s attempt to create and support a domestic battery materials supply chain.
The EU currently relies heavily on imports of lithium to supply its nascent electric vehicle (EV) production sector and the classification may increase its reliance on other regions, at a time when the union is focused on energy security and reducing emissions.
While the classification would not stop lithium usage, it is highly likely that it would have an impact on at least four stages in the EU lithium battery supply chain: lithium mining; processing; cathode production; and recycling. Several administrative issues, risk management and restrictions could hit each of these fledgling industries in Europe, which would drive up costs.
Other battery technologies not based on lithium would seem to benefit from that idea.
Lithium a toxin??? Amazing, it’s authorized for human consumption as an anti-dpressant/anti-psychotic.
Poor old lithium is about as non-toxic as they come. What kind of idiots would brand it a toxin?
“Lithium may not be suitable for some people. Tell your doctor if:
– you have ever had an allergic reaction to lithium or other medicines in the past
– you have heart disease
– you have severe kidney problems
– you have an underactive thyroid gland (hypothyroidism) that is not being treated
– you have low levels of sodium in your body this can happen if you’re dehydrated or if you’re on a low-sodium (low-salt) diet
– you have Addison’s disease, a rare disorder of the adrenal glands
– you have, or someone in your family has, a rare condition called Brugada syndrome a condition that affects your heart
– you need to have surgery in hospital
you are trying to get pregnant, are pregnant or breastfeeding
Before prescribing lithium, your doctor will do some blood tests to check your kidney and thyroid are OK. The doctor will also check your weight”
Forgot to highlight
you are trying to get pregnant, are pregnant or breastfeeding
It is well known, by those who know it well, that Gordon Robertson’s empty sails are so rigged as to be swelled by any passing waft or breeze of crankiness and cant.
Tyson, please stop trolling.
Bill Hunter
I wrote ahead that the 70N-80N latitude band in the Arctic would be lower than below and above.
This was, some years ago, true for surface stations; to verify this still being true these days would cost a lot of time, however.
Thus I thought: why not to look at UAH’s 2.5 degree grid data?
Anyway, UAH is much more appreciated, isn’t it?
*
Here are four time series, generated today (thus including May 2022), shown together with
– a simple, 37 month running mean smoothing:
https://drive.google.com/file/d/1Ssf-fVwol1R-M3HkG5AOmg-bJ34_8an3/view
confirmed by
– a more complex, 37 month windowed Savitzky-Golay smoothing:
https://drive.google.com/file/d/1M8Qbw7F6WvifOK5VXCPHq84Kuku9l-7D/view
*
Yes, Bill Hunter: the red line, that’s ‘your Arctic’ {/sarc}.
It is the latitude band 80N-82.5N, the uppermost one for UAH6.0 (the three northernmost/southernmost bands no longer do contain data, as opposed to the previous revision 5.6).
Exactly the same latitude band as that used by DMI, isn’t it?
Linear estimates for the four bands, in C/decade:
– 80N-82.5N: 0.06 +- 0.01
– 70N-80N: 0.28 +- 0.03
– 60N-70N: 0.21 +- 0.02
– 60N-82.5N: 0.25 +- 0.02
Sorted out the difference between a time series and a distribution yet? Or are you going to continue to suggest that they are both the same really or that it doesn’t matter what the differences are?
First start proving that my hourly distribution for all active USCRN stations in CONUS+AK for the period 2002-2021 is wrong!
And then, when you succeeded, you can start playing teacher.
First acknowledge that you were wrong to claim that your daily from already rounded hourly data was more accurate than USCRNs own daily figures.
Oh! Again a dog poo from the little stalker!
Mirror, mirror on the wall.
Vietnam called La Nina not gone by April, they want their money back
https://youtu.be/wbPs7RZLUAo
Bin Didon…”What matters, Linsley-Hood…”
***
How about some friendliness here, you old Arab? I don’t call you by your last name, Didon. I refer to you affectionately as Binny.
I would say that he is rude because he is German, but that would be racist wouldn’t it?
Friendliness, Robertson?
Maybe yours when you name people you dislike ‘cheating SOB’s ?
Sorted out the difference between a time series and a distribution yet? Or are you going to continue to suggest that they are both the same really or that it doesnt matter what the differences are?
Oh! Again a dog poo from the little opinionated stalker!
Mirror, mirror on the wall. Tell Blinny that he is wrong.
From now on it might be hard not to think of you as an Evil Queen, Richard.
To go with you as an idiot?
No, dummy.
That would be U.
I agree there is a U in dummy. So you can spell. Congratulations.
He is the biggest piece on scum in here since David Appel
Superdeveloping Triple La Nina effect – USA edition
https://youtu.be/Q4dXdj2_CjU
Superdeveloping Triple La Nina effect British edition
https://youtu.be/1416S-dGDMw
I may bow out of here. Too much discussion that doesn’t fit facts.
Here are some facts:
https://www.drroyspencer.com/2022/06/uah-global-temperature-update-for-may-2022-0-17-deg-c/#comment-1318206
whatever discussion is to be had has to be done with recognition of these well established facts.
Here is another link of how those facts can be influenced via a few other means, keeping in mind that one quality of windows that is desirous is that one can continue to see through them.
https://www.vitroglazings.com/media/qjtlduqr/vitro-td-101.pdf
” … has to be done with recognition of these well established facts. ”
But… Bill Hunter!
Aren’t you yourself unable to recognize ‘well established facts’, e.g. that our Moon rotates about its polar axis, and even manage to discredit huge proofs of this fact as ‘academic exercises’, just because you don’t understand half of a bit of such proofs?
C’mon, guy, back down to the ground with all your feet.
Sorted out the difference between a time series and a distribution yet? Or are you going to continue to suggest that they are both the same really or that it doesnt matter what the differences are?
Oh! Again a dog poo from the little opinionated stalker!
So refined is Blinny. Not.
Bindidon wins Fanboy of the year award! Congratulations!
Merci / Danke / Thanks
Blinny is an obnoxious idiot who cannot admit that he gets things wrong.
Oh! Again a dog poo from the little opinionated stalker!
Bindiscum in now inventing imaginary nonexistent posts so he can argue about things nobody said, you don’t get any more psycho than that
Wasn’t that long ago when Me and RLH started predicting triple La Nina , now everyone sees it , everyone except Bindiclown of course
https://youtu.be/D0FRjZvqBTY
Can someone lend Blinny a mirror?
The super La Nina is fading fast.
https://www.cpc.ncep.noaa.gov/products/analysis_monitoring/enso_update/heat-last-year.gif
https://www.cpc.ncep.noaa.gov/products/analysis_monitoring/ocean/weeklyenso_clim_81-10/wkd20eq2_anm.gif
https://www.tropicaltidbits.com/analysis/ocean/nino34.png
Did it accomplish all that you were hoping it would?
So you claim for now. We shall see later on this year won’t we.
Last 90 days animation of sea surface temperatures.
https://coralreefwatch.noaa.gov/data/5km/v3.1/current/animation/gif/ssta_animation_90day_large.gif
Last 7 days of sea surface changes
https://www.tropicaltidbits.com/analysis/ocean/cdas-sflux_ssta7diff_global_1.png
“We shall see later on this year wont we.”
We are seeing it happening right now.
Here are the wind anomalies shifted to neutral.
https://www.cpc.ncep.noaa.gov/products/analysis_monitoring/enso_update/u850a_c.gif
And
http://www.bom.gov.au/climate/enso/monitoring/nino3_4.png
Yes, Hunter, we know that you can’t understand the basic physics of the Green Plate model. The thought experiment (and my demo) involve radiation heat transfer in a vacuum environment.
Your window stuff does not use a vacuum between the glass plates, but gives a comparison with different gas fillings. Also, the window data is for a system using low-e glass coating on the 3rd surface, so there is “back radiation” involved. Basic engineering stuff there, first published in 1995, but from decades of other research.
Read the text Swanson. Don’t just look at the pictures.
Good idea, Bill:
You were saying?
I did. So what?
So Swanson I laid out my view on the thing. Do you think you can verbalize exactly what it is you object to? Seems to me you are just highlighting all along: ”transfers heat from the warm glass to the cold glass”
But in an atmosphere there are no air gaps. But you get perhaps an R-2 value for losing the convection.
the point here is to point out all that insulation does is bring something only warmed on one face up to an equilibrium with the radiation field.
You understand that a greenplate laying on the ground in a vacuum will be 290k under a 400w/m2 radiation field.
Raise it off the ground and it will remain at 290k and continue to keep the ground warm despite the vacuum gap because the plate will be 290k having 400w/m2 hit it from both sides and the ground will have zero energy loss.
Shine 400w/m2 on both sides of a plate it will be in equilibrium at 290k.
If the ground is 0k and you put a plate above the ground in a 400w/m2 radiation field it will start out at 244k and it will warm to 400w/2 as it warms the insulated ground under it.
Make the plate a 100% transparent and the plate above the ground will remain at 244k while the ground warms to 292k.
Add another transparent plate and nothing happens to the ground but the 2nd plate will warm to 244k and the first plate being exposed to the both the 2nd plate and the 292k ground will warm to 262K.
With radiation energy loss is not necessary. Take a plate and infinitely insulate it with separated transparent plates on both sides then shine a 400w/m2 onto both sides of the insulated unit and the unit in its entirety will warm to 292k with absolutely zero heat loss.
do nothing as it will warm to 290k and transmit the 400w/m2 through the plate and warm the ground to 290k because the ground is insulated.
Make the plate transparent
and only warm it with radiation from the ground and it will drop in temperature from 290K to 244K in a vacuum.
Raise it off the ground in an atmosphere and it does nothing as it will still be 400k as confirmed by every experiment in the atmosphere you have seen. And despite the shading of the plate the ground will still be 400k.
And a second plate in the atmosphere
To put it more simply. Radiation from the surface really doesn’t matter as radiation gets insulated, convection becomes more dominant.
What one must understand is convection, not radiation. Does CO2 regulate convection? I don’t think so. Convection is nearly an order of magnitude greater than CO2. CO2 is nothing without the unproven hypothesis that CO2 controls water vapor.
We see as the sun goes down a rapid cooling that bottoms out quite rapidly. Roy’s backyard nighttime sky temperature exercises show how fast things change as clouds come and go.
“Make the plate a 100% transparent and the plate above the ground will remain at 244k while the ground warms to 292k.
Add another transparent plate and nothing happens to the ground but the 2nd plate will warm to 244k and the first plate being exposed to the both the 2nd plate and the 292k ground will warm to 262K.”
I dont get that Bill. Why would the ground not continue to warm, when you have added more (transparent) insulation?
How can light and a gas be compared in strength, Bill?
Speaking of the GP and BP model I thought it was interesting how the JWST heat shield is a good case study. According to the contrarian school of thought the hot, cold, and layers (aka plates) in between should be the same temperature. Yet in reality after just a few days of deployment a significant gradient developed through the layers with the hot and cold sides stabilizing around 328K and 70K respectively.
Wrong bdgwx. The plates would ONLY be the same temperature if they were perfect black bodies.
The JWST actually demonstrates how an “atmosphere” can cool a “planet”.
For those who may not know I’m referring to this.
http://rabett.blogspot.com/2017/10/an-evergreen-of-denial-is-that-colder.html
The original thought experiment is that of the Sun on the left, a flat body (the blue plate BP) in the middle, and space on the right in this configuration.
Sun => BP => Space
Then with the addition (or splitting of the BP into 2) of another flat body (the green plate GP) to the right of the BP we have this configuration.
Sun => BP => GP => Space
There is a similar configuration with the JWST heatshield. When it is folded up it behaves as a single body not unlike the BP in the original thought experiment with this configuration.
Sun => HS => Space
But when it unfolds gaps in the original body form with new layers (or plates) being added in this configuration.
Sun => HS1 => HS2 => HS3 => HS4 => HS5 => Space
Just as in the original thought experiment where the BP warms in the presence of the GP the HS1 layer (or plate) warms in the presence of the other layers (or plates). We actually got to see that play out as it happened with the hot side warming from 266K to 328K 6 days after deployment. Simultaneously the cold side cooled further even without the cryocooler turned on. Modeling of this expectation prior to launch was nearly spot on with observations.
BTW…there is an extension of the simple BP/GP configuration with multiple plates (not unlike the JWST heatshield) described here.
http://rabett.blogspot.com/2018/08/the-simplest-green-plate-effect.html
Wrong again, bdgwx.
A blackbody plate perfectly insulated on its back would reach a temperature of 394K, at L5. The series of heat shields COOL the JWST.
Your “plates” nonsense violates 2LoT. You don’t understand any of this.
The JWST actually debunks several of your cult beliefs. In addition to destroying your “plates” nonsense, the JWST verifies that a surface must be extremely cold to absorb low energy photons.
The JWST also demonstrates that “orbiting without axial rotation” means one side always faces the inside of the orbit.
Science and reality always triumph over cult myths.
Wrong.
“the James Webb Space Telescope’s optics and scientific instruments need to be cold to suppress infrared background ‘noise’ ”
The suppression of noise is nothing to do with the ability to absorb IR.
Yeah RLH, this involves physics so you won’t understand any of it.
The “noise” refers to photons being emitted by JWST itself. So by making the JWST as cold as possible, that “noise” (emitted photons) is reduced. So the suppression of noise is important to the ability to absorb IR (and even lower energy photons).
The JWST is attempting to absorb very low energy photons from space. Consequently, the serious effort to maintain a very low temperature. A warm surface is not a good absorber of low energy photons. That’s one of the reasons ice cannot boil water.
“So the suppression of noise is important to the ability to absorb IR”
Wrong again. Distinguishing signal from noise means that the signal has been absorbed in the first place.
I did an awful lot of signal to noise stuff in the past.
….Distinguishing signal from thermal noise….
As I stated RLH, you won’t understand any of this.
You always claim you know what you’re talking about, but you proceed to fall flat on your face. Like the time you claimed you understood vectors, but couldn’t do the simplest vector addition.
That’s why this is so much fun.
(I won’t respond to your usual nonsense.)
“Like the time you claimed you understood vectors, but couldnt do the simplest vector addition”
Liar. I do simple vector addition all the time and the consequences of me getting things wrong are slightly more than a wrong blog post.
Wrong RLH. You were unable to add the vectors. You had apparently never worked with polar coordinates.
You don’t have a clue about physics. You just talk big but can’t deliver. Then, when you get caught, you resort to calling people “liar”.
You don’t fool anyone.
“You were unable to add the vectors”
Wrong.
Well link us to your correct answer, RLH.
Or are you just blabbing again?
Link to where I failed to add vectors.
There you go:
https://www.youtube.com/watch?v=xfr64zoBTAQ
Willard = idiot.
Once again RLH is all talk but no substance.
Once again Clint R is an idiot.
..and the JWST heatshield uses reflective surfaces, not blackbody surfaces. Thus invalidating any comparison to the GPE.
Thanks, bd.
Thanks, Clint R.
😊
🐉
bdgwx says:
Just as in the original thought experiment where the BP warms in the presence of the GP the HS1 layer (or plate) warms in the presence of the other layers (or plates).
————————
You are assuming that the umbrella wasn’t at equilibrium with the sun to begin with. If it were then all the plates would cool. the ones in more layers of shadow than the others would cool faster.
thats why its nonsense to say the GP warms the BP. To say the GP is warming the BP with its radiation is like saying if I give you $2 and you give me $1 back I am the one getting richer. You can’t con a 3rd grader with such an argument. Its hard me to figure how anybody can be so inculcated to con themselves with that.
This cooling system employs basic shading as only one of many cooling technologies its using.
It is using a V-groove reflective baffle system to effectively increase the efficiency of the layered shield system.
It uses low e coatings and polished aluminum surfaces to reflect away energy at all levels of the system.
This makes it many times more effective than a few plates.
Where it gets interesting is how light waves can degrade down to harmonic vibrations (thermoacoustics) an apparent problem at extremely long wave length IR where the vibrations blur IR images. Here they use a very sophisticated system using helium gas in a refrigeration loop to get it down a few more kelvin.
> To say the GP is warming the BP with its radiation is like saying if I give you $2 and you give me $1 back I am the one getting richer.
It is rather like saying that without that 1$ back you will be poorer. By consequence your spouse will not be happy. Your accountant won’t be happy in any case for you failed to balance your toy example budget.
Hunter wrote:
Curious, where did you find that?
Years ago, there was research for solar collectors using a “V” shaped surface, which increased the emissivity, improving collector efficiency. More recent systems tend to use selective surfaces. For the JWST heat shield, the layers utilize a surface which is coated with aluminum and silicon, the likely result being a combination of high reflectivity with high emissivity on the Sun facing side, the net effect likely the opposite of that for a solar collector.
E. Swanson, I haven’t been able to find a more technical description of the JWST sunshield than your link, can you?
The 2nd shield from the sun side has to also have high reflectivity to deal with the sun shining thru eventual puncture holes in the 1st shield. Some sources read like the others are designed with cascading less reflectivity but I haven’t found technical papers describing the designs.
You’re richer by $1 than you would have been otherwise. Had I not given you back that $1 then you would have $1 less than you do now. You are richer than you would be otherwise because of me.
It is the same with energy. If you have a 1m plate receiving 1360 j/s and shedding 1360 j/s it will be at a steady-state temperature of T with a balanced energy budget. But if you then you return some of that 1360 j/s being shed from the plate back to the plate itself than the plate is now receiving more than 1360 j/s. It is now getting richer (in terms of internal energy) than it was. It responds to its new wealth of energy by warming. It will continue to warm until it’s shedding as much energy as it is receiving. That’s the 1LOT. And it is consistent with the 2LOT since the flow heat is still Sun (hot) => BP (warm) => GP (cool) => Space (cold).
Nope, you’re still confused bdgwx.
You’re making the same mistakes as others. You’re trying to add fluxes. You’re trying to boil water with ice.
That ain’t science. You don’t understand any of this, and you can’t learn.
Swanson/Ball4,
I’ve been trying to find the material properties of the sunshield as well. The aluminum and silicon doping certainly makes the 1st and 2nd layers highly reflective to the incoming radiation while the highly emissive Kapton polyimide base makes it an effective radiator. But what are the properties exactly? Anyway, it is remarkable that, as I type this, the hot side of the 1st layer is at 322 K and the cold side of the 5th layer is at 42 K. That is a significant thermal gradient.
From the producer site, the emissivity of opaque regular aluminized Kapton can be as low as .03 over the range of sun illuminated space operating temperatures.
bdgwx writes 9:01 am: “since the flow heat is still Sun (hot) => BP (warm)..”
That would physically be the flow of energy (EMR) in the defined vacuum of the GPE as Eli showed in the original solution some 5 years ago. bdgwx’ miss-use of the term “heat” is preventing bdgwx from understanding why & how ice cubes can boil water.
I always use the term “heat” for the concept of the net transfer of energy.
Do we have reasonable estimates of the reflectivity and emissivity of the 1st layer of the sunshield?
I think if I were building a sunshield I would want it to be highly reflective to the incoming radiation and highly emissive at its operating temperature. Based only on the minimal research I did the aluminum and silicon doping provides a good balance between being reflective in the shortwave and emissive in the longwave. It’s just really hard to find the exact properties of the JWST sunshield. It also wouldn’t surprise me if the exact formulations are tuned for each layer as well. I know the shape, size, and distance between layers was very precisely tuned.
bdgwx says:
”Youre richer by $1 than you would have been otherwise. Had I not given you back that $1 then you would have $1 less than you do now. You are richer than you would be otherwise because of me.”
Not if you were already as rich as the law allows.
Bill Hunter said: “Not if you were already as rich as the law allows.”
What law says that the BP cannot receive energy being sent by the GP?
What law says the outermost layer of the JWST sunshield cannot receive energy being sent by the next layer?
No law against energy from the GP being “received” by the BP, bdgwx. However, the energy which set and maintains the GPs temperature came from the BP in the first place. So there is a law which prevents the energy from the GP going back to the BP and warming the BP further. That law is called “2LoT”.
Wrong DREMT 12:46 pm, there is no law which prevents the EMR energy from the GP going back to the BP and warming the BP further when the incident EMR is absorbed as that satisfies both the 1LOT & 2LOT since universe entropy is increased in that process.
This was proven in the experiments by Dr. Spencer which you claim to have read but obviously do not understand.
Nice try but no cigar, Ball4.
You forgot the photons absorbed MUST raise the average kinetic energy or no warming will occur.
DREMT got it right. You fell flat on your face, again.
> there is a law which prevents the energy from the GP going back to the BP and warming the BP further
There is a law forbiding drunken guys to pee against city walls. People still do it. And some walls have a special paint to make them pay:
https://www.cbc.ca/news/trending/german-city-uses-water-repellent-paint-to-splash-public-urinators-with-their-own-pee-1.2985123
That urinators get splashed does not go against any physical laws.
2LOT has no exceptions written into it.
That doesn’t mean that exceptions cannot exist but if you are going to abide by the laws of physics you have to go through the process of changing the law. As I see it a game is being played. If a 244K rock is being radiated at by a 290k rock, its the 244k rock that warms not the 290K rock. Yet you morons think it would be the 290k rock.
Bill, your 290K rock is also emitting EMR to your 244K rock in its view. The sign convention on proper 1LOT balance solution will show which is warming. Read Eli’s 2017 solution for the correct GPE eqn.s.
—–
Amusing comment Clint R 2:33 pm, since before Eli’s eqn.s reach equilibrium (steady state actually) the added EMR absorbed from GP during the photon absorp_tion process must raise the BP total constituent KE thus the BP avg. KE is higher as actually demonstrated in Dr. Spencer’s experiments which means that the 1LOT is satisfied.
For the absorbed EMR to BP KE process Q/T is positive so 2LOT is satisfied, universe entropy increases. Thus DREMT/Postma are wrong and Clint R continues to be great entertainment with much botched physics.
"Read Eli’s 2017 solution for the correct GPE eqn.s."
According to E-Lie’s debunked solution, a Source Plate (SP)/rock at 290 K and a Blue Plate (BP)/rock at 244 K, with view factors = 1 between them, would settle at the following temperatures:
SP = 311.5 K, emitting 533.33 W/m^2.
BP = 262 K, emitting 266.67 W/m^2.
[assuming the SP/rock has an internal heat source of 800 W, which it emits over its two sides of 1m^2 each to emit 400 W/m^2 initially, before the BP is introduced].
Ball4 worships someone claiming to be a bunny rabbit.
Ball4, like most of the cult idiots, has not grown out of childhood yet.
The funny thing is, Norman worships Ball4!
Bill Hunter,
The 2LOT says that heat passes from hot to cold when the system is evolving by its own means [*]. Heat is the net transfer of energy.
The net transfer of energy (heat) in the Sun, BP, and Space system is Sun => BP => Space. The net transfer of energy (heat) when you add the GP is Sun => BP => GP => Space. Both are consistent with the 2LOT. The addition of the GP and the warming of the BP does not mean that there was a net transfer of energy (heat) from the GP to the BP. The net transfer of energy (heat) is still BP => GP. The reason the BP warms is because there is a net transfer of energy Sun => BP and because the net transfer of energy BP => Space got reduced by the placement of the GP acting as a thermal barrier. The important concept here is the net transfer of energy.
To declare a violation of the 2LOT you have to 1) show the system was evolving by its own means and 2) that there was a net transfer of energy from cold to warm. The BP/GP thought experiment is evolving by its own means and no heat (net transfer of energy) is occurring from cold to hot it is invalid to declare it a violation of the 2LOT.
[*] “evolving by its own means” is an important clause and has many incarnations including “self-acting”, “without some other change”, “spontaneous”, etc. and the more modern and generalized phrase “for an isolated system”.
bdgwx, the violation of 2LoT is the difference in temperatures your “arithmetic” creates. Arithmetic is NOT physics. Fluxes don’t add. Two ice cubes are NOT hotter than one ice cube.
You don’t understand ANY of this, and your long rambling, babbling, keyboard dumps mean NOTHING.
But, don’t let reality stop you….
> Arithmetic is NOT physics.
An equation *is* an equation, Pup.
If you splash on a blog, do NOT claim that getting splashed back is against the laws of physics.
Now worthless Willard throws in with his childish nonsense trying to “support” the rambling, babbllng keyboard dump from bdgwx!
bdgwx is just another cult fanatic. He’s just another version of Ent. They see nothing wrong with trying to pervert reality.
That’s why this is so much fun.
I made a simple point, Pup, and here’s what Kiddo fails to do:
https://www.cs.tau.ac.il/~nachum/papers/survey-draft.pdf
He simply repeats stuff without preserving the quantities that the basic equation designates. He did that in another context.
Want me to recall it?
https://andthentheresphysics.wordpress.com/2021/04/25/mind-your-units/
Willard is probably referring to his “Mind Your Units” article over at ATTP in which he was so fixated on a particular energy balance model equation that he failed to understand what I was explaining to him, at great length, just because it didn’t fit with his understanding of said equation. The fact that nothing I was explaining to him was wrong didn’t seem to matter to him. In the end we spent a great deal of time with me talking past Willard whilst he over-moderated and eventually banned me just for not saying what he wanted me to say. In the course of discussing the article I even wrote out a couple of equations for him, which he failed to understand, but he has for some reason ever since got it into his head that I don’t understand equations, just because I didn’t discuss the particular energy balance model equation that he wanted me to.
This is pretty much all I was trying to explain:
https://www.drroyspencer.com/2021/04/an-earth-day-reminder-global-warming-is-only-50-of-what-models-predict/#comment-680669
Note that other people understood it, even regulars at ATTP.
Kiddo might have forgot his brilliant demonstration:
https://andthentheresphysics.wordpress.com/2021/04/25/mind-your-units/#comment-190932
Observe how Kiddo only rewrote the left part of the equation is was supposed to solve.
Worthless Willard understands none of this.
DREMT is showing how solar should be treated, if you’re going to accept that flux can be divided/averaged. The solar flux averaged over the hemisphere would then be 480 W/m^2, as DREMT’s equation shows.
For an imaginary BB surface, the resulting temperature would then be 303K.
Oh, Pup. It gets better and better:
https://andthentheresphysics.wordpress.com/2021/04/25/mind-your-units/#comment-190943
Have you noticed how flux is divided? Recall that division is the inverse of multiplication, which is a series of additions.
Correct child, you understand none of this.
(I won’t waste anymore time with you since you can’t make a coherent, relevant point.)
Lucky for me there’s very little to understand, Pup –
An equation has a left side, a right side, and the equal sign in between. Kiddo cannot write an equation properly, let alone rewrite it. No wonder then that he keeps butchering Eli’s simplistic equation.
DREMPTY,
“No law against energy from the GP being received by the BP, bdgwx. However, the energy which set and maintains the GPs temperature came from the BP in the first place. So there is a law which prevents the energy from the GP going back to the BP and warming the BP further. That law is called 2LoT.”
Sorry charlie, that’s energy transfer from the green plate to the blue plate, not heat, the heat transfer is from the blue plate to the green plate.
So not prohibited by the second law.
Correct bob, there is no heat from GP to BP, just as DREMT indicated. But, your cult’s nonsense has GP warming BP! Your cult violates 2LoT.
Obviously, you’re too braindead to understand any of this.
Clint R,
You need to use the terms heat and warms properly. You need to separate technical usage of terms from everyday usage, that’s where your problem lies.
“Correct bob, there is no heat from GP to BP, just as DREMT indicated. But, your cults nonsense has GP warming BP! Your cult violates 2LoT.
Obviously, youre too braindead to understand any of this.”
As long as there is no heat transfer from green plate to blue plate the green plate can warm the blue plate, without violating the second law.
You don’t understand any of this, because you never took any thermodynamics courses.
Thanks for quoting me correctly, bob.
The rest of your comment is nonsense, as usual.
“Total power in = Total power out = xy(1-a)”
So beautiful.
"No wonder then that he keeps butchering Eli’s simplistic equation."
I don’t. I demonstrated again at 4:10 PM yesterday that I understand E-Lie’s math perfectly well.
And so Kiddo soldiers on, powered by constant assertion.
Assertions = Assertions.
Of course, if Willard thinks he can fault what I wrote at 4:10 PM yesterday, he is free to try and do so.
Of course Kiddo believes he presented explicit calculations because he used the “=” operator.
Hence why his pea and thimble game over the SB law can lasts years.
So he can’t fault it. Thought not.
[HAMM] *Makes some assertions while waving his arms*.
[CLOV] These are mere assertions.
[HAMM] See? Clov can’t fault my assertions.
No assertions, Willard. Just numbers I have calculated. If you understood any of this, you would be able to check for yourself whether those numbers were correct…
> Just numbers I have calculated.
No calculations have been forthcoming. Weird.
Here are empty assertions:
Instead of calculating properly, Kiddo returns to The Game.
A game he never wins.
Really weird.
The situation with the plates is specified, Willard, and there is only one answer to what the plate temperatures and emissions would be, according to E-Lie’s math and logic. If you understood any of this, you would be able to check for yourself whether those numbers were correct…
Incapable of making sure his equation balances out at each step, Kiddo soldiers on.
We need better cranks.
Incapable of understanding Eli’s math, and thus being unable to check for himself that the answers I gave were correct according to it, Willard soldiers on.
We need better cranks.
The solution the BP/GP thought experiment as written is BP = 262 K and GP = 220 K.
For a 5 plate system it is 277 K on the hot side and 185 K on the cold side.
These are the numbers that are consistent with both the 2LOT (net energy transfer is from hot to cold) and 1LOT (input and output energy balanced at steady-state for the system as a whole and each plate individually).
Note that the JWST sunshield is not an idealized system due to the layers not being blackbodies and shaped to maximize radiation out the edges. It is tuned specifically to produce a large gradient, pass as little incoming energy to the cold side, and shed as much outgoing energy from the cold side in the specific environment at which JWST operates.
“The solution the BP/GP thought experiment as written is BP = 262 K and GP = 220 K.”
Incorrect…that solution violates 2LoT, as explained.
DREMPTY,
Debunking debunked
There is no heat transfer from the green plate to the blue plate, so there is no 2nd law violation.
The heat transfer is always from blue plate to green plate.
And also verified by experimental evidence by competent experimentalists.
Incompetent experimenters need some work.
I will just repeat Clint R:
"Correct bob, there is no heat from GP to BP, just as DREMT indicated. But, your cult’s nonsense has GP warming BP! Your cult violates 2LoT.
Obviously, you’re too braindead to understand any of this."
BP radiates at 267 W/m2 toward the GP.
GP radiates at 133 W/m2 toward the BP.
The net energy flow (heat) is from the warmer BP to the cooler GP. No violation of the 2LOT there.
To show a violation of the 2LOT one must 1) show that the system is evolving by its own means and 2) show there is a net flow of energy (heat) from a cold body to a hot body.
I will just repeat myself, from earlier:
"No law against energy from the GP being “received” by the BP, bdgwx. However, the energy which set and maintains the GPs temperature came from the BP in the first place. So there is a law which prevents the energy from the GP going back to the BP and warming the BP further. That law is called “2LoT”."
Except the green plate does not warm the blue plate further.
The blue plate is warmed by the heat source or the sun, not the green plate.
Experimental evidence supports this.
"Except the green plate does not warm the blue plate further."
Good, so you agree the BP does not warm when the GP is introduced. That’s that, then.
The 2LOT does not say that. It does not say that a cold body cannot send energy to a hot body. What it says is that heat cannot move from cold to hot when the system is evolving by its own means. Heat is the net transfer of energy.
"The 2LOT does not say that. It does not say that a cold body cannot send energy to a hot body"
Nor did I say that it said that. Try reading the comment again.
DREMPTY,
This is what you said
” So there is a law which prevents the energy from the GP going back to the BP and warming the BP further. That law is called 2LoT.”
It is incorrect.
The energy does go back to the blue plate.
The second law is about heat and entropy, not energy transfer.
No, bob, this is what I said, in full (pay attention to the first sentence):
"No law against energy from the GP being “received” by the BP, bdgwx. However, the energy which set and maintains the GPs temperature came from the BP in the first place. So there is a law which prevents the energy from the GP going back to the BP and warming the BP further. That law is called “2LoT”."
DREMPTY,
When you have two statements separated by an and, if either statement is wrong then the whole thing is wrong.
That’s basic logic.
You fail again.
The green plate still doesn’t heat the blue plate, even though the blue plate gets warmer with the presence of the green plate.
bob is extremely desperate, and fails basic reading comprehension. I’m not saying that 2LoT prevents energy going from the GP to the BP. I’m saying it prevents said energy from warming the BP. Any other (non-desperate) human being would have understood that.
> that solution violates 2LoT, as explained.
Incorrect on both counts.
There is no violation, and there was no explanation.
Incorrect.
I will just repeat this comment:
“To show a violation of the 2LOT one must 1) show that the system is evolving by its own means and 2) show there is a net flow of energy (heat) from a cold body to a hot body.”
I will just quote bdgwx from earlier:
“To declare a violation of the 2LOT you have to 1) show the system was evolving by its own means and 2) that there was a net transfer of energy from cold to warm. The BP/GP thought experiment is evolving by its own means…“
So bdgwx agrees his own 1) is met. His 2) is just nonsense. The GPs temperature is set and maintained by the BP. So energy from the GP cannot warm the BP further.
DREMT said: Im saying it prevents said energy from warming the BP.
The 2LOT does not say that either. The 2LOT only says delta-S = dQ/T >= 0 for an isolated system.
A simple experiment to prove that there must be a misunderstanding is to consider the oven in your home which I think everyone will agree does not violate the 2LOT regardless of which configuration it is in. When turned on without the door placed into service the steady-state temperature will be low. The heat flow in that configuration is Burner => Inside => Outside. But when you close the door the inside will begin warming (dT_inside > 0) with a new stead-state achieved a high temperature. The heat flow in that configuration is Burner => Inside => Door => Outside. In the same way the placement of the GP caused dT_BP > 0 the placement of the door caused dT_inside > 0 even though there was no heat (net transfer of energy) from either GP to BP or from Door to Inside.
I tell you what, bdgwx. Instead of all the usual obfuscation on 2LoT and the predictable devolution of the discussion into various inapt analogies based on insulation (the GP is as far away from being an insulator as it is physically possible for an object to be, by the way) – let’s try something different.
You give me an example, based on the framework of the GPE (so, set in space, vacuum environment, something involving a BP and a GP perhaps) which you would agree violates 2LoT. Please give me the temperatures of the plates, and what they would emit, in a configuration that you believe violates 2LoT.
A prediction that the Sun-side cools and the mirror-side warms for the JWST sunshield would be a violation of the 2LOT since it requires heat (net transfer of energy) to move from cold to hot.
A prediction that each layer in the JWST sunshield be at the same temperature at steady-state would be a violation of the 1LOT since it requires Q > 0 and dU = 0 which is obviously impossible.
The only configuration that satisfies both the 1LOT and 2LOT is for a gradient to develop across the layers with the Sun-side layer being the warmest and the mirror-side layer being the coolest.
I will simply repeat this –
“The 2LOT only says delta-S = dQ/T >= 0 for an isolated system.”
Let Kiddo try to bury that one under another wall of words.
Let’s try that again:
You give me an example, based on the framework of the GPE (so, set in space, vacuum environment, something involving a BP and a GP perhaps) which you would agree violates 2LoT. Please give me the temperatures of the plates, and what they would emit, in a configuration that you believe violates 2LoT.
For the JWST sunshield L1-L5 the following prediction violates the 2LOT because it requires delta-S = dQ/T < 0 or a net transfer of energy from cold to hot.
Sun (5780K) => L1 (70K) => L2 (134K) => L3 (199K) => L4 (264K) => L5 (328K) => 3K (Space)
For the JWST sunshield L1-L5 the following prediction violates the 1LOT because it requires Q > 0 and dU = 0 at L1 and Q L1 (199K) => L2 (199K) => L3 (199K) => L4 (199K) => L5 (199K) => 3K (Space)
There is an infinite number of ways to make predictions that violate the 1LOT and/or the 2LOT. The above is but only an example of how a prediction would violation one of the laws.
OK, let’s just look at the situation between the Sun and L1 to start with:
Sun (5780K) => L1 (70K)
How would the Sun at 5780 K only heat L1 to 70 K?
It wouldn’t given any reasonable material properties for L1. That’s why it is a violation of the 2LOT.
I have a response, but WordPress is not currently allowing me to post it. Oh well.
Let’s try:
…but where is there a "ne.t transfer of energy from cold to warm" in Sun (5780K) => L1 (70K)?
The 2LOT violation is the heat flow in this chain.
L1 (70K) => L2 (134K) => L3 (199K) => L4 (264K) => L5 (328K)
Heat (net transfer of energy) cannot occur from L1 to L2, L2 to L3, L3 to L4, or L4 to L5 because each of those would be from cold to hot.
Heat (net transfer of energy) from just Sun (5780K) to just L1 (70K) is compliant with the 2LOT since it is from hot to cold.
Ah, so your 1:11 PM comment was wrong.
My comment at 1:11 is correct. 70K is not a realistic value for L1 of the JWST sunshield. Neither is L2 at 134K, L3 at 199K, L4 at 264K, or L5 at 328K. The 2LOT prohibits this which is the real L1-L5 and instrument/mirror temperatures are nothing like that. The real temperatures developed with the opposite gradient.
It’s not correct, because you said in your 1:11 PM comment that Sun (5780K) => L1 (70K) was a violation of 2LoT, and then you said in your very next comment (at 1:43 PM) that it wasn’t a violation of 2LoT.
Moving on…
"Heat (ne.t transfer of energy) cannot occur from L1 to L2"
Let’s take a little look at what’s happening:
L1 is at 70 K. If it was a blackbody, it would be emitting 1.36 W/m^2.
L2 is at 134 K. If it was a blackbody, it would be emitting 18.28 W/m^2.
So "ne.t transfer of energy" would be from L2 to L1. So no "ne.t transfer of energy" would be occurring from L1 to L2.
DREMT said: “Its not correct, because you said in your 1:11 PM comment that Sun (5780K) => L1 (70K) was a violation of 2LoT”
That is not what I said. What I said is that 70K for L1 is a violation of the 2LOT. It is a violation because the L1 => L2 => L3 => L4 => L5 flow chain is reversed contrary to the 2LOT requirement for the Sun, L1-L5, and Space system.
DREMT said: “So “ne.t transfer of energy” would be from L2 to L1. So no “ne.t transfer of energy” would be occurring from L1 to L2.”
In that hypothetical non-realistic 2LOT-violating prediction with L1 cooling to 70K and L5 warming to 328K the temperatures of L1-L5 is behaving contrary to the way heat (net transfer of energy) should be moving.
In real life there is no way for L1-L5 to maintain 70K, 134K, 199K, 264K, and 328K respectively and comply with the 2LOT. L1 must warm since Q > 0. Similarly L5 must cool since Q T1 > T2 > T3 > T4 > T5 > Space.
bdgwx said:
"To show a violation of the 2LOT one must…show there is a net flow of energy (heat) from a cold body to a hot body".
Yet in his own example that he has given as being a violation of 2LoT, he cannot show there is a net flow of energy from a cold body to a hot body. This proves that his condition that you must "show there is a net flow of energy (heat) from a cold body to a hot body" is a nonsense.
Predicting that L1 would cool from ~265K to ~70K despite the Sun and L2 being warmer is the epitome of heat moving from hot to cold in violation of the 2LOT.
Thank you for your assistance in making my point for me, bdgwx, you have been most helpful. I have no further need of your services.
I will just repeat –
[HAMM] That is not what I said.
[CLOV] Thank you for making my point.
We already know you cannot follow a discussion, Willard. No need to keep demonstrating that over and over again.
No, you can’t follow a conversation, DREMT.
All bdgwx’s replies are with context of all 5 plates in the scenario.
When you commented only on L1 and sun, bdgwx maintained the context of the 5-plate system when replying.
You then either didn’t understand he’d done that, or elected to pretend he hadn’t in order to claim he’d contradicted himself. You kept doing this even after he spelled it out for you immediately after your miscomprehension.
You do not discuss in good faith.
The comments are there for everyone to read, barry. In my opinion, bdgwx contradicted himself, and then tried to wriggle out of it. I still think that is the case. However, that is not the point I am thanking him for helping me make, regardless. The point I am thanking him for helping me make, was made here:
https://www.drroyspencer.com/2022/06/uah-global-temperature-update-for-may-2022-0-17-deg-c/#comment-1320688
…and it involves “the context of the 5-plate system”, not Sun >> L1. You may have noticed I wrote “moving on…” in the preceding comment. That was to indicate the Sun >> L1 discussion was over, and that I was moving on to discuss the next point…the main point of getting bdgwx to come up with his own example of a 2LoT violation…which is, as I said:
https://www.drroyspencer.com/2022/06/uah-global-temperature-update-for-may-2022-0-17-deg-c/#comment-1320688
Nope, you’re still hanging your hat on Sun -> L1.
bdgwx clearly stated that if the sun is the source and the temperature gradient through the plates is positive, that is a violation of the 2nd Law.
Sun —> L1 < L2 < L3 < L4 L1 > L2 > L3 > L4 > L5 is not a violation
That’s bdgwx’s point. It’s very straightforward.
You are changing what he said to make your point. And yes, everyone can read this thread for themselves.
Unfortunately the website reformatted my post.
There were 2 lines
Sun —> L1 less than L2 less than L3 etc
This is a violation of 2LoT
Sun —> L1 greater than L2 greater than L3 tc
Is not a violation.
This was bdgwx’s point, easy to understand, yet somehow misconstrued by you.
Rebutting what you would have preferred he said doesn’t work, and is called a straw man.
“Nope, you’re still hanging your hat on Sun -> L1.”
False, barry. After discussing Sun >> L1, I said, “Moving on…”
Read from “Moving on…”, onwards.
Then there is no substance to your assertion. You have simply said he’s wrong without showing it.
False, barry. bdgwx said:
"To show a violation of the 2LOT one must…show there is a net flow of energy (heat) from a cold body to a hot body".
Yet in his own example that he has given as being a violation of 2LoT (and which I agree clearly violates 2LoT), he cannot show there is a net flow of energy from a cold body to a hot body. This proves that his condition that you must "show there is a net flow of energy (heat) from a cold body to a hot body" is a nonsense.
Try it for yourself. Calculate the blackbody emission from L1 and L2. The “ne.t flow of energy” between them will be from L2 to L1. Hot to cold. Repeat with L2 and L3. Same story. It should be obvious that it is impossible to show a “ne.t flow of energy” from a cold body to a hot body. Yet this is what bdgwx specified you had to do to show a violation of 2LoT. You cannot do so even in his own example of a 2LoT violation!
> Try it yourself.
Instead of offering his own formal derivation, Kiddo reverses the burden of proof once again.
Everybody can see it, yet he soldiers on.
No “formal derivation” is necessary, Willard. My, you are thick.
That’s where you’re wrong, Kiddo.
The *only* time you tried to formulate your position using an equation, you revealed to the world that you have no idea how that works.
The Second Law can be expressed with an equation.
If you try to formulate your position using the Second Law equation, you will reveal to the world that you have no idea how it works.
Years and years of trolling without being able to make an elementary problem explicit.
Joy.
“The *only* time you tried to formulate your position using an equation, you revealed to the world that you have no idea how that works.”
Willard, none of the equations I wrote out for your “Mind Your Units” article were wrong.
Indeed, Kiddo –
Your equations were not even wrong.
Here you are. Pretending Eli’s maths was OK, but getting different results without showing your homework.
Silly sock puppet.
The equations were absolutely correct, Willard.
This wasn’t an equation as such:
Total power in = Total power out = xy(1-a)
Where x = the solar constant, y = disk surface area, a = albedo
I mean I guess I could have written it:
Total power in = xy(1-a)
Total power out = xy(1-a)
It was just such a simple concept that it didn’t even need writing out in any form, but since I was dealing with a complete idiot, I had no idea how to get it across to you. You were struggling so much to understand something so simple that it got to the point I was running out of ideas of how to explain it (for the 100th time). It really is comical reading through those comments now. I’m amazed you sometimes still link to that article…how can you not be embarrassed!?
> Total power in = Total power out = xy(1-a)
So you’re saying that
[KIDDO’S MODULZ] xy(1-a) = xy(1-a)
right?
Compare your stoopid modulz with the usual one, and you should notice that some parameters are missing, in fact a whole side is missing.
So as I said, not even wrong.
He still doesn’t understand! After all this time he’s had to think about it.
Total power in = total power out.
You use the xy(1-a) formula to get the value for the total power that the Earth absorbs (in Watts, W). So you are multiplying the solar constant (which is in W/m^2) by the surface area of the "disk" absorbing said flux (which is in m^2), and then correcting for albedo, to get a value in Watts, W. This total power must then also be emitted. Conservation of energy, and all that. Minding your units so far?
As I told you at the time:
The other calculations which result in “flux in” or “flux out” just convert the total power (either in or out) involved to flux by dividing by the surface area involved. Flux is in W/m^2. So you divide power (W) by surface area (m^2) to get flux (W/m^2). I mean…how simple do I need to make this!?
It all boils down to:
At any given moment, the Earth absorbs 480 W/m^2 over half its surface area and emits 240 W/m^2 from its entire surface area. Flux is not conserved, but energy is, because the area the Earth absorbs the energy over is half that of the area that the energy leaves from.
Kiddo still writes a wall of words instead of a simple equation!
Correct Willard. DREMT cannot write a proper equation showing energy flux is not conserved so DREMT avoids doing so. Long time part of the amusing game being played by DREMT. Fun to watch.
I can’t make the equations any simpler than the ones you have been given already, Willard. It can’t be helped that you are one of the most unintelligent people I’ve ever encountered online. Oh well.
Now you have removed the sun from the example, DREMT, which provides the direction for the flow of heat. L1 should be the warmest, L2 cooler, being shaded by L1 etc. The reverse is a violation of 2LoT.
You have to change what bdgwx is saying to say he is wrong. Your words are there for anyone to read. And anyone can see that bdgwx’s explanation is easy to understand.
https://www.drroyspencer.com/2022/06/uah-global-temperature-update-for-may-2022-0-17-deg-c/#comment-1321047
“Yet in his own example that he has given as being a violation of 2LoT (and which I agree clearly violates 2LoT)…”
Kiddo also has a tendency to forget about the Earth, Barry, e.g.:
https://andthentheresphysics.wordpress.com/2021/04/25/mind-your-units/#comment-190953
The model, of course is Total power in = Total power out = xy(1-a), where x stands for the solar constant, y the disc area, and a is albedo.
So where’s the Earth?
Gone.
https://www.drroyspencer.com/2022/06/uah-global-temperature-update-for-may-2022-0-17-deg-c/#comment-1319742
Clint R had no problem understanding this:
Flux in (W/m^2) = xy(1-a)/z
Where x = the solar constant, y = disk surface area, a = albedo and z = the area of the hemisphere.
z = 2y
So:
Flux in (W/m^2) = xy(1-a)/2y = x(1-a)/2
Willard is just an idiot.
…and here, for completeness, is the equation for the flux out from the Earth:
Flux out (W/m^2) = xy(1-a)/w
Where x = the solar constant, y = disk surface area, a = albedo and w = the area of the sphere.
w = 4y
So:
Flux out (W/m^2) = xy(1-a)/4y = x(1-a)/4
It certainly not that hard to understand, Kiddo.
What is a bit more perplexing is why you would think you can make the Earth disappear without nobody noticing.
You’re not David Copperfield, you know.
Oh, and for completeness –
“z = the area of the hemisphere” is where you make the Earth disappear.
Willard revels in his own absolute lack of understanding of the simplest equations…
Kiddo cannot make his mind on how to represent the Earth:
x = solar constant
a = albedo
w = the area of the sphere
y = disk surface area
z = the area of the hemisphere
No wonder he could not read Joe’s Magnum Opus!
Willard, please keep embarrassing yourself.
An energy balance model is a model that balances the energy that comes in and the energy that comes out, Kiddo.
Who do you think you’re kidding?
#2
Willard, please keep embarrassing yourself.
Looks like Kiddo did not get that secret handshake:
[K] You need to then decide what measure of surface area you are going to divide that total power by.
[W] If you want to model the Earth, the choice is rather limited.
https://andthentheresphysics.wordpress.com/2021/04/25/mind-your-units/#comment-190999
The input power is divided by the hemisphere’s surface area. This is because the Sun shines constantly on only the hemisphere. So on a moment by moment basis, the Earth is only receiving energy over the hemisphere’s surface area. The output power is divided by the entire Earth’s surface area. This is because energy is constantly being emitted by the entire Earth’s surface area. So on a moment by moment basis, the Earth is emitting energy over the entire Earth’s surface area.
Input power = Output power (so energy is conserved, answering your earlier concerns).
Flux in – 480 W/m^2 – does not equal flux out – 240 W/m^2 -(because the surface area over which the incoming flux is being absorbed is only half that of the surface area over which the outgoing flux is emitted).
It’s really the simplest thing.
#3
Willard, please keep embarrassing yourself.
> This is because the Sun shines constantly on only the hemisphere.
Looks like Kiddo did not get that other memo:
https://andthentheresphysics.wordpress.com/2021/04/25/mind-your-units/#comment-190995
Did he think he could hide this blunder under a wall of words?
Probably.
Willard, you have serious problems. I’m not sure if it’s a learning disability, or if you’re just trolling me.
There’s nothing I can ever say to you that will convince you I’m right about this incredibly trivial, utterly simple matter, is there!?
So, I’m done. You’re on automatic responses from now on, on this thread.
#4
Willard, please keep embarrassing yourself.
Graham,
You’re the one who’s doing the trolling here.
The Earth receives light on a disc. The Earth emits energy from its whole surface. That’s why we divide by four.
No amount of prestidigitation will bypass that.
That’s why Joe presents a hemispherical model in his Magnum Opus. That’s why you cannot provide a clear-cut equation. That’s why you divide flux and power into two equations.
You have lost a long time ago.
Please stop trolling.
Clearly you’re in the mood to bait me into further responses…So OK then, here we go. If you want to divide the input power by the disk’s surface area, instead, you get 960 W/m^2 as the input flux. If you want to do that, be my guest.
#5
Willard, please keep embarrassing yourself.
You still do not get it, Graham.
Your pea and thimble trick does not work anymore.
Your reasoning, when properly understood, leads to two different quantities as an equality:
https://andthentheresphysics.wordpress.com/2021/04/25/mind-your-units/#comment-191013
Only your walls of words conceal that you’re saying
480 W/m^2 = 240 W/m^2
Please stop trolling.
As I explained, Willard…flux is not conserved, but energy is. 480 W/m^2 in does indeed balance, energy-wise, with 240 W/m^2 out…because the 480 W/m^2 is received over only half the surface area that the 240 W/m^2 leaves from. The scary thing about this is, I think your confusion is genuine! Do you understand that flux is measured in W/m^2? Do you understand that this means Watts (power) per square meter of area?
#5
Willard, please keep embarrassing yourself.
You still do not get it, Graham.
An energy balance model balances energy in and out or it’s not an energy balance model. The Earth gets in an out an average of 240 J of solar energy every second per square metre.
Your usual argument about fluxes is just a decoy. Your w-y-z misspecification is just a trick. Your misunderstanding of basic geometry is not my problem anymore.
Please stop trolling.
OK, let’s work through an example with simple numbers.
Input = 100 W/m^2 over an area of 10 m^2.
Output = 50 W/m^2 over an area of 20 m^2.
Input = 100 W/m^2 x 10 m^2 = 1,000 W.
Output = 50 W/m^2 x 20 m^2 = 1,000 W.
A Watt is a joule per second, so in one second 1000 J is input, and 1000 J is output. Energy is conserved…but flux is not. 100 W/m^2 does not equal 50 W/m^2.
#5
Willard, please keep embarrassing yourself.
You still do not get it, Graham.
The area of the input is not half the area of the output.
The light that falls over a hemisphere, when corrected for angles, is the light that falls over a disc.
Please stop trolling.
If you use the area of the disk, you end up with an input flux of 960 W/m^2 rather than the 480 W/m^2 you get when you use the area of the hemisphere.
You see, the surface area of the disk is smaller than the surface area of the hemisphere. When you take a number (x), and divide it by a small number (y), it equals a bigger number (z) than when you take the same original number (x), and divide it by a bigger number than the small number (y).
#5
Willard, please keep embarrassing yourself.
You still do not get it, Graham.
Your “If you use the area of the disk” only reveals your pea and thimble game. Sometimes you put the hemisphere on the left side, sometimes on the right side. Neither are correct.
Hence why your numbers keep changing.
The Earth does receive light on the area of a disc.
The Earth is not a hemisphere.
The proper ratio between the input and the output is 1 to 4.
Please stop trolling.
OK, lets work through an example with simple numbers, where the area that is emitting the flux is four times that of the area over which it is received.
Input = 200 W/m^2 over an area of 5 m^2.
Output = 50 W/m^2 over an area of 20 m^2.
Input = 200 W/m^2 x 5 m^2 = 1,000 W.
Output = 50 W/m^2 x 20 m^2 = 1,000 W.
A Watt is a joule per second, so in one second 1000 J is input, and 1000 J is output. Energy is conserved…but flux is not. 200 W/m^2 does not equal 50 W/m^2.
#5
Willard, please keep embarrassing yourself.
“100 W/m^2 does not equal 50 W/m^2.”
Of course not, DREMT 11:51 am has 2 different objects, one of 10 m^2 and one of 20 m^2; 10 does not equal 20. This is DREMT the magician’s attempt at illusion not a work of physics.
No, Ball4, one object, not two. Picture a sphere, with a heat source to one side of it. Only the hemisphere is irradiated. However, the sphere is warmed until it emits from its entire surface area. So it receives 100 W/m^2 over an area of 10 m^2 (the hemisphere), and emits 50 W/m^2 over an area of 20 m^2 (the sphere).
DREMT, the sphere receives 100 W/m^2 over an area of 10 m^2 and 0 W/m^2 over rest of its area of another 10 m^2, so there is just one object which has 20 m^2; now there is no illusionary second 10 m^2 object as there was in your first attempt at magic.
Energy flux per second per m^2 is conserved.
I repeat my previous comment.
[KIDDO]
Input = 100 W/m^2 x 10 m^2 = 1,000 W.
[ALSO KIDDO]
Input = 200 W/m^2 x 5 m^2 = 1,000 W.
That’s correct, Willard.
The Earth is irradiated over only a hemisphere, so the correct surface area to divide the total input power by is the hemisphere’s surface area (giving 480 W/m^2). However, you indicated that you wished to divide the total input power by the disk’s surface area (giving 960 W/m^2).
#5
Willard, please keep embarrassing yourself.
> The Earth is irradiated over only a hemisphere
Watch Kiddo’s pea:
https://andthentheresphysics.wordpress.com/2021/04/25/mind-your-units/
The Earth’s shadow is a disc whose area is one fourth of the Earth’s sphere.
The energy the Earth receives is more or less constant.
The size of the Earth is more or less constant.
Kiddo’s numbers keep changing.
Conclusion: Kiddo is trolling.
My numbers don’t change at all, Willard. 480 W/m^2 input over the hemisphere, 240 W/m^2 output over the entire sphere are the correct numbers. I keep offering you the 960 W/m^2 for the input flux because that’s what you seem to want. You keep insisting that the input power should be divided by the disk’s surface area. Yet you reject the result – 960 W/m^2. It’s like you want me to tell you that dividing the input power by the disk’s surface area will give you 240 W/m^2. But it won’t.
#5
Willard, please keep embarrassing yourself.
> It’s like you want me to tell you that dividing the input power by the disks surface area will give you 240 W/m^2.
No, Graham.
I want you to divide the input power by the total area of the Earth, which is a sphere.
Disc / sphere = 1/4.
Please stop trolling.
That’s the output, not the input. The output power leaves from the entire sphere at any given moment. So you divide the output power by the surface area of the sphere.
#5
Willard, please stop embarrassing yourself.
Wrong, DREMT, only one object. Energy flux is conserved as I already showed, 240 in and 240 out over the earthen single object total area.
Whatever you say, Ball4. I’m past caring.
> That’s the output, not the input
That’s where you’re wrong, Graham.
The model is an equation that connects the input with the output.
When you shuffle terms around to isolate temperature, you get a temperature that is at equilibrium.
Both for the input and the output.
You’re throwing numbers around to mystify.
No need for any number to see that you mispecify.
Please stop trolling.
Sure, whatever.
#5
Willard, please keep embarrassing yourself.
Not whatever, Graham.
Algebra and Geometry.
One equation.
Disc x Sun x Albedo = Sphere x Emissivity x SB x Temp
Abstract away what does not matter here, you get:
Disc x Sun = Sphere x Temp
All you had to do is to put Sphere at the left.
One job.
You failed.
Please stop trolling.
Mm-hmm. Yep. Brilliant. Totally.
#5
Willard, please keep embarrassing yourself.
Graham, please stop trolling.
It is as I described here:
https://www.drroyspencer.com/2022/06/uah-global-temperature-update-for-may-2022-0-17-deg-c/#comment-1319651
Your slavish mental devotion to your energy balance model equation completely blinds you to the simple point I am making. You continually write as if I am using or misusing the framework of that equation in some way. I am not. I was not ever trying to rearrange that equation. My point bypasses it completely.
#5
Willard, please keep embarrassing yourself.
Here’s where you’re wrong, Graham –
An energy balance model balances energy. Energy in equals energy out. No amount of tapdancing between power and flux will make that requirement disappear.
Please recall how Joe called his model in his Magnum Opus:
https://andthentheresphysics.wordpress.com/2021/04/25/mind-your-units/#comment-191022
A pity you have yet to read it.
So yeah, a hemispherical model.
I suppose that’s one way to prevent a division by four!
…and I have explained what must be 1000 times by now that what I am doing does balance energy in and energy out. You just get confused because flux in does not equal flux out…
…and it doesnt seem to phase you that pretty much every single other person commenting at ATTP had worked out that what I was doing balanced energy in and energy out. They were just disputing it for other reasons…
…and every time I show you that energy in equals energy out, you just start talking about some other aspect of your energy balance model equation, which is besides the point I am making…
…and you just will not ever stop…
#5
Willard, please keep embarrassing yourself.
You still do not get it, Graham.
An equation has an equality sign.
The equality sign connects two sides.
The two sides must be equal.
If you do not satisfy this basic requirement, you fail.
An energy balance model has two sides, in and out.
The two must balance.
You cannot troll your way out of this.
Please stop.
All very interesting, Willard, but you are once again talking about your energy balance model equation, which, as I said, is what you always do once I explain to you that I am balancing energy in and energy out. Your energy balance model equation is completely besides the point I am making.
So here’s yet another example, just for any people reading (if there is still anyone bothering to follow this exchange), since I know there’s no point talking to Willard – he doesn’t listen – of how energy in and energy out can balance, even though flux in and flux out does not.
Pretty much every commenter here has taken a position on the Green Plate Effect at one point or another over the last few years. What both sides of the argument agree on is that in E-Lie’s original GPE scenario, the BP settles to an equilibrium where it is receiving 400 W/m^2 on only its left side, and emits 200 W/m^2 from both sides. This is with a point source Sun, and before the GP is added.
Now, nobody has ever said, "well, the BP is receiving 400 W/m^2 on one of its sides, but it is receiving 0 W/m^2 on the other side, so really the BP is receiving 200 W/m^2 overall". They are all happy accepting that the BP receives 400 W/m^2 and emits 200 W/m^2. So pretty much everyone commenting here has already tacitly accepted the concept that flux in and flux out does not have to balance, when energy in and energy out does.
When it comes to the Sun and the Earth, however, people suddenly lose the plot. The Earth is receiving 480 W/m^2 on one of its sides (the hemisphere), and emits 240 W/m^2 from both of its sides (the sphere). What some people want to insist on is that because the Earth receives 0 W/m^2 on the unlit hemisphere, it really receives 240 W/m^2 overall, whilst emitting 240 W/m^2. However, these same people are strangely quiet when it comes to the Green Plate Effect! They don’t speak up and say, "well, the BP is receiving 0 W/m^2 on one of its sides, so really it is only receiving 200 W/m^2 overall".
It does not make any sense to claim the Earth receives only 240 W/m^2. Or if it does, then we have to say the BP in the Green Plate Effect only receives 200 W/m^2 from the Sun!
You still do not get it, Graham.
An energy balance model gives one temperature.
If the energy in does not equal the energy out, you cannot get one temperature.
All your armwaving about flux and power is utterly irrelevant.
Please stop trolling.
I’m correct, Willard.
“So pretty much everyone commenting here has already tacitly accepted the concept that flux in and flux out does not have to balance, when energy in and energy out does.”
That’s wrong physics DREMT. DREMT is not correct.
Energy flux is shown as conserved as Eli’s single BP shows (400+0) W/m^2 in and (200+200) W/m^2 out. Just like the earthen total area energy flux is conserved 240 in and 240 out.
Wrong, Ball4, as always. The comparison is:
BP – 400 W/m^2 input over only one side
200 W/m^2 output from both sides
Earth – 480 W/m^2 input over only one hemisphere
240 W/m^2 output from the entire sphere
Nobody here says the BP has a 200 W/m^2 input, so nobody should be saying the Earth has a 240 W/m^2 input.
DREMT 12:51 pm magically makes one input side of the BP just disappear. Poof! Magic is not physics DREMT.
DREMT remains incorrect until the total existing area of the BP is made to re-appear. Energy flux is conserved when DREMT’s magic is not employed.
Graham still does not get it.
I repeat my previous comment, which refutes Ball4’s response and settles the issue in my favor.
There is nothing I don’t get, Willard. You are making one point, I’m making a different point. I am correct about my point. If only you could admit that, maybe we could go on to discuss yours.
DREMT’s response magically refutes what others write and only magically settles the issue in DREMT’s favor. Energy and energy flux are conserved unless some DREMT magic is used to disappear some of them.
> input over only one hemisphere
At best Graham still does not get a fairly basic geometric point:
https://andthentheresphysics.wordpress.com/2021/04/25/mind-your-units/
At worst is he still playing The Game, repeating stuff he already agreed is wrong, for pure trolling effect.
Nobody here says the BP has a 200 W/m^2 input, so nobody should be saying the Earth has a 240 W/m^2 input.
Graham still does not get it.
All the gaslighting in the world is not going to change the fact that I am correct, Willard.
The gaslighting is all yours, dear Graham.
You cannot escape the laws of geometry and of algebra.
Your little game has lasted long enough.
OK, Willard.
Thank you, Graham.
One act left.
DREMT wonders “if there is still anyone bothering to follow this exchange.”
I used to be one of the GPE believers. I’ve had a Gestalt-like experience. One day I think the AGW cult is right. On another day, the Slayer school is right. What a minute, they can’t both be right!
One thing is clear. Willard loses on grounds of a combination of delusion or incompetence. His inability to actually make a coherent argument is extremely painful to witness.
Thanks, Chic. It is nice to know someone bothers to follow these long-winded exchanges.
” So pretty much everyone commenting here has already tacitly accepted the concept that flux in and flux out does not have to balance, when energy in and energy out does.”
Except DREMT thinks this does not apply to the GP.
He thinks it receives 200 W/m2 from the BP. And it he thinks it has SB emission on both its sides of 200 W/m^2, since it is also 244 K.
So energy IN does not balance energy out!
By some unexplained logic, he believes that one of those 200 W/m^2 of SB emissions from the GP SHOULD NOT BE COUNTED.
It simply goes away. To where? Never explained.
Since DREMT won’t explain the logic, maybe Chic can.
By the way, just for anyone else who might be reading along, when I say "OK, Willard" I am merely acknowledging receipt of his previous comment. I am not indicating any actual agreement with what he’s saying.
Instead of building a spreadsheet to convince himself of the Sky Dragon Cranks nonsense, he goes for a silly conversion story:
https://climateball.net/but-damascus/
Do we have any evidence that Chic ever was genuine in his quest for evidence?
Willard, please stop trolling.
You *still* do not get it, Graham –
Have you seen Chic approving your silly trick about hemispheres and discs?
He has not read this exchange!
#2
Willard, please stop trolling.
Willard asks “Do we have any evidence that Chic ever was genuine in his quest for evidence?”
I commented some years back on the effect of splitting the plates. I remember making the same calculations that DREMT posted and Willard reposted above on what the AGW team thinks will happen in that case. Both teams claim evidence supporting their views. I won’t except any evidence until I know the thickness and conductivities of the materials involved. I’ve always claimed the problem is unphysical.
“Have you seen Chic approving your silly trick about hemispheres and discs?”
There is no trick involved in DREMT’s calculations. Willard either doesn’t understand or is playing obfuscation games. I suspect the latter, because I can’t imagine anyone would be so dumb not to understand the simple model DREMT described verbally and mathematically over and over. Of course, I also can’t imagine anyone having so much time to waste beating a dead horse either.
In case I missed seeing it, where is the explanation of what Graham still does not get?
So you are fine, Chic, with DREMTs disappearing GP emissions?
https://www.drroyspencer.com/2022/06/uah-global-temperature-update-for-may-2022-0-17-deg-c/#comment-1322892
Unless you have any experimental evidence to the contrary, it’s a stand-off, IMO, and you are adding nothing to the babel.
> I commented some years back on the effect of splitting the plates.
And so Chic has not read that thread.
Beautiful.
Nate says:
So you are fine, Chic, with DREMTs disappearing GP emissions?
——————–
Chic made his point correctly Nate. Simply because you have naively concluded that the alleged emission of photons is actually represents a physical flow of energy as opposed to an electromagnetic resistance you think you have solved the particle/wave controversy that still exists in electromagnetics.
That controversy has demanded experimental evidence every step of the way.
Here’s one point Chic did not correctly make:
> I remember making the same calculations that DREMT posted and Willard reposted above on what the AGW team thinks will happen in that case.
But then Chic can remember lots of imaginary things.
Chic says:
”Willard either doesnt understand or is playing obfuscation games.”
Thats not an either/or situation. Willard is like the guy on the dock at the Port of Palos screaming at Columbus that he was going to fall off the edge of the world in his quest to find a western route to the Indies.
Funny you say that, Bill, for it shows how little Dragon Cranks know on just about everything:
https://www.history.com/news/christopher-columbus-never-set-out-to-prove-the-earth-was-round
Muricans believe the darnednest things.
Now Willard proves he can’t read either.
I didn’t say Columbus set off to prove the world was round. I said he set off on a ”quest to find a western route to the Indies”.. . . .which the source you provided said was true.
Your source also said there was no educated person in the world in the 15th Century who believed the world was flat. But I was not talking about educated people. I was talking at least one Willard standing on the dock.
Seems to me its beyond you just smoking funny spliffs.
“Unless you have any experimental evidence to the contrary, its a stand-off, IMO, and you are adding nothing to the babel.”
Whether 200 = 400 is a standoff, Chic?
Accounting fraud is ok a non-issue for you?
Whether 1LOT needs to be obeyed or not, is a matter of opinion?
Wow.
“you have naively concluded that the alleged emission of photons is actually represents a physical flow of energy as opposed to an electromagnetic resistance you think you have solved the particle/wave controversy that still exists in electromagnetics.”
Even DREMT acknowledges that SB law is valid. That warm black surfaces emit radiation according to it. Even you have used this several times, Bill!
So it makes no sense to deny it now. But that is the Bill way.
As an auditor, I would think you would easily detect blatantly fraudulent accounting. The fact that DREMT cannot achieve energy balance for the GP with his solution, so he simply removes 200 W/m^2 of losses from its energy budget, and has no legal reason for doing so, SHOULD bother you.
Why doesnt it?
Which part of
> Its almost certain that in the 1490s, nobody thought the earth was flat.
you do not get, Bill?
A pity the Internet did not exist back then. The fun Dragon Cranks would have had trolling people about their fringe beliefs!
For anyone reading who might be confused by why you do not “split by two” for the GP, and who did not understand the discussion about view factors from last month, you might find this simpler:
https://postlmg.cc/HrxkJyBB
The temperature of the GP is set and maintained by emissions from the BP. So, emissions from the GP can not increase the temperature of the BP, as that would violate 2LoT. However, those emissions have to go somewhere. In this diagram by JD Huff.man, emissions from the GP are shown as being reflected from the BP (that is the green arrow shown leaving the BP) back to the GP. So here we see that there is no error in accounting, no violation of 1LoT. The only side of the GP which energy can truly be “lost” from is the side of the GP facing space.
However, some might still find the “view factor” explanation easier to understand. To each his own. No matter what alternative solution to the GPE you prefer, it should be clear by now that E-Lie’s solution is debunked.
Perhaps, Graham, but do we have *any* empirical evidence that 1/2 is twice 1/4 or that an energy balance model needs to balance its energy equation?
"Willard loses on grounds of a combination of delusion or incompetence. His inability to actually make a coherent argument is extremely painful to witness."
"There is no trick involved in DREMT’s calculations. Willard either doesn’t understand or is playing obfuscation games. I suspect the latter, because I can’t imagine anyone would be so dumb not to understand the simple model DREMT described verbally and mathematically over and over. Of course, I also can’t imagine anyone having so much time to waste beating a dead horse either."
Do you have any evidence that Chic has read this thread, Graham?
As far as I can see, he is supporting you the same way he supported MF when our jocular sock puppet was losing all his marbles.
Pray remind Chic where you justified your division by two.
https://www.drroyspencer.com/2022/06/uah-global-temperature-update-for-may-2022-0-17-deg-c/#comment-1321429
“Willard loses…”
Nate says:
Even DREMT acknowledges that SB law is valid. That warm black surfaces emit radiation according to it. Even you have used this several times, Bill!
So it makes no sense to deny it now. But that is the Bill way.
——————————
SB Law in no way requires an exchange of photons between a warm body and a cold body. If you understood what resistance is you would understand that SB can be true without an exchange of photons. We had one of the warmists in this comment section mention that Clausius cautioned against trying to describe his laws using the known resistance/emission in describing flow.
My grandfather and engineer and inventor taught me as an elementary school age child that there is always more than one way to skin a cat. One has to resist inculcation to gain understanding. the biggest challenge young people have is learning how to get something out of their education as opposed to education getting something out of the student.
—————
—————-
—————
—————–
—————-
Nate says:
As an auditor, I would think you would easily detect blatantly fraudulent accounting. The fact that DREMT cannot achieve energy balance for the GP with his solution, so he simply removes 200 W/m^2 of losses from its energy budget, and has no legal reason for doing so, SHOULD bother you.
Why doesnt it?
——————-
Radiation and convection combined in the atmosphere provides for convection carrying the backradiation or perhaps better described as the heat of resistance away to the next plate.
In outer space where convection does not do that the plate may heat to equilibrium in the presence of an infinite plane instead of returning the heat to the radiating object.
None of this involves challenging SB. All SB does is establish rates of warming of objects without systemic heat loss. Introduce actual heat loss in multiple directions and you can get different results. Nothing more nothing less as those themselves are SB flows.
Willard says:
As far as I can see, he is supporting you the same way he supported MF when our jocular sock puppet was losing all his marbles.
—————
Willard makes yet another freudian projection.
Willard says:
Which part of
> Its almost certain that in the 1490s, nobody thought the earth was flat.
you do not get, Bill?
——————————
Did you not notice how his only support for that statement was: ”According to historian Jeffrey Burton Russell, ”no educated person in the history of Western Civilization from the third century B.C. onward believed that the Earth was flat.” ”
Clearly he wasn’t recognizing Willard shouting from the dock as being anybody. In the world of exploration if you aren’t a funder you aren’t anybody of concern.
Portuguese navigators were no scholars, Bill.
It would be unfair to Flat Earthers to compare Dragon Cranks like you to them.
Also, which projection are you talking about – that I have not read that thread or that I am defending Graham?
Neither of those are a Freudian projection Willard.
Willard says:
Portuguese navigators were no scholars, Bill.
——————————–
But they are educated Willard. Something that perhaps you should have aspired to.
Please stop projecting your ignorance of the Freudian corpus, Bill.
Tis just a silly No U.
> were educated
By that logic anyone who studied nautical astronomy is educated, Bill, including Polynesians:
http://blog.sailtrilogy.com/blog/maps-stars-polynesians-used-celestial-navigation-become-worlds-best-explorers
So would be every man in a ship, which might be a stretch since many sailors barely knew how to read. Please, do continue to stretch the concept of education to just about anyone. It is after all what you trying to flee.
Willard says:
By that logic anyone who studied nautical astronomy is educated, Bill, including Polynesians:
http://blog.sailtrilogy.com/blog/maps-stars-polynesians-used-celestial-navigation-become-worlds-best-explorers
So would be every man in a ship, which might be a stretch since many sailors barely knew how to read. Please, do continue to stretch the concept of education to just about anyone. It is after all what you trying to flee.
—————————
Willard you said: ”Portuguese navigators were no scholars, Bill.”
You are just doubling down on ignorance now that you are suggesting all sailors are navigators. The navigator who typically is also the captain on small boats is the guy that the ignorant and uneducated sailors and passengers depend upon to get them safely back to port.
An auditor must be more precise and obtain evidence of assertions based particularly so based upon perceived biases. For instance one would assume the Columbus would have had an impossible task of convincing the King and Queen of Spain to fund his quest to find a more direct route to the Indies by going west if the King and Queen’s advisors had not suggested to them that the world was round.
But dizzy Willard reads History.com and believes every word he read. Obviously dizzy Willard is in dire need of some educated advisors to guide his responses in this forum.
And it is with the utmost stupidity to say that an educated man is educated about everything. Its like that parlor game where one guy reads a story to another team member and the story is passed on 3 or four more times and the last guy recites to the whole team what he heard and it is compared to the written story on the first iteration.
The historian can be forgiven as he no doubt meant educated in navigational issues. The second guy extends to everybody while offering up evidence otherwise, and then Willard reads it and blindly believes the stupid narrator at History.com.
“In this diagram by JD Huff.man, emissions from the GP are shown as being reflected from the BP (that is the green arrow shown leaving the BP) back to the GP. So here we see that there is no error in accounting”
Sorry, Black Bodies cannot reflect radiation. That is what defines a Black Body!
So we are still stuck with an unexplained accounting error and it is in dire need of rationalization.
> you are suggesting all sailors are navigators
I actually am suggesting the converse, Bill –
All navigators are sailors.
I also am suggesting the complementary –
Many sailors don’t need to have studied nautical astronomy to understand how stars move above the ships they sail.
In other words, I am destroying your silly moat piece by piece.
Please quit projecting your Murican ignorance into the minds of the ancients.
Willard says:
Many sailors dont need to have studied nautical astronomy to understand how stars move above the ships they sail.
—————–
Yeah I knew a number of those types of guys. they would tend to only show up in navigation and boating safety classes after being humbled and somehow managing to survive it. Thats where they learn there are actually many degrees of being educated.
Willard you are sounding more and more like one of those guys. How many of those guys do you think would qualify today hands down for a captain or navigator rating?
Does Willard think he would?
Willard says:
June 24, 2022 at 10:04 PM
[Chic] I commented some years back on the effect of splitting the plates.
[Willard] And so Chic has not read that thread.
And here is what I wrote about four years ago:
https://www.drroyspencer.com/2018/06/antarctic-ice-sheet-collapses-nobel-prizes-and-the-psychology-of-catastrophism/#comment-312316
That was for a system like DREMT’s point source model, but the same method gives the sun plate model. As I wrote back then, it seems strange that splitting the plates has to induce a temperature difference. I am still of the same mind now.
Willard, I read this whole thread. You lose.
Thought experiments require thinking, and imagining what if we have an ideal case, and thus a simpler case, what do laws of physics imply? It is a standard tool in science.
You can certainly use real world values for conductivity (copper 300 W/m/K, thickness, 1 mm, emissivity = 0.98) and you will find that there is little change from the ideal case.
So Chic, you have no answer for the accounting fraud? No explanation?
“seems strange that splitting the plates has to induce a temperature difference.”
Strange that vacuum or air has little thermal conductivity?
Thankfully for fingers, it does.
https://www.drroyspencer.com/2022/06/uah-global-temperature-update-for-may-2022-0-17-deg-c/#comment-1321728
“As I wrote back then, it seems strange that splitting the plates has to induce a temperature difference”
No more extreme example of this than the Sun Shell example. Place a thin, perfectly-conducting blackbody shell around the Sun, with a 1mm vacuum gap between the Sun and the shell, and Team GPE argues that the Sun would increase in temperature by 1,094 K, emitting twice as much (in W/m^2) as it did previously. The shell itself they would have reaching the same temperature as the Sun. Shrink that vacuum gap down to nothing, so that the shell touches the Sun, and once again they have the shell reaching the same temperature as the Sun, but now there is no increase in temperature of the Sun. Expand the vacuum gap to 1mm again, up pops the temperature of the Sun by 1,094 K. The Sun, heating itself up with its own back-radiated energy! An obvious 2LoT violation.
The emissions from the BP set and maintain the temperature of the GP. So, emissions from the GP cannot increase the temperature of the BP. That would violate 2LoT. So whether the back-radiation from the GP is reflected from the BP, or whether it is absorbed by the BP, it cannot raise the temperature of the BP. Ultimately, that back-radiated energy only has one place to go – it will leave to space, on the other side of the GP. To those who mention that the BP is a blackbody, so cannot reflect, they have to be reminded that a blackbody is unreal, and cannot be used to violate the laws of thermodynamics.
Same story with the Sun Shell. Back-radiation from the shell cannot warm the Sun, as that would violate 2LoT. So the ultimate fate of that back-radiation is for it to be lost to space from the only side of the shell that can truly “lose” energy, the side facing space. Whether the back-radiated energy is absorbed by the Sun, or is reflected by the Sun, it cannot raise the temperature of the Sun, so ultimately ends up going back to the shell, and gets radiated out to space.
“The shell itself they would have reaching the same temperature as the Sun”
Should be:
“The shell itself they would have reaching the same temperature as the Sun was originally, i.e: 5,778 K”.
Some people have been repeating the same flawed arguments over and over, for literally years, thinking that they will somehow evolve into valid arguments.
They havent.
“So whether the back-radiation from the GP is reflected from the BP, or whether it is absorbed by the BP, it cannot raise the temperature of the BP.”
Again, black bodies do not reflect. Real-world black objects reflect negligibly.
A piece of charcoal cannot reflect radiation like a mirror. Anybody claiming such is a liar and a fool.
Thus there remains an energy accounting fraud, and a 1LOT violation.
“So, emissions from the GP cannot increase the temperature of the BP. That would violate 2LoT.”
This weirdly assumes that a heat source cannot be a source of heating! This erroneously asserted 2LOT violation has been repeatedly debunked by many here, including Bill.
Does an unproven assertion of a 2LOT violation allow one to violate 1LOT?
No.
> Yeah I knew a number of those types of guys.
You knew sailors from the 15th century, Bill?
Tantrums do not suit you. Please leave them to Norma.
***
> here is what I wrote about four years ago
Chic is Very Good at providing evidence he read the current thread!
Nate says:
Thought experiments require thinking,
So Chic, you have no answer for the accounting fraud? No explanation?
—————-
Its no accounting fraud if you VERIFY 400w/m2 when in and 400w/m2 went out.
Actual thinking accountants have to gather evidence of both 1) that a transaction has been properly accounted for and 2) that the transaction actually occurred.
Do you have any such evidence?
Bill, Bill, you’re sweating too hard –
One does not ask for evidence about the result of a thought experiment.
Suppose a 400$ deposit in a bank account, and a 200$ withdrawal. Why would be you asking for evidence that there was a deposit or a withdrawal? That would be silly. Either you cooperate and play by the parameters set up by the thought experiment, or you take your marbles and go home.
No need for any empirical evidence to know that 400 – 200 = 200.
The GP receives 200 W/m^2 from the BP. Due to the view factors between the BP and the GP, the GP can only “lose energy” on the side of the GP facing space. It can’t “lose energy” on the side of the GP facing the BP, because on that side the GP is gaining all of its energy from the BP, along every conceivable vector. So the equilibrium temperature of the GP must be one in which it is losing 200 W/m^2 from the side of the GP facing space. That’s at 244 K, the same temperature as the BP.
The BP simply warmed the GP to the same temperature as the BP, because it is an idealized scenario in which there are no losses of radiation past the edges of the plates. Both BP and GP emit radiation from both sides.
Willard says:
Bill, Bill, youre sweating too hard
One does not ask for evidence about the result of a thought experiment.
——————————-
Your Daddy trained you well Willard.
“Its no accounting fraud if you VERIFY 400w/m2 when in and 400w/m2 went out.”
As explained, Bill, it is 200 in, and 200 x 2 sides out of the GP. Still accounting fraud.
Why are still arguing against your solutions?
Apparently the charcoal mirrors excuse failed so:
“It cant ‘lose energy’ on the side of the GP facing the BP, because on that side the GP is gaining all of its energy from the BP, along every conceivable vector.’
so…lets try incomprehensible gibberish.
My Daddy taught me that equality meant something, Bill.
Didn’t your Daddy taught you anything else than to look like a boastful prick?
12:12 PM comment cont’d…
…whereas with the 400 W/m^2 received by the BP from the point source Sun…on the side of the BP facing the point source, energy can be lost to space in the entire hemisphere of directions facing the Sun other than the one direction directly perpendicular to the plate, where energy from the BP would hit the Sun. So the BP can "lose energy" to space on the side of the BP facing the Sun, and it can "lose energy" to the GP on the side of the BP facing the GP, which it must do to set and maintain the GPs temperature. So, unlike the GP, it has two "losing sides". The GP on the other hand, has only one, the side facing space.
So, you "split by two" for the 400 W/m^2 received by the BP from the point source Sun, and the BPs equilibrium temperature is thus 244 K, emitting 200 W/m^2. You don’t "split by two" for the GP, as it has only one "losing side". So the GPs equilibrium temperature is also 244 K, emitting 200 W/m^2…and that’s that. That is the afore-mentioned "view factor" alternative solution to the GPE.
Or, if you find that too confusing, you have JD Huff.man’s "additional reflected green arrow" alternative solution. There’s actually quite a lot more crossover between the two alternative solutions than I realized before. Either way, 244 K…244 K is the correct solution to the original GPE.
Now, regardless of whether or not you agree with either of those two alternative solutions, the fact is, E-Lie’s solution to the GPE is debunked, and has been for many years. The Sun Shell example alone should make that clear. 1,094 K!? The GPE’s debunked.
Yet again, DREMT ignores the second equation in Eli’s work. This results in DREMT’s faulty 1,094K claim. The GPE has never been debunked as it is based on 1LOT.
Yet again Ball4 flat out lies about my calculation being wrong. The 1,094 K temperature increase is "correct", according to E-Lie’s logic. The Sun at 5,778 K emits x W/m^2. At 6,872 K it would emit 2x W/m^2.
If you check the "Steel Greenhouse" example (which is based around exactly the same logic as the GPE), the planet is initially emitting y W/m^2, then on addition of the shell it supposedly warms until it is emitting 2y W/m^2.
It’s as simple as that with the "Steel Greenhouse".
DREMT’s 1,094 K temperature increase is NOT “correct” as I showed DREMT previously because DREMT simply ignores the second step in Eli’s 1LOT based logic. The GPE has never been debunked as it is based on 1LOT.
Google "steel greenhouse WUWT". Click on the article "The Steel Greenhouse" from Watts Up With That" circa. 2009. Read the text in the description to Figure. 1:
"Figure 1. Building a steel greenhouse. (A) Planet without greenhouse. Surface temperature is 235 W/m2 heated from the interior. (B) Planet surrounded by steel greenhouse shell. Shell radiates the same amount to space as the planet without the shell, 235 W/m2. It radiates the same inward, which warms the planet to 470 W/m2 (29 C, 83°F, 302 K)."
As I said, adding the shell supposedly warms the planet (initially emitting y = 235 W/m^2) until it emits 2y = 470 W/m^2.
Now apply that to the "Sun Shell" example. The Sun emits x W/m^2 at 5,778 K. The Sun emits 2x W/m^2 at 6,872 K.
So adding a perfectly-conducting blackbody shell around the Sun, with a 1mm vacuum gap between the Sun and the shell, warms the Sun by 1,094 K, according to the "Steel Greenhouse" example. Which uses exactly the same logic as the GPE.
Nate,
“So Chic, you have no answer for the accounting fraud?”
When was your real life experiment published and what was the temperature of your hand when it reached equilibrium with the hot plate? How long did it take to reach equilibrium anyway?
I will answer accounting question as soon as you provide the real life data you promote or explain how the sun’s temperature can be raised by surrounding it with a shell?
Willard,
“> here is what [Chic] wrote about four years ago
Chic is Very Good at providing evidence he read the current thread!”
It’s a long thread. The part that shows you are avoiding admitting being wrong, delusional, playing games, making a fool of yourself, or all of the above is here:
https://www.drroyspencer.com/2022/06/uah-global-temperature-update-for-may-2022-0-17-deg-c/#comment-1321473
I don’t think it is possible for you to provide a coherent, factual explanation or even an admission of wrong. Prove me wrong.
Cult Leader grammie pup, You are continuing to ignore the facts, including your reference to the “Steel Greenhouse” post when you write:
.
The effective radiating temperature of your added Sun Shell would still appear to be the same as now. Of course, the actual temperature of the Sun, which is much larger than the effective radiating temperature would “increase” and melt the shell, but don’t let that slow you down. Your “sun shell” has no bearing on the GHE on Earth.
Your conclusion in the last sentence is grossly flawed, since the Earth’s atmosphere is not a “steel greenhouse” which radiates like a perfect black body on both sides. The atmosphere both emits and and transmits IR radiation to space, as Eschenbach goes to great length to explain. His gripe appears to be that the Kiehl-Trenberth Global Energy Budget graphic is too simple and needs another layer to more accurately represent the effects of the atmosphere.
grammie pup loses again.
Swanson explodes back onto the scene, out of nowhere, passionately dribbling out some nonsense which does absolutely nothing to contradict my calculations, which remain correct. Are you even aware that I said GPE, Swanson, and not GHE? The "P" is for "Plate", if that helps.
“Which uses exactly the same logic as the GPE.”
Wrong DREMT. There is one eqn. & one unknown in your 2:08 pm. Solvable.
The GPE has 2 eqn.s and 2 unknowns. Not. The. Same. Logic.
The “E” is for the effect with the “introduction” of the 2nd plate similar to the “introduction” of atm. to Earth.
Very confused now for 5 years over a simple thermo. homework problem, DREMT soldiers on wrong in so many efforts as E. Swanson also points out.
> It’s a long thread.
Not my problem, Chic. You claim having read it. You obviously did not.
Oh, and I don’t need to refute your empty assertion, but I will –
The comment you fail you understand shows how Graham used five variables, three of which were for the same damn thing. If that’s not misspecification, I don’t know what is.
All these to evade the analytical fact that the Earth receives energy on a disc and emits energy out of its whole body, which is usually represented as a sphere.
And best of all, analytical facts do not rest on the kind of empirical evidence you are appealing to for your current obfuscation.
Stick to sealion elsewhere. Graham is not worth you playing the red shirt for him.
Ball4, the "Steel Greenhouse" uses the exact same logic as the Green Plate Effect (GPE), in that back-radiation from the shell (GP) is automatically assumed to be absorbed by the planet (BP) and cause its temperature to increase.
“Or, if you find that too confusing, you have JD Huff.mans ‘additional reflected green arrow’ alternative solution.”
So the TEAM is sure their solution is the correct, but they are uncertain of the ‘science’ behind it.
The alternatives are something incomprehensible, or a completely different thing that is physically impossible. Neither one based on actual physics.
It always instills confidence when two mutually exclusive explanations of a thing that makes no sense are offered!
No Cult Leader grammie pup, the “steel greenhouse” does not refute the GPE. Once again, there must be “holes” in the steel greenhouse which allow some of the radiant energy to exit (Figure 2-B), just as there are emissions from the BP directly to space. As a result, Eschenbach’s conclusions are similar to that of the GPE because he accepts the physics of “back radiation”.
4:28 pm DREMT wrongly writes: “the “Steel Greenhouse” uses the exact same logic as the Green Plate Effect (GPE)”
Wrong yet again. DREMT still ignores the second eqn. in GPE that is not needed in SG.
I repeat: The GPE has 2 eqn.s and 2 unknowns. Not. The. Same. Logic.
DREMT’s 1,094K remains wrong according to Eli’s logic.
They’re lining up to troll me! Swanson, you have nothing of any value to add to this discussion. You still seem to be arguing against some point I am not even making. Ball4, the 1,094 K is correctly calculated, and follows directly from the “Steel Greenhouse” scenario, as I showed. Why are none of you answering Chic’s question, and explaining how the Sun’s temperature can be raised by surrounding it with a shell? It’s because you know you’re busted. The “Sun Shell” example makes it plain just how ridiculous “back-radiation warming” really is.
No Cult Leader grammie pup, the steel greenhouse does not refute the GPE. Once again, there must be holes in the steel greenhouse which allow some of the radiant energy to exit.
Your Sun shell “thought experiment” proves nothing, even were the math correct. The Sun is not a uniform solid sphere with a fixed temperature of 5,778K.
“The “Sun Shell” example makes it plain just how ridiculous “back-radiation warming” really is.”
Wrong DREMT. It’s only a thought experiment. The “Sun Shell” example makes it plain just how ridiculous DREMT’s understanding of “back-radiation warming” really is – based on actual experimental data.
Eli’s GPE has never been successfully debunked even though DREMT has tried for 5 long years.
Willard writes, “If thats not misspecification, I dont know what is.”
I saw no misspecification whatsoever. If there was, you had plenty of time to make a coherent case explaining how, but you failed to.
“analytical facts do not rest on the kind of empirical evidence you are appealing to for your current obfuscation.”
What facts, evidence, and alleged obfuscation are your referring to?
I won’t be conned by your ownership-inversion-deflection tactics. I scrupulously avoid obfuscation by taking great pains to make my points. You, however, obfuscate yours as exemplified by you writing, “All these to evade the analytical fact that the Earth receives energy on a disc and emits energy out of its whole body, which is usually represented as a sphere.” That’s exactly what DREMT has written and described mathematically. You are welcome to explain what “analytical fact” has to do with anything making an argument different than DREMT’s.
https://climateofsophistry.com/2021/04/27/oid-ownership-inversion-deflection-an-algorithm-to-hijack-and-deflect-factual-statements-made-by-a-debate-opponent/
> If there was, you had plenty of time to make a coherent case explaining how, but you failed to.
And so Chic once again obfuscates by trying to reverse the burden of proof. A true Evidence Understander we got there.
If only he had read the thread, or even the comment he cited. But no, he needs to double down on his red shirt act.
Imagine of Graham shared his team spirit!
“Your Sun shell “thought experiment” proves nothing, even were the math correct.”
The math is correct, as I showed. It’s pretty straightforward. What it proves is that you guys have to believe putting a perfectly-conducting blackbody shell around the Sun would make the Sun warmer, by its own back-radiated energy, as you admit here:
“Of course, the actual temperature of the Sun, which is much larger than the effective radiating temperature would “increase”…”
…but only when there’s a vacuum gap between the Sun and the shell. Have the Sun touching the shell and you lot agree the Sun would not increase in temperature. Add the gap back, and up pops the temperature of the Sun by 1,094 K…and, most people can see that that’s an obvious 2LoT violation.
Chic, Willard has absolutely no interest in honest debate. He has lost another one, and is just unable to admit it.
“Nate,
‘So Chic, you have no answer for the accounting fraud?’
When was your real life experiment published and what was the temperature of your hand when it reached equilibrium with the hot plate? How long did it take to reach equilibrium anyway?”
Tee hee!
a millisecond or so.
How bout when you did this experiment? Did you get a 1st degree burn? Or by waiting longer to ‘reach equilibrium’, 3rd degree burns?
“I will answer accounting question as soon as”
Obviously you have no sensible answer. Engage evasion tactics.
“you provide the real life data you promote or explain how the suns temperature can be raised by surrounding it with a shell?”
DREMTs incredulity of an incredible outcome in an incredible experiment is not an argument against it.
You buying this faux argument shows that, like DREMT, you have no actual argument that this outcome cannot happen, based on sound science and logic.
DREMT,
Of course, Willard does not debate honestly.
I just wanted to point out his debate tactics. Joe Postma documented well his OID tactic. His main tactics are never giving a straight answer and never making a coherent point. It’s argument by inuendo and evasion ad nauseum.
5:28 am, DREMT is wrong again, since most informed people can see that that’s NOT an obvious 2LoT violation because obviously universe entropy increases as dS is positive in the process DREMT describes.
—–
Chic 7:31 am, it’s NOT argument by inuendo and evasion ad nauseum when backed by experiment and long proven theory as is Eli’s GPE.
Nate,
I am not buying a faux argument. These hypothetical arguments have to be tested experimentally. Maybe somewhere there is definitive data that will settle the argument one way or another. I’m curious why there hasn’t been any such references, after all the history on this blog.
And of course Chic will once again obfuscate.
A sample of his dishonest tricks in his actual Red Shirt act –
Asking for empirical evidence for thought experiments that are basically a formal derivation.
Presenting himself as a Master Understander without ever showing any evidence he knows what the exchange in this thread was about.
Deflecting time and time again away from the con Joe and Graham runs.
Pretending I did not explain what I kept repeating time and time again.
Does he *really* not know that the Earth can be modelled as a sphere?
Does he *really* need evidence of the theorem that establishes the size of the shadow of that sphere?
Chic is beyond ridiculous, just like all the other Dragon Cranks.
Willard just can’t admit he lost the argument a long time ago, and Ball4 can’t even distinguish one argument from another. He is prepared to say literally anything to defend the GPE.
And so Graham soldiers on.
You lost.
Dr Roys Emergency Moderation Team says:
And so Chic once again obfuscates by trying to reverse the burden of proof. A true Evidence Understander we got there.
—————-
Willard says: ”And so Chic once again obfuscates by trying to reverse the burden of proof. A true Evidence Understander we got there.”
And what is Willard asking Chic to prove? He saying it is up to Chic to prove he made a misspecification because Willard is too stupid to make a case for his own claim. What you smoking Willard?
Still playing dumb, Bill?
Chic has not shown *any* evidence he read the thread. He simply handwaved to a comment, said it made no sense, and smugly suggested I should prove him wrong.
The same kind of trick you always rely on.
That Chic *always* asks for receipts and seldom provides anything to support his contentions is par for his sealion course.
But you, my dear Bill, pretend to be an auditor.
An auditor who never provides any receipt is incompetent.
An auditor who ignores the receipts already on the table is a scoundrel.
All this to shield Graham from his denial that the Earth is a sphere that receives light on its shadow.
Quite astonishing, really.
Cult Leader grammie pup again demonstrates that he has no clue. His “Sun shield” math may be correct, but that has nothing to do with Eschenbachs “steel greenhouse” or the Earth, both of which emit IR radiation from the surface directly to space.
grammie pup is fixated on his Sun shield as if it proves something, writing
He has thrown up a straw man and claims that it proves there’s a violation of the 2nd law, suggesting that the Sun can’t possibly experience a temperature increase. He has no proof of this, as usual, whereas the GPE is testable and has been proven via experiment.
You lost, Willard.
"His “Sun shield” math may be correct, but that has nothing to do with Eschenbachs “steel greenhouse”"
Hilarious, Swanson. The math is entirely based on the "Steel Greenhouse" example, as I showed. Please stop trolling.
The Earth is a sphere that receives light on its shadow, Graham.
Unless you can disprove these two facts, I am afraid it is you who lost.
Alternatively, you might try to coax Bill and Chic to help you gaslight your way out of this.
Willard writes, “”Pretending I did not explain what I kept repeating time and time again.”
Another case of your ownership inversion deflection. Which repetition are even referring to?
Your every comment reinforces the evidence that you never give a straight answer and never make a coherent point.
Sorry Willard…you lost.
> Which repetition are even referring to?
And so Chic joins Bill in playing dumb.
Had he read the thread, he would know how silly he looks.
Considering that he cannot dispute the fact that the Earth is a sphere that receives light on its shadow, who can blame him?
Argument Loser, please stop trolling.
I believe that the Earth is a sphere that receives light on its shadow, Graham. What about you, and do you think Chic understands how these facts are related to the comment he cited without really understanding?
Willard continues to insist others prove Willards assertions true for him since he recognizes he knows absolutely nothing about what he asserts.
The Earth is a sphere. The Earth is lit over a hemisphere. The Earth emits from the entire sphere, at the same time. The “Earth’s shadow” disk is 1/4 of the area of the entire sphere. That receives 960 W/m^2 after accounting for albedo. The hemisphere is 1/2 of the area of the entire sphere. That receives 480 W/m^2 after accounting for albedo. The entire sphere emits 240 W/m^2.
You could only argue that the Earth receives 240 W/m^2 if you are prepared to argue that the BP receives 200 W/m^2 from the Sun in the original GPE.
“The Earth is lit over a hemisphere.”
Wrong again DREMT 10:30 am, the Earth is lit over both hemispheres. Earthen 240 in and 240 out ~steady state equilibrium with a tiny warming imbalance. Just like BP has 400 in and 400 out at steady state equilibrium.
Our Moon is lit by earthshine over a hemisphere though.
> The Earth is a sphere. The Earth is lit over a hemisphere. The Earth emits from the entire sphere, at the same time. The “Earth’s shadow” disk is 1/4 of the area of the entire sphere.
You miss the most important part, Graham:
https://www.drroyspencer.com/2022/06/uah-global-temperature-update-for-may-2022-0-17-deg-c/#comment-1321899
Do you think Chic missed that earlier comment?
"Wrong again DREMT 10:30 am, the Earth is lit over both hemispheres"
Wrong again, Ball4. The Earth is only lit over one hemisphere at any particular moment in time, which is what I’m talking about. In that same moment in time, the Earth emits from the entire sphere.
"Do you think Chic missed that earlier comment?"
No, not at all. I think, like most of us, he would have filed that under "incoherent". Ken Rice obviously tried to explain something to you which you have completely failed to understand. It has confused you beyond belief. If you divide the total input power by the disk surface area, you get 960 W/m^2, after correcting for albedo. If you divide the total input power by the hemisphere’s surface area, you get 480 W/m^2, after correcting for albedo. It’s a simple matter of the power divided by the surface area. "Correcting for angles" doesn’t enter into it.
This is why I’m sometimes reluctant to completely write Willard off as being dishonest here, Chic. I think it’s also possible he has just managed to confused himself, terribly.
“The Earth is only lit over one hemisphere at any particular moment in time”
No DREMT, Earth is lit by star shine and sometimes lunar shine on one hemisphere then sunshine on the other hemisphere at any particular second. Measured 240 in and 240 out with a slight imbalance.
Ball4 is being extremely ridiculous and pedantic. OK then, Ball4:
"The Earth is only lit by sunshine over one hemisphere at any particular moment in time".
“I am not buying a faux argument. These hypothetical arguments have to be tested experimentally.”
You think the first and second laws of Thermodynamics have yet to be tested? False.
You think the SB law and radiative heat transfer law have yet to be tested? False.
You think arithmetic laws have yet to be tested? False.
The point of science is to find these principles, test them thoroughly then they become laws, then they can be applied to many problems.
That is what is being done here in thought experiments. If a proposed solution does not obey the laws of physics or arithmetic, it can be considered invalid.
I think W is using OID in some bizarre psychologically deranged reason. He semantically rearranges what you write to the same thing and claims you don’t get it. Weird.
> I think, like most of us, he would have filed that under “incoherent”.
Here’s one who did not find it incoherent:
[W] The light that falls on a hemisphere, when we correct for the angles, equals the light that falls on a disc.
[K] Sure, Willard, of course […] You need to then decide what measure of surface area you are going to divide that total power by.
[W] If you want to model the Earth, the choice is rather limited.
https://andthentheresphysics.wordpress.com/2021/04/25/mind-your-units/#comment-190999
That one was you, Graham.
May I remind you that you already agreed that the Earth was a sphere?
Chic might appreciate that I already quoted this exchange. He should search for “secret handshake” on this page.
I think Chic will regret trying to play dumb.
His sealioning was silly, and could be excused by his inattention to detail.
His gaslighting might not be excusable.
"The light that falls on a hemisphere, when we correct for the angles, equals the light that falls on a disc."
…and that’s correct, when you are considering the total input power only. It’s the same amount of total input power that is falling on either the disk, or the hemisphere, at any given moment…but, to convert to input flux, you have to divide by the surface area receiving said input power. Which is what I explained to you at the time. For the disk, you get 960 W/m^2. For the hemisphere, 480 W/m^2…and it is at this point that you do not need to consider "correcting for the angles".
> that’s correct, when you are considering the total input power only.
That’s just a cope, Graham. And it’s false.
We’re talking about the geometry of the Earth.
If you want to model energy balance of the Earth, you need to preserve the geometry of the Earth. The energy in and out must balance whatever units you will use.
That disc is the shadow if the Earth.
The area on which the light falls is a disc.
I have no idea why Chic would think that challenging me to state these truisms would help you, but here we go.
"The energy in and out must balance whatever units you will use."
I’ve explained that what I do balances energy in and energy out to the extent that a child could probably understand. What’s your excuse for still not getting it? Are you an idiot, or are you simply dishonest? That’s what I can’t decide.
> I do balances energy in and energy out
Not really, Graham.
You have one equation for the input, one equation for the output, and the two equations lead to two different quantities.
Worse is that your equations are not specified to take into account the two facts you already have acknowledged:
– The Earth is a sphere
– The Earth receives light on a disc
We’ve just been over the moment when you pretend that the Earth receives light on one hemisphere, as if we have not already agreed that this hemisphere, when corrected for angle, is equivalent to that said disc.
Try as you might, we have reached a point where you cannot obfuscate your position anymore.
You lost.
Yes DREMT continually loses these discussions and often drops a PST in retreat.
A smart child can understand 240 in and 240 out with a slight measured imbalance conserves energy flux and DREMT wrongly ignores the starlit side area of Earth in claiming energy flux is not conserved in and out at steady state.
Humorously DREMT still hasn’t correctly solved Eli’s thermo. homework problem from FIVE years ago.
"You have one equation for the input, one equation for the output, and the two equations lead to two different quantities."
Of course. 480 W/m^2 input over the hemisphere, and 240 W/m^2 output from the entire sphere. They are different because the surface area the input is received over is only half that of the surface area the output leaves from.
"We’ve just been over the moment when you pretend that the Earth receives light on one hemisphere, as if we have not already agreed that this hemisphere, when corrected for angle, is equivalent to that said disc."
The Earth does receive light on one hemisphere, at any given moment. I have not agreed that the hemisphere is equivalent to the disc. In terms of surface area, the latter is half that of the former. What I agreed with is only that the same total input power falls on both the disc, and the hemisphere.
"A smart child can understand 240 in and 240 out with a slight measured imbalance conserves energy flux and DREMT wrongly ignores the starlit side area of Earth in claiming energy flux is not conserved in and out at steady state."
You can only argue that the input to the Earth is 240 W/m^2 if you are prepared to argue that the input to the BP is 200 W/m^2, in the original GPE scenario.
"Humorously DREMT still hasn’t correctly solved Eli’s thermo. homework problem from FIVE years ago."
1) I fully and completely understand E-Lie’s solution. I just disagree with it.
2) The GPE was debunked five years ago. There’s just been five years of denial from trolls like you.
No need to be prepared to wrongly argue that the input to the BP is 200 W/m^2 since in the original GPE scenario there is 400 in and 400 out w/no imbalance at steady state, just like earthen 240 in and 240 out steady state with a slight imbalance at times.
To debunk the GPE, DREMT had to debunk the 1LOT – incorrectly. Very humorous course of events, fun to watch. Especially all the many DREMT retreats with a PST.
Mind your units, Ball4. The units under discussion are W/m^2. The BP has a 400 W/m^2 input from the Sun, and a 200 W/m^2 output, before the GP is added, according to the original GPE setup. Look it up.
[W] If you want to model energy balance of the Earth, you need to preserve the geometry of the Earth.
[G] *Crickets*
[W] The energy in and out must balance whatever units you will use.
[G] I’ve explained that what I do balances energy in and energy out to the extent that a child could probably understand.
[W] Not really. You have one equation for the input, one equation for the output, and the two equations lead to two different quantities.
[G] Of course.
Chic might appreciate so much art.
> The units under discussion are W/m^2. The BP has a 400 W/m^2 input from the Sun, and a 200 W/m^2 output, before the GP is added, according to the original GPE setup. Look it up.
Good idea:
http://rabett.blogspot.com/2017/10/an-evergreen-of-denial-is-that-colder.html
I’m sure Chic would have noticed that I wrote quite a lot of additional explanation following the words "of course", Willard.
Thank you for linking to the relevant part of the GPE article and thus correcting Ball4, Willard.
Cult Leader grammie pup wrote:
Airhead grammie is so stupid that he can’t understand that his “Sun shield” thought experiment is not the same as Eschenbach’s steel greenhouse because Eschenbach recognizes that there’s more to it than a simple internally heated planet (or the Sun) enclosed by a steel shell. His model (and your version of it) certainly does not disprove the GPE. In fact, he agrees that there is “back radiation” from the shell which is absorbed by the warmer planet, which supports the GPE model.
My pleasure underlining that B4 is right, Graham.
Oh, and I dismissed your wall of words because it was mere obfuscation of the flagrant contradiction you committed: having a balance model, which is comprised by two equations that do not balance.
I believe that 200 + 200 = 400 and that energy balance models need to balance. What about you?
My, the string of strikeouts by DREMT must be a near record today since Eli shows BP has a 400 W/m^2 red arrow input from the Sun, and 400 W/m^2 blue arrows output to cold sink of space at steady state, before the GP is added, according to the original GPE setup. Look it up DREMT.
"Airhead grammie is so stupid that he can’t understand that his “Sun shield” thought experiment is not the same as Eschenbach’s steel greenhouse because Eschenbach recognizes that there’s more to it than a simple internally heated planet (or the Sun) enclosed by a steel shell."
More to what, Swanson? The GHE? Sure…but we’re not discussing the GHE are we? We are discussing the GPE. Try to keep up.
"His model (and your version of it) certainly does not disprove the GPE. In fact, he agrees that there is “back radiation” from the shell which is absorbed by the warmer planet, which supports the GPE model."
I know that he agrees with back-radiation warming, Swanson. I disagree with him. The fact is, his model is bunk. The GPE is bunk. Both involve objects warming themselves up, essentially with their own emitted radiation. The "Sun Shell" example just takes the "Steel Greenhouse" to its own absurd, logical conclusion. The Sun, warming itself up with its own emitted energy. Most people would realize how ridiculous that is, even though they might not originally have seen it with the "Steel Greenhouse" planet example.
The Steel Greenhouse uses the same math as the 3-plate scenario GPE, by the way…
"My, the string of strikeouts by DREMT must be a near record today since Eli shows BP has a 400 W/m^2 red arrow input from the Sun, and 400 W/m^2 blue arrows output to cold sink of space at steady state, before the GP is added, according to the original GPE setup. Look it up DREMT."
No, Ball4, the output from the BP is 200 W/m^2, and the input from the Sun is 400 W/m^2, as E-lie shows. 244 K equates to an output of 200 W/m^2, not 400 W/m^2. 290 K equates to an output of 400 W/m^2. Look it up.
> Both involve objects warming themselves up, essentially with their own emitted radiation.
I shiver at the idea that my body could warm itself using its own heat and a sleeping bag!
Try it in a vacuum, with a non-reflective sleeping bag, Willard.
> the output from the BP is 200 W/m^2
https://imgur.com/a/0feBbmy
Yes, Willard, the output from the BP is 200 W/m^2, not 400 W/m^2. You really are an idiot, aren’t you?
> Try it
Please do your own pseudo-experiments, Graham.
Your claim did not mention vacuum energy.
All the thought experiments take place under vacuum conditions, idiot.
> the output from the BP is 200 W/m^2
Pay attention, Graham:
https://imgur.com/a/0feBbmy
Two blue arrows.
Each with 200 W/m^2.
200 + 200 = 400.
You sure you want to play out that one?
The output from the BP is 200 W/m^2, idiot.
Let’s say each side of the BP is 1 m^2. Total surface area of the BP is thus 2 m^2.
The BP receives 400 W/m^2 over only one of its sides. 400 W/m^2 x 1 m^2 = 400 W received.
The BP emits 200 W/m^2 over its entire surface area. It has two sides, so 200 W/m^2 x 2 m^2 = 400 W emitted.
400 W in = 400 W out. Energy balances.
400 W/m^2 in does not equal 200 W/m^2 out. Flux amounts do not need to balance for energy to balance.
Sound familiar?
> All the thought experiments take place under vacuum conditions
I see. No wonder you can’t grasp what bdgwx keeps telling you.
Are these thought experiments under non-reflective conditions too, Graham, and what would these conditions be?
> The output from the BP is 200 W/m^2
The output of the system is designated by the blue arrows, Graham.
There are two arrows.
Each has 200 W/m^2.
400 = 200 + 200.
Energy is conserved.
See how the equation works?
Wow, you are stupid.
“1) I fully and completely understand E-Lies solution. I just disagree with it.”
OMG
That it deviates from your preferred solution is of no significance.
If you really, truly understood it, you could explain to us exactly where it deviates from the laws of physics, which is all that really matters.
Thus far you certainly havent done that. Even to the satisfaction of your allies.
Thus this “2) The GPE was debunked five years ago.” is only in true your own fantasies.
Willard, the output of the BP is 200 W/m^2, not 400 W/m^2.
It is worth repeating. The temperature gradient of the JWST sunshield goes from warmer to cooler from Sun-side to Mirror-side and that the Sun-side layer warmed and Mirror-side layer cooled when the layers were unfolded and fully deployed not unlike the prediction of the BP/GP thought experiment.
“Lets say each side of the BP is 1 m^2. Total surface area of the BP is thus 2 m^2.
The BP receives 400 W/m^2 over only one of its sides. 400 W/m^2 x 1 m^2 = 400 W received.
The BP emits 200 W/m^2 over its entire surface area. It has two sides, so 200 W/m^2 x 2 m^2 = 400 W emitted.
400 W in = 400 W out. Energy balances.”
Very good.
Now Chic, why does DREMT so easily manage to do that for the BP, but struggles so mightily to accomplish it for the GP?
Lets start here “The BP emits 200 W/m^2 over its entire surface area.”
The GP receives 200 W/m^2 over 1 m^2 from the BP. 200 W/m^2 x 1m^2 = 200 W.
Now if the GP is 244 K as he claims then it also ’emits 200 W/m^2 over its entire surface area. It has two sides, so 200 W/m^2 x 2 m^2 = 400 W emitted.’
So 200 W input and 400 W output. No energy balance for the GP!
There is no data needed to see that this obviously violates 1LOT, Chic.
Then he just fudges it.
One excuse is that since it is emitting 200 W on one side toward the BP with VF=1, rather than to space, somehow this causes that emission to NOT COUNT and vanish.
This is simply bonkers.
Willard says:
If you want to model energy balance of the Earth, you need to preserve the geometry of the Earth. The energy in and out must balance whatever units you will use.
————————————-
Why does there need to be energy out Willard?
Are you just assuming this or is that just something you heard?
Thank you for playing dumb again, Bill.
An energy balance model balances the energy in and out of a system.
If your model does not do that, it is not an energy balance model.
Think of it as a double entry model. Money comes in, money comes out. If money gets created out of nowhere, there is a problem. If money disappears without a trace, there is a bigger problem.
Wait, was not that the silly example you gave with which we started that silly episode?
It bears repeating that the JWST sunshield is not a series of infinite, parallel, perfectly-conducting, blackbody plates.
The GPE’s debunked.
Once you accept that a blackbody cannot be used as an excuse to violate 2LoT, and thus the BPs temperature cannot be increased by the back-radiated energy from the GP, you have to also accept that the energy emitted by the GP back towards the BP has to end up somewhere. That "somewhere" is ultimately out the other side of the GP, emitted into space. The GP has only one "losing side", the side facing space.
Really simple…those who have had five years to understand the alternative solution to the GPE, but still struggle to comprehend it, ought to be embarrassed.
And so Graham soldiers on, adding layers upon layers of obfuscation to obviate that N + N = 2N.
Quite marvellous when one thinks about it.
You lost, again, at 1:50 PM Willard.
If only you could read properly, Graham. But when we see that you think I am saying that a disc equals a hemisphere, there is little hope for you.
Are you sure you are not on the spectrum?
You’re wrong, Willard. You wrote an entire article for ATTP which is absolute garbage. You were trounced in the comments. You’ve been trounced again here. You are either dishonest, or so bungling, incompetent and clueless that you genuinely believe your own nonsense. Please, keep embarrassing yourself indefinitely.
Look, Graham.
That piece was my best try to make you work. I could have gone the usual path and pull he plug when physicists stopped caring about what you were saying. You were no match for AT, Gator, and all the others.
You failed. Over and over again. But better and better. Until you could not resist trolling me.
And you ended up posting more than 30 comments to get the last word.
Not unlike what you are doing here.
You have mental health issues.
Please seek help.
“The GP has only one “losing side”, the side facing space.”
No. Everything radiates DREMT. The GP radiates from both sides equally at steady state temperature. See Eli’s solution.
Ball4, if you read my 3:33 PM comment a little more carefully, you would note that I made it clear the GP does radiate from both sides.
Willard, you lost. Then and now.
So now DREMT reverses course and comments the GP radiates not only to space but radiates to the BP thus “losing” energy from BOTH sides and doesn’t have only one “losing side” anymore, the side facing space.
DREMT can’t keep his stories straight just like Gordon can’t either. Pity.
Ball4 also cannot debate honestly. Can any of them?
Except that I won then and am winning now, Graham. You know why? You simply cannot read, equations above all. When comes the time to revolutionize physics as we know it, that might prove to be a handicap.
You are misreading B4 right now. You dodged the latest comment from Nate. Have you noticed the bit I emphasized in the quote to the post by Eli?
No. You keep trolling about flux instead.
Please stop and seek help.
” you have to also accept that the energy emitted by the GP back towards the BP has to end up somewhere. That “somewhere” is ultimately out the other side of the GP”
DREMT emphasized that energy should balance for the BP. But now he seems willing to sacrifice energy balance for the GP, as long as energy balances for the system as a whole.
So with 400 W input as long as the output of the BP and GP to space totals 400 W hes happy. What goes on between the plates is none of our business!
But there are an infinite number of combinations of BP and GP emissions that sum to 400 W!
So this is not going to give a unique solution.
But in the original GPE solution 1LOT being satisfied, ie energy balance, on all plates was a constraint from the outset.
That required the GP to emit 400/3 = 133.33 W from both sides and the BP to emit twice as much, 266.66 W, from both sides.
So this gives a total system output of 266.66 W + 133.33 W = 400 W.
But it AlSO balances energy for EACH plate, as required by 1LOT.
So this gives a unique solution with BP = 262K and GP = 220.4 K, by SB law, with net flow of energy (heat) of 133.33 W from BP to GP which satisifies 2LOT.
So this solution satisfies all the laws of physics.
Willard, you are lying. Of course I can read. I have written equations, let alone read them. When have you ever demonstrated that you understand even the simplest math!? You have made it abundantly clear to anyone reading this thread that you do not. I have not misread Ball4. I do not respond to Nate. I noticed that you highlighted something earlier. So what? Care to try to make a clear, coherent comment about it, for a change?
You lost back then, and you have lost now.
> I have written equations, let alone read them.
See for yourself:
[G] You need to then decide what measure of surface area you are going to divide that total power by.
[W] If you want to model the Earth, the choice is rather limited. Quick question: in Joe’s diagrams, there is an equation at the top right. Do you know what it means? I only found it at one place in his work.
[G] No, you will have to ask Joe on that one.
https://andthentheresphysics.wordpress.com/2021/04/25/mind-your-units/#comment-191003
Do you at least realize that you had no idea that there exists energy balance models with more than zero dimensions, and that you defend Joe’s model without ever having dared to look into the equations of his Magnum Opus?
You lost. Then and now. You are the emperor of the finest clothed emperors.
Please seek help.
All this fuss because Willard cannot understand how 480 W/m^2 input over a hemisphere balances with 240 W/m^2 output over an entire sphere. Unbelievable, really.
All this rather because you *still* cannot grasp that the division by four is perfectly fine and that, however you slice it, the Earth receives an average of 240J of solar energy every second per square meter, something I said earlier, perhaps to Chic’s chagrin:
https://www.drroyspencer.com/2022/06/uah-global-temperature-update-for-may-2022-0-17-deg-c/#comment-1321884
On a moment by moment basis, the Earth receives energy over the sunlit hemisphere, and emits from the entire sphere. So the division by 4 is fine for the output flux (240 W/m^2), but the input flux is 480 W/m^2 over the hemisphere. As everybody eventually understood, over at ATTP, bar Willard.
Willard says:
An energy balance model balances the energy in and out of a system.
If your model does not do that, it is not an energy balance model.
————————-
You are arbitrarily defining a balance and if the system doesn’t meet your artificial definition its out of balance with that definition.
But that doesn’t explain why it ‘must’ be a balanced system.
————–
————–
————–
—————
Willard says:
”Think of it as a double entry model. Money comes in, money comes out. If money gets created out of nowhere, there is a problem. If money disappears without a trace, there is a bigger problem.
Wait, was not that the silly example you gave with which we started that silly episode?”
———————–
So what kind of balance is an equilibrium Willard? Zero movement in or out of a box say? Is that a useful concept? Like Scrooge McDuck storing all his money in a big vault? It hasn’t disappeared, its all accounted for. If a surface is at equilibrium because the box is full no more money can be put in the box. Einstein showed us that light can bend around the sun and we can see the star behind the sun. How does that fit in with your theory of balance?
> on a moment by moment basis
Cope, Graham, or obfuscation, if Chic prefers.
And incorrect anyway: an energy balance model balances energy at all time.
Incidentally, the equation you could not grasp rules over energy imbalance:
https://andthentheresphysics.wordpress.com/2021/04/25/mind-your-units/#comment-191028
And you *still* try to play your silly pea and thimble games with hemispheres.
Please desist.
Energy in and energy out is indeed balanced all the time, Willard. Continuously, there is 480 W/m^2 incoming over the sunlit hemisphere, and 240 W/m^2 leaving from the entire sphere.
Incorrect and irrelevant, Graham:
You *still* forget to correct your hemisphere according to the various angles the light reaches it. When you do, you get the same result as if the light reached the shadow of the Earth at zenith. See the Mind Your Units for more. Which means you get to divide by four, not by two.
Also, flux is not energy.
No, Willard, what I wrote is correct, and entirely relevant.
There is 480 W/m^2 incoming over the sunlit half sphere TOA and near enough zero over the other half sphere TOA, and 240 W/m^2 leaving from the entire sphere so 480*0.5 sphere in and 240 out entire sphere. 240 in and 240 out all TOA.
Before the GP is added, there is 400 W/m^2 received by the BP from the Sun on one of its sides, and 0 W/m^2 received by the other side, Ball4. Shall we say the BP receives only 200 W/m^2 from the Sun?
Willard,
I can appreciate your attempts to make amends by improving your presentation, but it’s too late. You lost. You keep arguing that 240 W/m2 average input over the whole Earth is somehow different than DREMT’s 480 W/m2 average for the hemisphere. This whole thread you have been playing games, obfuscating, and fooling no one, except maybe wacko Ball4 who thinks there’s a 255K surface overhead.
Thank you for the kind words, Chic, albeit they only prove you had not read the thread at orEr, and now fail to understand it.
You know why? Because you commit the same mistake as Graham. You forget to correct a famous law.
Ask Graham about that law.
“Ball4 who thinks there’s a 255K surface overhead”
… as reported Chic, measured by several CERES radiometer instruments over 4-17+ annual periods.
“Shall we say the BP receives only 200 W/m^2 from the Sun?”
“We shall say” as before DREMT, there is 400 W/m^2 incoming over the sunlit half blue plate and near enough zero over the other half blue plate, and 200 W/m^2 leaving from the entire plate so 400*0.5 plate in and 200 out entire plate. Counting sides correctly (400+0) entire plate in and (200+200) entire plate out to cold sink of space at steady state temperature. Energy is conserved as is energy per second per entire plate m^2 thus energy flux is also properly conserved.
See Eli’s work 5 years ago for the correct eqn.s & solution BP alone and BP with GP at 1LOT calculated steady state temperatures.
I don’t think Willard even fools Ball4, Chic. After all, Ball4 just said:
“There is 480 W/m^2 incoming over the sunlit half sphere…”
So he obviously gets it. I think the only person Willard might fool, is himself. Then again, he could just simply be dishonest and unable to admit that he’s wrong.
Since Graham will not help Chic:
Source: https://andthentheresphysics.wordpress.com/2021/04/25/mind-your-units/#comment-190372
Which means the division by four is here to stay.
But then Graham has faith in Joe: “I am sure Joe divides by 2 for a good reason.”
Too hard to resist:
Of course not: we should deny that the BP receives energy on its dark side!
Cf. Joe’s Magnum Opus for a proof.
“So, you can see that if you do the integral over the hemisphere and take the solar zenith angle into account, you recover that the energy intercepted per unit time is the incoming flux times the cross-sectional area of the Earth.”
Energy per unit time is power. All he is actually saying here is that the total input power is the incoming flux (solar constant) times the disk surface area. So he agrees with me. Multiply the solar constant by the disk surface area, and correct for albedo. That is the total input power. That has to equal the total output power. The input power is received over the hemisphere. So divide the input power by the surface area of the hemisphere to get your 480 W/m^2 input flux. The output power leaves from the entire sphere. So divide the output power by the surface area of the sphere to get your 240 W/m^2 output flux.
[KIDDO] All he is actually saying here is that the total input power is the incoming flux (solar constant) times the disk surface area.
[ALSO KIDDO] The input power is received over the hemisphere.
Every. Single. Time.
https://www.drroyspencer.com/2022/06/uah-global-temperature-update-for-may-2022-0-17-deg-c/#comment-1321304
[KIDDO] All he is actually saying here is that the total input power is the incoming flux (solar constant) times the disk surface area. So he agrees with me.
[ALSO KIDDO] At any given moment, the Earth absorbs 480 W/m^2 over half its surface area.
Every. Single. Time.
Yes, Willard…and every single time, I am correct.
Except that a disc is half a hemisphere, Graham. You got to choose.
Also, let me remind you of your silly “model”:
So, does Flux comes on Y or on Z?
You got to choose.
Not that hard to see the misspecification.
I have to say, Chic…I really do think his confusion is genuine. I think he may be one of the dumbest people I have ever encountered.
Oh, Graham.
No need to give me all these tells.
X or Y?
Erm. Y or Z.
So, Y or Z?
Flux in (W/m^2) = xy(1-a)/z.
Doing xy(1-a) gives you a number in Watts, the total input power. Dividing that number by z gives you the flux in. W/m^2.
That’s not how it works, Graham.
Your variables are supposed to *refer* to something.
Try again.
I would try again, but I was right the first time.
☺️
So much rightness;
[HAMM} Does the light falk on a disc?
[CLOV] Yes. That is Y.
[HAMM] So it does not fall on a hemisphere?
[CLOV] Yes! That is Z.
[HAMM] And then you divide by two because
[CLOV] THE LIGHT FALLS ON X/Y TOO!
[HAMM] So that means the light falls everywhere!
[CLOV] Right! Did I tell you about W in my other correct model?
https://www.drroyspencer.com/2022/06/uah-global-temperature-update-for-may-2022-0-17-deg-c/#comment-1321588
The light falls on the hemisphere…how much total power? The amount that would fall on an imaginary disk with the cross-sectional area of the Earth. OK, divide that total power by the area of the hemisphere then. Flux in.
The radiation leaves from the entire sphere…how much total power? To conserve energy, the same amount that came in. OK, divide that total power by the area of the sphere then. Flux out.
If the light falls on the hemisphere, Graham, then I am sure Chic asks himself:
Q1. What is your disc doing there?
Q2. Why do you divide it by the hemisphere?
Do not forget to thank Chic for these questions!
DREMT,
Willard is not dumb. Psychologically warped maybe, but not dumb. He doesn’t comment here to advance scientific understand or clarify positions. He is playing semantic games with anyone who chooses to play with him. Mostly this is you and RLH.
I would like to see what would happen if everyone stopped responding to him. Anyone up for that experiment?
Oh, Chic.
As a Master Science Advancer, I am sure you could tell me how you would use the YZ model by Graham to get 400 W/m^2 on a rectangular plate?
Many thanks!
Well, Chic, he certainly does a very convincing impersonation of an idiot. I could try ignoring him, I suppose…
Keep ignoring the questions Chic ought to ask himself, Graham. Follow his advice to cut your losses instead.
Otherwise you’ll soon have to adapt your two-equations trick to a simple rectangular plate. But of course you can try to find a way to specify one surface for power and another one for flux, of course.
Should be easy for such a brilliant guy as you.
…but with Willard, I think I prefer a good, old-fashioned:
Willard, please stop trolling.
Let’s clarify what should be easy for a brilliant guy like you to repurpose, Graham:
Suppose that instead of a sphere, we have a rectangular plate.
Suppose also that the end result is 400 W/m^2.
How would you change Y and Z?
You got this.
#3
Willard, please stop trolling.
Good God Willard! This is 3rd grader stuff!
Y=Z
You’re good at this, Bill!
You forgot to tell us why, however.
One reason why “why” matters:
Why does Graham divide that total power by the area of the hemisphere – because the total power is what falls on the area of the disc?
This. Makes. No. Sense. Whatsoever.
#4
Willard, please stop trolling.
But perhaps Bill forgot a little detail:
The plate has two sides!
Let’s wait and see if he did.
#5
Willard, please stop trolling.
Willard says:
But perhaps Bill forgot a little detail:
The plate has two sides!
Lets wait and see if he did.
Willard. . . .One side of a plate is the equivalent of a hemisphere. Its half the area of a plates total surface counting both sides.
OK. Graham refuses to beat himself with his silly misconstruction. Let’s return to basics:
https://en.wikipedia.org/wiki/Solar_irradiance
To get his W, Graham uses the disc.
To get his m^2, Graham uses the hemisphere.
Therefore Graham gets his solar irradiance by using two areas.
It’s really not hard to see that Graham simply shuffles around whatever he needs to get the numbers he wants.
> One side of a plate is the equivalent of a hemisphere. Its half the area of a plates total surface counting both sides.
You’re killing it, Bill!
That does not answer the question why Y does not equal Z for a sphere whereas Y equals Z in the case of a plate.
And speaking of the plate, how do you model a full plate if you only account for half of it into your specification?
#6
Willard, please stop trolling.
You really should take heed of what Chic suggested, Graham.
Your PSTing has a projection effect, wink wink.
I realize you are a beginner here. So I will be patient.
The shadow of a sphere equals 1/4th its surface area or 1/2 the area of its lit hemisphere.
A flat plate doesn’t have a hemisphere (as its not sphere) but its lit side is have the area of its total surface area (ignoring edges)
So mathematically it is the equivalent of a hemisphere in relationship to the solar constant.
If you had bothered to do the math at the start you would not have pursued this thread.
#7
Willard, please stop trolling.
Since you kindly obliged, Bill, let’s continue this over there:
https://www.drroyspencer.com/2022/06/uah-global-temperature-update-for-may-2022-0-17-deg-c/#comment-1325196
This will provide Graham a much warranted respite.
#8
Willard, please stop trolling.
You should thank Bill, Graham.
It has been a pleasure doing business with you!
#9
Willard, please stop trolling.
And so Graham is stalking me:
https://www.drroyspencer.com/2022/06/uah-global-temperature-update-for-may-2022-0-17-deg-c/#comment-1325312
Oh, noes!
#10
Willard, please stop trolling.
Nate says:
June 27, 2022 at 2:30 PM
”Lets say each side of the BP is 1 m^2. Total surface area of the BP is thus 2 m^2.
The BP receives 400 W/m^2 over only one of its sides. 400 W/m^2 x 1 m^2 = 400 W received.
The BP emits 200 W/m^2 over its entire surface area. It has two sides, so 200 W/m^2 x 2 m^2 = 400 W emitted.
400 W in = 400 W out. Energy balances.”
Very good.
———————–
We also know it doesn’t lose 200w/m2 in the direction of a warmer surface. So what becomes of that 200w/m2? Well in the atmosphere we have convection to carry at least 200w/m2 away and maintain the temperature at 244k. If that convection is not there as in space we don’t know the fate of the 200w/m2 but we can bet rather surely that it doesn’t warm source. A simple experiment could show the answer to this but it is not clear such an experiment has been carried out. And its even possible that some do not want it carried out.
Nate you need to help Willard understand that this equation is correct.
”Flux in (W/m^2) = xy(1-a)/z
Where x = the solar constant, y = disk surface area, a = albedo and z = the area of the hemisphere.
z = 2y
So:
Flux in (W/m^2) = xy(1-a)/2y = x(1-a)/2”
Bill, Bill,
It is not exactly an equation, and it is incorrect.
Why are you replying here but not below?
Silly troll.
the only thing clear here Willard is you aren’t man enough to admit when you have been wrong.
“We also know it doesnt lose 200w/m2 in the direction of a warmer surface.”
No Bill, ‘we’ dont. Youve never explained it. Why?
“So what becomes of that 200w/m2? Well in the atmosphere”
Red herring.
So, Bill – when will you admit that you are wrong about Graham’s non-model?
"…you need to help Willard understand that this equation is correct."
Careful Bill…that would require some honesty and integrity on the part of the GHE Defense Team…not going to happen.
My belief that it results in nlayers minus 1 of insulation appears wrong giving it more thought. As I said at the beginning I had not given it much thought to how it might work in outerspace.
But what we have in reality is a slowing of cooling by eliminating convection. Slower cooling means more warming. And I appear to have been inconsistent with the intraatmosphere means of cooling being more robust across the board.
So DREMT has convinced me to admit I was wrong.
And as much as I hate it I will have to give kudos to you for calling out my atmospheric analogy as a redherring or I would not have reexamined it. Congratulations Nate that is the first time you have convinced me of something.
I have to reluctantly agree with you that my theory of an atmosphere analogy wasn’t completely thought out and it is a red herring to use it.
So the null hypothesis should be if energy losses are reduced all that is left is for radiation traveling slower than radiation plus convection means less upper atmosphere cooling.
Its hard to admit I was wrong on that extrapolation but I see no other alternative. The only thing we can be sure of is it isn’t going to warm anything over equilibrium.
Superdeveloping Triple La Nina effect – India edition
https://youtu.be/aUH7FPd9uNs
It’s so funny to recall Gosselin’s TricksZone mentioning last year in Germoney and France coldest temperatures for April since 1947.
Becoz me thinks Gosselin will very certainly not mention that this year, France experiences the warmest June since… 1947.
*
It is also amazing that in 2014 a French weather reporter predicted June temperatures of around 40 C in a television program for 2050 (!).
She was only wrong by 28 years.
https://climatedatablog.files.wordpress.com/2022/06/nino34-4.jpeg
Likewise no-one wants to acknowledge that min and max temperatures in the central Pacific have not changed much since the 1870s.
As I said above, min and max Nino3.4 temperatures (by year or by decade) are not a good way to analyze the data. That focuses on outliers and throws away 83% or 98% of the data.
The simplest, most obvious way to see if there has been a change in a set of data is a linear fit. And for this data, the linear fit (excel) is ~ +0.0018C per year or ~ +0.27C over the 150 years of the data.
Does this tell us what the temperatures were like in 1800? No.
Does this tell us what the temperatures will be like in 2050? No.
But for this period from 1870 – 2020, the temperature did, on average, increase by 0.27 C. [Given the large variations, I suspect the rise is not statistically significant, but I did not do that analysis.]
Thats a lot of blah-blah Folkerts, just to end with no significance.
Think you could do provide some significant source for your claim that two 315 W/m^2 fluxes can warm a surface to 325 K?
It’s been months now. People that you have misled are starting to wonder….
You are responding to a comment about temps, Pup.
Please leave Sky Dragon crankitudes for more appropriate moments.
Worthless Willard, you never get tired of perverting reality?
Must be due to your immaturity.
Do you have something to say about temps, Pup?
If not, I suggest you start your own thread.
I already said it, child.
You’re just too immature and uneducated to understand.
And, I like it like that….
Except that you did not, Pup.
Please stop trolling.
Willard, please stop trolling.
“As I said above, min and max Nino3.4 temperatures (by year or by decade) are not a good way to analyze the data. That focuses on outliers and throws away 83% or 98% of the data”
The same could be said about min and max for daily air temperatures but I don’t see GISS or Had changing their recording of them down throughout history as being a good indicator of daily temperatures in the past.
If those institutes wanted to determine the trend of mins and maxes, they would use all the mins and maxes in the period, not just a couple of data points. Same as any statistician would.
You’re conflating 2 separate arguments her, which is muddying the discussion and clarifying nothing except your antipathy to mainstream climate science.
Any min or max would show a trend.
https://www.investopedia.com/terms/s/sidewaysmarket.asp
What has the market got to do with climate?
RLH: “Any min or max would show a trend.”
No. Generate several (say, 20) random points from a standard normal distribution (mean=0, StDev=1). Find the max from the data set (and min and mean).
Repeat, but with a mean of 0.01.
Repeat, but with a mean of 0.02.
Repeat, but with a mean of 0.03.
Repeat, but with a mean of 0.04.
Repeat, but with a mean of 0.05.
Repeat, but with a mean of 0.06.
Repeat, but with a mean of 0.07.
Repeat, but with a mean of 0.08.
Repeat, but with a mean of 0.09.
Repeat, but with a mean of 0.10.
The “correct” trend is upward.
The mean trends upward most of the time.
THe max trends upward only slightly better than 50/50
(I did it in excel for fun)
This is one specific case, but you get the point. Looking at just min and/or max in sets with large variations and/or small trends (eg Nino3.4) is NOT good at spotting trends
> What has the market got to do with climate?
You said that Any min or max would show a trend, dummy.
Any min or max in a temperature series shows a record event.
Temperature series are NOT normally distributed. They are Bimodal.
That always occurs when you use time series that are sinusoidal in nature.
“random points from a standard normal distribution”
Are not talking about climate, but about the statistics of a standard normal distribution.
“You said that Any min or max would show a trend, dummy”
There are no trends in records according to Willard. Especially if they are from climate.
Record (i.e. unprecedented) events that is.
So Ill amend my wording slightly then.
There is no statistical difference between the El Nino of 1878 and that of 2016.
> There are no trends in records according to Willard.
A trend is not just a slope, dummy.
Trendology is the art of interpreting slopes.
Trendology is the art of interpreting slopes
Give that man an RG Dunn.
If you have a mechanical trick to determine if a market is trending in an objective fashion, Fernando, you may be a rich man without knowing it.
A record is a record though.
“Temperature series are NOT normally distributed. They are Bimodal”
To correct what I said previously, temperature series range from mostly Unimodal at the Tropics to mostly Bimodal at the Poles.
This is because seasonality varies across the Earth so causes the changes noted.
[RICHARD] A record is a record.
[MICHELLE] The trend in sea surface temperature and sea level pressure is toward a stronger zonal gradient across the tropical Pacific, which is considered “La Nina-like.”
[SIERRA JIM] Perhaps it is all natural.
A record is a record except when Willard doesn’t want to talk abut records.
….want to talk about records….
One does not simply argue that the warming is 100% natural by pointing at records that cannot be explained by variability alone, dummy.
So peak to peak is not important but averages are? Get a life, idiot.
Peak to peak matters if it is significant, dummy.
Which means you’ll have to check for linearity, something you whine about in every thread every month since you’re here.
Which is not multiple years, as you tried to oversell the other day.
You insufferable twat.
Willard, please stop trolling.
“83% or 98% of the data”
Why is it that people who should know better often quote numbers and statistics drawn from unimodal, often symmetrical, ‘gaussian normal’ datasets when in actual fact temperature data is in a skewed, bimodal form? Both in yearly and daily datasets.
In fact the extremes are MORE likely to occur than the center of the data in bimodal distributions.
No one expects that the extremes (or the immediate averages for that matter) will occur in spring/autumn or morning/afternoon rather than the summer/winter or daytime/nighttime.
Is this blindness because the statistical literature barely covers skewed, bimodal data at all, other than to say that mean and standard deviation are poor ways to describe just that data?
“Why is it that people who should know better often quote numbers… “
If you only look at the highest and lowest point in a set of 12 (months in a year), you are throwing away 10/12 or 83.3%.
If you only look at the highest and lowest point in a set of 120 (months in a decade), you are throwing away 118/120 or 98.3%.
No fancy “gaussian” or “bimodal” or “skewed” data analysis needed.
“In fact the extremes are MORE likely to occur than the center of the data in bimodal distributions.”
Except we are talking about the Nino3.4 set, which is indeed unimodal (and a pretty nice, symmetric bell curve). The maxes and mins are indeed RARE outliers here, and are NOT good ways to characterize the data set, where the change is SMALL and the scatter is LARGE.
So your objection is moot.
Did you not understand? U shaped distributions have the most common results near the min and the max rather than in the center. That is what you get as a distribution from sinusoidal or even quasi-sinusoidal time series datasets.
All temperature series are quasi-sinusoidal over both 24 hours and 365.25 days at the very minimum. If you take averages (mean or median) over a month as the Nino 3.4 series does that does not mean (pun) that this then disappears, just that it is hidden inherently as impression in the mean (or median).
There are still significant irregular deviations (see the green line) both above and below the ‘center line’ even in that data that will produce the same distribution type overall.
You cannot apply normal distributions statistics to quasi-sinusoidal (however irregular) time series data. In that sort of series more time is spent as we approach close to the peaks than it is during the crossing of the center line between them. Hence the bimodal distribution and appearance.
….hidden inherently as imprecision in the mean….
“The maxes and mins are indeed RARE outliers here, and are NOT good ways to characterize the data set”
Now analyses averages over time periods of, say, a month over a year.
Dec, Jan and Feb will be quite close together as will Jun, Jul and Aug.
So much more time is spent closer to the peaks than it is close to the ‘middle’.
You really do need to think more about what asymmetrical Bimodal distributions of quasi-sinusoidal time series datasets mean.
RLH says: “You really do need to think more about what asymmetrical Bimodal distributions of quasi-sinusoidal time series datasets mean.”
I do indeed know what it means.
I also did indeed make a histogram for the Nino3.4 data you presented, and it is not bimodal. It is not quasi-sinusoidal. It is not asymmetric. It is not U-shaped. The extremes are NOT more likely to occur.
This data simply does not behave the way you think it ‘ought’ to behave. Make your own histogram and you will see.
Tim: Did you do that analysis using anomalies or absolutes?
Anomalies are actually 2 records, the anomalies themselves and the normals that are used to create them. Saying that anomalies (which have a smaller range) are normally distributed leaves out the fact that the normals (which have a much larger range) are not.
RLH, we have ALWAYS been talking about anomalies. That is what is in the graph you posted and always refer two. It is the anomalies that you refer to when you ask “Is 1878 significantly different to 2016?”
The data we are talking about is not bimodal. It is not quasi-sinusoidal. It is not asymmetric. It is not U-shaped. The extremes are NOT more likely to occur than central values.
If you NOW want to discuss the raw data, then stop asking about the max data points in the anomaly data!
Tim: That is like saying, “We removed the seasonality and got the residuals/anomalies and they indeed showed no seasonality”. Duh!
Here is the absolute data
https://climatedatablog.files.wordpress.com/2022/06/nino34.jpeg
from the same base url as the anomalies. Care to publish the seasonality that comes from that?
Moved the label so as not to obscure relevant data.
https://climatedatablog.files.wordpress.com/2022/06/nino34-5.jpeg
> It is like saying “We removed the seasonality and got the residuals/anomalies and they indeed showed no seasonality”
It is rather like saying “we removed weather noise and we got the climate signal,” dummy.
Not really. Seasonality is not climate.
or weather.
“If you NOW want to discuss the raw data, then stop asking about the max data points in the anomaly data!”
Here are the 2 datasets in question.
Tell me how the max and min differ (other than the obvious offset).
https://imgur.com/a/NITOj1g
….Tell me how the max and min differ significantly….
https://www.epa.gov/system/files/documents/2021-12/30339_epa_report_climate_change_and_seasonality_v12_release_508.pdf
“The concept of seasonality refers to recurring events or processes that are correlated with seasons, such as rising temperatures
at the end of winter, the blooming of wildflowers in spring, the onset of allergies during ragweed season, and leaf-fall in autumn.”
“Tim: That is like saying, We removed the seasonality and got the residuals/anomalies and they indeed showed no seasonality. Duh!”
No, it is not like that at all! With OR without seasonality, the data looks almost the same. Seasonality is a minor part of the overall data here, (Which is not surprising since it is near the equator!)
Look at the two graphs. They track almost exactly (other than the 27.1 C offset). The ‘seasonal correction’ is about +/- 0.5 or less, while the standard deviation is about 0.9. Seasonality is a small correction.
As for bimodal vs unimodal — well just look at either of the graphs. You can use the grids of the graph as the bins for the historgram. The bins for max and min (on either graph have no more than a dozen data points. the bins at the center have several hundred data points. Data is clusterd near the middle! not near the extremes.
“Data is clusterd near the middle!”
Looks like you are correct. I took the lessons I learned from high latitudes and applied it incorrectly for low latitudes.
Still the observation about the La Nina of 1878 not being statistically different to 2016 still stands even though AGW has operated on it for more than a century.
It looks like the Bimodality is quite dependent on the range that the data covers.
So even Nino 1+2 shows distinct signs of Bimodality.
https://imgur.com/a/k7fi9EW
RLH: “Looks like you are correct. “
Good to get that resolved.
RLH: “Still the observation about the La Nina of 1878 not being statistically different to 2016 still stands even though AGW has operated on it for more than a century.”
And still, this is a poor way to judge noisy data. When the noise greatly outweighs the signal, looking at individual data points (or even 12 month smoothed data) is not going to tell you much.
It turns out that that section of the pacific is indeed one section of the oceans that has warmed the least. So this poor technique did get the right conclusion. But even so, that is not really interesting or exciting. It is a “double cherry-pick”. Looking at cherry-picked years from a cherry-picked region.
https://www.iflscience.com/deep-ancient-water-stopping-antarctic-ocean-warming-36029
Who cares if one region shows little or no warming? Other regions show much larger warming, and the oceans as a whole show warming. Global warming is happening, even if one test in one region shows no warming.
I don’t think RLH is trying to argue that the temps from this region are a proxy for global.
But in truth I really don’t know what point he’s trying to make.
“And still, this is a poor way to judge noisy data”
Tell that to GISS and Had who still use min and max in daily air temperatures historically. There are those on here who defend that analysis quite strongly.
“I really don’t know what point he’s trying to make”
That it would appear from the evidence that the AGW ‘signal’ is very dependent on the amount of seasonality that is removed from the temperature series.
Seasonality (and its range) is what separates Unimodal statistics from Bimodal ones.
“Who cares if one region shows little or no warming?”
If the Tropics (which if you use 30N to 30S as the designator) covers 50% of the Earth’s surface do not change that much then this is not well emphasized in claims about AGW.
In fact the Tropics do not have the 4 seasons that we mostly think about of Winter, Spring, Summer and Autumn but instead typically have a ‘wet’ season and a ‘dry’ season instead.
I do not think Richard is trying to argue either, Barry.
Willard thinks he is funny too.
“Tell that to GISS and Had who still use min and max in daily air temperatures historically. ”
You are STILL missing the point!
No one uses Min and Max the way you are describing for 1884/2016 Nino3.4. GISS and HAD don’t go back and says “the record high in Alabama was 112F on Sept. 5, 1925. The highest temperature last year (or last decade) was lower. We were wrong about global warming.”
A daily max & min is a pretty good proxy for the average temperature that day. (Sure, it would be better to average hourly temperatures, but the difference will be small, because temperatures follow a fairly predictable pattern over the course of a day.) The highest max for a year is not a good proxy for the annual temperature (ie it tells you almost nothing about what you would get if you averaged all the days that year).
You can’t claim “If Max/min is good (bad) for one purpose, it must also be good (bad) for another completely different purpose.”
“A daily max & min is a pretty good proxy for the average temperature that day”
Only if you work to the nearest degree. Time was when that was ‘good enough’.
“The highest max for a year is not a good proxy for the annual temperature”
You don’t say. What period would min and max be OK for then, hourly, 4 hours, 12 hours, daily, 2 days, 10 days, monthly or yearly? Which?
Tim says that AGW doesn’t really operate at the Tropics but is very visible towards the Poles.
Are we agreed that there is no statistical difference between the El Nino of 1878 and that of 2016?
“Tim says that AGW doesnt really operate at the Tropics but is very visible towards the Poles.”
No. That is a TERRIBLE misinterpretation of anything I said!
I say AGW does not operate the same everywhere.
SOME places in the topics (like Nino3.4) have below-average warming.
SOME places in the tropics (like the oceans south of India) have above-average warming.
SOME places near the poles (the off the coasts of Antarctica) have below-average warming.
SOME places near the poles (the off the coasts of Greenland) have above-average warming.
“Are we agreed that there is no statistical difference between the El Nino of 1878 and that of 2016?”
I think we are agreed that there is no statistically significant warming in the Nino3.4 region from ~ 1870 – 2020. (There is a weak upward trend, but it may or may not be significant).
I think we are also agreed that there is no statistically significant different between the El Nino of 1878 and that of 2016.
***************************
Are we agreed that the 2nd fact is not a statistically significant predictor of the first fact?
“I say AGW does not operate the same everywhere.
SOME places in the topics (like Nino3.4) have below-average warming”
You mean little to none as seen in the Nino 3.4 data.
“SOME places in the tropics (like the oceans south of India) have above-average warming”
India is well north of the equator. How far south do you mean?
“SOME places near the poles (the off the coasts of Antarctica) have below-average warming”
They are nowhere near the Tropics but near the poles.
“SOME places near the poles (the off the coasts of Greenland) have above-average warming.”
They are nowhere near the Tropics but near the poles.
So as I said (by paraphrasing you) AGW has little to no effect near the equator and large effects near the poles.
“I think we are agreed that there is no statistically significant warming in the Nino3.4 region from ~ 1870 2020.
I think we are also agreed that there is no statistically significant different between the El Nino of 1878 and that of 2016.”
I think we are agreed on both those 2 facts. That means also that AGW has little to no effect at the Equator in the Pacific in well over a century.
“AGW has little to no effect at the Equator in the Pacific in well over a century.”
No, that is only true in certain parts, eg Nino 3.4. There are other parts that HAVE had significant warming just in the past half-century (like off the coasts of South America or Papua New Guinea).
“India is well north of the equator. How far south do you mean?”
You DO need to check facts before posting. The entire coast of India is in the tropics. So zero meters south of India is ‘in the tropics’. Furthermore, the southern tip of India is about 8 degrees — hardly ‘well north of the equator’. Any significant area south of there is not only “in the tropics” but also “near the equator”.
Or you could have checked the link I provided or googled it yourself.
https://www.iflscience.com/deep-ancient-water-stopping-antarctic-ocean-warming-36029
“They are nowhere near the Tropics but near the poles.”
YOU are the one who brought up the poles. You hardly get to object to the topic when you brought it up.
And finally:
“So as I said (by paraphrasing you) AGW has little to no effect near the equator and large effects near the poles.”
And as I already corrected you:
AGW has little OR GREAT effect near the equator — depending where you look.
AGW has large OR SMALL effect near the poles — depending where you look.
I think you are confusing West to East and North to South.
I was dealing with central values on basins only.
Let’s stick with 5N to 5S as we do in the Pacific as well as the center of the basins to get a more logical approach.
“AGW has little OR GREAT effect near the equator depending where you look.”
Central or West/East.
This seems relevant, in particular the map showing global pattern of warming trend.
Does “global warming” mean its warming everywhere?
Mark: You do realize that choosing short time periods such as since 1950 or since 1970 in itself causes impacts on the data revealed.
“No, ‘global warming’ means Earth’s average annual air temperature is rising, but not necessarily in every single location during all seasons across the globe”
And not at all in the sea surface maximum temperatures in the central Pacific.
JFY, Mark:
https://climateball.net/but-this-odd-place/#everywhere
Willard is off playing ClimateBall, best to ignore him.
Promises, promises.
Willard, please stop trolling.
It’s not statistically significant.
NINO3.4 SSTs from 1870, from 1950 and from 1997 have a positive trend.
ONI values from 1950 and from 1997 have a negative trend.
None of these trends are statistically significant.
The min and max do not however. ONI is adjusted with global data which adds high latitude data into central Pacific ones.
The ONI and Nino 3.4 (and HadISST) deal with the same ocean surface area. Fact. What shows up in one will show up in the other after you have sorted out the changing baseline in the ONI which the Nino 3.4 does not have.
“The min and max do not however.”
Have a trend? It’s 99.99% likely that there is non-zero linear trend for the mins and the maxes, but as no one here has done the analysis, we don’t know what thy are, or what the uncertainty for them is.
Show me then.
https://climatedatablog.files.wordpress.com/2022/06/nino34-4.jpeg
Is 1878 significantly different to 2016?
Min and max are by definition unique results. Any ‘trend’ can only be between 2 individual points.
“Is 1878 significantly different to 2016?”
It’s slightly different, but it is immaterial to a proper trend analysis.
“Min and max are by definition unique results. Any ‘trend’ can only be between 2 individual points.”
This makes no sense and appears to be conflating different ideas.
We are comparing max with max for the discussion about l Ninos/la Ninas – not min with max, which appears to be an allusion to other discussions about daily temperature readings.
Let’s be clear. We are speaking of trends in la Ninas and el Ninos (the ‘peaks we keep talking about).
You cannot glean a trend in recurring phenomena by selecting only two instances of that phenomena. In this event you are only comparing one event with another, and not stablishing a general trend over time.
We’re not going to argue about this. You will either accept that as true or be a stupid idiot. There is no other alternative, and I’m not going to even bother probing the point. I’m not accepting sloppy “eyecrometer” science, nor the preposterous notion that a trend is gleaned just from subtracting endpoints.
Looks like someone will have to do the hard work of analysis. It’s not going to be me.
“It’s slightly different, but it is immaterial to a proper trend analysis”
Trend analysis of min and max use only these unique points, not some statistical conglomeration of them.
It is like saying that min and max records do not exist because the averages over time do not show them.
Let me phrase this slightly differently then, the record maximum temperature in 1878 of the El Nino is very close to the record maximum in 2016.
“the record maximum temperature in 1878 of the El Nino is very close to the record maximum in 2016.”
As I’ve already acknowledged.
If you want to talk about trends in ENSO events then we need a trend analysis of the maximums (l Ninos) or minimums (la Ninas).
So, as usual, records are not that important when you don’t want to talk about them.
So Ill amend my wording slightly then.
There is no statistical difference between the El Nino of 1878 and that of 2016.
No amendment can change the fact that 2 data points cannot make a trend. Accept that and move on to a new point instead of trying to make this one work.
Ignoring the facts does not make them go away.
There is no statistical difference between the El Nino of 1878 and that of 2016.
“Ignoring the facts does not make them go away.”
The point we are trying to make is that that is not a particularly useful fact.
Having the two warmest peaks near the beginning and the end does not confirm there is no global warming in that region, nor does refute that there is global warming in that region. It is simply a curiosity.
You need to know about the periods before, between, and after those 2 years. Trends; oscillations; noise. THEN you can determine something about global warming.
As I’ve agreed with that more than once and no one is disputing it, one can only wonder why you are repeating it over and over. Perhaps you imagine that chanting it will magically transform the meaning of a statistical trend so that 2 data points is all you need.
It won’t work.
Previous in response to:
“There is no statistical difference between the El Nino of 1878 and that of 2016.”
“As Ive agreed with that more than once and no one is disputing it”
So peak to peak shows to real change but OLS does. Could that be because there is a large quiet period towards the start of the record but after the first peak and that only effects OLS?
“So peak to peak shows to real change but OLS does.”
Peak to peak shows little difference between 2 points. ‘Change’ is about trend.
We don’t know if there is a “real change” in OLS of el Ninos over that period, because no one has done the analysis.
Peak to peak is different to the averages over the same time but show an overall trend to the data never the less. They both suffer from different behaviors but that does not mean they do not show the same thing in the end.
It is quite possible for peak to peak and the averages to show different rates of change depending on the data.
“Peak to peak is different to the averages over the same time but show an overall trend to the data never the less.”
Absolutely not. 2 data points still don’t make a trend of any kind.
Look up the definition of a statistical trend. Go on. And quote it here to me, please.
“It is quite possible for peak to peak and the averages to show different rates of change depending on the data.”
It is also quite possible to start a trend on a low peak, finish on a high peak, and get a negative trend, and vise versa of course.
And this is why you don’t call a peak to peak difference a trend. It’s not a trend. Look it up, stop being foolish.
“Peak to peak is different to the averages over the same time”
You STILL miss the point!
If you actually looked at the peaks “over time” that would be one thing. Say finding the peak each year and looking at the trend for those 150 data points. Or every 5 years and looking at the trend for those 30 points. That would tell you at least something useful and statistically robust.
Or do the same for averages. Take the averages for each of the 150 years and analyze that. That would be even MORE robust.
But taking the two highest peaks (or the two lowest, or the two highest averages) tells us almost nothing. And that is what you keep falling back to.
RECAP:
Analyzing a LARGE set of data (eg 150 max values from 150 years or 30 5-year averages from 150 years) is MORE statistically robust.
Analyzing a SMALL set of data (eg 2 max values from 150 years) is LESS statistically robust.
Any single large peak in the past compared to a single large peak recently tells you something about the likely range that the data sits in and its movement or trend over time, if any.
You can then try and accumulate peaks together but what you are doing in the long run really is creating an average.
These are 2 separate things about the data. Do try and not confuse them.
“tells you something ”
Yes. But that “something” is VERY limited. For example, suppose a real estate agent’s two best months in the past decade were in the first year and in the last year (and the two values were about the same). Based just on that fact, has her income been generally increasing, decreasing, or staying about the same? We have absolutely no idea!
“2 data points still dont make a trend of any kind”
They tell you about the range of the data (if they are peaks). If it has changed over time or not. i.e. a trend.
The range that the data covers is not a minor thing. Changes in it are not minor either.
Your estate agent example says nothing at all about the data under consideration.
RLH,
What you are saying is not only wrong but foolish.
I urge you to look up the definition of a statistical trend. You simply are getting this very wrong indeed. 2 points do not make a trend. even by the pedestrian definition, a trend is a general change, not a difference between to objects.
It’s no one’s job here to teach you stats 101, which is what this point most definitely is.
“I urge you to look up the definition of a statistical trend”
I urge you to look up the meaning of the trend of the upper edge of a range in peak to peak data.
> the meaning of the trend of the upper edge of a range in peak to peak data.
What the hell does that mean, Richard?
That you are an idiot for not realizing that the upper edge of something can have a trend also.
Twas just a word salad, dummy.
There is no word salad in observing you are an idiot.
“Your estate agent example says nothing at all about the data under consideration.”
Exactly! Just like your “1878 and 2016” example says nothing at all about the data under consideration.
“Just like your ‘1878 and 2016’ example says nothing at all about the data under consideration.”
Except that El Nino’s have not changed significantly in over 130 years.
Superdeveloping Triple La Nina effect Canada edition
https://youtu.be/wpUr3hDWuXk
Don’t tell Bindidong, he still can’t see it
RLH,
Wondered if you noticed this in the most recent post at the ENSO blog that l’Hereux moderates.
“Speaking of broken records, let's start with the sea surface temperature in the tropical Pacific. The three-month-average sea surface temperature anomaly in the Niño-3.4 region, specifically, according to the ERSSTv5 dataset. (The anomaly is the difference from the long-term average; long-term is currently 1991–2020.) This index, called the Oceanic Niño Index (ONI), is our primary metric for measuring ENSO (El Niño/Southern Oscillation), and the number that shows up in our historical ENSO chart dating back to 1950.”
https://www.climate.gov/news-features/blogs/june-2022-enso-update-how-does-your-garden-grow
I’m not sure if you properly comprehend that NOAA determines the state of ENSO using detrended SSTs in the NINO3.4 region. L’Hereux’s group uses ONI.
It’s not a question of wrong or right dataset as you queried a few days ago. It’s just useful to be aware of the difference.
The fact that your HadISST dataset is not detrended explains why your dataset has a positive trend from 1950, and ONI has a negative trend for the same period, even though it is exactly the same region of the Pacific Ocean.
I wonder if you have noticed that min and max for Nino 3.4 (and HadISST for the central Pacific for that matter) have not changed that much in a century. Not in a statistically significant way. You want to quote the absolute or the anomaly dataset? I can do both.
I haven’t seen anyone here run a trend analysis for the mins or the maxes for any period. Because the data is so variable, I’d reserve judgement until that is done. It might be that selecting for just data the accompanies l Ninos/la Ninas would reduce the variance, and w might just get a statistically significant linear trend.
I think you want me to notice the large l Nino anomaly in the late 1800s? I mentioned it way upthread when I ran the trend for the whole dataset. As I said before, 2 data points don’t make a trend.
Just look at
https://climatedatablog.files.wordpress.com/2022/06/nino34-4.jpeg
and say what you see.
And that a record is not that important. I know.
I will tell you what I said before: After a large el Nino anomaly early in the record the el Nino peaks appear to rise over time.
The record maximum temperature in 1878 of the El Nino is very close to the record maximum in 2016.
“the record maximum temperature in 1878 of the El Nino is very close to the record maximum in 2016.”
No one is disputing that.
Two points cannot make a trend. The statistical definition of a trend is a time series with numerous data. Subtracting one number from another establishes a difference, not a trend.
And there are 1800 months of available data spanning 150 years.
Why wouldn’t you use that to establish a linear trend (or curvy line)?
A record high (or low) temperature is just that, a record.
So you agree that El Nino set a record back in 1870 and that it is similar to that achieved in 2016?
….back in 1878 and….
“Subtracting one number from another establishes a difference, not a trend”
So I’ll amend my wording slightly then.
There is no statistical difference between the El Nino of 1878 and that of 2016.
Fine. But that doesn’t tell us whether there has been a trend in el Ninos, or whether the trend is statistically significant. That would take some actual trend analysis, using all el Nino data for the selected period.
Don’t claim records based on a single point either then.
There is no statistical difference between the El Nino of 1878 and that of 2016.
“After a large el Nino anomaly early in the record the el Nino peaks appear to rise over time”
You mean there was a large ‘quiet’ period between 1890 and 1970.
And long quite periods towards the start of the record will effect the OLS but not the peak to peak.
….And long quiet periods….
After the large anomaly early in the record, you see a ‘quiet period’. I see a rise in l Nino peaks – from your data.
“You mean…”
No. I mean what I say, not what you want me to say.
“After the large anomaly early in the record, you see a ‘quiet period’. I see a rise in {E}l Nino peaks from your data.”
They are the same thing and will effect the OLS trend if you start it in that same quiet period.
The start of HadISST is at 1870 is just after the end of the Little Ice Age. Do you think this will have any effect?
You can start with a high peak and finish with a low one and still get a positive trend.
That’s why peak to peak doesn’t tell you what the trend is.
A ‘quiet period’ and a ‘rise in peaks’ are not the same thing. They’re not even in the same category.
“You can start with a high peak and finish with a low one and still get a positive trend”
As it is high peak to high peak that we are discussing, whoosh.
“A ‘quiet period’ and a ‘rise in peaks’ are not the same thing”
The first impacts the averages much more than the later. Especially if the peaks are a long way apart.
“As it is high peak to high peak that we are discussing, whoosh.”
Whoooosh is right. I’m speaking of ‘max to max’. The fact that you can go from a high peak to a lower high peak and still get a positive trend from all the data in between and including those peaks, is why estimating trend from peak to peak can give you the completely wrong result.
Look, I did that here.
https://www.woodfortrees.org/plot/gistemp/from:1895/to:1936/mean:12/plot/gistemp/from:1897/to:1935/trend
Starts on a high peak, ends on a lower high peak. But the trend is positive, opposite what you would expect if you believed the peak to peak difference indicates the trend.
That’s why you run an actual trend analysis instead of relying on peak to peak. In case the rest of the data in between tell a different story.
This is stats 101. I’m not going to argue about this with you. Either you get it or you’re stupid. There is no middle ground.
What has GISS to do with Nino 3.4?
I’m showing you that it is possible to get a trend opposite to what you’d expect just choosing 2 peaks in the same period. Click on the link and see a positive trend despite beginning on a higher peak than the end.
I’m only making one point here. Th peak to peak difference can be opposite in sign to the actual trend, which is why you don’t use peak to peak for trend analysis.
This is the last stats 101 discussion I am having with you on this point. I am ok for you to remain in stubborn ignorance about what a trend is.
You carefully (or deliberately) ignore that fact that I was talking about the trend in the upper edge of a range, not the trend of the averages in the range.
The El Nino in 1878 and in 2016 define the upper edge of the data. Not the period in between.
If you had a peak meter and an RMS meter, would you set the gain so that the peak meter did not clip the signal or where the RMS meter gave you the highest output setting?
“You carefully (or deliberately) ignore that fact that I was talking about the trend in the upper edge of a range, not the trend of the averages in the range.”
False. From higher in this subthread”
“I will tell you what I said before: After a large el Nino anomaly early in the record the el Nino peaks appear to rise over time.”
“But that doesnt tell us whether there has been a trend in el Ninos>/b>, or whether the trend is statistically significant. That would take some actual trend analysis, using all el Nino data for the selected period.”
You are unable to follow a conversation. You introduce barely related items to be argumentative, you don’t understand the differences between datasets, you continually mischaracterise my opinion and you repetitively argue points that are not being disputed – often based on false assumption about what I think or am saying. You just don’t ‘hear’ your fellow interlocutor.
Your mind isn’t up to it. I have to keep explaining what we are talking about to you, and your answer is usually to change the subject yet again.
There’s no point. It’s like talking to a ‘warmist’ contradiction machine on randomization setting. You never know if the reply will have a cogent connection to the topic, but the theme is always, always the same.
I understand all too well what using a moving baseline does to the data (such as the ONI does) but that does not alter what the Nino3.4/HadISST data shows in its extremes.
I also understand that using the 1950 low point in the data means that anything since then will have a demonstrable upwards trend.
No, you don’t understand.
ONI has a negative trend from 1950.
HadISST has a positive trend since 1950.
And there is a reason for that, as I said in the first post.
https://climatedatablog.files.wordpress.com/2022/06/nino34-4.jpeg
Max has NO trend from 1878 to 2016.
“HadISST has a positive trend since 1950”
Which is the lowest point in the record as I have observed before.
You understand I didn’t choose 1950 because of that, right? It is the earliest data for the ONI to compare with HadISST.
I also ran the trends from 1997 for both datasets – the last 25 years. Same story HadISST has a warming trend, ONI has a cooling trend.
And so we remember the point of all this – it’s about the article you cited on more la Ninas. I just want you to understand that the data you are using is different to the data used by NOAA on which they base their understanding of more la Ninas.
Th data you are using would likely give an opposite conclusion to the ONI data on la Ninas, as it has a fairly strong warming trend for the past 25 years that the ONI data does not have.
I hope you decide to us your data to test the theory of more la Ninas. I’m pretty sur you will let it go when you find out it gives you an unwanted result.
“You understand I didnt choose 1950 because of that, right?”
Yes.
Do you also understand that my observation about it being a low point in the record is also correct.
The ONI has been extended further back in time that 1950 to 1870 also.
https://www.webberweather.com/uploads/1/1/9/9/119943685/ens-oni-timeseries-original3_orig.jpg
“I hope you decide to us your data to test the theory of more la Ninas”
So LHereux is wrong then. I am sure she will be delighted to know that.
Yes, I don’t know how to get hold of the extended data.
And it shows that there is no statistical difference between the El Nino of 1878 and that of 2016.
https://climatedatablog.files.wordpress.com/2022/06/nino34-5.jpeg
ONI: Jan 1870 – Feb 2018 (Climate Data Guide; D. Shea)
As far as I know it’s not available online.
“I hope you decide to us your data to test the theory of more la Ninas”
“So LHereux is wrong then.”
What?? No! What are you talking about?
I’m saying that your data will give a different result to the data l’Hereux uses.
As l’Hereux’s data (ONI) gives more la Ninas over the last 25 years, and ONI has a general cooling trend for that period, it is very likely your data (HadISST), which instead has a general warming trend for that period, will not corroborate more la Ninas.
Why has it taken 2 days just to explain that you use a different dataset and will get different results to l’Hereux?
If you could get out of combat mode and stop trying to win every point, perhaps some useful points might be heard and understood instead of reacted to.
L’Heureux. “Eu” sounds like this:
https://www.gymglish.com/en/frantastique/french-grammar/the-sounds-ou-and-eu
Murky bow coup
Barry: Seasonality does matter and is more obvious as you move from the Tropics to the Poles.
Seasonality changes the statistics from Unimodal to Bimodal.
I have asked L’Hereux for her take on the AP article and the 25 winters claim. We shall see what she says won’t we.
“L’Heureux”
I know. The parser removes the quote unless I change it to ‘. Get over it.
And my spell checker (or my fingers or the parser) will insist on changing L’Heureux to LHereux.
“As far as I know its not available online”
Ask D Shea.
Your parser does not eat the first U, Richard.
Eu is not the same sound as E.
You can call her Michelle.
The parser on Roy’s site eats the single quote though.
I asked Michelle about the AP article and the ‘La Nina like’ quote and she has replied.
https://www.climate.gov/comment/7288#comment-7288
Of particular interest is the 2 links she provided the first of which is
https://journals.ametsoc.org/view/journals/clim/35/14/JCLI-D-21-0648.1.xml
Persistent Discrepancies between Observed and Modeled Trends in the Tropical Pacific Ocean
This is a sub-thread about HadISST, dummy.
This deflection is worse than trying to pretend your “parser” excuse was relevant.
“This is a sub-thread about HadISST”
Strange you should mention that.
Are we agreed that there is no statistical difference between the El Nino of 1878 and that of 2016?
There is nothing strange about noticing when you start to spam every single active subthread with your latest reading, Richard.
As you never seem to answer the points made, what else should I do?
You never respond to the points raised against you, dummy.
Willard: Always the one with the smart words. Never with any sense to them however.
Figured out what “Global” means?
Figured out what idiot means about you?
“ONI has a negative trend from 1950”
ONI adjusts its baseline every few years so your point was?
My point is to be wary of using the HadISST data to reckon on ENSO behaviour.
Even though the ONI is based on the same ocean surface area as the Nino 3.4. index and has also been extended back in time to cover the same time period now?
https://www.webberweather.com/uploads/1/1/9/9/119943685/ens-oni-timeseries-original3_orig.jpg
Yes!
One is detrended, the other isn’t!
You keep forgetting the point.
One has a moving reference period, the other doesn’t also.
“You keep forgetting the point”
I forget nothing. I also know that anomalies/residuals come by removing the seasonality from the absolute data,
“One is detrended, the other isn’t”
“One has a moving reference period, the other doesn’t also.”
That is HOW the data is detrended. *facepalm*
You should try to understand what you are talking about before you talk about it.
“You should try to understand what you are talking about before you talk about it”
You should try and understand that trying to minimize seasonality and treat everything the same from Tropics to Poles is not the way science is done.
“That is HOW the data is detrended”
Data is detrended by removing a global warming figure, not by changing the reference periods to the recent past (although this may have a similar effect).
“Data is detrended by removing a global warming figure”
No!
You are quoting Tim quoting wikipedia about the PDO, not the methodology for the ONI!
I repeat:
You should try to understand what you are talking about before you talk about it.
You can read a simple brief about ONI detrending here.
https://origin.cpc.ncep.noaa.gov/products/analysis_monitoring/ensostuff/ONI_change.shtml
Where you will learn that a 30-year baseline is recalculated very five years for ONI (moving baseline)
Where you will see that seasonal variability is 1C throughout the year on average.
Where you will see that the 30-year absolute monthly temperature average has generally risen over the long term.
Where you will see that they use ERSSTv5 SSTs, not HadISST.
And where there is a data link that includes the absolute ERSSTv5 SST values for NINO3.4 from 1950 (ERSSTv5 instead of HadISST), the 30-year averages for each month, and the monthly anomalies for ONI.
https://origin.cpc.ncep.noaa.gov/products/analysis_monitoring/ensostuff/detrend.nino34.ascii.txt
Learn the details of what you are talking about. You cannot do that if you are only mining information to win points.
Your ignorance is a bit glaring here, and exposes that you are only reading for ammunition, not for understanding.
“”Data is detrended by removing a global warming figure”
No!”
Data in general is detrended by removing a global warming figure.
Happier now?
The precise way in which ONI achieves the same result is as you claim, but that only has the effect of achieving the same result.
“NINO3.4 from 1950”
I keep telling you that 1950 is a low pint in the data and you keep ignoring that fact. Why?
….is a low point in the data….
“Data in general is detrended by removing a global warming figure.
Happier now?”
No.
You said of the ONI data:
“Data is detrended by removing a global warming figure, not by changing the reference periods to the recent past”
That is exactly what they do every 5 years. They did it 2021, and will again in 2026.
I know you won’t admit you were wrong, which is a pity, as the habit seems to deny you of any possibility of learning things. You are myopically on your own track in these discussions.
“I keep telling you that 1950 is a low pint in the data and you keep ignoring that fact. Why?”
You keep forgetting our conversation.
https://www.drroyspencer.com/2022/06/uah-global-temperature-update-for-may-2022-0-17-deg-c/#comment-1319624
Why?
I haven’t ignored this. We discussed it only yesterday.
Are you senile?
“That is exactly what they do every 5 years. They did it 2021, and will again in 2026”
Which will achieve the same effect as removing the global AGW figure as I said.
So you agree that 1950 is a low point in the data then.
You posited that the ONI was NOT done by moving the reference forward to ‘recent’.
You were wrong, and you just can’t admit it. Instead you have to repeat something you said that wasn’t wrong.
But right and wrong doesn’t matter. What matters is that you prefer winning to understanding. That’s why you are so ignorant of the datasets and the methodologies, and why you will never learn about them. Understanding things is not why you’re participating here. You’re playing climateball and you want to beat the alarmists. That is your whole schtick and nothing else.
“You posited that the ONI was NOT done by moving the reference forward to ‘recent'”
I did not. I said it will achieve the same effect as removing the AGW ‘signal’.
Do you agree that 1950 is a low point in the data then.
“Do you agree that 1950 is a low point in the data then.”
I tacitly agreed when I said yesterday that I had no choice with ONI data.
A conversation you seem to have completely forgotten when you said I “ignored” this just a few hours ago.
That 1950 is a “low point” has NOTHING to do with the point under discussion, which was about differences in 2 datasets.
But what MIGHT be making you say this is some antipathy for warming trends based on climateball. You need to teach the alarmists a lesson, and you won’t have any warming trend from them, no matter what the discussion is about.
Now, if I’m wrong, please tell me why you are making the point about 1950 being a low point?
If you agree that 1950 is the low point then of course anything based since then will show a warming. That is all the point I was trying to make.
The low point in the series isn’t 1950, it’s 1890, ergo Nino 3.4 is warming at 0.40 C/decade using the peak-to-peak methodology discussed elsewhere in this thread.
Nino 3.4 with 2 point trend
Mark: Now you are just being idiotic. Try displaying the range and how it has changed rather than the Min to Max (which should be max to max and min to min in any case).
https://climatedatablog.files.wordpress.com/2022/06/nino34-4.jpeg
Look at the blue line, which is the 15 year average using a CTRM, over the whole period. The most recent minimum is in 1950/1952. You could argue that it is the same as 1890 but the OSI that Barry was using doesn’t go back that far anyway.
….but the ONI that Barry….
For those who want to be picky about wording.
Any single large peak IN THE SAME DIRECTION…. i.e. compare max to max.
Mark B is becoming almost as annoying as Willard. Trying to come up with a spin on the words without taking into account all that has been said before. We were comparing El Nino with El Nino but I got too lazy and did not continue to make that clear so Mark thought it would be funny to compare Lan Nina with El Nino instead.
Does that make him an idiot?
….compare La Nina with El Nino instead….
“If you agree that 1950 is the low point then of course anything based since then will show a warming. That is all the point I was trying to make.”
Yes, you had to attack a warming trend. Just because it’s a warming one. Despite the fact the direction of the trend has NOTHING to do with what we are discussing.
Climatball. Every sentence. You just have to contradict global warming and ‘warmists’ at every step.
So you admit that 1950 is the low point but fail to acknowledge the fact that everything from that point onwards will have a warming trend by definition. No surprise there then.
I know, let’s make 1930 the start point instead.
Barry: Found the extended ONI for you as a url on the ‘net.
https://www.webberweather.com/uploads/1/1/9/9/119943685/ensemble_oceanic_nino_index_accepted_article.pdf
https://www.webberweather.com/uploads/1/1/9/9/119943685/ens-oni-timeseries-original3_orig.jpg
I’ve seen that. There isn’t a link to the data on the net that I know of. I would plot in in Excel if there were a link to a txt doc.
RLH, this is you forgetting what happens in the conversation:
We were comparing HadISST and ONI in this thread above:
barry: “One is detrended, the other isn’t! You keep forgetting the point.”
RLH: “One has a moving reference period, the other doesn’t also.”
barry: “That is HOW the data is detrended. *facepalm*”
RLH: “Data is detrended by removing a global warming figure, not by changing the reference periods to the recent past
barry: “You posited that the ONI was NOT done by moving the reference forward to ‘recent’ ”
RLH: “I did not.”
You don’t even know you did it.
https://www.drroyspencer.com/2022/06/uah-global-temperature-update-for-may-2022-0-17-deg-c/#comment-1320358
A comparison of MODTRAN output with measured is at http://climatemodels.uchicago.edu/modtran/modtran.doc.html
Dan, that same graph occurs throughout the AGW nonsense. It has been around for years. You have to understand it means NOTHING.
The graph purports to be one measurement over one area, at “TOA”. But the Sahara is NOT the planet. The IRIS satellite orbits at close to 400 miles above Earth, while “TOA” is considered to be only about 60 miles high? Was the satellite graph made during the day or at night?
There are so many inconsistencies that the graph is completely worthless.
Cult Leader grammie pup, should read the Hanel et al., 1972 paper instead of spouting his usual nonsense.
Willard Jr, Nimbus 4 was at even a higher altitude, which makes for more inconsistencies. You don’t understand any of this. You’re just throwing stuff against the wall, hoping something will stick.
Cult Leader grammis pup, Do you have any information which would show that the IR spectrum would be significantly different at the satellite compared with it at your assumed location of the TOA at 60 mile altitude (that should be 100 km, BTW)?
Yes it is misleading , it shows one specific condition, I had already posted in the past the same chart but over the polar region and it is totally inverted with CO2 band emitting far more than the others, But it doesn’t matter , climate cranks remain unfazed no matter what you show
Willard Jr, 100 km is “about 60 miles”.
You don’t understand any of this. That’s why you can’t be taken seriously.
I agree that AGW caused by CO2 is nonsense. AGW is tiny, caused by water vapor increase and therefore is self-limiting. It might even have already peaked. The graph is merely to show that MODTRAN output appears to agree fairly well with measurement. There are two versions of MODTRAN that I know about; MODTRAN and MODTRAN6. They agree in general but not 100%.
In the satellite era, warming due to increase in CO2 ppm is now meaningfully measured thus known and warming due to increase in water vapor ppm is also now meaningfully measured thus known.
It is Dan’s comment that is nonsense since Dan doesn’t agree with those observations.
And the ratio between CO2 caused warming and WV caused warming is what? And which caused the other? Or is it all driven by a 3rd factor?
Interesting that increases in water vapor has caused a 3% increase in precipitation over 120 years but that increase has not kept up with population growth and the need for fresh water.
The liberals are embarked on an accelerated program of trying to starve everybody to death to reduce the population.
But like the TVA they will literally have shovel ready jobs for us in damming up the rivers. Especially for anybody estimated to be spreading disinformation. It will be off to the gulag.
But the increase in WV is interesting in light of the evaporation paradox.
RLH 3:24 am, the satellite instruments have measured what happened down to 2 meaningful significant figures; it takes a long read to explain why the warming trend happened, see Loeb 2021 in GRL 10.1029/2021GL093047.
The global warming ratio in the period from trace noncondensing gas ppm change over wv ppm change was ~0.71.
NASA/RSS has been measuring average global WV (TPW) Jan 1988 to Dec 2021. It is reported monthly as TPW anomalies at http://data.remss.com/vapor/monthly_1deg/tpw_v07r01_198801_202112.time_series.txt . The trend of the WV increase has been 1.44% per decade. What has been mistakenly called feedback from CO2 is actually the feedback from temperature increase.
But the average global temperature increase has been measured. The measured temperature increase is the net result of ALL forcings and feedbacks. The WV increase resulting from temperature increase is easily calculated, see Sect 7 of https://watervaporandwarming.blogspot.com The measured WV increase is substantially more than from just feedback as seen e.g. at https://drive.google.com/file/d/1FsGOBIRZ5b3VmKapPpwUC12iGeQWZvmT/view?usp=sharing . This demonstrates that humanity’s contribution to climate change has been from WV increase, not CO2 increase.
You might wonder what is putting the extra WV into the air. It is the same phenomenon that has always put WV into the air: warm water (of course the rate depends also on other things like wind and vapor pressure deficit). Most of the warm water is in the tropics and that area hasnt changed much since humans have been paying attention. The added warm water is from irrigation which has been increasing for centuries with the rate increasing dramatically around 1960. (Sect 6). Irrigated area is now more than 4 times the area of France.
John Christy’s observations on AGW.
https://www.youtube.com/watch?v=XltFOh7Cg2U&lc=
“John Christy’s observations on AGW.”
I’m fascinated to see he has a graph based on UAH temperature data starting in 1900. Video starts at the correct time stamp. Pause if you like.
https://youtu.be/XltFOh7Cg2U?t=425
barry, look again. That graph was about heat waves.
Heatwaves based on temperature, fool. This is the paper referenced in the chart, for the methodology.
https://agupubs.onlinelibrary.wiley.com/doi/full/10.1002/2014JD022098
UAH temperatures (black bars) beginning in 1900. Brilliant.
Berry, are you so blinded by your ideology that you cannot realize that Christy could compile data from other than UAH satellite sources? The compilation would be properly identified as being done by UAH.
Oh I can certainly imagine that.
Sadly, neither youtube, nor the conference nor even John Christy has supplied a reference to this UAH temperature data since 1900.
So it will remain imaginary data.
You got a link to it, Dan? And if you don’t have the data in skeptic-land, that means it is highly suspect, no?
So they agree that CO2 takes a rather significant chunk out of the outgoing LW radiation to space.
If you were to double the CO2 concentration in Modtran, you would see the CHANGE in OLR is as predicted, again, significant.
Clearly the effects of CO2 are not negligible compared to water vapor.
Then I dont see how you can conclude “I agree that AGW caused by CO2 is nonsense. AGW is tiny, caused by water vapor increase and therefore is self-limiting.” ?
Superdeveloping Triple La Nina effect – Italian edition – Triggers Derecho system
https://youtu.be/CxvVsjO8jwQ
Superdeveloping Triple La Nina effect Chinese edition
https://youtu.be/Z1uyKQvP9Zo
Ask me again , where is the superdeveloping La Nina
Superdeveloping Triple La Nina effect – California edition
https://youtu.be/IMMIuagQ12c
There is no statistical difference between the El Nino of 1878 and that of 2016.
No need to have a look at some anonymous youtubings to get informed how wrong JMA’s NINO3 prediction has been 12 months ago.
I personally prefer this:
WMO: Stubborn La Niña persists
https://tinyurl.com/29n2czew
Doesn’t make me happy at all.
*
Good stuff to read as well, encompassing that above:
GLOBAL SEASONAL CLIMATE UPDATE
TARGET SEASON: June-July-August 2022
https://www.wmolc.org/gscuBoard/downloadExt?fn=GSCU_JJA%202022_update.pdf
No you weasel , you were wrong,
Others were wrong, not Blinny : )
Wrong, I was rather ‘bloody’ enough to trust JMA.
You, Ebaby, were ‘clever’ enough to trust NOAA’s La Nina forecast stuff – despite the fact that you, as a gullible follower of Goddard aka Heller, at the same time deny NOAA’s temperature data becoz it shows warming.
You are always ‘at the right side’, aren’t you?
Told you.
Once again , when Bindiscum gets shown to be wrong and gets his forecast exactly backwards he starts spinning around like a top throwing zshit in every direction hoping some of it will stick somewhere,
Thanks Ebaby for confirming your degree of both ignorance and dishonesty.
Woooaaah.
Even WUWT’s sleepy El Nino meter is about to leave neutral towards La Nina these days:
https://4castwidgets.intelliweather.net/enso/wuwt/elninometer-current.gif
Wonder what data that is based on. Care to ask?
Maybe CFSv2? The mean forecast line is currently sitting just above -0.5.
CFSv2 for Nino 1+2 shows that things are going downwards and that is to windwards of 3, 3.4 and 4.
https://www.tropicaltidbits.com/analysis/ocean/nino12.png
See below for the proof at that
https://coralreefwatch.noaa.gov/data/5km/v3.1/current/animation/gif/ssta_animation_90day_large.gif
Way to ignore the reply, RLH. You just can’t help being in perpetual combat mode, can you.
Way to ignore the wider picture and just concentrate of areas where you feel you have a point.
It’s called sticking to the topic.
You asked what data WUWT is using for their ENSO-meter. I gave a possible answer. You went all commando with data as if I was trying to prove something.
You’re a crashing boor with this reflexive battling going on all the freaking time. I’m just about done with you.
As you have brought nothing to the table except a single minded ‘it is getting warmer’ attitude, good.
That is utterly in your imagination. I’ve recommended, for example, you use ONI instead of HadISST precisely to avoid a warming trend in the HadISST data. I put the cooling trends of ONI front and centre. I am in fact trying to help you argue that there are more la Ninas, warning that HadISST could obscure this because of its long term warming trend. You could not possibly fathom that I would want to help you out, and we know why.
It’s clear why you can’t follow a conversation, why you are in perpetual combat mode, why you learn little about the details of the topic you seem to be following, and why you conflate unrelated issues. Your whole modus oprandi is to contradict ‘warmists’. You are playing climateball with very sentence, apparently unaware you are doing it.
Let’s use 1930 as a start point in the Nino 3.4 data instead.
“you use ONI instead of HadISST precisely to avoid a warming trend in the HadISST data”
What warming has there been in Nino 3.4 since 1930?
Did you average together 1+2, 3, 3.4 and 4 to get that figure? It looks closer to just 3.4 I think.
The last 40 years shows a very slight downwards trend in both absolute and anomaly data for Nino 3.4
https://imgur.com/a/h4VYlNh
to compliment the downwards trend that ONI shows over the same time period.
https://journals.ametsoc.org/view/journals/clim/35/14/JCLI-D-21-0648.1.xml
Persistent Discrepancies between Observed and Modeled Trends in the Tropical Pacific Ocean
“[T]he results support the argument that the observed trends are a response to radiative forcing in which an enhanced eastwest SST gradient and thermocline shoaling are key and that the latest generation of climate models continue to be unable to simulate this aspect of climate change.”
Are we agreed that there is no statistical difference between the El Nino of 1878 and that of 2016?
So the models are incorrect in this aspect at least.
If only you had read what the IPCC said about all these “aspects,” Richard.
Enlighten me.
“We are climate modellers and analysts who develop, distribute and use these projections. We know scientists must treat them with great care. Users beware: a subset of the newest generation of models are ‘too hot’ and project climate warming in response to carbon dioxide emissions that might be larger than that supported by other evidence. Some suggest that doubling atmospheric CO2 concentrations from pre-industrial levels will result in warming above 5C, for example. This was not the case in previous generations of simpler models”
Start here:
https://www.ipcc.ch/
“It is important to emphasize that, whereas unduly hot outcomes might be unlikely, this does not mean that global warming is not a serious threat. Multiple lines of evidence establish that the planet is more than 1C warmer than it was before the Industrial Revolution, and that further warming poses severe risks to society and the natural world.“
They would say that wouldn’t they.
See
https://www.drroyspencer.com/2022/06/uah-global-temperature-update-for-may-2022-0-17-deg-c/#comment-1320608
“Multiple lines of evidence establish that the planet is more than 1C warmer than it was before the Industrial Revolution”
Except the El Nino at least in the central Pacific do not follow that simple pattern as has been well demonstrated.
[HAMM] Here is what climate scientists say.
[CLOV] Here is what they also say.
[HAMM] They would say that, would not they.
Willard = Idiot.
“to compliment the downwards trend that ONI shows over the same time period.”
I don’t think anyone has done that linear regression. I just did and can confirm.
(l’Heureux and co did not analyse la Nina frequency this way)
Was that OLS or TLS?
https://www.drroyspencer.com/2022/06/uah-global-temperature-update-for-may-2022-0-17-deg-c/#comment-1316666
and why would you think that it was a good way of analyzing things when peak to peak shows no such behavior?
It was OLS in excel.
If you don’t know why using only 2 points to gauge a trend is illegitimate then there is no hope for you.
It’s so drop-dead dumb that I don’t think it’s possible to help you. If you want to help yourself, look up the definition of a statistical trend.
Just for fun I managed to pick A high early peak and a lower later peak and still got a positive trend.
https://www.woodfortrees.org/plot/gistemp/from:1895/to:1936/mean:12/plot/gistemp/from:1897/to:1935/trend
“Just for fun I managed to pick A high early peak and a lower later peak and still got a positive trend”
You do know why cherry picking is considered bad don’t you?
Try 1878 to 2016 also.
Try also
https://www.woodfortrees.org/plot/gistemp/to:1920/mean:12/plot/gistemp/to:1920/trend
I did it to make a point. You can b deceived by relying on peak to peak.
I gave it a long shot that you’d get the point instead of finding something to argue about. Never mind.
“I gave it a long shot that youd get the point instead of finding something to argue about”
I understand why we have peak to peak meters in audio as well as RMS averages as well. Do you?
“You can b{e} deceived by relying on peak to peak”
You can also be deceived by relying on the gaps between peaks, aka the average.
Those are unrelated issues and you’re simply being argumentative, which, I’ve discovered, is your natural state.
Peak to peak describes a range.
> Peak to peak describes a range.
Not really.
Min to max does not describe a range? What planet do you live on?
Barry: I’d like your thoughts on John Christy’s observations.
https://www.youtube.com/watch?v=XltFOh7Cg2U&lc=
> Min to max does not describe a range?
You said peak to peak, dummy, and no – one does not simply take the low of one day and the high of another day to say anything about the range of a day.
{high} peak to {low} peak of the same day, not a different one as you claim in your pathetic attempt at an answer.
Or week/month/year/decade/century/millennia as you wish.
> {high} peak to {low} peak of the same day
Here’s your first graph, dummy:
https://www.woodfortrees.org/plot/gistemp/from:1895/to:1936/mean:12/plot/gistemp/from:1897/to:1935/trend
You’re fooling no one.
What has GISS to do with Nino 3.4?
https://climatedatablog.files.wordpress.com/2022/06/nino34-4.jpeg
What does it have to do with your misunderstanding of the concept of peak in statistics?
Willard, please stop trolling.
“If you dont know why using only 2 points to gauge a trend is illegitimate”
You do know the difference between peak to peak and averages don’t you?
In audio we have both on separate meters to deal with the different characteristics as they show different things.
The problem isn’t so much that you’re looking at peaks. The problem is that you’re only looking at two of them.
Is the 1998 peak statistically different than 1878? 1982?
If you’re looking at El Nino peaks, there are a lot more than two in the long record and that allows one to say something about trend significance.
Peak to peak is a legitimate way of looking at things. The distance between peaks is related to the averages/center of the range that can be measured over the same time period. You really need to remove that first before you come to any real conclusions.
India called – La Nina not gone by April – they want their money back
https://youtu.be/2J3jGLEz0HE
SuperTripleDeveloping La Nina effect – Yellowstone edition
https://youtu.be/rl0S9LNXLs8
เบื่อ อ่านนิยาย มาเล่นเกม pgslot กัน พออ่านๆไปนานๆก็อาจจะเกิดอาการเบื่อ คงต้องหาอะไรทำแก้เบื่อ เราขอแนะนำเล่นเกมแก้เบื่อกัน นี่เลย เกมสล็อต จากค่าย PG SLOT กับทางเว็บของเรา
Tim: Let me propose a new set of metrics based on long term sea surface data.
1. Seasonality. The Sun moves between 23.4 (approx) degrees North and South. Based on the 1 degree grid that HadISST supports that would be a 2 degree section at 24N/S to 22N/s degrees and a center at 1N to 1S. This will of course be slightly delayed due to thermal loading in arrears of the solstice/equinox.
2. Ocean basins. The Nino 3.4 area in the Pacific needs a suitable area in the Indian and Atlantic oceans. If we stick with 5N and 5S in all basins then the only question is the East/West limits. Nino 3.4 is 150E to 120W longitude. To stay away from land effects, the boxes in the Atlantic and Indian ocean need to be similarly determined.
To determine any residual bias then a hollow box compared to a solid box will help in that regard. Thus the 1 degree edge needs comparing N/S and W/E with the mean/median of the whole area.
I prefer median as this makes no assumptions about the actual distribution of temperatures ahead of time.
This is without knowing in advance what these new metrics will show.
We then also have to deal with peak to peak and average differences. The problem with both is that they are subject to changes in the center of the range over the long term period. Thus 1950 as a start point suffers from being at a low point for the middle of the range/average in this data. As HadISST starts in 1870 this overcomes some of this problem but it should be noted that the start of this data is only just after the the Little Ice Age ended so may suffer from distortions in this regard also.
Richard’s pedantry and trollish behavior aside, this does illustrate how dynamic the Pacific equatorial region is compared to the other equatorial ocean regions. It’s apparent why climatologists and weather forecasters pay attention to the state of the Nino regions. The Atlantic and India Ocean equatorial regions are simply warming more or less along with the rest of the planet.
hadsstEquatorialRegionAnomalies.png
Maybe. That is why I am suggesting the extra 2 areas of interest. Both exhibit similar dipoles to the El Nino/La Nina that the Pacific shows.
Your graph shows that the warming is only 0.02C to 0.07C per decade which is hardly any warming at all.
Your Atlantic and Indian boxes are quite close to the Land edges and that will have some affect on them. The advantage the Pacific has is that is very big and the Nino 3.4 box is a long way from the edges.
“how dynamic the Pacific equatorial region is compared to the other equatorial ocean regions”
Yet the Nino 3.4 has the lowest rate of rise of them all.
Thanks Mark B for the professional looking work.
That there is no warming in the NINO3+4 SST region over a period longer than a century is known since a while.
Interesting however is the fact that according to their 2.5 degree grid data, UAH6.0 LT’s trend for the NINO3+4 since Dec 1978 is 0.09 C / decade.
“That there is no warming in the NINO3+4 SST region over a period longer than a century is known since a while”
So now Blinny says that AGW does not apply to the Nino 3.4 area.
And polemicist RLH deliberately ignores the simple fact that the Globe is full of corners like Nino3+4.
RLH never computed the trends for all GHCN daily stations worldwide; otherwise he would know how many of them show a negative or zero trend, hence contradicting AGW.
Is it possible to behave dumber?
So now Blinny observes that station siting can have a bigger effect than AGW does on a site by site basis.
Mark B
We all know that simple running means have their disadvantages. I use them only to make a time series’ behavior better visible than do their linear or quadratic fits.
Nonetheless, I’m wondering that a 12 month CTRM looks in HadISST1 SST not only like a 19 month running mean, but also like a 19 month Savitzky-Golay smoothing.
The same happens when using Greg Goodman’s CTRM example.
This might be due to the S-G tool I use. Do you have such a S-G filter at hand? I would enjoy looking at how it works on your HadISST1 data evaluation.
Blinny doesn’t know (or read apparently) enough to know that a LOWESS is the same for a given window as an S-G (2nd order curve fit).
He also doesn’t recognize that a CTRM is the same as an S-G with the same window either.
Thus he accused me of not comparing a CTRM with a box filter, aka running mean, (quite incorrectly) when all the time I have been showing just that. He went very quiet when this was pointed out. No surprise there really.
Still not sorted out the difference between a time series and a distribution apparently. Or not been man enough to state that difference as a fact.
” He also doesn’t recognize that a CTRM is the same as an S-G with the same window either. ”
Absolutely wrong.
It does you know. I checked one against the other to confirm just that fact. In the same way as I checked the CRTM against a running mean of the same window (which you denied I had published). It has a slightly smaller vertical range which can be accounted for in the error inclusions that a running mean adds.
“He also doesnt recognize that a CTRM is the same as an S-G with the same window either”
So either Vaughn Pratt is wrong or SavitzkyGolay are. Or they could both just be correct.
Bindidon,
I took a quick look at the Python scipy.signal.savgol_filter function which I had not previously used.
The filter coefficients that package generates don’t taper to zero on the impulse response edges. This makes them appropriate for interpolation around the filter center point, which, as I understand was the original motivation for the algorithm. This function implementation, unless there’s some parameter setting I’m missing, isn’t great for smoothing over a broad window to visualize broad trends. It gives the higher frequency ripples that are also apparent in your plots.
For data smoothing, I’ve been using the statsmodels.nonparametric.smoothers_lowess.lowess implementation of Lowess smoothing.
LOWESS/LOESS (2D/3D) uses the same methodology as S-G (which came a lot earlier), namely fitting a curve/surface to a limited range of subset of points in the data.
“They are two strongly related non-parametric regression methods that combine multiple regression models in a k-nearest-neighbor-based meta-model. In some fields, LOESS is known and commonly referred to as SavitzkyGolay filter (proposed 15 years before LOESS)”
Most people use a 2nd order polynomial as the fitting function.
It is amazing to see that while Linsley Hood aka RLH names Clint R an idiot each time the latter tries to simplify Moon’s motion down to ‘orbital motion without rotation’ (like a ‘ball-on-a-string’), the former – Climate Expert-in-Chief – has no problem at all to reduce the climate discussion in exactly the same way:
” What hope for AGW if the central Pacific sea surface data does not show significant trends in only that data? ”
*
Does that matter if the ‘central Pacific sea surface’, i.e. the area enclosed within [5N-5S |170W-120W], is with less than 800,000 km^2 no more than a tiny bit of the Tropics, let alone of the Globe’s oceans?
Of course it doesn’t.
And thus, to look at a comparison of
– NOAA NCEP Nino3+4
– HadISST1 SST in the same region
and
– MEI:
https://drive.google.com/file/d/1Lq2-Yu4jImM5fmMhD1IXWYYWDloLawlL/view
manifestly is, with regard to the AGW discussion, way, way more relevant than looking at more global things, like this comparison of HadISST1 SST for
– the Globe
– the Tropics (30N-30S)
and
– the Northern and Southern Hemispheres:
https://drive.google.com/file/d/1EgG2fxTxsswsNV-gwSOLyWKTGTqITcEi/view
*
It’s like we would say, when looking at the 2012-2021 trend for the USCRN station AK_Metlakatla_6_S (-0.149 C / decade), that ‘there is no hope for AGW’.
*
Linsley Hood’s however did his really very best copy & paste of Clint R’s genial statements when he wrote:
” Still the observation about the La Nina of 1878 not being statistically different to 2016 still stands even though AGW has operated on it for more than a century. ”
Great.
That is definitely better than a ‘climate-ball-on-a-string’.
It even bypasses the high end quality of a ‘climate-bicycle-pedal’, for sure.
Perhaps Perch’s former General Director is looking at
http://research.jisao.washington.edu/data/quinn/quinn15251987.big.gif
and searches for other, century-old El Ninos which also are not statistically different to 2016?
*
Well, unless the Pseudo-skeptics find better “arguments” against AGW than the above two, then AGW has a long life ahead of it.
Source
https://www.metoffice.gov.uk/hadobs/hadisst/data/download.html
NCEP and MEI sources were named many times.
So AGW applies to everything other than the small slice of the world around the central Pacific. Never saw that written on the box previously.
G stands for “Global,” dummy.
So you agree that AGW does not apply to the central Pacific so presumably in order to compensate it must be much larger towards the Poles somewhere.
P.S. The central Pacific is part of the globe.
Still have to figure out what “Global” means in this context?
It obviously does not mean ‘applies all over the globe’
“Global” does not mean “at every single point at all time,” dummy:
https://climateball.net/but-this-odd-place#everywhere
It most obviously does not mean ‘the central Pacific in more than a century’.
The fact that the Earth’s average annual air temperature is rising does not imply what you make it imply.
So we can assume that island in the central Pacific will not experience a thermal rise is sea surfaces then, as the oceans have not risen in temperature since 1930.
John Christy has noticed that the IPCC ‘rise’ in temperature is not quite so simple as you may think.
https://www.youtube.com/watch?v=XltFOh7Cg2U&lc=
You certainly can assume whatever you please, Richard.
JC’s relationship with scientific facts is indeed complex:
https://cornwallalliance.org/about/our-history-in-highlights/
At least Teilhard de Chardin had a solid theological background.
As Willard thinks that min to max does not define a range….
https://cornwallalliance.org/2019/02/shame-on-scientific-american-and-ee-news-for-lying-about-john-christy/
Sure.
As Willard thinks that min to max over a single time period does not define a range.
Just to keep him happy.
And so Richard believes that peak to peak is the same as min and max…
And yes indeed:
https://www.scientificamerican.com/article/scientist-who-rejects-warming-is-named-to-epa-advisory-board/
Unlike Richard, at least JC dropped all pretense regarding his Climateball contributions.
No-one but Willard thinks that min and max refers to time periods next to each other rather than the same one.
Willard obviously did not notice
https://cornwallalliance.org/2019/02/shame-on-scientific-american-and-ee-news-for-lying-about-john-christy/
No one, absolutely no one:
https://en.wikipedia.org/wiki/Open-high-low-close_chart
Obviously Richard did not notice:
https://www.scientificamerican.com/article/scientist-who-rejects-warming-is-named-to-epa-advisory-board/
So ‘ad hom’ is all that Willard has got. How about refuting the science?
“No one”
What has the market to do with climate?
“The truthwhich E&E News and SA undoubtedly know, is that John Christy most certainly doesn’t ‘reject warming.’ He manages the NASA satellite data that are our best source for truly global, all-latitudes, all-longitudes, all-altitudes atmospheric temperature, and he openly reports that warming has indeed happened. He also accepts that human action has contributed to that warming, perhaps being the primary cause, though he thinks natural causes probably outweigh it. He denies that human action is the sole cause and that the warming from human action is known to be dangerous to catastrophicand that curbing warming is more cost-effective than adapting to it.
It’s one thing to disagree with someone’s scientific opinion. It’s another to lie about it.”
You said that No-one but me thinks that min and max refers to time periods next to each other rather than etc.
Srsly, Richard. Think that one through. What you just said makes no sense whatsoever.
Min and max are relative to a time frame. They will vary depending on the resolution to view them.
In statistics, a peak refers to a high point in a graph. It is related to the mode you keep barking about.
These are not the same things at all.
So Richard only has whining when JC’s authority is challenged.
When we talk about min and max in a day, it is just during THAT day.
Likewise for a week/month and longer.
In any case there will still be a trend. Thus the daytime peak temperature will get hotter towards middle of the summer in the year and colder towards the middle of winter. Idiot.
So Willard relies on lies and untruths to make his points.
If you want to talk about days, then pick a representation that picks days, dummy.
[RICHARD] When we talk about min and max in a day, it is just during THAT day.
[ALSO RICHARD] the meaning of the trend of the upper edge of a range in peak to peak data.
Willard, please stop trolling.
Willard thinks that by proposing different days for the peaks changes anything other than the fact he is an idiot. It doesn’t.
Blinny: Sorted out the difference between a time series and a distribution yet?
Oh! Again a dog poo from the little opinionated stalker!
So you haven’t sorted out the difference yet then.
I don’t need to sort out anything, Linsley Hood.
You need to prove this wrong:
https://drive.google.com/file/d/1MZlIa_a-SKRxA72v1UOB7HrNpEr9EGqO/view
and this:
https://drive.google.com/file/d/1BhgrAn-eVrX9JZUhr_y4ceVWAKsXtqml/view
and this:
https://drive.google.com/file/d/1_F00TcPvlRBk4NQ8GR_Q6cdhUtQ4CUIQ/view
but you will never be able to do that work.
You need to acknowledge that a time series is different to a distribution.
You also need to acknowledge that a sinusoidal time series will produce a bimodal distribution. Look it up.
Bimodal Distribution
“Two peaks {in a distribution} could also indicate your data is sinusoidal”
Stop blathering, Linsley Hood, and start working.
Start reading Blinny.
And acknowledging your mistakes.
Sorry: no mistakes were made.
You are the one who insinuates I did, without being able to prove it.
And to get it clear for the umpteenth time: this arrogant, teachy blah blah
” 2010/11/16 CRND0103-2010-AK_Kenai_29_ENE
Daily Average = -6.70 Count = 1
Hourly Average = -6.76 Count = 24
SubHourly Average = -6.74 Count = 288
Notice how Hourly rounds up but SubHourly down at 1 digit of precision? ”
is absolutely irrelevant, does not prove anything, and you perfectly know that.
And for this reason, I still await your technical proof that the monthly averages of middle, median and mean values out of USCRN hourly versus subhourly data for all active CONUS+AK stations differ by more than 0.005 C.
I wait for your three time series (for the period: Jan 2002 till Jun 2021), generated
– considering only days with complete hourly data;
– generated with three digits after the decimal point.
And I guess I can wait and wait and wait…
“Sorry: no mistakes were made”
So your bar graph presentation of a time series is not a distribution as you claimed.
Bindidon, when you fail to understand such simple analogies as a ball-on-a-string, or a bicycle pedal, that should tell you something about your ability to think.
But, of course, you’re unable to think. You’re a braindead cult idiot.
There are even people here that believe ice cubes can boil water, so you’re not alone….
Exactly, Clint R, exactly!
MODTRAN (U Chicago) has a toggle to look either down or up
http://climatemodels.uchicago.edu/modtran/
MODTRAN6 (Spectral.com) appears to only look down.
http://modtran.spectral.com/modtran_home#plot
Previously way above, E Swanson wrote the following, “[DREMT], Your calculation starts by assuming plate temperatures, then calculates the Sun plate’s emissions, which is reasonable. However, you still insist that it’s correct to force the Sun plate to have a fixed temperature while emitting at a fixed rate while facing the BP with a fixed temperature [290K].
Sorry troll, physics doesnt work that way.”
https://www.drroyspencer.com/2022/06/uah-global-temperature-update-for-may-2022-0-17-deg-c/#comment-1321035
ES, it seems you are alleging that a heat source, such as the infinite sun plate, cannot maintain a constant temperature when an object is placed near the radiating end of the sun plate. You seem to suggest that the object would require return radiation forcing a temperature rise in the sun plate.
Suppose the object had been previously heated to the same 290K as the sun plate and placed adjacent to the sun plate, either in direct contact or even separated by a trivial distance. How would the physics work in that case?
CB, the sun plate and BP in grammie pup’s model are specified to be 2 infinite parallel plates. Your question is just grammie’s BS about starting with the BP and GP in close contact, therefore they have the same temperature for a given power input. Separate the two and they will initially have the same temperature, but the GP will eventually cool to a lower temperature while the BP will warm because of the back radiation.
Same old story, different version.
A GP/BP isn’t the setup I was referring to. In the long thread above, there is a version (#1, I think) where the source is a semi-infinitely long Sun plate powered by 800 W/m2 so that each end radiates 400 W/m2. I think the plate materials are understood to be perfect conductors so that there are no gradients in the plates along the direction perpendicular to the plate’s planes. Although I think this is impossible and probably a source of confusion, let’s assume that is the case.
Now the example I started with was an added plate at the same 290K and I see no reason for a perfect conductor to lose any temperature when space remains between it and its source at the same temperature. The 400 W/m2 will continue to flow out the sink side.
Let’s take another scenario where the added plate is initially 0 K. Again, with perfect conductors, the temperature of the added plate goes to the temperature of the sun plate immediately and this becomes the same case as if the added plate started out at 290K.
If your argument is that the added plate will be at some temperature lower than 290K, but one that increases the sun plate’s temperature, what temperature would the sun plate go to?
ES,
Sorry the setup is “2) Infinite parallel plate source Sun = BP at 290 K, emitting 400 W/m^2.” It differs from 1) because the source is psuedo-infinite compared to a point source. The distinction is crucial.
So, what new temperature would the BP Sun plate come to?
Willard Jr believes “Separate the two and they will initially have the same temperature, but the GP will eventually cool to a lower temperature while the BP will warm because of the back radiation.”
That’s wrong, Junior. The plates are black bodies. The GP will absorb everything it receives. It reflects nothing. The photons it emits back to the BP will be trapped in a “standing wave”, as energy can NOT move against a higher potential by itself. Fish can NOT float upstream. They have to exert work to move against the flow. The GP will be the same temperature as the BP, just as if they were still attached.
You don’t understand any of this.
Wrong and humorous Clint. Understand photons are not fish. Photons travel the gap both ways as EMR.
Tell us again how ice cubes can boil water, troll4. Along with identifying Earth’s “real 255K surface”.
You don’t understand ANY of this.
Ball4
Understand photons are not fish. Photons travel the gap both ways as EMR.
—————————
Photons are bat signals from Al Gore, so all pf you jumped into action. The only thing you need to know is photons slow the progress of energy through a number of surfaces. But they never warm any surface along the way more so than an equilibrium with the power of the radiant field received from the warm rock. You guys were shown a cartoon from Al Gore and you all went nuts.
Clint R looks into his bag of spaghetti box and finds the standing wave, too bad he didn’t quite think it through.
Looks like he developed an infinite energy storage device.
That doesn’t work.
Nice try braindead bob, but a standing wave is a real phenomenon. Your made-up “infinite energy storage device” is not.
CLint R,
I didn’t say a standing wave was an infinite storage device.
But your standing wave has a constant input of energy with no output of energy, so it will keep storing energy.
You still failed to think it through.
Wrong bob. You’re saying a standing wave keeps storing energy. That’s NOT how it works.
You don’t understand any of this, and can’t learn. You’re braindead.
CLint R
As usual, you are wrong when you say a standing wave can’t store energy.
Pondering a guitar string might help, but
It’s your claim
“Youre saying a standing wave keeps storing energy. Thats NOT how it works.
You are claiming a standing wave keeps storing energy, it follows directly from your claim that a standing wave is caused by the blue plate rejecting the energy from the green plate.
You are also violating the first law of thermodynamics as well.
bobdroege says:
Clint R looks into his bag of spaghetti box and finds the standing wave, too bad he didnt quite think it through.
—————————–
The pot calls the kettle black. LMAO!
So another cooking vessel chimes in, not knowing he doesn’t know any of the physics involved, but thinks he has something to offer to the conversation.
bobdroege, please stop trolling.
bob, please stop trolling.
SuperTripleDeveloping La Nina effect – Bangladesh edition
https://youtu.be/5zhNZsHAkbQ
SuperTripleDeveloping La Nina effect French edition
https://youtu.be/MZlwpA9BxO4
John Christys observations on AGW.
https://www.youtube.com/watch?v=XltFOh7Cg2U&lc=
” So you agree that AGW does not apply to the central Pacific so presumably in order to compensate it must be much larger towards the Poles somewhere. ”
Linear estimates for HadISST1 SST, in C/decade
– within the NINO3+4 region (5N-5S, 170W-120W):
– since 1871: +0.02 +- 0.001
– since 1951: +0.03 +- 0.001
– since 1981: -0.03 +- 0.003
– within the Tropics (30N-30S)
– since 1871: +0.04 +- 0.001
– since 1951: +0.08 +- 0.001
– since 1981: +0.09 +- 0.001
No need to include the Poles to see the evidence that a tiny bit of the Tropics of course is a part of the Tropics but does not necessarily behave like the Tropics.
Only stubborn and dishonest denialists can misinterpret and misrepresent such evidence.
You keep using that word “AGW” it doesn’t mean what you think it means
https://youtu.be/G2y8Sx4B2Sk
Ebabbly, you slowly but surely behave like an Edog.
It looks like you still didn’t manage to grasp that when a sentence in a comment is enclosed in quotation marks, the sentence is not the opinion of the person who wrote the comment, but is a reply to another person having originally written that same sentence.
Thus, go to the original comment I quoted, and tell the comment’s editor
” You keep using that word AGW it doesnt mean what you think it means”
and leave me in peace.
No you scumbag, You keep insisting any warming = AGW , while John Christy points out that AGW models predict specific region stronger warming and it is not there
Ebabbly, you slowly but surely behave like an Edog.
” You keep insisting any warming = AGW ”
Show me where I wrote that.
And, concerning your ‘scumbag’… look at yourself before insulting others.
Blinny insults most people all of the time.
The scumbag conviniently forgot he is the one who startet the whole thing with me, now go cry to your Mutti Bindiboy
> You keep insisting any warming = AGW
Read the abreviation again, Eboy.
Slowly.
Any warming is different to Anthropogenic global warming which is only part of it.
they would not call it AGW if GW was enough, dummy
Tell me the difference between ‘climate change’ and ‘changing climate’.
Look for the Luntz memo, Richard. Now, tell me –
You do realize that natural variability had a cooling effect over the last 60 years, which means that the A in AGW is at least 100, right?
You really ought to leave But ABC to cranks:
https://climateball.net/but-abc#natural
“You do realize that natural variability had a cooling effect over the last 60 years”
According to the IPCC natural variability is not enough to affect climate in any significant fashion.
The Luntz memo is USA right wing politics.
Here, dummy:
https://climateball.net/but-word-change/
> the IPCC
A quote would be nice.
See the right hand chart from the IPCC. Look at the ‘natural only’ line. Everything bad is caused by humans. Apparently.
https://www.climate-kic.org/wp-content/uploads/2021/08/IPCC.png
The Luntz memo is still USA politics.
Your politics are showing too, Richard.
Also, compare and contrast:
[RICHARD] According to the IPCC natural variability is not enough to affect climate in any significant fashion.
[ALSO RICHARD] Everything bad is caused by humans. Apparently.
You can’t even get your lies straight two comments in a row.
Whereas your beloved IPCC is SO accurate. Not.
https://www.drroyspencer.com/2022/06/uah-global-temperature-update-for-may-2022-0-17-deg-c/#comment-1323858
1) According to the IPCC natural variability is not enough to affect climate in any significant fashion.
2) Everything bad is caused by humans. Apparently.
How are those 2 in opposition?
That string of comments does not support your claims, dummy.
> How are those 2 in opposition?
Which part of “compare and contrast” you do not get?
If you want to double down, you need to repeat the claim previously made, not make another independent one.
Which part of
‘a near horizontal line shows that there is little to no impact on climate’
did you not get?
If that horizontal line sufficed to establish impacts, Richard, the IPCC would not need to write another whole chapter on impacts.
But the part I really do not get is why you would think that the IPCC would say that only temperatures can have an impact on things.
It is as if you have never really studied the impact lichurchur, like, at all.
See what John Cristy thinks of your (and the IPCCs) observations above.
“a tiny bit of the Tropics of course is a part of the Tropics but does not necessarily behave like the Tropics”
because the Tropics (as defined) contain much higher latitudes than +-5 degrees of Nino 3.4.
… and that is exactly what I wanted to show you, namely that
– putting ‘no warming’ within a few tropical grid cells in relation with AGW
is exactly as dumb as
– putting the ‘ball-on-a-string’ in relation with Moon’s spin.
Linsley Hood wrt climate =!= Clint R wrt Moon’s motion
So you agree that AGW does not apply at the equator in the center of the Pacific basin at least.
And, no, that observation is not the same as a ball-on-string/a rod-about-one-end/a section-of a-disc.
“So you agree that AGW does not apply at the equator in the center of the Pacific basin at least. ”
When will you stop talking about such dumb, irrelevant evidence?
Why don’t you talk about AGW not applying at thousands other little corners all around the world?
In what do these non-warming corners differ from Nino3+4?
You are a troll, exactly like are Robertson, Clint R, Ebabbly and a few others.
Because we were talking about Nino 3.4 which is only for the Equator and the center of the Pacific ocean.
Bliiny: Can you find another geographical area that is of the same size and has the same disparity to AWG?
….same disparity to AGW….
Bindidon says:
within the Tropics (30N-30S)
where do you get that definition of the tropics?
The tropics are between the Tropic of Cancer and Capricorn. Or just under 23.5degrees latituded north and south.
There are those who use 30N to 30S as a definition of the ‘Tropics’.
This obviously is larger than the true 23.5 degrees latitudes but it has the convenience of being 50% of the Earth’s surface.
e.g.
https://www.researchgate.net/figure/Tropical-30S-30N-temperature-trend-versus-height-and-its-sensitivity-to-method-changes_fig2_276462244
and
https://www.researchgate.net/figure/Annual-tropical-30S-30N-land-average-climate-parameters-in-the-control-and_tbl1_253216812
Not least of which
https://bit.ly/3ydt5Q3
And
“The UM CCI provides monthly estimates of global temperature by latitude zones, including the non-overlapping Arctic (60N-90N), Northern Hemisphere middle latitudes (30N-60N), Tropics (30N-30S), Southern Hemisphere middle latitudes (30S-60S), and Antarctic (60S-90S)”
Bill Hunter
You are absolutely right. This 30N-30S is sheer nonsense, no idea where I got that from.
In fact I thought about 20N-20S like in UAH.
Generating anew out of HadISST1 SST with 20N-20S gives
– the same trends for 1871-now and 1951-now
– 0.08 C / decade instead of 0.09 since 1979 (this is somewhat less than UAH’s ocean mask in the Tropics: 0.11).
*
Thanks for correcting me, much appreciated.
As opposed to some others, I always admit my mistakes… when they exist.
30N to 30S is considered by a lot of people as being the ‘Tropics’
https://www.drroyspencer.com/2022/06/uah-global-temperature-update-for-may-2022-0-17-deg-c/?replytocom=1321901#respond
Sorry Bindidon but you dont “always admit” your mistakes. You believe the ball-on-a-string is a model of Moon’s motion. You can’t understand it is only a model of “orbital motion, without axial rotation”. Moon has a slightly elliptical orbit. This has been explained to you repeatedly, but you can’t understand it. You’re braindead.
Exactly, Clint R, exactly!
Keep agreeing with me, Bindidon. That’s a good way to appear smart.
Of course we know appearances can often be misleading….
“I always admit my mistakes when they exist”
So you admit that a time series (even as a bar graph) is not a distribution or a histogram.
When you google for ‘Tropical 30S30N temperature’ you’ll find a considerable amount of uses of this latitude band.
I suppose it’s due to the idea that it is best to subdivide the Hemispheres in three allegedly ‘equal’ parts – which of course aren’t, due to Earth’s sphericity.
To make it a bit less clear for us all, RSS uses something in between, namely 25N-25S:
https://images.remss.com/msu/msu_time_series.html
what makes it nearly impossible to obtain any credible comparison of UAH, RSS and radiosondes unless you have their grid data.
30N to 30S is considered by many as being the Tropics.
https://www.drroyspencer.com/2022/06/uah-global-temperature-update-for-may-2022-0-17-deg-c/#comment-1321901
“I suppose it’s due to the idea that it is best to subdivide the Hemispheres in three allegedly ‘equal’ parts”
Wrong as usual. 30N to 30S is 50% of the Earth’s surface.
1. ” allegedly ‘equal’ ”
2. ” Wrong as usual. ”
Hmmh.
Someone wrote faster than read here.
But… don’t forget: he is never wrong.
*
Slowly but surely, I begin to understand the reason why ‘06470131’ was dissolved.
Stubbornness, incompetence, submissiveness… just like today.
As the claim by most people (and there are a lot of them) is that 50% of the Earth’s surface is the predominant reason why 30S-30N is chosen….
Mind you it could be Blinny’s invented ‘roughly a third of each hemisphere’ that no-one but him thinks might be the reason instead.
Here you can observe the level of Linsley Hood’s dishonesty:
” Mind you it could be Blinny’s invented ‘roughly a third of each hemisphere’ ”
Nowhere did I write that.
I wrote
” I suppose it’s due to the idea that it is best to subdivide the Hemispheres in three allegedly ‘equal’ parts which of course aren’t, due to Earth’s sphericity. ”
*
What Linsley Hood doesn’t tell us here is that some time ago, he was brazen enough to propose applying a cosine factor to measured temperatures, in order to take account for Earth’s sphericity, therefore making the latitudinal temperature distribution similar to his so much loved Mollweide projection, what is utterly wrong.
Here’s the difference, for UAH 6.0 LT, between correctly accounting for Earth’s sphericity and Linsley Hood’s completely wrong suggestion:
https://i.postimg.cc/5tyCXYdB/UAH-globe-orig-vs-simple-cosine-weighting.png
Correct: 0.13 C / decade
Linsley Hood’s ignorance of facts: 0.09 C /decade
*
No wonder that a man, behaving like he does on this blog all the time, was a 100 % failure as ‘director’ of a microscopic UK firm a decade ago.
“I suppose it’s due to the idea that it is best to subdivide the Hemispheres in three allegedly ‘equal’ parts”
is not the same at all as
“Mind you it could be Blinny’s invented ‘roughly a third of each hemisphere'”.
According to Blinny that is.
Of course it is all down the the fact that 30S to 30N is 50% of the Earth’s surface as I said.
“much loved Mollweide projection, what is utterly wrong”
Mollweide is an equal area projection. Something that Blinny seems to have a problem with.
Blinny: Sorted out the differences between a time series and a distribution yet?
All because I approved of using this layout in latitude for a North/South cross section
https://imgur.com/gallery/QiqldXV
Linsley Hood manifestly persists in misrepresenting what I wrote, and hence shows again the level of his dishonesty.
A level perfectly shown by
” Blinny: Sorted out the differences between a time series and a distribution yet? ”
This has been discussed many times above and in previous threads; I won’t replicate it.
” Are you saying that… ”
” So you reckon that… ”
” Sorted out… ”
All the same blah blah all the time.
*
And finally, the summum of his dishonesty is shown by the trial to let people think I would dispute the EVIDENT correctness of
https://imgur.com/gallery/QiqldXV
which has NOTHING in common with his dumb mollweiding of temperature measurements.
You accept the latitude layout when it comes from someone you respect but do not accept the same latitude layout when it comes from little old me.
Blinny: Still not sorted out the differences between a time series and a distribution yet?
ENSO 101
https://youtu.be/VWGzFr1t0Lk
John Christy’s observations on AGW.
https://www.youtube.com/watch?v=XltFOh7Cg2U&lc=
Finally The climate shysters discovered global warming causes more La Ninas , They predicted more El Ninos first, but when they see more La Ninas instead, they predict those now, how convinient
https://youtu.be/v89UUHlAYjg
German science on AGW
Human CO2 Emissions Responsible For 0.05C Of The Global Warming Since 1750
https://bit.ly/3tVJshg
“Opinion on the Draft Law”
I suppose it’s progress if we compare to the previous Climateball round:
https://andthentheresphysics.wordpress.com/2017/10/03/a-harde-response/
It seems that Ebabbly can’t make the difference between two faces of one and the same person:
1. Biography, active life:
1966-1970 studies with focus on atomic and laser physics at the Technical University Hannover.
1971-1974 scientific assistant and PhD at University of Kaiserslautern.
1975 Professor for Laser-Engineering
1982 Professor for Laser-Engineering and Materials Science at the Helmut-Schmidt-University Hamburg.
1990 and 1992 Visiting Scientist at IBM Watson-Research Center, Yorktown Heights, New York
1995 and 1996 Visiting Scientist at Oklahoma State University, Stillwater, Oklahoma
1995 – 1997 Dean of School of Electrical Engineering, Helmut-Schmidt-University, Hamburg
1997 – 1999 Vice-President of Helmut-Schmidt-University, Hamburg
2000 Professor for Experimental Physics & Materials Science at Helmut-Schmidt-University Hamburg
2010 retired
Best link to look at what he did professionally:
https://spie.org/profile/Hermann.Harde-7562?SSO=1
*
2. As a retired person
Since 2010 he is an active collaborator of EIKE, Germany’s top Hardliner society and Internet blog wrt Climate Skepticism.
Best link to his present activity:
https://www.bol.com/nl/nl/p/was-tragt-co2-wirklich-zur-globalen-erwarmung-bei/9200000034213275/
*
{ In 2008, EIKE published harsh reviews of Gerlich and Tscheuchner’s incredibly superficial anti GHE paper, clarifying that A.P. Smith’s response to their paper was absolutely correct.
But… that was a long time ago, because such voices are now 100 % suppressed at EIKE. }
Bindiscums bag of ad hominems broke open
” … ad hominems … ”
Where did you see adhoms coming from my side?
I see only yours:
” Bindiscums…
Blinny: Sorted out the differences between a times series and a distribution yet? Or is that just something that you do not acknowledge?
See all my replies to your incredibly dumb question.
What that you do not acknowledge that you were wrong.
I’m a first timer here. Just wondering if I can borrow a little expertise. I ran into an argument for anthropogenic warming that I haven’t seen before. Seems convincing, but I’m the cautious type. I guess I’m asking if anyone can poke some holes into it.
The IPCC in 1990 predicted a 0.2 – 0.5 degree rise in average global temperature by 2025, depending on several variables.
https://www.ipcc.ch/site/assets/uploads/2018/05/ipcc_90_92_assessments_far_wg_I_spm.pdf (page1)
According to the NOAA, it’s risen by about 6 degrees as of 2020. Not spot on, but still within the 1990 guesstimate.
https://www.climate.gov/news-features/understanding-climate/climate-change-global-temperature
The argument is that in 1990, the IPCC was forecasting an Earth that they believed would be warmer than at any point in the past 2,000 years or more. Pretty gutsy – and it appears to have come to pass so far as I can tell. If true, this gives them huge credibility. Am I missing something?
https://www.science.org.au/learning/general-audience/science-climate-change/2-how-has-climate-changed#:~:text=The%20average%20surface%20temperatures%20over,Australia%20have%20occurred%20since%202002. (First set of graphs)
Rincon, Earth has NOT “risen by about 6 degrees” since 1990. I’m not sure where you saw that.
UAH shows an small increase over the last 40 years, which is believable. But a short term warming trend does not “prove” CO2 is the cause. In fact, people that understand the physics know CO2 can not heat the planet.
C’mon, Pup.
Can’t you recognize JAQing off anymore?
Willard, please stop trolling.
If you think there are some real climate whackos in here then watch this one
https://youtu.be/ib6CzbOMYHI
Sky Dragon Cranks are not alone:
https://www.nature.com/articles/s41598-021-01714-4
Blinny has problems with using this type of layout in latitude for a North/South cross section
https://imgur.com/gallery/QiqldXV
And finally, the summum of his dishonesty is shown by the trial to let people think I would dispute the EVIDENT correctness of
https://imgur.com/gallery/QiqldXV
which has NOTHING in common with his dumb mollweiding of temperature measurements.
Linsley Hood, your are a liar and a simple-minded polemicist, like are Robertson, Clint R, Swenson etc.
Bindidon, if you can’t tell the truth, does it do you any good to call others “liars”?
Maybe you should clean up your act before you start falsely accusing others.
Don ‘t forget that you name not only me, but also Linsley Hood aka RLH a ‘braindead cult idiot’ when he tells you that the Moon rotates about its polar axis.
Correct Bindidon. When you accept the cult beliefs, without question, you’re a “cult idiot”. And if you refuse to accept reality, you’re “braindead”.
So since you accept centuries-old astrology, without question, and you reject simple analogies like a simple bicycle pedal, then you’re a braindead cult idiot.
I don’t expect anything to change.
A ball-on-a-string is the same as a stick-rotating-about-one-end is the same as a section-of-a-disk.
None of them are really useful in describing real orbits which involve barycenter’s rather than simple axis.
RLH, braindead cult idiots are not known for their honesty. They are known for perverting reality to the point of even saying things that are demonstrably untrue. Are you ready for an “honesty test”?
Is the model of a ball-on-a-string used for teaching about orbital motion? Yes or No.
Hint: Remember the links I provided of colleges and univrerstites using the model.
(I predict RLH can’t answer honestly.)
A ball-on-a-string is the same as a stick-rotating-about-one-end is the same as a section-of-a-disk.
RLH relies on an arbitrary distinction.
The main problem comes from the fact that an object rotating on an external axis has an angular momentum equal to Lorb+Lspin, to which spinners arbitrarily steal the Lspin and claim it is rotating on its own axis (only because it is calculated in the same way) and then ignores that Lorb isn’t an angular momentum at all but instead is a linear momentum.
“RLH relies on an arbitrary distinction”
No he doesn’t. the three ‘models’ that I show are indeed exactly the same as each other.
“an object rotating on an external axis”
No solid object can rotate physically about an external axis. All rotational axis are internal to the whole body.
RLH says:
No solid object can rotate physically about an external axis. All rotational axis are internal to the whole body.
—————————-
You are in direct conflict with:
http://hyperphysics.phy-astr.gsu.edu/hbase/amom.html#amp
and
https://www.mvsrec.edu.in/images/dynamicsofrigidbodies.pdf
Do you have any support for your assertion that there is no angular momentum associated with the moon going around the earth?
“The Earth moves in two different ways. Earth orbits the sun once a year and rotates on its axis once a day”
Orbits and rotation are 2 separate things.
The Moon – Earth – Sun trio are NOT connected as rigid bodies, but bodies held together by gravity. That is something completely different and requires different physics to describe it.
RLH says:
The Moon Earth Sun trio are NOT connected as rigid bodies, but bodies held together by gravity. That is something completely different and requires different physics to describe it.
————————-
An orbit is a rotation RLH. The link I gave you is in the chapter of describing rotations.
Additionally, this link describes what spinners see as a separate rotation and an orbit as a curvilinear translation which is not a rotation at all. It is the first listed example of the application of kinematics. With a car rotating on an external axis while the orientation of the car does not change.
https://courses.washington.edu/engr100/me230/week6.pdf
“An orbit is a rotation”
They are well acknowledge to be 2 separate things.
https://www.generationgenius.com/earth-rotation-and-orbit/
Your ref talks about rigid-body planar motions.
The Moon – Earth – Sun trio is NOT a rigid body.
RLH says:
They are well acknowledge to be 2 separate things.
————————-
No an orbit is a rotation. A rotation might be an orbit.
http://hyperphysics.phy-astr.gsu.edu/hbase/amom.html#amp
This is an example given by the source as a rotational motion.
It has an angular momentum equal to an indivisible angular momentum on a single axis.
—————-
—————-
—————-
RLH says:
June 26, 2022 at 4:08 PM
Your ref talks about rigid-body planar motions.
The Moon Earth Sun trio is NOT a rigid body.
——————-
RLH, the moon orbits the earth COG. The earth has a separate rotation around its own COG. They aren’t supposed to be one rigid body.
Wang is talking about a rigid body rotating around a fixed axis. There is no implication that the fixed axis must be part of the rigid body. A ball on a string isn’t a single rigid body either. A string is not in anyway considered to be rigid either.
“then ignores that Lorb isnt an angular momentum at all but instead is a linear momentum.”
More good stuff for the Science Deniers Say the Darndest Things reality show.
Nate clearly demonstrates for the umpteenth time that he has no arguments, no sources, and no mathematics to back up his assertions.
But using that same latitude layout is what got you SO cross.
https://www.drroyspencer.com/2022/04/uah-global-temperature-update-for-march-2022-0-15-deg-c/#comment-1234278
Proof.
And here is the graph that I got Willis to post that uses the same latitude layout and got Blinny SO cross.
https://climatedatablog.wordpress.com/2021/12/30/distribution-of-decaled-trends-by-latitude-from-berkley-earth/
Going to own up now Blinny?
“Area weighted incoming and outgoing energy”
Did you get the Area weighted bit?
The same as Mollweide is area weighted as well.
John Christy’s 2021 audit of climate model accuracy
https://youtu.be/27spP9QVLrU
On JC’s Climateball:
https://www.realclimate.org/index.php/archives/2016/05/comparing-models-to-the-satellite-datasets/
“regarding those feedback processes when we see that the atmospheric column warms up by a degree models send out only 1.4 watts the real earth sends out 2.6 watts that’s a very strong negative feedback in other words it’s real hard for the global atmosphere the real atmosphere to get much hotter than it is because it sheds so much heat whereas in the models they trap heat they trap more heat than the real world does and so that’s how their temperature can continue to rise over time”
Look, measuring temperatures from satellites flying high above Earth is hard. No one doubts that. But lets not be deluded into thinking these satellites are more accurate than thermometers (as some people suggest). Lets also not blindly accept low-ball warming information from research teams that have long histories of revising their data. I created the image below a few years ago to show the upward revisions made by the Christy/Spencer team over time in their global troposphere temperatures.
Stupid paresser that eats English quotes.
“But lets not be deluded into thinking these satellites are more accurate than thermometers (as some people suggest)”
We have accurate thermometers in less than 30% of the Earth’s surface and they resided in the SBL/PBL, that is the lowest layer of the atmosphere. No matter how accurate they are, the SBL/PBL varies in as little as a km so there will never be enough of them tp provide an accurate Global picture.
The other 70% in the oceans and it is sampled at even lower frequency than the land. The SBL/PBL exists there too, though it is much thinner.
At least the satellites cover a solid volume on a repeatable basis so are more likely to be accurate over the volume that they cover. Sure they are above the SBL/PBL and so will not give the same figure as the thermometers inside it but they can measure the far greater volume that is above much better than the estimation/extrapolation that 2m thermometers do.
….them to provide an accurate….
And to provide a better estimate what the temperatures ‘should’ be higher up in the atmosphere above 2m, much reliance is placed on the models. They have proven very wrong in the past about what they think already happened in the Tropics at about thirty to forty thousand feet or ten to twelve kilometers. They predicted a very strong hot response that simply did not occur.
[RICHARD] At least the satellites cover a solid volume on a repeatable basis so are more likely to be accurate over the volume that they cover.
[ALSO RICHARD] And to provide a better estimate what the temperatures “should” be higher up in the atmosphere above 2m, much reliance is placed on the models.
The later is how 2m thermometers are stretched to thirty to forty thousand feet or ten to twelve kilometers above the surface. It has nothing to do with satellites and how they measure things.
It rather shows that your standards of evidence are far from being consistent.
RLH,
First of all meteorology measures lots of things besides 2 m Temps. They measure barometric pressure, humidity, send radiosonde balloons to measure troposphere properties, use satellites to measure cloud cover and ocean surface T, radar to measure precipitation.
They merely need to SAMPLE these properties at sufficient density in order to use them in numerical weather models to create reanalysis data, which can give T, P, RH all over the globe and at various altitudes.
If you believe these efforts are flawed and producing a systematic bias, its not enough to just hand wave, you have to show us evidence.
Whereas with satellite troposphere T, there are at least 3 different analyses of the data producing systematically very different T trends. These analyses have needed significant revisions over time. Thus we have evidence that the problems with these measurements are significant and not yet understood.
Do you have ANY knowledge of the PBL/SBL and its changing behavior over 24 hours? Its differences over just a few km horizontally? The differences between it and the ‘free atmosphere’ above?
How the UAH lowballing evolved over time is a thing of beauty:
https://imgur.com/gallery/fNT3FgY
“you have to show us evidence”
See the paired USCRN station stations that are only a few km apart for the sort of differences that can arise between even very well thought out ground measurement points.
“UAH lowballing”
What has that to do with PBL/SBL?
It has something to do with that comment, Richard:
https://www.drroyspencer.com/2022/06/uah-global-temperature-update-for-may-2022-0-17-deg-c/#comment-1323191
You know, the comment to which you responded?
Yes, that one.
Willard says:
It rather shows that your standards of evidence are far from being consistent.
——————
Willard the pot once again calling the kettle black.
Holy tu quoque, Batman!
You won’t find me stating opinion as fact. If I err as humans do, point it out explicitly and I will correct myself. Asking for evidence is nothing to be ashamed of in the face of a bunch of know it alls who feel they don’t need evidence.
There’s a difference between asking for evidence and sealioning, Bill.
For instance, asking for evidence about a thought experiment that rests on analytic statements is pure sealioning.
“It has something to do with that comment”
What that satellites are less accurate than thermometers. IYHO of course.
No, dummy – that your whole stance verges toward irrational contrarianism.
To a warmista such as you, anything that is not continuous warming is not correct.
How is your lies about the IPCC relevant to your butchering of basic sense of proportion, dummy?
These are not lies, they are the truth that you cannot handle.
Like seasonality increases as you get towards the poles but that is never presented in IPCC documents. Instead anomality’s are used as the do not show the whole picture, just part of it.
Nowhere in the IPCC documentation AFAIK does it mention the SBL/BPL and the problems that come from measuring within it.
….as they do not show….
https://www.drroyspencer.com/2022/06/uah-global-temperature-update-for-may-2022-0-17-deg-c/#comment-1323858
> they are the truth
Then provide quotes where the IPCC says that “According to the IPCC natural variability is not enough to affect climate in any significant fashion” or that “everything bad is caused by humans.”
But perhaps you think that your “apparently” was enough plausible deniability to cover for peddling common contrarian crap?
I provided an image straight from the IPCC. Is that not enough for you?
Here it is again (right hand image)
https://www.ipcc.ch/report/ar6/wg1/static/77a100efc31fb024aee934abb2917576/3fb45/IPCC_AR6_WGI_SPM_Figure_1.webp
Willard says:
Then provide quotes where the IPCC says that According to the IPCC natural variability is not enough to affect climate in any significant fashion or that everything bad is caused by humans.
But perhaps you think that your apparently was enough plausible deniability to cover for peddling common contrarian crap?
—————————–
Willard buys hook line and sinker into the artificial narrative.
The statement based upon selective ignorance of the facts. Younger Dryas event shows natural climate change of an order of magnitude greater than the current anomaly in the ice core GISP2 and we are regaled by Willards Daddies that we can be assured that natural variability is not enough to affect climate in any significant fashion. LMAO!!! A sucker is born every day.
https://cdn.britannica.com/18/112518-050-90A109F1/event-Younger-Dryas-temperature-drop-regions-addition.jpg
Bill, Bill, why are you insisting to become the butt of the joke?
Here is a perfect moment to remind you of what auditors are meant to do. You should be asking for receipts right now!
Do you have any evidence that the IPCC says what Richard makes it say?
No, you don’t.
> I provided an image straight from the IPCC.
Not really, Richard.
Ask Bill about the standards auditors require for receipts.
So https://www.ipcc.ch is not the IPCC. Must be news for them.
And the IPCC did not create the AR6 report from which that image is drawn. Idiot.
Compare and contrast:
[RICHARD SAYS] According to the IPCC natural variability is not enough to affect climate in any significant fashion, and everything bad is caused by humans.
[THE IPCC SAYS] Change in global temperature (annual average) as observed and simulated using human and natural & only natural factors (both 1850-2020)
Notice any difference, or do you need me to spell it out of you, dummy?
https://www.ipcc.ch/report/ar6/wg1/static/77a100efc31fb024aee934abb2917576/3fb45/IPCC_AR6_WGI_SPM_Figure_1.webp (right hand image)
Says that humans are the cause of the difference between IPCC modeled ‘natural’ factors and the observed temperatures. Only humans. Nothing else.
Do you need me to spell THAT out for you?
I know, Richard.
Hence why you’re wrong.
https://www.drroyspencer.com/2022/06/uah-global-temperature-update-for-may-2022-0-17-deg-c/#comment-1324125
Hence why you are an idiot.
That attribution graph does not say anything about impact, dummy.
And it does not say there’s no natural variability or that it has no impact.
You really are a Black Knight!
“And it does not say theres no natural variability or that it has no impact.”
So the near horizontal line does not say that there is no significant impact on climate.
And the steeply climbing one does not say that humans are totally to blame.
> So the near horizontal line does not say that there is no significant impact on climate.
The graph says nothing about impact, dummy.
Another chapter. Other kinds of models.
Have you ever read the damn report?
“The graph says nothing about impact”
Sure. Idiot.
Here, Black Knight:
https://www.ipcc.ch/report/sixth-assessment-report-working-group-ii/
You really are dumb.
Willard says:
Bill, Bill, why are you insisting to become the butt of the joke?
——————————–
Would that be the same butt you got your tongue stuck in?
See, Bill?
That is a Freudian projection!
Factchecking Facebook’s Climate Science Centre
https://youtu.be/zd5FmexLEmo
Michelle is quite long on coal:
https://www.desmog.com/2016/06/20/canadian-climate-denial-group-friends-science-named-creditor-coal-giant-s-bankruptcy-files/
Michelle Stirling as opposed to Michelle L’Heureux.
Yes, one maintains the ENSO blog:
https://www.climate.gov/news-features/blogs/enso
The other runs a one-person propaganda machine:
https://www.cbc.ca/news/canada/edmonton/friends-of-science-agricultural-service-board-conference-grande-prairie-michelle-stirling-1.4494032
I am sorry for those who would confuse the two.
You were the one who said ‘just use Michelle’.
Indeed I did, dummy.
Did you know that language was a social art?
Do you know you are an idiot?
Guess which Michelle this is, Richard:
Why not just use the full name and stop this guessing?
Which Michelle wrote that, Richard:
> The heat wave was caused by a heat dome a known meteorological phenomenon created by blocking patterns of high and low pressure zones. Our scientific advisor, Dr. Madhav Khandekar explained part of it in an article with The Epoch Times.
The Epoch Times should provide a good tell.
“created by blocking patterns of high and low pressure zones”
So not AGW at all.
Indeed, Richard, and people do not kill people, guns do.
The USA has a love of guns.
Contrarians have a knack for breaking the causality chains they dislike.
Idiots, such as you, have a habit of being idiots.
When are we going to get out of the ‘lies, damned lies and statistics’ playbook?
Mercator (and any similar rectangular latitude projection)
https://en.wikipedia.org/wiki/Mercator_projection
has well known distortions that should make it unacceptable in science. But still the warmistas still flock to it because it emphasizes the Poles and minimizes the Equator.
Mollweide is an area weighted substitute that has no such distortions and is much preferred by rational and thinking scientists such as Roy.
Similar arguments can be made about using mean and median where mean is well acknowledged to be influenced by outliers and the distribution shape whereas median is less affected by any such problems.
Bin&Barry forecasting update – La Nina not gone by April
https://youtu.be/yuas3CT94H0
As we all can see, it very certainly won’t be gone by next October as well:
https://i.postimg.cc/q75mRwS8/nino34-Mon240622.gif
https://i.postimg.cc/0Qt9rTxV/nino34-Mon020622.gif
But… Ebabbly will tell us he was aware of that in October 2021 already, for sure!
Becoz as oppozd to Bin & barry, Ebabbly is a 100% REAL FORECASTER!
My dog knows more about forecasting than you do
https://i.postimg.cc/jj60WD9h/dog.jpg
Solar Cycle 25 update – Radio edition
https://youtu.be/X9kxa8W-HdU?t=1574
The most weather & climate reliable source evah:
Norfolk Amateur Radio Club: NARC Live! 22nd June 2022 – Update on Solar Cycle 25 with Carl Luetzelschwab (K9LA)
https://k9la.us/
Thanks Ebabbly for making me laugh a bit.
Only 32 C in Murmansk?
Only 32 C in Norilsk?
I tell you: that’s nothing worth to write about.
It was there just a tiny bit warmer than usual.
So what!
And don’t forget: all latitudes above 60N taken all together are in the sum no more than about tiny 12% of Earth’s hemisphere, if I well do recall.
And your point was?
Sorted out the difference between a time series and a distribution yet? Or are you going to say that it doesn’t matter and you were always clear on that point even though you weren’t.
Grrrhand Sooohlar Miiihnimum cooohming:
https://drive.google.com/file/d/10QX3O6JIK3RIhUJgiqdhim4yUaG9ZwfR/view
Global Cooling ahead this year, for sure
https://drive.google.com/file/d/1DnrnCfQjICj21o1gOeFMbMI1xsF0nZoj/view
Do you know what Area weighting is?
Do you even know what data is presented here? From your comment it seems not.
Do you know what Area weighting is? Which is the question I posed.
Yes I do. What does that have to do with the data presented in this thread?
Answer: nothing.
You’ve brought an argument from somewhere else here, confusing the conversation with a pet peeve you need to stroke that has nothing to do with the topic.
This supremely self-interested habit sees you populating threads on different topics with the same spam.
Bindidon’s chart was of sea ice extent, which requires no area weighting as it is a satellite derived database.
At the moment you have made three times as many comments as anyone else here, and have made >25% of all the comments on this page. Try not to let your egomania fill every thread, hey?
Bindidong is having a Climate Zshit Attack
German weather after they restarted coal powered power plants because Putin cut off their gas
https://youtu.be/3o4ChLDV-Zg
Troglodytes who abuse the Colorado River might need to clean up their act before the Big Guv does it for them:
https://www.youtube.com/watch?v=3kvVmXdnSb4
W Amigo
Ive been giving this issue of reducing withdrawal of water from the Colorado River great thought.
My solution? Discontinue using the Colorado River as a source for Dasani bottled water.
As the number one bottled water brand, that should do the trick..
Words of wisdom, Fernando.
Words of wisdom:
> There is also Nestle, which sits at the cheaper end of the “all natural” bottled water market, and which is helping to illustrate the general insanity of bottled water quite well right now in Colorado. In this case, marketing equals an unceasing stream of semi-trucks driving between a series of wells and a bottling plant in Denver, about three hours away. One truck pulls up, fills, and drives on, to be immediately replaced by another empty truck, and so on. In the process, they are draining an aquifer that feeds the Arkansas River.
https://www.vice.com/en/article/pggnyz/why-bottled-water-is-insane
Mi Amigo
Actually, considering the off the charts sedimentation load of the Colorado River, I thought bottled water that looked like mud rather than being crystal clear would be a nice marketing touch.
But on to more serious thoughts. When considering the imbalance of supply and use we might want to look at the data. The graph on page 10 shows how use has grown significantly over the last 100 years. Why might that be? Of course, it might be a function of population. In just 3 states in the watershed, Az, Nv and Co, the population has increased 16,000% in the last 100 years. Los Angeles, which gets a piece of the action, has had a population increase of 40,000% during that period.
Like most issues involving AGW, if you scratch around enough there are ancillary factors that make attribution a little more complex than at first impressions.
https://www.usbr.gov/watersmart/bsp/docs/finalreport/ColoradoRiver/CRBS_Executive_Summary_FINAL.pdf
The more you scratch or the more you pretend to, Fernando? This is the first link you posted since a long while. Perhaps the first one!
Hard to tell. So much to do, so little time.
Dr. Patrick Moore– Carbon and Climate Catastrophe
https://youtu.be/lX1z_6pvM-Q
https://scienceblogs.com/gregladen/2014/06/27/who-founded-greenpeace-not-patrick-moore
La Nia effect – California edition
https://youtu.be/ym4G004BXs0
Mark B
I was away for a while.
Thanks a lot for your reply dated June 22, 2022 at 7:43 AM.
The main point for me was
” It gives the higher frequency ripples that are also apparent in your plots. ”
what clearly contradicts Linsley Hood’s claim that either my SG implementation would be wrong or I would wrongly use it because it shows too many details.
Exactly these ‘ripples’ are what matters to me, as I am not primarily interested in a smoothing destroying all higher deviations, but much more in showing a condensate of the deviations, like e.g. in
https://drive.google.com/file/d/12ulz1gkkkAD4S5Y_sHIufqLeuXZm0HmO/view
No brute force smoothing like e.g. CTRM could ever show you with such finesse what happens when you successively add tide gauge data around a place with maximal glacial isostatic rebound.
Merci.
So according to Blinny either Vaughn Pratt was wrong or Savitzky-Golay were when they proposed their CTRM or S-G filters/smoothers.
As one agrees with the other when used over 12 month or 15 year windows I rather think that is unlikely.
But Blinny always was a rule unto himself, especially when it comes to time series and distributions (and now filters).
” So according to Blinny either Vaughn Pratt was wrong or Savitzky-Golay were when they proposed their CTRM or S-G filters/smoothers. ”
As usual, the liar Linsley Hood insinuates what I never claimed.
I never thought let alone did I ever write or insinuate that
” either Vaughn Pratt was wrong or Savitzky-Golay were “.
This is a pure lie.
*
1. I repeat for the liar Linsley Hood what Mark B wrote
” It gives the higher frequency ripples that are also apparent in your plots… ”
2. I repeat for the liar Linsley Hood what I replied to Mark B
” … what clearly contradicts Linsley Hood’s claim that either my SG implementation would be wrong or I would wrongly use it because it shows too many details. ”
But liar Linsley Hood once more distorts, diverts and misrepresents, instead of accepting the fact that his own claim was wrong.
*
Nevertheless we all can here conclude that according to Mark B, Linsley Hood’s claim was WRONG. Thus,
1. My Savitzky-Golay tool works correct.
2. My use of it is correct as well.
Everything else is an invention of the liar Linsley Hood, throwing sand in our eyes to distract from his own lies and failures.
Hey Richard,
I asked at the ENSO blog about the AP article where it was implied that the ENSO research community believed more el Ninos would come with global warming. You may remember I’d challenged that notion based on the last 3 IPCC reports, which said there was no consensus on changes in el Nino/la Nina dominance in a warming world.
I got a reply.
“I covered what the IPCC report says about ENSO here >”
https://www.climate.gov/news-features/blogs/enso/enso-and-climate-change-what-does-new-ipcc-report-say
At the ENSO blog page linked ^ it says:
“There is no climate model consensus on a change in ENSO-related sea surface temperature over the next century in any of the greenhouse gas emission scenarios used in the report.”
The reply to me also included:
“There are groups of scientists who claim (with peer reviewed research) that El Ninos will be come more likely. That is what I imagine Seth Bornstein is referring to.”
Which is what I said way upthread. The journalist (Bornstein), gave only one side of the story regarding ENSO projections, which makes it seem as if all models, instead of some of them, project more el Ninos in the future.
Which is precisely what I meant by sensationalising the story when I wrote:
“The last few IPCC reports have made it clear there is no consensus on the future of ENSO patterns. So the journalist (AP) has created a controversy where there is none. Perhaps a result of who they spoke to.”
RLH, don’t base your understanding of the science on journalists’ interpretation of the science. And don’t us news commentary as evidence for anything other than what the press says.
https://www.drroyspencer.com/2022/06/uah-global-temperature-update-for-may-2022-0-17-deg-c/#comment-1323858
P.S. I asked Michelle L’Heureux at her blog for her reaction to the AP story and to check if she agreed with what was written. She offered no complaint.
https://www.climate.gov/comment/7288#comment-7288
The answer to your question you added to my question was also
“There are groups of scientists who claim (with peer reviewed research) that El Ninos will be come more likely. That is what I imagine Seth Bornstein is referring to.
About the only thing for certain is that a lot more research will produced looking at this problem”
TOM.DILIBERTO
Quite different in meaning from what you reported.
I reported accurately that ENSOblog, in reply to my query, confirmed that there is no consensus on the future of ENSO, and that the journalist likely spoke only to people who thought there would be more el Ninos.
Like me, ENSOblog defers to the broader knowledge of the IPCC. Here is Michelle l’Heureux quoting the IPCC on exactly the topic, and contradicting the misapprehension given by journalist Seth Bornstein in the AP article.
https://www.climate.gov/comment/4287#comment-4287
“About the only thing for certain is that a lot more research will produced looking at this problem”
Well obviously. As there is no consensus and contradictory results depending on model and even between model runs, one can safely presume there will be continued research on the future of ENSO.
[BARRY] The last few IPCC reports have made it clear there is no consensus on the future of ENSO patterns.
[TOM] There is no climate model consensus on a change in ENSO-related sea surface temperature over the next century in any of the greenhouse gas emission scenarios used in the report. The only thing for certain is that a lot more research will produced looking at this problem.
[RICHARD] What Tom says has is quite different in meaning from what Barry reported.
https://www.drroyspencer.com/2022/06/uah-global-temperature-update-for-may-2022-0-17-deg-c/#comment-1323858
“What Tom says has is quite different in meaning from what Barry reported”
Did Barry include “The only thing for certain is that a lot more research will produced looking at this problem”. No.
P.S. https://climatedatablog.files.wordpress.com/2022/06/nino34-4.jpeg
Where 1878 is not statistically different to 2016.
> “The only thing for certain is that a lot more research will produced looking at this problem”.
I think it is fairly safe to say that “there is no consensus on the future of ENSO patterns” and “There is no climate model consensus on a change in ENSO-related sea surface temperature over the next century in any of the greenhouse gas emission scenarios used in the report” imply that “a lot more research will [be] produced looking at this problem,” dear Richard.
So yeah. You’re wrong.
Why are you not acknowledging your mistakes?
“there is no consensus on the future of ENSO patterns” but we expect them to balance around zero, long term.
“there is no climate model consensus on a change in ENSO-related sea surface temperature over the next century in any of the greenhouse gas emission scenarios used in the report” but we will comment on how changing El Nino/La Nina patterns will not effect the temperature (except by making things hotter than ‘eva’).
https://www.drroyspencer.com/2022/06/uah-global-temperature-update-for-may-2022-0-17-deg-c/#comment-1324011
> but we will comment on how changing El Nino/La Nina patterns will not effect the temperature (except by making things hotter than eva).
See, Richard?
You’re still making stuff up!
Be a man. Own your mistakes.
You saying that the IPCC is not saying that things are going to get hotter than ‘eva’?
I’m saying you are making stuff up, Richard.
Do you think you’ll make me work to refute claims you don’t really support properly?
“Im saying you are making stuff up”
What?
Like the IPCC saying that things are going to get hotter in the future?
> What?
https://www.urbandictionary.com/define.php?term=Make%20Stuff%20Up
No answer for
“IPCC saying that things are going to get hotter in the future?”
then.
And the IPCC AR6 models running too hot as well.
https://www.drroyspencer.com/2022/06/uah-global-temperature-update-for-may-2022-0-17-deg-c/#comment-1323858
[RICHARD] You saying that the IPCC is not saying that things are going to get hotter than eva?
[ALSO RICHARD] Like the IPCC saying that things are going to get hotter in the future?
Sorry that should be CMIP6 not AR6. But one is published in the other.
And how is CMIP6 “published” in AR6, Richard?
1). You saying that the IPCC is not saying that things are going to get hotter than ‘eva’?
2). Like the IPCC saying that things are going to get hotter in the future?
Are they not both saying the same thing?
Also note:
https://www.drroyspencer.com/2022/06/uah-global-temperature-update-for-may-2022-0-17-deg-c/#comment-1324027
“the upcoming 2021 IPCC sixth assessment report (AR6) will feature new state-of-the-art CMIP6 models”
> Are they not both saying the same thing
Not really.
Willard: Always getting things wrong. Like the idiot he is.
“the upcoming 2021 IPCC sixth assessment report (AR6)”
“published”
Hmmm.
https://www.drroyspencer.com/2022/06/uah-global-temperature-update-for-may-2022-0-17-deg-c/#comment-1324100
Richard be like:
https://imgflip.com/i/6kyhjo
“published”
https://www.carbonbrief.org/in-depth-qa-the-ipccs-sixth-assessment-report-on-climate-science/
Do you think no one notices that you are deflecting from “But ENSO” with the contrarians’ almost favorite “But Modulz,” Richard?
Willard be like, “I am an idiot”.
You cannot change the Nino 3.4 facts with any spin you try to put on them.
That’s a better deflection, dummy.
The point you can’t evade is that Barry was right and you were wrong.
You keep bragging about how you own your mistakes.
Time to own this one.
“The point you cant evade is that Barry was right and you were wrong”
I simply graphed what HadISST says about Nino 3.4 since 1870. If you want to claim that they are wrong, go for it (or NOAA for re-publishing it).
https://climatedatablog.files.wordpress.com/2022/06/nino34-4.jpeg
> I simply graphed
No, dummy. You tried to deflect from what was being discussed.
Barry KOed you. Here you are, offering your other arm instead of cutting your loss.
You are a dishonorable man. See if I care.
or
https://rmets.onlinelibrary.wiley.com/cms/asset/49b40f3d-2ad9-4413-8a47-32023e74baa2/joc7535-fig-0002-m.jpg
which essentially shows the same thing.
“Barry KOed you”
Barry did not contest either the HadISST which is the source of the data for Nino 3.4 I used or the Extended ONI either.
Keep on peddling irrelevant facts, dummy.
Keep on being an idiot, Willard.
How can Nino 3.4 be irrelevant?
Here, Black Knight:
You really are dumb.
And you really are an idiot. Seeing as how El Nino’s have not become ‘larger’ for the last 130+ years.
Focus, dummy:
Do you think “printing graphs” will ever change that?
Here is Michelle l’Hereux on the topic I brought up in this thread.
https://www.climate.gov/comment/4287#comment-4287
Point is – journalist Seth Bornstein led you to believe that all climate models predict more el Ninos in a warming world.
Michelle sets us straight. If you don’t believe me, maybe you’ll believe her. Or the IPCC, which assesses the state of knowledge.
But I fear you may dismiss l’Hureux along with the IPCC and decide that a journalist has characterised the state of the science better than scientists who are expert in the topic. Just because you can’t admit that you were misled by trusting news commentary.
Published by Michelle on 28 Sept 2021 so not in response to this question or the article which was on May 28, 2022.
“What’s bothering many scientists is that their go-to climate simulation models that tend to get conditions right over the rest of the globe predict more El Ninos, not La Ninas, and thats causing contention in the climate community about what to believe, according to Columbia University climate scientist Richard Seager and MIT hurricane scientist Kerry Emanuel”
So Seager and Emanuel think that things are not quite ‘right’ with the frequency and El Nino/La Nina in the models.
“Scientists are noticing that in the past 25 years the world seems to be getting more La Ninas than it used to and that is just the opposite of what their best computer model simulations say should be happening with human-caused climate change”
“An Associated Press statistical analysis of winter La Ninas show that they used to happen about 28% of the time from 1950 to 1999, but in the past 25 winters, theyve been brewing nearly half the time”
Are you disputing the statistics?
“Her own analysis {Michelle} shows that La Nina-like conditions are occurring more often in the last 40 years. Other new studies are showing similar patterns”
‘La Nina-like conditions’. Are you saying she did not say or mean that?
You’ve somehow ignored things. Let’s try again – 1 step at a time.
I recently asked at the ENSOblog about the AP article – whether the ENSO monitoring community all expect more el Ninos, as inferred by journalist Seth Bornstein, or whether it is as the IPCC says – no consensus.
The reply immediately directed me to their last post on the topic, where it says:
“There is no climate model consensus on a change in ENSO-related sea surface temperature over the next century in any of the greenhouse gas emission scenarios used in the report….
Importantly, this is NOT saying that the climate models all show no change in ENSO over the next century in these scenarios. Some of the models certainly do show change. The issue is that there is no clear consistency not just among different models, but also among different runs of the same model made with slightly different initial conditions (ensembles). Some show higher amplitude ENSO events. Others project lower amplitude events. Its this wide range of outcomes that has led to the IPCCs low confidence in how ENSO could change in a warming world.”
That’s the commentary from Tom Di Liberto, regular author at the blog, not a quote from the IPCC.
It is confirmation that there is no consensus on the evolution of ENSO in a warming world.
I am not going to even read anything that avoids my point here. Please deal with this directly and we can move on to other stuff. Tired of being ignored and evaded.
“The issue is that there is no clear consistency not just among different models, but also among different runs of the same model made with slightly different initial conditions (ensembles)”
So the models are useless in this regard.
“It is confirmation that there is no consensus on the evolution of ENSO in a warming world”
But L’Heureux says that it is likely that La Nina’s will be in statistically significant prevalence over 40 years if this one holds on until Autumn.
There is no contradiction between a lack of consensus on the future of ENSO in the research community, and l’Heureux saying that a statistically significant change la Nina incidence is imminent.
No contradiction whatsoever.
If you don’t see that then you are really fucking stupid.
The only point I’m making, which you seem hell bent on ignoring, is that ENSOblog agrees with the IPCC position that there is no consensus on the future of ENSO, and consequently Seth Bornstein the AP journalist misled you to believe that there was.
That’s the point. Not some other point. Just that one.
“So the models…”
Don’t agree on the future of ENSO. That’s the stone cold truth. No need to dress it up.
Climate Clown show – now playing in Germany
https://www.climatedepot.com/2022/06/25/cheers-climate-backtracking-germany-pushes-for-g-7-reversal-on-fossil-fuels-in-climate-blow-u-turn-in-global-efforts-to-fight-climate-change/
I had forgotten about the climatedepot website, so I revisited it and googled some info.
https://en.wikipedia.org/wiki/Marc_Morano
https://en.wikipedia.org/wiki/Committee_for_a_Constructive_Tomorrow
Run by a politician with no scientific credentials. Marc Morano. Ah yes. A libertarian who believes in private property and privacy but posts the email and street addressees of climate scientists online.
Of course, proper skeptics would never accept, let alone promote, politicians’ take on science. No, it’s only political animals that would do that.
Which is what AGW ‘skeptics’ are.
The AGW nonsense is all about politics, beliefs, and agenda. It ain’t science. The science is settled — ice cubes can NOT boil water, passenger jets do NOT fly backwards, radiative fluxes do NOT simply add, more photons do NOT mean higher temperature, and bicycle pedals DO rotate as they “orbit”.
The AGW promoters are cultists, rejecting both science and reality. They thrive on insults and false accusations.
Thanks for the reminder, barry.
Bicycle pedals do not orbit about anything.
Clint R has been shown a video of a passenger jet flying backwards, experiments proving added ice can boil water, radiative fluxes do add, and more photons absorbed do mean a higher temperature.
Clint R, the endless entertainer, just prefers to write humorously wrong science.
RLH and Ball4 show up to prove me right, rejecting both science and reality.
Thanks trolls.
Bicycle pedals do not orbit about anything.
three key climate laws are postponed
https://youtu.be/rO6xlyGl4Tw
https://www.climatedepot.com/2022/06/24/paper-co-authored-by-uahs-dr-christy-on-climate-model-warming-bias-is-a-top-10-download/
Pervasive Warming Bias in CMIP6 Tropospheric Layers
R. McKitrick and J. Christy
RESEARCH LETTER10.1029/2020EA001281
15 JUL 2020
“The tendency of climate models to overstate warming in the tropical troposphere has long been noted. Here we examine individual runs from 38 newly released Coupled Model Intercomparison Project Version 6 (CMIP6) models and show that the warm bias is now observable globally as well. We compare CMIP6 runs against observational series drawn from satellites, weather balloons, and reanalysis products. We focus on the 19792014 interval, the maximum span for which all observational products are available and for which models were run using historically observed forcings. For lower‐troposphere and mid troposphere layers both globally and in the tropics, all 38 models over predict warming in every target observational analog, in most cases significantly so, and the average differences between models and observations are statistically significant. We present evidence that consistency with observed warming would require lower model Equilibrium Climate Sensitivity(ECS) values”
“The literature drawing attention to an upward bias in climate model warming responses in the tropical troposphere extends back at least 15 years now (Karl et al., 2006). Rather than being resolved, the problem has become worse, since now every member of the CMIP6 generation of climate models exhibits an upward bias in the entire global troposphere as well as in the tropics. The models with lower ECS values have warming rates somewhat closer to observed but are still significantly biased upward and do not overlap observations. Models with higher ECS values also have higher tropospheric warming rates, and applying the emergent constraint concept implies that an ensemble of models with warming rates consistent with observations would likely have to have ECS values at or below the bottom of the CMIP6 range. Our findings mirror recent evidence from inspection of CMIP6 ECSs (Voosen, 2019) and paleoclimate simulations (Zhu et al., 2020), which also reveal a systematic warm bias in the latest generation of climate models”
Did you read what I quoted, Richard:
https://www.drroyspencer.com/2022/06/uah-global-temperature-update-for-may-2022-0-17-deg-c/#comment-1323972
Any comment on that?
You are an idiot suffices for most of what you post.
https://www.drroyspencer.com/2022/06/uah-global-temperature-update-for-may-2022-0-17-deg-c/#comment-1321893
Idiot.
https://www.drroyspencer.com/2022/06/uah-global-temperature-update-for-may-2022-0-17-deg-c/#comment-1324125
https://www.drroyspencer.com/2022/06/uah-global-temperature-update-for-may-2022-0-17-deg-c/#comment-1324131
https://www.drroyspencer.com/2022/06/uah-global-temperature-update-for-may-2022-0-17-deg-c/#comment-1324137
Still an idiot.
https://tamino.wordpress.com/2019/09/29/climate-deniers-long-term-annoyance/
Contrarians here might like Roos and JC’s paper.
As that article predates the article at
https://www.drroyspencer.com/2022/06/uah-global-temperature-update-for-may-2022-0-17-deg-c/#comment-1323858
it has not comment on that.
> it has not comment on that.
Hence why it was not in reply to your comment, dummy.
So you read what I quoted then? Any comment on that?
So you do not comment on my comment and yet reply to it, Richard?
Sure.
https://www.drroyspencer.com/2022/06/uah-global-temperature-update-for-may-2022-0-17-deg-c/#comment-1324027
https://www.drroyspencer.com/2022/06/uah-global-temperature-update-for-may-2022-0-17-deg-c/#comment-1323858
https://www.drroyspencer.com/2022/06/uah-global-temperature-update-for-may-2022-0-17-deg-c/#comment-1324034
https://www.drroyspencer.com/2022/06/uah-global-temperature-update-for-may-2022-0-17-deg-c/#comment-1324037
https://www.drroyspencer.com/2022/06/uah-global-temperature-update-for-may-2022-0-17-deg-c/#comment-1321938
https://www.drroyspencer.com/2022/06/uah-global-temperature-update-for-may-2022-0-17-deg-c/#comment-1324047
https://www.drroyspencer.com/2022/06/uah-global-temperature-update-for-may-2022-0-17-deg-c/#comment-1321075
https://www.drroyspencer.com/2022/06/uah-global-temperature-update-for-may-2022-0-17-deg-c/#comment-1320993
https://climatedatablog.files.wordpress.com/2022/06/nino34-4.jpeg
Shows just how much (i.e. not at all) that El Nino’s have changed in the last 130 years.
https://www.drroyspencer.com/2022/06/uah-global-temperature-update-for-may-2022-0-17-deg-c/#comment-1323751
https://www.drroyspencer.com/2022/06/uah-global-temperature-update-for-may-2022-0-17-deg-c/#comment-1323863
https://www.drroyspencer.com/2022/06/uah-global-temperature-update-for-may-2022-0-17-deg-c/#comment-1324125
https://www.drroyspencer.com/2022/06/uah-global-temperature-update-for-may-2022-0-17-deg-c/#comment-1324131
https://www.drroyspencer.com/2022/06/uah-global-temperature-update-for-may-2022-0-17-deg-c/#comment-1324137
https://www.drroyspencer.com/2022/06/uah-global-temperature-update-for-may-2022-0-17-deg-c/#comment-1324141
https://www.drroyspencer.com/2022/06/uah-global-temperature-update-for-may-2022-0-17-deg-c/#comment-1324147
Idiot.
https://www.drroyspencer.com/2022/06/uah-global-temperature-update-for-may-2022-0-17-deg-c/#comment-1324183
Still an idiot.
https://www.drroyspencer.com/2022/06/uah-global-temperature-update-for-may-2022-0-17-deg-c/#comment-1306200
” https://climatedatablog.files.wordpress.com/2022/06/nino34-4.jpeg
Shows just how much (i.e. not at all) that El Ninos have changed in the last 130 years.”
I dunno. Looks to me like there is one big el Nino in the beginning of the record, and after that there is a rising trend, culminating in a slightly bigger el Nino.
As an OLS run of all the data from that dataset shows a warming trend, it’s not too surprising that this is the pattern I observe.
If instead you used ONI data, we would see a general cooling trend over the same period, and wouldn’t see that pattern of rising el Ninos after the big one near the beginning.
It may also turn out that if this data were detrended, that the big el Nino at the beginning might end up having the highest value of all.
I’d advocate using ONI with its cooling trend to comment on ENSO, but I know you always prefer the HadISST set for some reason, even though its got a general warming trend in it.
“Looks to me like there is one big el Nino in the beginning of the record”
And one towards the end of the record of about the same magnitude.
“If instead you used ONI data”
The extended ENS ONI shows the same thing (or even larger).
https://www.webberweather.com/uploads/1/1/9/9/119943685/ens-oni-timeseries-original3_orig.jpg
See the full original at https://www.webberweather.com/ensemble-oceanic-nino-index.html
“‘Super’ El Nino: 1877-78, 1888-89, 1972-73, 1982-83, 1997-98, & 2015-16”
The original source is https://rmets.onlinelibrary.wiley.com/doi/10.1002/joc.7535
and
https://rmets.onlinelibrary.wiley.com/cms/asset/49b40f3d-2ad9-4413-8a47-32023e74baa2/joc7535-fig-0002-m.jpg
“The extended ENS ONI shows the same thing (or even larger).”
The extended ONI reduces that rising trend in el Ninos post the big early one. Instead it looks like a waning phase up to about 1940 and then a waxing phase for el Ninos. Also shows, as I expected, a larger el Nino at the beginning of the record than at the end, rather than the other way around with HadISST.
The reason for this is that the ONI data gets rid of the warming that is present in HadISST. If you want to talk about ENSO and recent changes to la Nina, then ONI is your best bet, not to mention it is the same data set l’Heureux and co use. The increased la Nina trend will be further away from statistical significance with the HadISST data.
“‘Super’ El Nino: 1877-78, 1888-89, 1972-73, 1982-83, 1997-98, & 2015-16
Strong El Nino: 1896-97, 1899-00, 1902-03, 1918-19, 1930-31, 1940-41, 1957-58, 1965-66, 1987-88, 1991-92, & 2009-10
Moderate El Nino: 1855-56, 1868-69, 1885-86, 1904-05, 1905-06, 1911-12, 1913-14, 1925-26, 1939-40, 1941-42, 1951-52, 1963-64, 1968-69, 1976-77, 1977-78, 1986-87, 1994-95, & 2002-03
Weak El Nino: 1852-53(?), 1864-65, 1865-66, 1867-68(?), 1868-69, 1876-77, 1880-81, 1883-84, 1884-85, 1887-88(?), 1891(?), 1895-96(?), 1900-01, 1914-15, 1919-20, 1929-30, 1923-24, 1952-53, 1953-54(?), 1958-59, 1969-70, 1979-80, 2004-05, 2006-07, 2014-15(?), 2018-19, & 2019-20(?)
Weak La Nina: 1869-70, 1870-71, 1872-73, 1873-74(?), 1874-75(?), 1879-80(?), 1898-99(?), 1903-04, 1906-07(?), 1908-09, 1910-11, 1915-16, 1917-18, 1921, 1922-23(?), 1938-39, 1944-45, 1950-51, 1954-55, 1956-57, 1964-65, 1971-72(?), 1974-75, 1978(?), 1983-84(?), 1989-90, 1995-96, 2000-01, 2005-06, 2008-09, 2016-17, 2017-18
Moderate La Nina: 1849-50, 1856-57, 1886-87, 1889-90, 1892-93, 1893-94, 1909-10, 1924-25, 1933-34, 1942-43, 1949-50, 1970-71, 1975-76, 1984-85, 1998-99, 2011-12, 2020-21, 2021-22
Strong La Nina: 1916-17, 1955-56, 1973-74, 1988-89, 1999-00, 2007-08, 2010-11”
I don’t think that the data shows what you think it does.
Peaks are just as much an indication of trend as an OLS average is.
That list of ranked ENSO events dos not respond to what I said.
Will you please respond to what I said? It’s off-putting to be ignored.
https://www.drroyspencer.com/2022/06/uah-global-temperature-update-for-may-2022-0-17-deg-c/#comment-1324372
Compare HadISST with ONI.
https://climatedatablog.files.wordpress.com/2022/06/nino34-4.jpeg
https://www.webberweather.com/uploads/1/1/9/9/119943685/ens-oni-timeseries-original3_orig.jpg
HadISST: I see a large el Nino at the beginning then a rising trend of el Ninos to the end. 1878 el Nino is very slightly weaker than 2016.
ONI: I see a large el Nino at the beginning followed by a negative trend in el Ninos to 1940, then a rising trend in l Ninos to 2016. 1878 el Nino is slightly stronger than 2016.
These are the differences re el Ninos in the datasets.
And this is because HadISST has warming that ONI doesn’t. That’s why 2016 is weaker than 1878 in ONI, but stronger in HadISST.
Can you please respond to these points and not some other, Richard? The ranking of el Ninos in your last reply spoke past, not to, my point.
“That list of ranked ENSO events dos not respond to what I said”
It comes from the source I quoted.
“These are the differences re el Ninos in the datasets”
El Nino are by definition records. In either ONI or Nino 3.4.
“Thats why 2016 is weaker than 1878 in ONI, but stronger in HadISST”
It is stronger in the ENS ONI the same as it is stronger in the HadISST.
Sorry, I meant that 1878 is stronger than 2016.
You would be correct on waxing and waning
https://imgur.com/CauL1SE
It would help if you actually read the paper I referred to.
“HadISST: I see a large el Nino at the beginning then a rising trend of el Ninos to the end. 1878 el Nino is very slightly weaker than 2016”
3 points trumps 2.
Ok, so you’re just not capable of responding directly to anything I say.
And you do not want to read any url I post. Including papers on ENS ONI.
“And you do not want to read any url I post.”
1. That’s horseshit.
2. It again does not respond to what I said. In fact, you seem to be justifying why you never respond directly.
What arrogance resides in you that you think I will be interested in following along with anyone who never takes any interest in what I’m actually saying?
3. When you quoted the article on la Ninas and l’Heureux, I searched for it, read the whole article, and I posted the link to it here.
4. You still haven’t responded to what I’ve been saying, and every time you don’t you just prove how far your head is up your arse.
I bet you can’t even say back to me what my point is. It would take just a short sentence, but I bet you’re so wrapped up in yourself that you can’t articulate it.
5. If you can even just articulate what I’m saying, just to show you understand it, that would count as a response to it.
“The ranking of el Ninos in your last reply spoke past, not to, my point”
You failed to take account of the papers I posted. It’s not my fault that you did so.
“1. Thats horseshit.”
Yet you failed to notice that what I posted came from one of the sorces I quoted.
“2. It again does not respond to what I said. In fact, you seem to be justifying why you never respond directly.”
You just ignore anything that does not fit in with your already perceived ‘truth’.
“What arrogance resides in you that you think I will be interested in following along with anyone who never takes any interest in what Im actually saying?”
What arrogance resides in someone who takes no account of papers I post?
“3. When you quoted the article on la Ninas and lHeureux, I searched for it, read the whole article, and I posted the link to it here.”
And then selectively quoted things that completely ignored both the AP article and LHeureux own answers.
“4. You still havent responded to what Ive been saying, and every time you dont you just prove how far your head is up your arse”
Your head is much further up your own arse.
“I bet you cant even say back to me what my point is. It would take just a short sentence, but I bet youre so wrapped up in yourself that you cant articulate it.”
Sure. Idiot.
“5. If you can even just articulate what Im saying, just to show you understand it, that would count as a response to it.”
How should I respond to what is actually idiotic ramblings?
Pray tell which part of this paragraph you don’t get, Richard:
Does that sound like ramblings to you?
What part of the ONI is based on Nino 3.4 did you not get?
“Ensemble ONI uses monthly sea surface temperature (SST) anomalies in the Nio3.4 region from 32 input SST datasets as the basis for the ensemble, and our new monthly ENSO index extends from the present back to the year 1850”
“we find that ENSO events occur every 45 years on average, and there have been six ‘Super’ El Ninos (18771878, 18881889, 19721973, 19821983, 19971998, 20152016) that statistically rise above all other El Ninos since 1850”
….1877-1878, 1888-1889, 1972-1973, 1982-1983, 1997-1998, 2015-2016….
Damned parser.
….4-5 years….
Look, Richard.
It should be obvious to you that Barry takes time to write his comments. He writes well. His points are clear and he supports them squarely.
Here you are. Failing to respond to a simple question about a clear paragraph that expresses Barry’s point. Machine-gunning a series of irrelevant tidbits without any explicit point. In an exchange where i challenge you to support your claim that Barry meanders.
I mean, srsly.
You just cannot help yourself, can you?
> meanders
Let’s stick to “rambles” for now.
Barry sits with his short ONI series even though the extended ONI has been well established which covers 1870 to current. He also thinks that OLS averages supersede the peaks that La Nina/El Nino show.
In most scientific fields peaks are as important as averages. Not so with climate it seems unless you want to show a ‘record high’.
OK, Richard.
Let’s assume that Barry “sits on” ONI’s data.
What do you make of the second sentence in the paragraph I quoted earlier:
?
Especially the last part.
“then ONI is your best bet”
No. The extended ENS ONI is better. Otherwise you could incorrectly claim that the 2016 El Nino peak was ‘unprecedented’.
By “especially the last part” I am referring to this:
Richard.
Is that true?
“Deepti Singh authored an excellent article on the climatic upheaval associated with the 1876-78 El Nino which was published in Nov 2018. Of the period 1875-78, she says:
It is one of the worst humanitarian disasters in human history.
We find its the most severe event in the 800-year record in Asia.
This event was the strongest El Nino that has occurred since the 1850s. Sea surface temperatures remained high for 16 months. That makes it bigger than the huge El Ninos of 1997-98 and 2015-16.
But that’s not all. In 1877 a second climate cycle, the Indian Ocean Dipole, was active meaning the western Indian Ocean was warmer than the east. This typically weakens India’s monsoons. It was the strongest Indian Ocean Dipole on record.
The Atlantic Ocean was also unusually warm from 1877 to 1879. Following the El Nino, it peaked to the most extreme temperatures on record”
You just want to ignore the wider, older, data that is all.
Are you suggest that the ENS ONI and ONI are different in the most recent periods?
….Are you suggesting that….
Is it true that l’Heureux and co are using the same data set Barry is using, Richard?
The ENS ONI and ONI are the same in the period since 1950. The ENS ONI goes back to 1870 however. The ONI only to 1950,
Willard: Are you saying that what Deepti Singh said should be ignored?
A simple yes or no would do, Richard.
If Barry is using the same data set as Michelle, then of course you will have to own the fact that you not only disagree with Barry, but with his source, which happens to be your own sources too.
“If Barry is using the same data set as Michelle”
then they are both ignoring any data from before 1950 (which just happens to be a low point in the record also).
That if-by-whiskey does not respond to my question, Richard.
You really are in no position to whine about rambling.
They are both ignoring any data from before 1950 (which just happens to be a low point in the record also) which says that 2016 was not the largest El Nino on record.
So let me get this straight, Richard –
You’re telling me that you now disagree with the authors you kept spamming a few weeks ago?
Only in the sense that they are both restricting themselves to data from 1950 onwards which is as I said the lowest point in the recent record.
Good. Have you tried to share your concerns with Michelle?
On the blog? Yes.
“Others may extend the record to times before 1950, but we feel comfortable making those comparisons only in records post 1950. There is likely a good amount of uncertainty that go along with sst measurements in the Pacific prior to 1950”
Notice that they are careful not to say the data is wrong, just that there are uncertainties associated with the data.
They make no comment about 1950 being the low point in the record.
What they probably mean is that 01 February 2022 is too recent for them to have come to any definite conclusion yet.
Great. As long as you expressed your disagreement in a reasoned manner, you did what you could. And, to recap, you disagree with Barry, Michelle & co when they “sit” on ONI’s data.
I hope you noticed how forthrightness saves time.
Be well.
Me having given them the original source may have helped too. We shall see.
RLH,
Willard can articulate in one single post exactly what I’m saying.
But you can’t.
The reason that you can’t is that you have zero interest in a conversation where you properly read and comprehend what is being said to you.
All you want to do is ‘win’, and your version of that requires getting a submission, rather than cogently addressing points that your fellow interlocutors make.
I’ve called you on it and you engage in ‘tu coque.’ Instead of dealing with what I’m saying you just automatically throw it back on me.
It’s how teenagers operate.
You say I quoted the AP article selectively – completely forgetting that you accused me only a couple of posts before of never reading what you bring here. So instead of dealing with the fact you were wrong in the first accusation, you make a new one that contradicts the first.
Your argumentation is often contradictory like this.
It’s because your modus is pure contrariness. You are, in fact, the epitome of that epithet used for AGW ‘skeptics’ – contrarian.
All you know how to do is negate. A constructive dialog is impossible with you.
It’s also incredibly stupid. A hallmark of rational discourse is participants who can accurately describe the argument of their opposition. This is, in fact, an absolute necessity to be able to construct a cogent reply to that argument.
And this is entirely beyond you, apparently.
I’ve entertained plenty of links and data you’ve put up. In fact I investigate stuff you bring that is on topic, such as the HadISST data, which I’ve been trying to explain to you why it is different to ONI (and also the extended ONI).
It is you – not me – who never responds directly to what I say.
It is you – not me – who only reads part of a sentence of mine, and in quoting it to make a point, don’t realize that I’ve already made that point with the other half of the sentence you didn’t read.
Latest example – what I wrote:
https://www.drroyspencer.com/2022/06/uah-global-temperature-update-for-may-2022-0-17-deg-c/#comment-1324243
And your reply:
https://www.drroyspencer.com/2022/06/uah-global-temperature-update-for-may-2022-0-17-deg-c/#comment-1324360
You are skimming to react, not reading to respond.
The result is a one-sided conversation where you don’t listen.
No, this is not about what I do, it’s about what you do. Reflect for a goddamned minute.
Do you agree that in the Nino 3.4 area, temperatures have not changed much since 1930? Or will you continue to ignore the evidence?
https://climatedatablog.files.wordpress.com/2022/06/nino34-6.jpeg
Or would you prefer the absolute data for the area instead?
https://climatedatablog.files.wordpress.com/2022/06/nino34-5.jpeg
I should add that Michelle L’Heureux (et al) have published a paper
https://journals.ametsoc.org/view/journals/clim/33/11/jcli-d-19-0650.1.xml
that concludes that
“The strength of the 1877/78 El Nio appears approximately equal to those during 1982/83, 1997/98, and 2015/16”
“Do you agree that in the Nino 3.4 area, temperatures have not changed much since 1930?”
I don’t agree with the premise of the question.
Specifically, it is possible for two data points to be equal value in a time series, and for there to be a statistically significant trend between them. For this reason, I reject your methodology. It can give spurious results on a general change over time. And that is what your question is speaking to – general change, not the difference between two data points.
I have said that there is a slight warming trend for that period, but it is statistically not significant. IOW, no trend is established.
I’m not being difficult. I’m being precise, and using methods and language that I think are legitimate.
“I should add that Michelle L’Heureux (et al) have published a paper”
I’ve intimated days ago that I think 1878 el Nino is not significantly different to 2016. I also said that if you use the extended ONI, you see that the 1878 el Nino is a bit warmer than 2016.
Do you have a point here? Would I be correct in guessing that you are keen to reject any notion of a warming trend, and that this drives your focus on this point?
[RICHARD]
https://imgflip.com/i/6kyhjo
[ALSO RICHARD] “The report does really show scientifically and robustly that net-zero does work for stabilising or even reducing surface temperatures.”
Hmmm. Big hmmm.
Idiot. No hmmm.
See https://www.drroyspencer.com/2022/06/uah-global-temperature-update-for-may-2022-0-17-deg-c/#comment-1323858
God you’re dumb.
And you are an idiot.
What that you do not acknowledge that you were wrong.
You are still an idiot.
You can’t even distinguish the WG1 and the WG2, dummy.
Are they both IPCC?
“Working Group I deals with The Physical Science Basis of Climate Change, Working Group II with Climate Change Impacts, Adaptation and Vulnerability and Working Group III with Mitigation of Climate Change”
Do you see “impact” there, dummy?
So you are saying that WG2 does not believe the diagram that the IPCC publishes. Of course that is logical. Not.
No, dummy – I am saying that if you want to support the two caricatures you cannot even distinguish you’ll need to cite WG2, not WG1.
I quoted something from the IPCC on IPCCs own website and you want me to determine if it came from WG1 or WG2?
Yes, Richard – you quoted (or rather cited a figure from) the WG1 to support your caricatures of what the IPCC says about impacts whence impacts are discussed in WG2.
So you are once again wrong.
When will you look into WG2?
So you are saying that WG1 and WG2 do not talk to each other?
No, Richard – I am saying that if you want to support your caricatures about the IPCC’s position on impacts, you need to look where they discuss impacts.
Please confer to the WG2. If you are here for the science, what do you have to lose?
So you agree that the image I used from the IPCC shows that ‘natural factors’ have little impact on climate and that ‘humans’ are responsible for most if not all of the warming to date.
When will you look into WG2, Richard?
That’s where you will find support for your caricatures.
Take your time.
So WG1 publishes an image that WG2 ignores.
You are free to add another caricature, Richard.
The beauty of it is that this other one will also need to be supported in the WG2!
When will you read it, BTW?
I have read all parts of the IPCC report.
Then it should be easy for you to support your caricatures by quoting and citing the proper chapter, Richard.
Please report when you’re done.
I have but you ignore them, insisting that WG1 does not talk to WG2 and that WG2 does not take any notice of what WG1 posts.
Where have you cited the WG2, Richard?
I have cited the diagram on the IPCC’s website which you say came from WG1. I rather suspect that WG2 know about it.
That still does not support your caricatures, Richard.
But OK.
How else would you describe the diagram I showed?
Fair question, so one last comment.
The graph shows that as far as the attribution goes, the A in AGW dominates. That does not tell us if temperatures anomalies dominate impacts. That does not tell us that temperatures *will* increase, for “The report does really show scientifically and robustly that net-zero does work for stabilising or even reducing surface temperatures,” as your own source stipulates.
“The graph shows that as far as the attribution goes, the A in AGW dominates”
Only because the ‘natural’ input is considered to be next to zero.
As I said, humans have been determined by the IPCC to be the major (if not only) cause of the warming climate.
Except in the Nino 3.4 area of course where temperatures have not changed much since 1930.
Super-triple-developing La Nina effect – China style
https://youtu.be/Ly_UzWcUBAQ
“Deepti Singh authored an excellent article on the climatic upheaval associated with the 1876-78 El Nino which was published in Nov 2018. Of the period 1875-78, she says:
It is one of the worst humanitarian disasters in human history.
We find its the most severe event in the 800-year record in Asia.
This event was the strongest El Nio that has occurred since the 1850s. Sea surface temperatures remained high for 16 months. That makes it bigger than the huge El Nios of 1997-98 and 2015-16.
But thats not all. In 1877 a second climate cycle, the Indian Ocean Dipole, was active meaning the western Indian Ocean was warmer than the east. This typically weakens Indias monsoons. It was the strongest Indian Ocean Dipole on record.
The Atlantic Ocean was also unusually warm from 1877 to 1879. Following the El Nio, it peaked to the most extreme temperatures on record”
Why do you hide your sources, Richard?
Here it is:
https://cliscep.com/2019/02/06/historical-perspectives-on-climate-the-super-el-nino-of-1876-78/
You roam over the Contrarian Matrix. Be proud of it!
Are you saying that Deepti Singh is wrong?
No, Richard – I am saying that you should not honor your sources.
Not only it is good practice, but it helps find gems such as this one:
https://cliscep.com/2019/02/06/historical-perspectives-on-climate-the-super-el-nino-of-1876-78/#comment-33463
It is as if Mosh anticipated your modus operandi!
“No, Richard”
So you agree that the 1878 El Nino was indeed unprecedented and far in excess of 2016.
Why do you not cite your sources, Richard?
Are you not proud of the Contrarian Matrix?
You mean
https://journals.ametsoc.org/view/journals/clim/31/23/jcli-d-18-0159.1.xml
Did you find “Deepti Singh authored an excellent article” on that page, Richard?
No. I found a reference to the page I actually read.
Which includes the excellent info:-
“The extreme severity, duration, and extent of this global event is associated with an extraordinary combination of preceding cool tropical Pacific conditions (187076), a record-breaking El Nio (187778), a record strong Indian Ocean dipole (1877), and record warm North Atlantic Ocean (1878) conditions”
….The extreme severity, duration, and extent of this global event is associated with an extraordinary combination of preceding cool tropical Pacific conditions (1870-76), a record-breaking El Nino (1877-78), a record strong Indian Ocean dipole (1877), and record warm North Atlantic Ocean (1878) conditions….
Compare and contrast:
[RICHARD] “Deepti Singh authored an excellent article on the climatic upheaval associated with the 1876-78 El Nino which was published in Nov 2018. Of the period 1875-78, she says:”
[JAIME] Deepti Singh authored an excellent article on the climatic upheaval associated with the 1876-78 El Nino which was published in Nov 2018. Of the period 1875-78, she says:
Notice any similarity?
Now go to the actual paper she wrote.
Unlike you I go to the base source to check that they are quoted correctly before I post.
Why quote Jaime’s words if you don’t want to cite her, Richard?
You could have cited the paper itself and editorialized to your heart’s content.
Because I like to give credit to where I found the reference. (and, no, despite your belief I did not find it by browsing coolista websites).
Then you should have no qualms citing your sources, Richard.
This is the only point I wanted to raise here.
So my job here is done.
Bye.
Everyone,
Alright, time to slowly come out of self-isolation.
Here’s a little something to get you going:
https://www.quantamagazine.org/physicists-trace-the-rise-in-entropy-to-quantum-information-20220526/
Thanks for all the fish, twas fun.
See you in a while.
PS: I’ll still be here for you, Graham.
Climate Prediction Centre May value for ONI makes 2 months in a row that a la Nina has been at its coldest values for those two months of the year.
In the ONI dataset.
https://www.cpc.ncep.noaa.gov/products/analysis_monitoring/ensostuff/detrend.nino34.ascii.txt
But this is not the case using HadISST NINO3.4 data.
(The May value is not yet released)
April 2022 is not the coldest April in the full HadISST record.
In the full record April 2022 is 14th coldest April.
Since 1950 (per ONI) April 2022 is the 6th coldest April in HadISST NINO3.4 data.
The reason ONI has the coldest April in 2022 is that HadISST data gets generally warmer to the present, and ONI does not.
HadISST for Nino 3.4 has not gotten any warmer since 1930.
https://climatedatablog.files.wordpress.com/2022/06/nino34-4.jpeg
See the blue line in 1930 which is the same as the reference period 1980-2010.
P.S. 1950/1952 is the low point in that record. I’m sure that the start of recent ONI in 1950 is purely a co-incidence.
ONI has a negative trend since 1950.
What are you even talking about?
Are you saying that 1950 is NOT a low point in the Nino 3.4 temperature record?
Are you saying ONI does NOT have a negative trend since 1950?
The ONI, as you have yourself said, has a moving reference period which make any long term trends in it meaningless. As you well know.
Only the Nino 3.4 from NOAA/Hadley Center is worth quoting for long term trends as it does not use a moving reference period.
Are you saying that the moving reference period that the ONI uses does not effect any long term trends?
“The ONI, as you have yourself said, has a moving reference period which make any long term trends in it meaningless. As you well know.”
I was talking about la Ninas. Once again you have zero interest and peremptorily change the subject. So you can ‘win’.
The ONI is used for ENSO. HadISST is not.
I had thought you had an interest in ENSO – you were talking about record values for la Nina, which was what prompted me to recommend you use ONI for that discussion, as HadISST doesn’t have record low values.
You are dismissing the dataset that GIVES YOU those record low values (for April and May).
If you think we should reject ONI in favour of HadISST, then OK. You no longer have record low values for April and May.
If your next thought is “but I’m talking about long term trends,” then I ask again – why do you ignore everything I say?
And everybody, including Michelle, agrees that the 1878 EL Nino was at least as significant as the 2016 one. You seem to want to ignore that simple fact.
We’ve already HAD this conversation! I said the 1878 la Nina has a higher profile in the ONI record!
We’re going around in circles because your head is so far up your ass you can’t hear what I say.
There – I’ve acknowledged your point. Again. As I usually do.
When are you going to return the courtesy?
https://www.drroyspencer.com/2022/06/uah-global-temperature-update-for-may-2022-0-17-deg-c/#comment-1325114
“I said the 1878 la Nina has a higher profile in the ONI record!”
You also said that the ONI was useful to compare things for long term trends.
barry: I said the 1878 la Nina has a higher profile in the ONI record!
RLH: You also said
So, tacit acceptance I DID acknowledge that 1878 and 2016 were not significantly different. Gee, I wonder why you accused me of not doing that?
“that the ONI was useful to compare things for long term trends.”
Huh? Compare WHAT things? What are you trying to say? You’re as vague as a sheep in cloud.
I don’t think you are fully aware of why I was running linear regressions, and that’s why your criticism is incoherent.
P.S. The ONI only goes back to 1950, it is the ENS ONI that goes back to 1870.
“Compare WHAT things?”
Long term trends (i.e. greater than 5 years).
“why I was running linear regressions”
Do you understand the limitations with linear regressions and what the implications of using them are?
Do you think that HQLP filters show different things to linear regressions and why?
“Compare WHAT things?”
Long term trends (i.e. greater than 5 years).
There’s nothing wrong with running long term linear trends to compare whether the data sets differ on that. They do. And that difference is why you have a record low April in 2022 in the ONI, but not in the HadISST data.
“I dont think you are fully aware of why I was running linear regressions”
Do you understand the limitations with linear regressions and what the implications of using them are?
As expected, you were unable to articulate why I was using linear regressions.
I certainly understand the limitations of linear regressions. That’s why I have presented them entirely within their limitations, and for a specific purpose which you don’t understand despite me explaining it 30 times to you.
You have an amazing capacity to not absorb what people say.
“Do you think that HQLP filters show different things to linear regressions and why?”
I’m very familiar with what smoothed data look like, and you can see those shallow, curvy lines in the various graphs you’ve presented.
On day you’re all keen to only work with 2 peaks, the next day you want to only work with low pass filters.
All of that is beside any point I’m talking about, and you bring these up as some kind of counter that completely misses the target.
It’s incoherent. What you are doing is simply countering, and it doesn’t matter to you whether or not your counter responds to what I’m saying. You simply want to be contrary.
It’s as if you are talking to someone else who is saying different things to me.
Perhaps if you explained your interest in long term trends for NINO3.4 – because it’s certainly not the same as mine – I might understand what your problem is.
I’ll answer you directly when you answer me directly. That’s the deal.
https://www.drroyspencer.com/2022/06/uah-global-temperature-update-for-may-2022-0-17-deg-c/#comment-1325114
You just avoid facts. Not that it matters to you.
I have always responded directly to your comments. Not every comment you make, but any that I choose to answer.
You almost never return the courtesy. I am going to insist on it from now on. Pouting “you too” is not only false, it is a tacit acceptance of my criticism.
If we were at a party and you ignored everything I said while you barked facts and figures at me and asked leading questions without taking the slightest interest in the answers, how long do you think I’d politely listen for before moving away to avoid you for the rest of the party?
Tired of it being a one-way conversation, Richard. Lift your game or talk to yourself.
“I have always responded directly to your comments. Not every comment you make, but any that I choose to answer.”
That’s not completely true. I have often of late copied your style. So when (FOR EXAMPLE) you’ve answered a question of mine with another question, I have sometimes done the same – to try and show you what it’s like to be on the receiving end of that BS.
Case in point:
https://www.drroyspencer.com/2022/06/uah-global-temperature-update-for-may-2022-0-17-deg-c/#comment-1325530
You just avoid facts.
Like 1950 being the low point in the Nino 3.4 record.
I started this thread with a post that you have continued to ignore.
You respond to me directly, and I will return the favour.
https://www.drroyspencer.com/2022/06/uah-global-temperature-update-for-may-2022-0-17-deg-c/#comment-1325530
Why do you imagine that I will just follow whatever direction you want to go in when you continually ignore whatever I have to say?
Your arrogance is breathtaking.
Will you do me the courtesy of replying to what I said when I opened this thread? Thanks.
https://www.drroyspencer.com/2022/06/uah-global-temperature-update-for-may-2022-0-17-deg-c/#comment-1325530
https://www.drroyspencer.com/2022/06/uah-global-temperature-update-for-may-2022-0-17-deg-c/#comment-1325762
https://www.drroyspencer.com/2022/06/uah-global-temperature-update-for-may-2022-0-17-deg-c/#comment-1325858
Here is my comment that started this thread that you have ignored in every reply.
https://www.drroyspencer.com/2022/06/uah-global-temperature-update-for-may-2022-0-17-deg-c/#comment-1325114
It’s on you whether we have a conversation or you talk to yourself.
“In the ONI dataset”
Which has a moving reference period which makes any long term trends in it meaningless.
The Nino 3.4 does not use a moving reference period, in fact the absolute temperatures are not detrended at all.
So you have zero interest in what I said.
Never again chide me for ignoring anything you say. You have set the tone, not me.
In full then:-
“Climate Prediction Centre May value for ONI makes 2 months in a row that a la Nina has been at its coldest values for those two months of the year.
In the ONI dataset.”
The ONI has a moving reference period. This is important. See later.
“https://www.cpc.ncep.noaa.gov/products/analysis_monitoring/ensostuff/detrend.nino34.ascii.txt
But this is not the case using HadISST NINO3.4 data.”
The Nino 3.4 has no such moving reference. This is important. See later.
“(The May value is not yet released)”
You just have to wait.
“April 2022 is not the coldest April in the full HadISST record.”
So what?
“In the full record April 2022 is 14th coldest April.”
Again, so what?
“Since 1950 (per ONI) April 2022 is the 6th coldest April in HadISST NINO3.4 data.”
So what. This is getting boring. Such trivia.
“The reason ONI has the coldest April in 2022 is that HadISST data gets generally warmer to the present, and ONI does not.”
It has its up and downs. Nothing is as simple as you suggest. 1950 is the lowest period in the record. 1930 is about the same as current. As
https://climatedatablog.files.wordpress.com/2022/06/nino34-6.jpeg
shows. I am not really interested in trivia such as if an individual month is warmer or not.
That enough for you?
You do realize that having a moving reference period makes the ONI useless for long term comparisons don’t you?
“Never again chide me for ignoring anything you say. You have set the tone, not me.”
You are the one ignoring facts. Not me.
https://www.drroyspencer.com/2022/06/uah-global-temperature-update-for-may-2022-0-17-deg-c/#comment-1325858
At last! You actually acknowledge and reply to my points.
“It has its up and downs. Nothing is as simple as you suggest”
If you use HadISST, you will find that recent la Ninas are warmer than previous la Ninas. Unlike ONI.
“I am not really interested in trivia such as if an individual month is warmer or not.”
I seem to remember you were VERY interested in the la Nina value for April. Have you finally realized that one month is trivial when it comes to establishing trends? Great! I’ve been trying to make that point for months to you.
I suggested to you last week that you dropped your interest in the issue of April being the coldest Nina month when you believed I was trying to push global warming on you. And this is why you have misunderstood everything I’ve written since. You think it’s important to know that 1950 has low values, when it is completely beside the points I’ve been making.
All I’ve been talking about is the difference between 2 data sets as they relate to ENSO. That is entirely it. And you have finally responded to that point.
That took a week of insisting. Incredible.
By the way:
https://climatedatablog.files.wordpress.com/2022/06/nino34-6.jpeg
Is not “data”. It’s a graph of the data.
I have not “ignored”:
that 1950 is a low point – already acknowledged it
that you have posted graphs – I’ve commented on them
that 1878 is el Nino not statistically different from 2016 – I even pointed out that it is higher than 2016 in the ONI set
I have replied to a bunch of stuff you have forgotten I replied to. And while you falsely accuse me of “ignoring facts,” you spend a week ignoring my point.
By the way, this is about where I started discussing the differences in the data sets, to which you took some exception I cannot fathom. Unless you’re playing climateball. Then it makes sense.
https://www.drroyspencer.com/2022/06/uah-global-temperature-update-for-may-2022-0-17-deg-c/#comment-1313375
It was at this early juncture that I was trying to help you determine what kind of dataset you were using.
https://www.drroyspencer.com/2022/06/uah-global-temperature-update-for-may-2022-0-17-deg-c/#comment-1313321
(Where we see it has taken you three weeks to finally acknowledge and reply to my point)
I entered this conversation due to your interest in the April la Nina value. You recommended a data set that belies that record. I tried to make you aware of that. You refused to listen. For three weeks. Even now you still haven’t grasped that point.
“By the way, this is about where I started discussing the differences in the data sets”
I understand quite well the difference between the 2 datasets.
1) Nino 3.4 which is not detrended at all.
2) ONI which is constantly detrended by using a new changing reference period every 5 years.
Do you understand what differences that brings to looking at both?
“If you use HadISST, you will find that recent la Ninas are warmer than previous la Ninas. Unlike ONI.”
So you are saying that either HadISST or NOAA is wrong in their data about Nino 3.4.
https://climatedatablog.files.wordpress.com/2022/06/nino34-6.jpeg
Any difference between 1878 and 2016 on that graph are well within the uncertainties associated with the measurements. As Michell herself said.
“Is not ‘data’. Its a graph of the data.”
Data presented in graphical form is still data.
….As Michelle herself said….
“Do you understand what differences that brings to looking at both?”
I perceive differences that I hope you are neutral enough to also perceive. They’ll be the ones I’ve mentioned already.
And you perceive what you perceive and you, too, hope I have the wisdom to see what you see.
Fortunately, we not stuck with trying to persuade the other with words and pictures.
We have the data and we can do some analysis.
From comparing the data I know that the average value of el Ninos and la Ninas are warmer in the last four decades than the first four decades of the HadISST data.
I know that April 2022 is the lowest April in the ONI data since 1950, but thot the lowest April since 1950 in the HadISST data.
I know that HadISST linear trends from 1870, 1930, 1950 and 1997 are all positive. None of them are statistically significant.
ONI linear trends from 1950 and 1997 are both negative, both not statistically significant.
I haven’t been able to find the extended ONI dataset online to compare the other periods.
I know why they are different. I explained it to you three weeks ago and gave you the link you used recently to explain it to someone else. I’ve known for about 10 years how ONI data is processed.
I also learned about your HadISST NINO3.4 data while confirming for you that it is not detrended.
“Are you saying that either HadISST or NOAA is wrong in their data about Nino 3.4.”
No.
I’m saying they are different.
I think we’re clear on why, and so I hope I don’t have to explain why April 2022 is not the coldest April in the HadISST NINO3.4 data.
If for some reason you were keen to know the long term change, if any, for the NINO3.4 region, then HadISST would be your choice.
But I’d be puzzled as to why you wanted to know that about such a small region, particularly when the only reason this area was pinpointed in the first place was to use it as an ENSO indicator.
Are you telling us Bindidong’s forecast “La Nina gone by April” was wrong and the La Nina in April dipped to the lowest point since it started ???
Oh wait you are the expert who didn’t this La Nina coming begin with even when it was right in front of you.
Well tell us when its over so we don’t miss it.
Typically, nothing you wrote there reflects anything I’ve ever said.
And when I ask you now to quote me on any of it, you are not going to reply with a quote that demonstrates me saying any of those things. Yet again.
But that won’t bother you. You’ll come back before long with another bunch of lies.
Facts are lies according to Barry.
You have no idea what’s going on in this conversation, Richard. But your egomania requires that you chip in with a vacuous dig.
According to Barry, facts are lies.
https://www.drroyspencer.com/2022/06/uah-global-temperature-update-for-may-2022-0-17-deg-c/#comment-1325858
The ONI and the ENS ONI are completely useless for loloking at long term trends.
https://www.drroyspencer.com/2022/06/uah-global-temperature-update-for-may-2022-0-17-deg-c/#comment-1325858
Get over it.
….useless for looking at long….
This conversation kicked off from your post on April being the lowest ENSO month. Every comment I’ve made since than has been related to that. Hence the references to ONI.
You switched topics it seems.
The ONI is useless for describing any ‘trend’ that is longer than 5 years, as its base reference period changes that often. But don’t let the facts get in the way of your presentations.
OF COURSE ONI is no good for finding out long term trends in the region. I’ve been using it exclusively to talk about ENSO activity.
Why you are countering my discussion about the data sets and ENSO with chat about long term trends I do not know. Apparently this is important to you, but you haven’t properly explained why.
“your post on April being the lowest ENSO month” in this particular ‘triple dip’ La Nina.
I reported what climate.gov showed. Are you saying they were wrong?
I’m saying they get their results from ONI data.
Willard says:
But perhaps Bill forgot a little detail:
The plate has two sides!
Lets wait and see if he did.
—————–
What a moron! One side of a plate is the equivalent of a hemisphere Willard. Its half the area of a plate’s total surface counting both sides.
Oh, Bill:
https://www.drroyspencer.com/2022/06/uah-global-temperature-update-for-may-2022-0-17-deg-c/#comment-1325203
Never forget – you are bringing this on you, to Graham’s shame.
Like Nate Willard once again demonstrates he has no arguments, no sources, and no mathematics to back up his assertions.
Oh, Bill.
Well at least we agree on something.
Not really, Bill.
For instance, here’s where I explain how Graham shuffles around whatever he needs to get the numbers he wants:
https://www.drroyspencer.com/2022/06/uah-global-temperature-update-for-may-2022-0-17-deg-c/#comment-1325201
You’re about to do the same, which means either you will help me make my argument clearer than it is, or you will fold.
Also, Nate has a very good argument here:
https://www.drroyspencer.com/2022/06/uah-global-temperature-update-for-may-2022-0-17-deg-c/#comment-1324762
For some reason Graham forgot to respond to it.
So no, Bill. I don’t agree with you. In fact I think you’re wrong.
My stalker was actually agreeing with me, Willard, as far as my disagreement with you is concerned. What he disagrees with me about in that comment relates to the Green Plate Effect. All over your head, unfortunately.
You’re too stupid to realize that nobody disagrees with your silly calculation, Graham. Not even B4. But you just can’t read.
If there is a disagreement, it would be over how to deal with your misspecification.
Please stop stalking me. You promised Chic.
Nobody but you thinks there is a misspecification, Willard.
Graham, please stop stalking me.
You were down here talking about me, Willard.
I was responding to Bill, Graham.
For your own good, please stop stalking me.
You were responding to Bill, and mentioning me. Can you not write a comment to someone else without mentioning me?
If you do not take heed of what Chic intimated you, Graham, that is your own prerogative.
My request was for your own good, not mine.
Please reconsider. You will lose again, and you are a poor sport.
OK, Willard. I acknowledge receipt of your comment.
OK, Graham.
OK, Willard.
Please stop trolling, Graham.
Willard, please stop trolling.
OK, Graham. I acknowledge receipt of your comment.
Yes, likewise.
“Like Nate Willard once again demonstrates he has no arguments, no sources, and no mathematics to back up his assertions.”
Ha!
Here’s some arguments with math!
https://www.drroyspencer.com/2022/06/uah-global-temperature-update-for-may-2022-0-17-deg-c/#comment-1324762
https://www.drroyspencer.com/2022/06/uah-global-temperature-update-for-may-2022-0-17-deg-c/#comment-1324834
You still have no answers for this blatant accounting fraud. And keep on defending it.
Here’s another opportunity to explain it, Bill.
Crickets.
No Crickets Willard. I have responded many times on this topic. We only know that within the atmosphere the claimed missing 200w/m2 got carried away by convection and we have no experiments in space saying where it went that we can rely upon. DREMT applied that 200w/m2 to warming the GP.
So one can claim that 200w/m2 is misapplied but its a lie to say that it is an accounting fraud.
More crickets, Bill?
Suit yourself.
Exactly, Bill. Thank you. As soon as you accept that the 200 W/m^2 back-radiated from the GP to the BP cannot warm the BP, since the GPs temperature is set and maintained by emissions from the BP, and it would be a 2LoT violation for further warming of the BP to occur; then you have to accept that ultimately, one way or another, that energy has to go back to the GP from the BP, and leave from the GP to space. Now, as you say, you can claim that the 200 W/m^2 is misapplied, but it’s a lie to say that it is an accounting fraud. Nobody is saying that the energy disappears, or all the other misrepresentations and false accusations that are made.
11:14 am: “that energy has to go back to the GP from the BP”
No DREMT that’s wrong. The BP in the GPE is defined as a black body so that radiated energy from the GP was all absorbed by the VF 1.0 BP increasing the BP entropy in the process so no natural laws are broken & as shown by actual experiment.
See Eli’s 1997 GPE work for the correct solution.
The fact that a blackbody is defined as "always absorbing" cannot be used as an excuse to violate the laws of thermodynamics.
The view factors between the BP and the Sun, and the BP and the GP, are not the same. E-Lie’s solution does nothing to take this into account.
Of course you commit an accounting fraud, Bill.
I expect nothing less from scoundrels like you.
12:05 pm: There is no need to use blackbodies in the GPE for any excuse DREMT since the laws of thermodynamics are not violated in Eli’s correct GPE solution.
The 2LOT is broken, however, in DREMT’s “11:14 am: “that energy has to go back to the GP from the BP” because DREMT’s described process does not increase universe entropy so cannot be the GPE solution as is Eli’s.
It is known and understood by all that Ball4 will simply say anything.
… that agrees with basic known physics.
No Ball4, far from it.
Ball4 certainly ought to leave to Graham the delicate task of revolutionizing physics why being the only one here that follows its laws to the letter.
After all, isn’t Graham our in-house physics literalist?
Willard, please stop trolling.
“Now, as you say, you can claim that the 200 W/m^2 is misapplied, but its a lie to say that it is an accounting fraud. Nobody is saying that the energy disappears”
Misapplied, as in missing, as in no one can say where it went nor why it isnt counted.
There is “a counting” fraud because no one can say why the 200 W is not COUNTED as a loss of energy from the GP, when the SB law says it should be.
DREMT fully understands that 200 W input and 400 W output is 1LOT violation, hence
this fraud is needed to coverup the illegal energy imbalance of the GP.
We have at least 3 excuses so far.
1. VF=1 so it hits the BP and may or may not be absorbed. But somehow is not lost to the GP???
2. The BP is a mirror sending it back to the GP?
3. It ultimately leaves the system so we can sacrifice energy balance for the GP.
The excuses are mutually exclusive, but the TEAM offers them all up anyway.
Nate says:
”Misapplied, as in missing, as in no one can say where it went nor why it isnt counted.
There is ‘a counting’ fraud because no one can say why the 200 W is not COUNTED as a loss of energy from the GP, when the SB law says it should be.”
—————————
This is hilarious!
Above he claims a disappearance of 200w backradiation from the GP right along with accusations of accounting fraud.
Then in the next paragraph below he marvels at 200w turns into 400w and starts claiming a 1LOT violation! And he actually thinks thats a good argument. LMAO!
”DREMT fully understands that 200 W input and 400 W output is 1LOT violation, hence
this fraud is needed to coverup the illegal energy imbalance of the GP.”
These guys are so dense and so inculcated they can’t see how stupid they are talking!!
Agreed about F word, Bill.
How about Sky Dragon Cranks Magic?
#2
Willard, please stop trolling.
“This is hilarious!”
And yet Bill again evades explaining the missing emissions and accounting fraud!
When you gonna actually attempt Bill?
In case you missed it, Bill, here again is the thing you need to explain:
“There is a counting fraud because no one can say why the 200 W is not COUNTED as a loss of energy from the GP, when the SB law says it should be.”
Hey, if you can’t explain it, then just admit it.
You can’t explain it.
And we will then understand that your approval of it does not require it making any sense or being reality-based at all.
“These guys are so dense and so inculcated they can’t see how stupid they are talking!!”
Yes, Bill…especially when they pretend no answer has been given, whilst simultaneously misrepresenting the ones that have been!
Nate says:
”This is hilarious!”
And yet Bill again evades explaining the missing emissions and accounting fraud!
When you gonna actually attempt Bill?
——————————
LMAO! Why do I need to explain it? In one sentence you said it was fraud that it was missing ”There is a counting fraud because no one can say why the 200 W is not COUNTED” and in practically the next sentence you complained of ”400 W output is 1LOT violation”
How can it be missing and yet be there? You are the big advocate of energy loss from backradiation where is your proof? Oh thats right you don’t have any. In your little authoritarian world it is on the peons to prove you are wrong.
LMAO! Why do I need to explain it? In one sentence you said it was fraud that it was missing There is a counting fraud because no one can say why the 200 W is not COUNTED and in practically the next sentence you complained of 400 W output is 1LOT violation
How can it be missing and yet be there?”
You have no reading comprehension, Bill. Quote me in context.
As I pointed out, IF. IF, IF, the missing 200 W is counted properly and not hidden in some off-shore account, there would be a 1LOT violation. Thus the temperatures DREMT desires cannot be correct!
This is yet more evasion tactics. It should be very easy for you to explain where the missing energy went. And if you can’t, then you need to report this transaction as fraud.
But its obvious, Bill, that you cannot account for the missing 200 W.
Your boss at the auditing firm would never allow you to let obvious fraud like this go unreported.
“You are the big advocate of energy loss from backradiation where is your proof?”
The proof is the SB law, Bill, which YOU and DREMT have quoted and used many times.
If a surface is warm and black, then it emits according to the SB law. The surface of the GP is purported to be 244 K, then it emits 200 W/m^2.
DREMT COUNTED the SB emissions of the BP as outputs (losses), and required them to balance with the energy inputs, to satisfy 1LOT.
https://www.drroyspencer.com/2022/06/uah-global-temperature-update-for-may-2022-0-17-deg-c/#comment-1324744
But the SB emission of the GP toward the BP is not counted as a loss. Why is it NOT COUNTED in the energy balance of the GP, as it was for the BP?
None of the excuses given so far make any logical sense.
1. VF = 1?. Red herring. VF does not make emissions vanish. They are still emitted and still go somewhere. In this case, because VF with BP is 1, they all went to the BP and were absorbed because it is a black body.
2. The BP is a charcoal mirror and reflected it?
Pullleeez!
3. Then the tacit acknowledgement that there is an energy balance problem with the GP, but ‘it doesnt matter’ because all energy in the end gets emitted to space?
Obviously it DID MATTER for the BP, and thus it matters for any object, even the GP.
Sorry, nobody, not even DREMT, gets to pick and choose when to apply the 1LOT and when not to.
Nate says:
As I pointed out, IF. IF, IF, the missing 200 W is counted properly and not hidden in some off-shore account, there would be a 1LOT violation. Thus the temperatures DREMT desires cannot be correct!
This is yet more evasion tactics. It should be very easy for you to explain where the missing energy went. And if you cant, then you need to report this transaction as fraud.
But its obvious, Bill, that you cannot account for the missing 200 W.
————————-
Wrong Nate. Its not hidden in an offshore account. Its right in front of you in the 400w/m2 you already acknowledged you saw. How can a GP receiving and emitting 400w/m2 be emitting 200w/m2 someplace else? That would be a violation of 1LOT.
——————
——————
——————
——————
Nate says:
You are the big advocate of energy loss from backradiation where is your proof?
The proof is the SB law, Bill, which YOU and DREMT have quoted and used many times.
————————–
No it doesn’t Nate. SB law merely states the rate of warming that is going to occur as the heated plate warms the passive plate. It doesn’t say it gets halfway then stops. thats an extrapolation too far and is not at all mentioned in SB law.
——————
——————
——————
——————
Nate says:
”None of the excuses given so far make any logical sense.
1. VF = 1?. Red herring. VF does not make emissions vanish. They are still emitted and still go somewhere. In this case, because VF with BP is 1, they all went to the BP and were absorbed because it is a black body.”
——————————
VF doesn’t make any emissions vanish Nate. If VF is less than one that means the emissions went someplace else other than the plate. VF is very closely related to the inverse square distance law.
——————
——————
——————
——————
Nate says:
2. The BP is a charcoal mirror and reflected it?
—————————-
Its well known that albedo increases, and emissivity decreases with a perfectly flat surface. For charcoal to be a mirror it must be very well polished.
——————
——————
——————
——————
Nate says:
”Pullleeez!
3. Then the tacit acknowledgement that there is an energy balance problem with the GP, but it doesnt matter because all energy in the end gets emitted to space?
Obviously it DID MATTER for the BP, and thus it matters for any object, even the GP.
Sorry, nobody, not even DREMT, gets to pick and choose when to apply the 1LOT and when not to.”
—————————————–
You are right nobody does and that includes you. These matters can only be solved by actual demonstration. SB law discusses what has been observed. Extrapolations not demonstrated doesn’t rise to the level of law and thus it is in the realm of personal choice.
Smart ones whom have this as the primary concern will quit their job and go offgrid and learn the arts of survival. Smart ones not overly concerned will continue to guide their own lives to what they perceive to be the wisest choice.
Dumb ones are like children who expect somebody else to pave the way for them.
“Wrong Nate. Its not hidden in an offshore account. Its right in front of you in the 400w/m2 you already acknowledged you saw. How can a GP receiving and emitting 400w/m2 be emitting 200w/m2 someplace else? That would be a violation of 1LOT.”
I saw? Nope never did Bill. It is recieving 200 W/m2. You know very well DREMT claims it is only emitting 200 W/m2 on ONE side, and you keep defending this but still cannot explain it.
And now pretending to be confused is just the latest evasion tactic.
“VF doesnt make any emissions vanish Nate.”
Correct.
VF determines where the emissions end up.
“VF determines where the emissions end up.’
Exactly.
Where they go is irrelevant to the GP having lost this energy.
The GP still emitted this energy and it must be counted as a loss.
Any loss of energy establishes a different equilibrium Nate. You can only have a full equilibrium with zero loss of energy.
relevance?
The relevance is DREMT counted it as warming the cooler object. You want to count it as warming the warmer object.
“The relevance is DREMT counted it as warming the cooler object. You want to count it as warming the warmer object.”
It seems I have to refocus you on whats being discussed, AGAIN.
What’s being discussed is whether the SB law and 1LOT apply to the GP.
DREMT agrees with all that 1LOT applies to the BP. Thus there must be an energy balance for the BP.
SB emissions from the BP are counted as LOSSES of energy and must match any GAINS of energy.
For the GP he applies different rules. Some SB emissions are NOT COUNTED as energy losses: the emissions toward the BP.
This is wrong. There is no justification for this. As you agree, VF dont help here.
It is accounting fraud.
If we properly account for all Losses and Gains on the GP with DREMTs temperatures, we find 200 W input, and 200 W x 2 sides = 400 W output. Thus we find no energy balance on the GP.
DREMT is also ok with this result, it seems, saying it does not matter.
“You want to count it as warming the warmer object.”
The emissions of the GP that hit the BP are absorbed. The end result is that the BP warms. The GP has produced an insulating effect on the BP.
And you agreed that the BP warms with the GP present!
Nate says:
””Bill says: The relevance is DREMT counted it as warming the cooler object. You want to count it as warming the warmer object.”
It seems I have to refocus you on whats being discussed, AGAIN.”
————————-
Translation: Bill is making too much sense and its time to once again enter into obfuscation mode!
————
————-
————
———–
Nate says:
”Whats being discussed is whether the SB law and 1LOT apply to the GP.
DREMT agrees with all that 1LOT applies to the BP. Thus there must be an energy balance for the BP.
SB emissions from the BP are counted as LOSSES of energy and must match any GAINS of energy.”
————————
Partially true provided that their are real losses of energy which according to SB cannot happen if a warmer is blocking those colder emissions. thats a serious exception to your declaration here that you never ever take into account.
————
————-
————
———–
Nate says:
”For the GP he applies different rules. Some SB emissions are NOT COUNTED as energy losses: the emissions toward the BP. This is wrong.”
—————–
That would be correct as in that instance there are zero energy losses from the GP towards the BP. there is in fact a very significant energy gain from the BP to the GP.
————
————-
————
———–
Nate says:
”This is wrong. There is no justification for this. As you agree, VF dont help here.
It is accounting fraud.”
———————-
VF being equal to one as specified by DREMT insures that the GP is receiving significant and massive net energy from the BP.
————
————-
————
———–
Nate says:
”If we properly account for all Losses and Gains on the GP with DREMTs temperatures, we find 200 W input, and 200 W x 2 sides = 400 W output. Thus we find no energy balance on the GP.”
—————
There would only be a 200w/m2 loss from the side of the GP if and only if the BP was 0K and unheated by the sun. Check your SB calculations on that Nate and come back if the results come out different.
What we are talking about is proper accounting Nate not your bullshit accounting ignoring GP energy gains from the BP.
“That would be correct as in that instance there are zero energy losses from the GP towards the BP. there is in fact a very significant energy gain from the BP to the GP.”
If so, then the BP must be warmer than the GP, according to 2LOT.
But DREMT claims they are at the same temperature, so that is obviously incorrect.
“What we are talking about is proper accounting Nate”
One can look at the accounting in different ways.
The BP is emitting according to the SB law, sigma*T(bp)^4
The GP is emitting according to the SB law, sigma*T(gp)^4
The way you are looking at it is NET = sigma*(T(bp)^4 -T(gp)^4), which is also perfectly valid.
And yes there is a NET flow of energy from BP to GP.
BUT, if we are at equilibrium, then all inputs and outputs from a body must sum to zero.
Nate says:
”If so, then the BP must be warmer than the GP, according to 2LOT.
But DREMT claims they are at the same temperature, so that is obviously incorrect.”
———————————-
I was simply answering that question based upon your premise that GP started out at 244k and the BP started out a 290k. In that situation there was no energy loss occurring for the GP countering your claim that there was.
Now it appears you are accepting I was right and you were wrong.
And so now you want to argue that the GP can’t warm despite absorbing an extra 200w/m2? You are all over the place like a soup sandwich Nate!
“I was simply answering that question based upon your premise that GP started out at 244k and the BP started out a 290k. In that situation there was no energy loss occurring for the GP countering your claim that there was.”
Not my premise, Bill. Again you have gotten yourself thoroughly confused.
DREMTs premise is that the BP and GP equilibrate with both at 244 K.
That is what we are discussing. Those equilibration temperatures, and the resulting SB emissions from the BP and GP require accounting fraud.
Those temperatures cannot produce a net flow of energy from the BP to the GP.
For confusion prone people, lets review what the fraud is.
With just the sun providing 400 W/m^2 to the BP. DREMT claims it reaches 244 K. It radiates 200 W/m^2 from BOTH sides. There is energy balance.
Lets assume its area is 1m^2.
As he argues, it is receiving 400W/m^2 * 1m^2 = 400 W input.
It is radiating 200 W/m^2 x 2 m^2 = 400 W of output. 400 W -400 W = 0. 1LOT is happy.
Everyone agrees.
Bring the GP in. He claims that both the BP and GP equilibrate at 244 K.
The GP is receiving 200 W from the BP. But it is emitting 200 W from two sides. Thus it has 200 W input and 400 W output and no energy balance. 1LOT is not satisfied.
But DREMT claims that the GP is not able to ‘lose energy’, IOW emit, the 200 W in the direction of the BP. Thus this 200 W of emission from the GP is NOT COUNTED.
This is the accounting fraud, Bill.
Now we can revisit the BP. It is receiving 400 W from the sun. It is also receiving 200 W from the GP because VF=1. So it is receiving a total of 600 W.
It is emitting 200 W from both sides for a total of 400 W. Thus it has 600 W input and 400 W output and no energy balance. 1LOT is not satisfied.
But, for no apparent reason, DREMT wants us to ignore 200 W of input to the BP from the GP.
Again, this is accounting fraud, Bill.
Nate says:
The GP is receiving 200 W from the BP. But it is emitting 200 W from two sides. Thus it has 200 W input and 400 W output and no energy balance. 1LOT is not satisfied.
This is the accounting fraud, Bill.
—————————
Nope! There is zero net output from the sides the GP and BP face each other Nate so DREMT is not counting any of that as energy losses as you are.
Those two plates are in equilibrium and are serially emitted the energy they have between each other with zero loss so 1LOT is satisfied.
You have to acknowledge the serial nature of the emissions here as the warming progression if there was one the GP had to receive an extra photon before it can send an extra photon.
Nate says:
Now we can revisit the BP. It is receiving 400 W from the sun. It is also receiving 200 W from the GP because VF=1. So it is receiving a total of 600 W.
————————–
You are a bad accountant Nate. There is a transaction here. BP spends $200 here that goes to GP and GP gives $200 back in exchange. They each then spend $200 into space, with zero return, from the $400 that came from the sun.
And you are claiming $600 of income on the part of the BP. Accountants would call that total ‘revenue’ not income.
Your accountants will have to make an adjustment to your financial statements as your net income was $0 as you necessarily spent every dime you earned during the accounting period. That assumes of course you already had 244k in the bank when your accounting period started.
Shoddy accounting Nate is not making your case. You are fired as the bookkeeper. It is fraud to churn the books and try to create income out of one side of a transaction that always has two sides to it.
thats why accountants use double entry bookkeeping.
Bill,
You dont like my way of counting the inputs and outputs from individial objects, but that is what 1LOT demands.
1LOT keeps track of the energy gains and losses of objects to make sure their internal energy is not changing without a cause.
So explain your accounting for the GP, all energy inputs and outputs please.
And again, earlier you agreed that the GP caused the BP to warm.
You are still not being consistent!
“You are a bad accountant Nate. There is a transaction here. BP spends $200 here that goes to GP and GP gives $200 back in exchange. They each then spend $200 into space, with zero return, from the $400 that came from the sun.”
So as you have it, the BP is emitting 200 but receiving 400!
While the GP is emitting 200 but receiving 0!
So again this is a double 1LOT failure!
Nate I don’t know how to explain it to you more simply. 400w is available. The BP gets it all and sends 200w in two directions because its a point source energy.
The GP is ‘conductive’ and warms to 244k as 200w passes through the plate.
So you are left with a unit of two panes that sends off the 200watt/m2 in two different directions, never to be seen again.
SBLaw does not begin to tackle problems of objects like a dual glazed unit.
You agree that 200 goes in two directions from the blue plate from a point source heating source that does not obstruct cooling in either direction (FV=0)
Then a GP is introduced. In space the GP can warm by radiation alone. So its by definition has an FV=1 with the BP and it warms to 244k and emits 200w/m2 while losing zero joules of energy on its front side and losing 200w/m2 on its backside.
As Clausius cautioned its better to think in terms of flows of energy lost not compensated flows. Indeed thats exactly what accountants must consider to a tee.
In electromagnetics I can believe, DREMT can believe, and you can believe what you want.
I will stick with Lord Kelvin on this: ”I am never content until I have constructed a mechanical model of the subject I am studying. If I succeed in making one, I understand, otherwise I do not”
and ”I often say that when you can measure what you are speaking about, and express it in numbers, you know something about it; but when you cannot measure it, when you cannot express it in numbers, your knowledge is of a meagre and unsatisfactory kind; it may be the beginning of knowledge, but you have scarcely, in your thoughts, advanced to the stage of science, whatever the matter may be”
But all that said there is nothing particularly troubling about DREMTs position on the matter and it has a certain attractiveness that caused me to admit I was wrong in my analysis leading me to a different conclusion (i.e. using a different environment of an atmosphere separated by FV=1 solid plates)
DREMTs analysis seems cleaner and completely consistent with all the relevant laws mentioned here. You simply want to statically enforce those laws on a dynamical system. As Lord Kelvin noted:
”Now I think hydrodynamics is to be the root of all physical science, and is at present second to none in the beauty of its mathematics”
DREMTs description of radiation is based upon the same concepts as hydrodynamics with pressure and resistance and heat generation so being in the company of Lord Kelvin puts him in very good company. I can’t say the same about you and Kevin Trenberth.
“So you are left with a unit of two panes that sends off the 200watt/m2 in two different directions, never to be seen again.”
Sure, YOU and DREMT would like to treat the two plates as a unit and ignore what goes on between the plates, and pretend, without any justification whatsoever, that they are NOT individual plates.
But 1LOT has no such luxury. 1LOT must be satisfied for any object, the BP, the GP, or both together.
Each of these objects must have an energy balance, if they remain at constant T, which means a constant internal energy.
Just as any bank account cannot hold a fixed amount of funds unless the inputs and outputs to it balance.
You claimed that “BP spends $200 here that goes to GP and GP gives $200 back in exchange.”
Thus there is no net $ transfer from the BP to the GP, according to you.
“They each then spend $200 into space, with zero return”
So here you have the GP emitting $200 to space and not getting any from the BP to replace it!
But you think its internal account is constant. You are now unwittingly committing accounting fraud!
The BP is receiving $400 and spending $200 to space. So the BP is gaining $!
Again, another accounting fraud, Bill.
“Then a GP is introduced. In space the GP can warm by radiation alone. So its by definition has an FV=1 with the BP and it warms to 244k and emits 200w/m2 while losing zero joules of energy on its front side and losing 200w/m2 on its backside.”
Now here you are again contradicting your previous sensible, correct claims that the BP would warm under these conditions because the GP was insulating it, and the GP would be at a lower temperature, intermediate between the BP and space.
Why?
Nate says:
Sure, YOU and DREMT would like to treat the two plates as a unit and ignore what goes on between the plates, and pretend, without any justification whatsoever, that they are NOT individual plates.
—————-
Thats a lie Nate. Nobody is ignoring what is going on in between. The two plates are at equilibrium with each other. That means both are emitting 200w/m2 at each other for a net difference to each plate of zero.
—————-
—————-
—————-
—————-
Nate says:
”But 1LOT has no such luxury. 1LOT must be satisfied for any object, the BP, the GP, or both together.
Each of these objects must have an energy balance, if they remain at constant T, which means a constant internal energy.
Just as any bank account cannot hold a fixed amount of funds unless the inputs and outputs to it balance.
———————–
The accountant investigates this issue and finds everyday the bank account balances despite there being millions or billions or trillions of transactions occurring with money going out and in.
So the account remains full on a daily basis when the bank report is made each day. Even if its not full on a microsecond by microsecond basis
You are making an argument that calls for an experiment to verify or reject that indeed the bank account sits at 244k.
There does not seem to be a fundmental concept in physics that establishes back conduction as an electromagnetic effect without air gaps between molecules (just spaces). The fact you can produce such an effect with air gaps rather than spaces doesn’t say anything about it existing in both emptied and filled spaces.
If you use conduction as the model which is the best representation I can think of for electromagnetic transfer across spaces it seems odd it would exist in one versus the other. Perhaps you could find some evidence of that by repeating the experiments done by S&B and explaining how S&B covers your claims.
Extrapolating it mathematically isn’t evidence. As Lord Kelvin points out ‘measuring’ effects is the foundation of science based upon mathematics and we are talking about something which has no evidence of having been measured.
“So the account remains full on a daily basis when the bank report is made each day. Even if its not full on a microsecond by microsecond basis”
If, as you claim, the BP NEVER resupplies the GP account, but the GP keeps sending $ to space, then its value must continuously drop.
Ok, you are definitely FIRED as my auditor!
“You are making an argument that calls for an experiment to verify or reject that indeed the bank account sits at 244k.”
This is precisely the point. The GP, not receiving any energy from the BP but continuously losing energy to space MUST COOL.
And the BP, receiving more energy from the sun than it is losing to space MUST WARM.
In the original GPE solution that is exactly what occurs. The BP warms to 262 K, the GP cools to 220 K.
Then there is a T difference between the plates. Then there can be a net flow of heat (energy) between the plates. The 1LOT and 2LOT are satisfied.
“There does not seem to be a fundmental concept in physics that establishes back conduction as an electromagnetic effect without air gaps between molecules”
Red herring!
“Extrapolating it mathematically isnt evidence.”
Bill, when the numbers keep on not adding up, and you find yourself making increasingly absurd excuses for that, then, as an auditor, or just as a logical thinker, you are supposed to figure out that there is a problem.
Not true Nate. One has to measure the temperature of the GP at the end of its warming cycle to know the answer. You are like a water diviner with a stick here trying to convince people to believe you.
“One has to measure the temperature of the GP at the end of its warming cycle to know the answer.”
As if temperature can’t be measured!?
This is exactly what I mean by ‘making increasingly absurd excuses’.
sure the temperatures of the plate can be measured at the point eqiulibrium is nigh.
Are you requiring DREMT to make measurements?
No.
Because this is a thought experiment.
It doesnt require a measurement to know that 200 W out and 0 W in cannot give a steady temperature.
It only requires logical thought and arithmetic to figure out that DREMT’s solution is impossible.
We know thats what you believe Nate. but as you point out its merely a thought experiment.
Maybe you will win the Nobel Prize since now to win one all you need is enough political correctness.
You lost this argument on fraudulent accounting, Bill.
Arithmetic is apolitical.
Sorry Nate one cannot claim fraudulent accounting when nobody has yet reported the actual temperature of the BP. All that is going on here is discussion of the various possibilities of what the outcome will be. You have produced zero evidence of the outcome so it is premature to claim you are right.
Bill, accounting rules are established. Arithmetic rules are established. Just as physics laws like SB law, 1LOT and 2LOt are well establshed.
YOU correctly explained the transaction here.
“There is a transaction here. BP spends $200 here that goes to GP and GP gives $200 back in exchange. They each then spend $200 into space, with zero return, from the $400 that came from the sun.”
I have simply pointed out that transaction creates an impossible result that the GP is emitting $200 per unit time into space, and receiving NOTHING from the BP to replace it!
And this is a correct analogy to the energy transaction between the BP and GP and space.
This is simply wrong, an impossible solution where the plates are both at 244K.
And the bizarre thing is that YOU previously understood this.
Allow me to help you not repeat yourself, Bill:
https://www.drroyspencer.com/2022/06/uah-global-temperature-update-for-may-2022-0-17-deg-c/#comment-1325210
You are quite right. I am only an absolute beginner on this. Please help me understand all these sophisticated maths.
For instance, I’m not sure I understand what you mean when you say that the lit side of the plate has the area of its total surface area.
Could you clarify your proposition, pretty please with sugar on it?
Obvious typo (keyboard is getting old and frequently a key doesn’t register) and my auto correction software chose the wrong word.
It should read: ”. . . .but its lit side is half the area of its total surface area”
Thanks, Bill!
So the lit side of a plate is half the area of its total surface area. But now there is this mystery to resolve:
What is the shadow doing here?
I’m sure there’s no great mystery behind it for a learned man such as you. Please be patient. I’m an absolute beginner.
since you know what the shadow of a sphere is. . . .why can’t you manage the math of flux reaching the surface? Were you a straight humanities student in college?
I’m not asking what the shadow is, Bill. I’m asking what the shadow is doing in the model. Graham’s difficulties are not mathematical, they are conceptual.
You know what’s a specification, right?
Thank for spilling all his beans with your corrigendum!
https://www.drroyspencer.com/2021/04/an-earth-day-reminder-global-warming-is-only-50-of-what-models-predict/#comment-680669
https://www.drroyspencer.com/2022/06/uah-global-temperature-update-for-may-2022-0-17-deg-c/#comment-1321429
That should be enough for most honest, rational people to understand.
https://www.drroyspencer.com/2022/06/uah-global-temperature-update-for-may-2022-0-17-deg-c/#comment-1325201
This should be enough for any rational human bean to realize that Graham is just shuffling around terms without any understanding of what he’s shuffling.
Nobody understands what your problem is, Willard.
You’re the one with a problem, Graham.
Look at you. You are supposed to have dropped the stick. Here you are, stalking me.
If I calculate that 2 = 4, there is a problem. Which one? Lots of theories, but basically two most plausible sources of error:
– miscalculatation
– misspecfication
Assume that my calculations were correct. What is left?
You got it – misspecification.
If your calculations lead you to say that 480 = 240, then there is a problem with how you framed the problem. It *could* be possible that “=” does not mean equality anymore, but I really doubt it. I’d rather work with another energy balance model than having to revise equality.
So, in a nutshell, you’re trolling. Please stop.
“Flux is not conserved, but energy is, because the area the Earth absorbs the energy over is half that of the area that the energy leaves from.”
> The incoming energy flux has no temperature. Connecting energy flux with a blackbody temperature only makes sense for an object in thermal equilibrium *radiating* that power. And even then, that flux has no temperature. The flux may be 100 W/m^2 1 meter from the object, but then it will be 25 W/m^2 2 meters from the object. (Assuming 1/r^2 type radiation.) Is the object suddenly cooler?? Is the flux cooler?? Nope, its just not how an energy flux connects to a temperature.
https://andthentheresphysics.wordpress.com/2021/04/25/mind-your-units/#comment-190962
Worthless Willard, your reference site is about as worthless as you are.
What is the area and surface emission from an object that would provide 100 W/m^2 at 1 meter, and then 25 W/m^2 at 2 meters?
You don’t understand ANY of this. You’re just a worthless troll.
Keep reading, silly Pup:
> So the assertion that the earth should be 303 K because 480 W/m^2 is hitting it is nonsense. Who cares what the flux *in* is. The only thing setting the blackbody temperature of the earth is how much energy it is radiating out in equilibrium. So total energy in, total energy out radiating out over the total surface area of the earth.
Op. Cit.
“Who cares what the flux *in* is…”
Willard, apparently, if the last few days discussion are anything to go by. He has been in permanent denial that it could possibly be 480 W/m^2 for about a year, falsely accusing all sorts of nonsense, including misspecification. Now it seems he has turned a corner, and is quoting from people who understand that it’s 480 W/m^2, but who are saying, “so what”?
I suppose it is progress.
Graham *still* does not get that his silly model is still being questioned. But he *really really* thinks that people can’t calculate and that he made no mistake in his calculations. So everything is A-OK.
Instead of revising his model, he’s ready to change the meaning of what “=” means.
He’s that thick.
Since I have never said that 480 W/m^2 = 240 W/m^2, you are barking up the wrong tree again. As I said:
“Flux is not conserved, but energy is, because the area the Earth absorbs the energy over is half that of the area that the energy leaves from”.
And what is the energy balance model of the Earth that allows you to divide by 2, Graham?
Also, you seem to have forgotten the “fluxes don’t add” line.
https://www.drroyspencer.com/2022/06/uah-global-temperature-update-for-may-2022-0-17-deg-c/#comment-1321429
Willard continues to make a fool of himself here and on other forums by not working through the geometry.
Good to see you back, Bill.
Since you’re a geometry guru, please help me understand what Binny means by this:
Also, if you could confirm that piR^2 is indeed the area of the shadow of the Earth, that would be great.
Come to think of it, perhaps Graham simply does not realize that his
is not an equation.
It is an assignment.
An equation contains two mathematical sides, whereas Graham’s assignment has a variable name on one side.
He certainly does, Bill, and he shows no signs of stopping.
A blast from Graham’s past:
[GRAHAM] If you had the input to the Earth as 240 W/m^2 and the output from the Earth as 240 W/m^2 then you would effectively be saying that the sunlight magically falls across the whole sphere.
[AT] No, you wouldn’t. The input to the Earth is clearly 240 W/m^2. That it all falls on one hemisphere doesn’t change this. Of course, if you wanted to be pedantic, you could say the input is 480 W/m^2 on one hemisphere and 0 W/m^2 on the other, but that just averages to an input of 240 W/m^2.
https://andthentheresphysics.wordpress.com/2021/04/25/mind-your-units/#comment-190840
Willard says:
[GRAHAM] If you had the input to the Earth as 240 W/m^2 and the output from the Earth as 240 W/m^2 then you would effectively be saying that the sunlight magically falls across the whole sphere.
[AT] No, you wouldnt. The input to the Earth is clearly 240 W/m^2. That it all falls on one hemisphere doesnt change this. Of course, if you wanted to be pedantic, you could say the input is 480 W/m^2 on one hemisphere and 0 W/m^2 on the other, but that just averages to an input of 240 W/m^2.
————————
You still don’t get the scam Willard?
I only know how Joe conned Graham, Bill:
https://andthentheresphysics.wordpress.com/2021/04/25/mind-your-units/#comment-190912
That’s when Graham when for “but the Earth rotates,” as if it changed anything to the averages he was dealing with, most probably unknowingly.
> when for
Went for. Silly autocorrect.
Willard says:
The whole schtick is that Joe and apparently [Graham] are trying a fast one the flux is higher, therefore hotter and climate scientists divide by 2 to make it colder! Thats nonsense.
———————
You are making a claim here that isn’t supported by the equations you are contesting. the equations are correct and no amount of snivelling and accusations of motivations changes that fact.
And certainly offering up the equations isn’t evidence of your claim that Joe and DREMT are claiming ‘mean’ daily temperatures are higher. Mean daily high temperatures are higher than the mean daily average temperature.
If I use the daytime flux mean high temperatures would be 30C or about 86F. Using the mean annual global temperature of 288k apparently arising from climate records or 15C then the mean low temperature would be 0C or 32F.
Perhaps the first step would be to looking at the problem would be to look at what temperature records have for mean high and low temperatures globally.
So I am not seeing anything that has been posted leading to some kind of conspiracy theory you are claiming.
But what I do see it leading to is a partial validation of the greenhouse effect not being based upon backradiation but instead a known insulating effect for which there are zero unaccounted for validated radiation flows.
I say a partial validation because it is not clear that the use of emissivity = 1 will correctly state the non-atmosphere expected temperature of the surface of the earth and the poor distribution of climate stations may not correctly state the mean temperature of the earth primarily by a combination of UHI error and the dramatic under representation of inhospitable environments.
Bill, Bill,
You’re just saying stuff.
Here’s a simple comment for you to get:
https://andthentheresphysics.wordpress.com/2021/04/25/mind-your-units/#comment-191102
Please stop saying stuff.
Willard insulation does not cause a greenhouse effect.
Once you realize that maybe you can start giving some consideration to how what we currently believe about the atmosphere needs some additional research.
Bill this is not about the greenhouse effect.
This is about model specification. More precisely, this is about the incapacity of Sky Dragon Cranks to come up with an alternative model. Joe has no model of the energy balance for the Earth. Neither does Graham.
Without a model,there is nothing to discuss.
Yet Sky Dragon Cranks soldier on.
At best hey are trolling.
At best.
…and yet, 480 W/m^2 input over the hemisphere and 240 W/m^2 output over the sphere does balance energy in and energy out.
As Gator once said:
https://andthentheresphysics.wordpress.com/2021/04/25/mind-your-units/#comment-191104
Graham just does not care.
He soldiers on.
Is this your way of acknowledging that 480 W/m^2 input over the hemisphere and 240 W/m^2 output over the sphere does conserve energy? Plus acknowledging that there was no misspecification? Just let me know when you are prepared to admit you have been wrong all this time, and I will address his point.
Graham simply cannot let it go –
Physicists all around the world hid for too many years the truth about the greenhouse effect, about the Earth’s effective temperature, about the Moon.
Never fear. Graham may not be able to write or even read equations, but he’s the Master Argumenter. Him and his commando of Sky Dragon Cranks will save us from these conspiracies.
All our bases belong to Graham.
So you cannot admit you were wrong.
I never said what you think I said, Graham.
And here’s one time where you failed to realize it:
[TS] Another quote from Joe: “The true, and physically accurate average of the system, is that half of the surface of the Earth absorbs twice as much energy as the entire surface of the Earth radiates.” Let’s see Graham explain that one away!
[G] Yes, TS, that is wrong as written. It should say, “The true, and physically accurate average of the system, is that half of the surface of the Earth absorbs twice as much *flux* as the entire surface of the Earth radiates.”
[W] And that true, physically accurate average of the system, doubles the power of the Sun compared to scientists who divide by four instead.
https://andthentheresphysics.wordpress.com/2021/04/25/mind-your-units/#comment-190527
So not only you know better than Joe, but Joe cannot have thought or said something that you can’t compute.
You read like a homing missile. No wonder you never learn anything.
…you cannot admit you were wrong.
Wrong about what, Graham?
I re-wrote a whole paragraph thanks to your feedback. You weaponized this in your laundry list earlier. That’s what we call a double bind.
You’re the one having issues admitting you’re wrong here.
You don’t have a model. You can’t find Joe’s model. Your amendments at best change absolutely nothing to the model we already have.
At best. That is, when you’ll produce a damn model. You could use the hints I left you, e.g.:
All these games because you can’t even concede or perhaps conceive that you’d need to write 400 + 0 = 200 + 200!
An equation. Not a definition. An equation, with quantities on the two sides.
Do you realize that you have yet to write ONE equation with quantities on two sides?
You *really* are not half as brilliant as you think you are, Graham.
So good luck trying to revise physics with that.
…cannot admit you were wrong.
Wrong about what, Graham?
I just proved you wrong on that, BTW.
And I can do so again:
Three conjectures follow from you being wrong about that:
First, you are powered by 386, and are once again acting like a mark because of it.
Second, you are using “you are wrong” as a bait and switch to rinse and repeat your fixed point du jour.
Third, you cannot accept that you will never be able to revolutionize science with that kind of behavior.
Please seek help.
https://www.drroyspencer.com/2022/06/uah-global-temperature-update-for-may-2022-0-17-deg-c/#comment-1325921
You are utterly incapable of ever admitting you were wrong.
Citing comments when we can only see you repeat something you said at least a thousand times might not be the most optimal way to establish where I am wrong, Graham.
You’d be wrong to think that.
You are utterly incapable of ever admitting you were wrong.
I just proved you wrong, Graham.
Twice.
In this thread alone.
For a guy who insists in being right, don’t you think you should be more circumspect?
…you are utterly incapable of ever admitting you were wrong.
Agreed, Graham –
I am utterly WRONG on something you have so far failed to make me opine. You’re that powerful.
Keep telling me I’m wrong. It might work some day.
You’re like Gold, Graham. You’re industrible. Always believe in –
1) 480 W/m^2 input over the hemisphere and 240 W/m^2 output over the sphere does conserve energy. You were wrong to suggest otherwise.
2) There is no misspecification. You were wrong to suggest otherwise.
3) My equations are correct. You were wrong to suggest otherwise.
You cannot ever admit you were wrong, about the things you already knew full well I meant when I was repeating over and over again that you cannot ever admit you were wrong.
Of course there is misspecification, Graham.
You. Do. Not. Even. Have. A. Real. Equation.
That is just for starters.
Perhaps you should cite your model.
wow is he really deluding himself or is it just desperation?
He’s just a complete joke, Bill.
AHAHAHAH
Sky Dragon Cranks are so funny.
Oh, I just recalled –
Where is your energy balance model of the Earth, Graham?
Willard, please stop trolling.
You can now run away, Graham.
#2
Willard, please stop trolling.
Bill and Graham soldier on.
Another easy win.
Time to lift some plates.p
#3
Willard, please stop trolling.
As always, something disturbs me in this eternal discussion:
” The 1.22 x 10^17 Watts comes from taking the solar constant (Joe typically uses 1,370 W/m^2) and multiplying it by the surface area of the disk (pi x r^2) intercepting the Suns energy, then multiplying the result by 0.7 to factor in albedo. ”
This disk blah blah is nonsense.
Sun’s energy is intercepted by Earth’s lit hemisphere, and by nothing else.
That the surface coefficient used everywhere is pi*R^2, has nothing to do with whichever disk.
This coefficient comes from two multiplied cosine weightings:
– one due to the incident solar energy becoming weaker from the Tropics to the Poles
and
– one due to increased absorp-tion and scattering from the Tropics to the Poles, governed by the Beer-Lambert law.
Integrating cos(angle)*cos(angle) over the hemisphere gives exactly a weighting factor of 0.5.
Applying this weighting to the hemisphere’s surface (2*pi*R^2) finally gives pi*R^2.
*
That somebody disputes the simple, trivial fact that energy per m^2 absorbed by a hemisphere is exactly twice that emitted by a full sphere, wonders me a bit indeed.
It wonders us all, Bindidon.
Us all indeed:
https://andthentheresphysics.wordpress.com/2021/04/25/mind-your-units/#comment-190993
“That somebody disputes the simple, trivial fact that energy per m^2 absorbed by a hemisphere is exactly twice that emitted by a full sphere, wonders me a bit indeed.”
“Below is the integral I did to show that if you properly integrate the incoming solar flux over the hemisphere that faces the Sun, you get the same answer as simply considering the cross-sectional area.”
So what?
“So what?”
Graham, apparently, has been in permanent denial that the division by 4 for about a year, falsely accusing all sorts of nonsense, including flat earth this or that. Now it seems he has turned a corner, and is quoting from people who understand that we need a division by 4.
…for the output, not the input.
See, Graham?
You are making the same mistake over and over again.
Input and output come from the same equation.
…is what you think because you are obsessed with your energy balance model equation, and are unable to open your mind to see outside of that framework.
Not obsession, Graham.
Specification.
No model energy balance model, nothing to discuss.
We both misread what Binny said, BTW.
I think this:
“That somebody disputes the simple, trivial fact that energy per m^2 absorbed by a hemisphere is exactly twice that emitted by a full sphere, wonders me a bit indeed.”
Was clear enough.H
“Applying this weighting to the hemisphere’s surface (2*pi*R^2) finally gives pi*R^2” was clearer, Graham.
You don’t actually have a point, do you?
Yes, Graham – pi*R^2 is the area of a “blah-blah-disk.”
I can add this other point:
Binny said one thing. His formalism showed another. You went for what Binny said, not what he showed.
And then you wonder why I don’t think you grok equations?
Of course pi*R^2 is the area of the disk. And?
None of Bindidon’s “formalism” in any way contradicts this:
“That somebody disputes the simple, trivial fact that energy per m^2 absorbed by a hemisphere is exactly twice that emitted by a full sphere, wonders me a bit indeed.”
Which is clearly a jab at you.
Applying this weighting to the hemispheres surface (2*pi*R^2) finally gives pi*R^2 clearly knocks down whatever point you think you might have, Graham.
Blah-blah-disk/sphere = 1/4
Yes, 1/4. And?
Binny’s claim on which you stake your actual trolling is harder to support once we realize that the “blah-blah-disk” is actually what results from Binny’s own calculation, Graham. Take a look at equation (1):
https://imgur.com/a/bktLC3Y
Rings any bells? Looks a lot like the model on my post.
And once we realize that the Earth receives energy on a blah-blah-disk, it emits energy on a sphere, and we know that the ratio between a blah-blah-disk and a sphere is 4, the blunder behind division by 2 is rather obvious.
“But it’s for what comes in” is just a cope.
“And once we realize that the Earth receives energy on a blah-blah-disk, it emits energy on a sphere, and we know that the ratio between a blah-blah-disk and a sphere is 4…”
…then we divide by four for the output. The input is received over the hemisphere (the total power received is the same as that which is intercepted by the disk surface area multiplied by the solar constant, and corrected for albedo), so we divide by two for the input – a shortcut which is explained in an earlier comment:
https://www.drroyspencer.com/2022/06/uah-global-temperature-update-for-may-2022-0-17-deg-c/#comment-1321429
After all, as Bindidon puts it, it’s a “simple, trivial fact that energy per m^2 absorbed by a hemisphere is exactly twice that emitted by a full sphere.”
Graham *still* cannot grok equations.
The light received over the hemisphere needs to be corrected for angles.
Once we do that, we get the area of the shadow of the Earth.
A disc. The Earth shadow.
Pi*R^2.
All this *before* we divide it by anything. But when we do, we get 1:4, not 1:2.
Remember: Graham *still* does not know when Joe divides by 2.
Graham will never learn as long as his trolling takes precedence.
He should stop.
More false accusations, from Willard. It is as I have explained, a dozen times already: 480 W/m^2 in over the hemisphere, 240 W/m^2 out from the sphere does balance energy in and energy out, just not flux….but there is no point spending all day repeating ourselves over and over again. If Willard cannot understand even the most basic principles, that is his loss. I am happy with the win.
🙂
Graham cannot count the number of accusations.
There is one, which is that he does not know why Joe divides by 2. And it is easily supported:
[W] My question is about the hemisphere that is supposed to be represented by 0.5: where is it when we isolate T?
[G] I don’t understand the question.
https://andthentheresphysics.wordpress.com/2021/04/25/mind-your-units/#comment-190833
So yeah, Graham still does not know why Joe divides by 2.
But then we know he can’t grok equations.
That he’s trolling is not an accusation.
That’s just a description.
No Willard, just because I was unable to understand your question because you are not very good at communicating your ideas coherently, does not prove that I do not know why there is a division by two. I clearly laid out the math as to why there is a division by two, already, and that is contained in the link in my 1:20 AM comment. So that’s false accusation 1. False accusation 2 is that I cannot grok equations. False accusation 3 is that I’m trolling.
I’m still happy with the win. Thank you.
A simpler explanation is that you do not grok the graphs Joe publishes, Graham.
Another is that you like to convert flux into temps without understanding what you need to have an energy balance model with SB and ET to do that.
Just like Gator kept repeating, and every time it went above your head.
I’m still happy with the win. Thank you.
So much winning:
https://andthentheresphysics.wordpress.com/2021/04/25/mind-your-units/#comment-190389
Yes, lots of winning. Thank you.
Graham is the WINNIEST of us all:
https://andthentheresphysics.wordpress.com/2021/04/25/mind-your-units/#comment-190521
Graham is so winner he does not even have to design a valid method.
He just wins.
Yes, I am the winner of the dispute between us, specifically. Thank you.
What imaginary dispute do you have in mind, Graham?
At best you have been in violent agreement with me all along.
I am happy with the win. Thank you.
Already tired, Graham?
I got more for you:
https://andthentheresphysics.wordpress.com/2021/04/25/mind-your-units/#comment-190565
Were you right and I wrong about that too?
Who knows? Perhaps one day you’ll realize why I keep asking you to specify an energy balance model!
It is extraordinary to watch. Willard, I am happy with the win. Thank you.
[Inevitable response in three…two…one…]
Glad that you appreciate it, Graham.
I must admit that your trolling has a je-ne-sais-quoi of deeja-voo.
Sounds like PSTing, come to think of it.
In two threads at the same time.
God you’re good.
Willard, please stop trolling.
"Is the sociologist still confused?"
Yes, Bill, as we see from Willard’s latest, he is still confused. Or, at least, he’s acting like he’s confused, in order to troll.
You can run away now, Graham.
Somebody has to be the adult, and stop the pointless back and forth. I won the argument a year ago. You are a relentless, sociopathic troll, utterly obsessed with me, to the point you are completely losing your mind, and you would just keep replying for the rest of your life if I didn’t bring it to an end. So that’s what I do. Every time, it has to end with a PST. Because otherwise, you would never stop. Have another last word, I’ll just PST it tomorrow.
You might very well have the self-awareness of a goldfish, Graham, but my own bet would be more in line with bivalves.
I offered you a way out earlier, instead you exploited Bill’s pull. And before that it was Chic’s. Let it be a lesson for them.
I award you no Climateball point, and may God have mercy on your soul.
TL;DR – you are not even wrong.
Bill and Chic completely see through you, Willard. The lesson they have learned is that you are an idiot. Now…
…Willard, please stop trolling.
Chic and Bill are Dragon Cranks, Graham. They are as opportunistic as they are amoral, each in their own adorable ways. Chic simply kept rubber stamping you without saying anything, whereas Bill did what Bill does best, which is to say stuff while gloating.
Whether it is about the Moon, the energy balance model of the Earth, or Eli’s plates, you and your fellowship are not even wrong.
You can now run away, and please stop trolling.
Thank you.
OK, Willard. Bye now!
o/
I am very happy with the win. Thank you.
How Very Adult of you, Graham!
Yes, it is. Happy with the win. Thank you.
Except that you lost, Graham.
Ask Bob.
bob said a few things, then once I and Bill had explained the situation to him, he disappeared. I would not take that as any sort of support for you, Willard. Most intelligent people see that what I am doing is nothing untoward.
Bob said the thing that makes me win, Graham.
On his first try.
Let us see if you learned your lesson.
What does the disc represent, again?
Disk surface area multiplied by the solar constant and corrected for albedo = the total power in.
Anyone can see that you are not answering the question, Graham.
The disc. What does it represent?
That is what it “represents” to me. If you have a different answer, please give it. You don’t want people reading to think you can’t answer your own question, do you?
You are not Humpty Dumpty, Graham.
The disc represents the area that receives the light from the Sun at zenith.
It is the quantity as if you took a hemisphere and then corrected for angles.
But wait – was it not exactly what Joe wanted?
No, Willard. Postma wanted the total input power (disk surface area multiplied by the solar constant and corrected for albedo) to be divided by the hemisphere surface area, rather than the sphere surface area. 480 W/m^2 input flux, rather than 240 W/m^2.
Incorrect, Graham. And I mean It in the technical sense. You are misspecifying,
Joe divides by two to satisfy something. He does not divide by two to divide by two.
He said and you said many times what the division by two represents. What was it again?
Ah yes – you want the light to fall on the hemisphere.
Yet the disc represents the hemisphere corrected for angles,
Even you should see the problem.
There is no problem apart from your apparent learning disability.
Of course there is a problem, Graham!
As Bob reminded you, no need to divide by anything to get the area for our input. Do you recall how many times you insisted that the division by 4 was for the input? What fun it was to see you demonstrate you had no idea what the disc represented!
The main point of my post to boot. The main hing I kept reminding you in the comments.
You really are a slow learner.
Dr Roys Emergency Moderation Team says:
”Disk surface area multiplied by the solar constant and corrected for albedo = the total power in.”
—————————–
Indeed that is what the disk represents. . . .and equals total power in.
Of course the disk doesn’t absorb any energy at all. the disk is totally in the shade of the lit hemisphere. All that energy is absorbed on the ‘lit’ hemisphere of the earth with a mean flux of approximately 480w/m2.
Willard appears to believe half of it is absorbed by the unlit hemisphere. . . .but he is wrong. A child can see he is wrong. Yet he persists.
Willard is completely delusional, Bill. Or, simply trolling.
> Of course the disk doesn’t absorb any energy at all. the disk is totally in the shade of the lit hemisphere.
OMFG.
Bill, you are the absolute unit of a tool.
Willard you are sounding like you are confounding solar insolation with Superman’s xray vision.
What is your theory here, that the suns rays penetrate the earths surface, travel through the earth and 50% is absorbed by the unlit hemisphere? You need to be more precise about what you are thinking as right now you are sounding like a babbling idiot.
Bill,
The expression *Earth shadow* designates a geometrical fact:
https://youtu.be/GNcFjFmqEc8
In our discussion, the disc does not refer to the surface hidden by the Earth, but to the surface that receives the light from the Sun.
The disc has the same size has the shadow. Four times one of them gives you the surface of their respective sphere.
Hope this helps.
Willard says:
The expression *Earth shadow* designates a geometrical fact:
In our discussion, the disc does not refer to the surface hidden by the Earth, but to the surface that receives the light from the Sun.
Hope this helps.
———————
Wee Willy doubles down on the superman xray vision theory. Willy the ‘shadow disk’ is in the shade of the hemisphere’s surface!
The shadow disk respresents the total power of solar insolation absorbed. The lit hemisphere is the surface that power is absorbed on.
Flux is power per square meter. Absorb it across a larger area and flux is less. Since the absorbing surface is twice the size of the shadow disk, flux absorbed is half as much as the solar flux.
The unlit hemisphere absorbs zero. I am sure this is as much of shock to you as my daddy telling me, a third grader, in 1952 that Superman didn’t fly but was held up by wires. I cried. But when I looked hard I could see the wires even on the blurry TV screens of the day so I got over it. Hopefully you will come to your senses and regain your composure too.
> The shadow disk respresents the total power of solar insolation absorbed.
Bill, Bill – that’s E_in in the following definition:
E_{in} := F_{\odot} \pi R_E^2.
Total power is the product of two terms.
Only the “\pi R_E^2” part refers to the disc.
Don’t be a goose.
He’s still going…
The joy of winning, Graham!
Please stop trolling.
You are winning an argument that is taking place in your head. You are not winning any argument taking place in reality.
The energy balance model is not in my head, Graham.
The hemisphere, when corrected for angles, is a disc.
My claim that you misspecified stands.
Willard says:
Total power is the product of two terms.
Only the \pi R_E^2 part refers to the disc.
Dont be a goose.
————————–
thats absolutely incorrect Willard!
piR^2 does not refer to a disk. Your geometry stinks! It refers to the ”base area” of a hemisphere. See link for the correct description of what piR^2 refers to.
http://tinyurl.com/bpjfyebn
The base area of a hemisphere represents the area of the sky perpendicular to the source of radiation that the cap of the hemisphere will receive from the sun.
No disks anywhere but in your imagination. . . .much less any such disks absorbing radiation from the sun nor is any radiation from the sun absorbed on the unlit hemisphere.
Your claim that I misspecified stands…in your head.
> piR^2 does not refer to a disk
Oh, Bill.
R is the radius of the sphere under consideration.
pi is the famous constant that never ends.
^2 designates the squaring function.
Put that together and you get the area of the cross section of a sphere with radius R. My source calls it a disc:
https://math.nyu.edu/~kleeman/zero_dim_ebm.html
Please stop racehorsing.
My claim that you were misspecifying was easy to support, dear Graham. It was obvious right from the start:
[K] You need to then decide what measure of surface area you are going to divide that total power by.
[W] If you want to model the Earth, the choice is rather limited.
https://andthentheresphysics.wordpress.com/2021/04/25/mind-your-units/#comment-190999
The only way to model an energy balance of the Earth is to include the Earth in our specification.
Willard says:
”My source calls it a disc:
From the point of view of the Sun, the Earth appears to be a disk”
———————–
Wrong again Willard. Your source says it ”appears to be a disk” it doesn’t at all say it is a disk because unlike you your source knows this disk to be the base of the hemisphere positioned perpendicular to the sun.
> Your source says it “appears to be a disk”
Is that a joke, Bill?
From the point of view of the Sun.
The Earth appears to be a disc.
You disagree?
Check here:
https://i.imgflip.com/58jyyj.jpg
Willard says:
”The only way to model an energy balance of the Earth is to include the Earth in our specification.”
———————-
Nobody is excluding earth in finding an energy balance. You are making a ridiculous and unsupportable claim.
Even your own team is not supporting your arguments on this. At least one had the credibility to speak up about it.
If you want to model the Earth correctly, you need to acknowledge the fact that the sunlight falls on the hemisphere, whilst at the same time radiation leaves from the entire sphere. 480 W/m^2 input over the hemisphere and 240 W/m^2 output from the sphere. Energy balances, but not flux. Do you at least understand that part yet? That would be a huge leap forward for you if you could.
And, have you acknowledged that the “consensus” thinking is that it’s 240 W/m^2 for the input as well as 240 W/m^2 for the output? In other words, it is the old “take the solar constant, correct for albedo then divide by 4” shortcut for both the input and the output. Do you get that?
> Nobody is excluding earth in finding an energy balance.
Tell that to Joe or Graham:
https://andthentheresphysics.wordpress.com/2021/04/25/mind-your-units/#comment-190386
Something something “real time” something something.
It has been a while I have seen such a splendid case of racehorsing, Bill. Keep the monkey wrenches coming!
> you need to acknowledge the fact that the sunlight falls on the hemisphere
One day you will have to acknowledge that the sunlight already falls on the hemisphere, Graham.
It’s the disc.
You’re confusing the reception of energy with its distribution along the whole surface that emits it.
Your second by second handwaving also misprepresents the fact that power is a flow.
So your answer to my questions was “no”, you still do not understand.
Not exactly, Graham.
My answer to your question was “No U”:
https://andthentheresphysics.wordpress.com/2021/04/25/mind-your-units/#comment-190521
You still are using this false opposition to evade the reality that you don’t need to divide by 2 to make the Earth receive the sunlight.
For that we have a disc.
That disc, to repeat until it gets into your thick skull, represents the lit hemisphere.
But you got an even sillier problem – you have yet to come up with an energy balance equation that discharges Joe’s division by 2 properly.
Allow me this hint: 2 times 2 equals 4.
You have one hour to find it.
Best of luck!
The disk surface area, multiplied by the solar constant and corrected for albedo, only gives you the total power in, Willard. Power is measured in Watts. If you want to know the irradiance, measured in W/m^2, you need to divide the total power by the surface area receiving said power. Hope that helps.
Yes, Graham. Power. And that power needs to be distributed along the surface of the Earth, because that’s what we’re trying to model.
An energy balance model of the Earth.
You or Joe or anyone else have absolutely no reason to stop short and just divide by 2. Certainly not by confusing that operation with calculating how much the Earth receives.
For that we have a disc.
***
You always come up with the stupidest Motte-and-Baileys imaginable:
[MOTTE] Yes, I know I can divide by 4.
[BAILEY] But that is IMPOSSIBLE.
These are incoherent stances, Graham.
Deal with it.
“Certainly not by confusing that operation with calculating how much the Earth receives.
For that we have a disc.”
The disk surface area is only involved with the calculation that gets you the total input power, as I literally just explained, and you said you understood. You need to divide the total input power by the surface area receiving said power to get the irradiance, in W/m^2. If you divide the total input power by the disk surface area you would get an irradiance of 960 W/m^2! If you divide the total input power by the hemisphere’s surface area you get 480 W/m^2 (shortcut: divide the solar constant, corrected for albedo, by 2). If you divide the total input power by the sphere’s surface area you get 240 W/m^2 (shortcut: divide the solar constant, corrected for albedo, by 4).
“[MOTTE] Yes, I know I can divide by 4.
[BAILEY] But that is IMPOSSIBLE.”
You can certainly divide the solar constant, corrected for albedo, by 4 to get 240 W/m^2 for the input flux and do the same to get 240 W/m^2 for the output flux. That is the “consensus” way to get the flux in and flux out for the Earth, and it is done because the Earth rotates, so over time the whole surface of the Earth receives the incoming power. So no, it is not “IMPOSSIBLE”. It is just more realistic to note that, in real time, only the lit hemisphere receives the incoming power but the whole Earth emits. So, 480 W/m^2 input over the hemisphere, 240 W/m^2 output over the sphere, in real time. Energy balances, but not flux.
The 240 in and 240 out is a spatial and temporal average.
The 480 in and 240 out is just a spatial average.
> You need to divide the total input power by the surface area receiving said power to get the irradiance, in W/m^2.
What receives said power is the Earth. That is why we divide by 4, or more precisely by 4piR^2.
If you only divide by 2, you get stuck with a 2 on the right side of the equation: remove 2 \pi R_E^2 from 4 \pi R_E^2 \sigma T_E^4 and you get 2 \sigma T_E^4.
Hence why Joe gets twice the temperature he’s supposed to get, and why he can run his con. So AT was right all along:
https://andthentheresphysics.wordpress.com/2021/04/25/mind-your-units/#comment-190986
So now you’re supposed to argue that to divide by 4 is a VERY BAD thing to do, but that you get the same results as everyone anyway.
All this is very silly.
“If you only divide by 2, you get stuck with a 2 on the right side of the equation: remove 2 \pi R_E^2 from 4 \pi R_E^2 \sigma T_E^4 and you get 2 \sigma T_E^4.”
No, Willard. It has nothing to do with your energy balance model equation. You are hopelessly confused, beyond belief.
You still do not get it, Graham.
The numbers you ask everyone to agree with can be derived from the usual equation for the energy balance model of the Earth. Basically, the whole charade setup by Joe amounts to editorialize on the fact that 2 times 200 equals 400.
That’s for the Motte part of the argument. For the Bailey part, you invoke some kind of “transcendental” reasoning to reject what you just did. This step rests on misspecification – the “2” that remains on the right side has units too. From there follows the usual silliness about fluxes that do not add.
Besides, a Watt is a rate of work per second. The energy balance model gives us the temperature of a blackbody that would radiate the same amount of energy per square metre per second as the Earth does into space. The energy is balanced at all times.
If you get a bigger number than what this model tells you, then either you have found a way to break the Carnot cycle or there’s something else than the Sun that keeps the Earth warm.
You should have looked at the box models a long time ago.
Complete gibberish, Willard. You simply cannot form a coherent argument. I can.
Forget about your energy balance model equation for a moment. We agree that the output flux from the Earth is 240 W/m^2. The entire disagreement is only about what the input flux to the Earth is (the irradiance). We agree that the disk surface area multiplied by the solar constant, and corrected for albedo, equals the total power input. It is simply a question of what surface area do we divide that power by, to get the irradiance (W/m^2). You insist it must be divided by the whole Earth’s surface area (resulting in 240 W/m^2). Well, at any one moment, the Sun can only illuminate the lit hemisphere. It cannot illuminate the entire sphere at once. It takes time, for the Earth to rotate, for the Sun to illuminate the whole sphere. So, it’s as I said earlier:
240 in 240 out is a spatial and temporal average.
480 in 240 out is only a spatial average.
There is no misspecification. No problem with what I’m saying, or doing, whatsoever.
> The entire disagreement is only about what the input flux to the Earth is (the irradiance).
Talk about gibberish, Graham.
E_in contains Sun times Disc. The first term gives us the radiant flux. The second term gives us the area. Put the two together. No rational disagreement can obtain.
Try to equivocate on the true meaning of energy flux all you want, you will not get different units because you divide by 2 instead of 4. If you divide by 2, you either forget a 2 on the right side, or you forgot to specify the Earth.
So all that remains is the silly Bailey where you wave your arms about how the Earth rotates and how second by second you can double the amount of energy the Earth receives.
You are a complete waste of a troll.
It all comes down to whether you divide the total input power by the hemisphere’s surface area (resulting in an incoming flux of 480 W/m^2), or the sphere’s surface area (resulting in an incoming flux of 240 W/m^2). It is already agreed that the outgoing flux is 240 W/m^2. Energy in and energy out balances either way, so that is not an issue. Your energy balance model equation does not even enter into it.
Almost, Graham –
It all boils down to if you’re serious about balancing energy or if you’re only interested in trolling a website using a silly Motte-and-Bailey that rests on an equivocation of the meaning of energy flux.
Oh, and whether it’s W/m^2 or W, a Watt comes with a time dimension. Observe: 1 107 erg s−1 or 1 kg m2 s−3 or 1 J/s. Check the damn specification! So your “only a spatial average” is pure nonsense.
I’m happy with my comments, and that the issue is settled. I won. As per usual, you will continue to respond, so like I said before, I will have to be the adult, and be the one to bring this to a close by asking you to please stop trolling.
Willard, please stop trolling.
Willard says:
”It all boils down to if youre serious about balancing energy or if youre only interested in trolling a website using a silly Motte-and-Bailey that rests on an equivocation of the meaning of energy flux.”
Seriously Willard 480w/m2 over a hemisphere balances perfectly with 240w/m2 over a sphere. Your complaint about serious balancing is a red herring.
Equivocation of energy flux? Depends upon context.
Definition of flux used by US Nuclear Regulatory Commission is:
”A term applied to the amount of some type of particle (neutrons, alpha particles, etc.) or energy (photons, heat, etc.) crossing a unit area per unit time. The unit of flux is the number of particles, energy, etc., per square centimeter per second.”
In our context here we are discussing a mean flux absorbed by the surface. Since all the energy is absorbed on a hemisphere its 480w/m2. If one is designing a tracking photoelectric cell system one would use the disk flux which is 960w/m2. And if you want to confuse things completely you could include all the surface that is absorbing nothing as well on the grounds that it might absorb something sometime in the future. That would be 240w/m2.
In every case, energy in equals energy out with the exception of the fact the natural system has a large number of processes such as changing insolation, albedo, emissivity, clouds, pollution, etc. that could create imbalances.
So its fine if DREMT wants to use which ever flux he wants as none of them make any difference with balancing, much less anything serious.
So you are going to have to dream up a different excuse to complain about DREMT or POSTMA as what they are doing is just fine and changes nothing. Your complaining suggests deep ignorance or another agenda.
Alright, Bill.
Pray tell how the Earth can receive twice as much energy as it emits every single second since the dawn of times without having become a supernova. Alternatively, admit that the energy balance of the system is constrained by its output.
Either you are serious about the 240 wm-2 figure or you are a scoundrel trying to con people.
Go ahead. I dare you to racehorse that one,
Willard says:
Alright, Bill.
Pray tell how the Earth can receive twice as much energy as it emits every single second since the dawn of times without having become a supernova.
——————————–
Geez Willard! The earth is receiving 480w/m2 on a hemisphere only
while emitting while the sun is up. It rotates 180 degrees and it is still emitting some of the energy it received while receiving zero input.
> it is still emitting some of the energy it received while receiving zero input.
That almost answers the question, Bill.
The Earth cannot emit more energy than it receives. It cannot receive more energy than it emits. We need to find the balance between what it emits and what it receives.
That’s 240 W-m2, right?
Graham’s “but the Earth rotates” and “but second by second” excuses won’t change anything to that accounting fact.
Willard says:
”> it is still emitting some of the energy it received while receiving zero input.
That almost answers the question, Bill.
The Earth cannot emit more energy than it receives. It cannot receive more energy than it emits. We need to find the balance between what it emits and what it receives.
Thats 240 W-m2, right?”
———————–
Sure you can look at mean values over any period of time, 12 hours of insolation; or alternatively 24 hours made up of 12 hours of insolation and 12 hours of no insolation.
Warmists want us to look only one point of view and get their panties twisted up if somebody wants to look at it from another point of view. Both are permissable, both balance just fine.
the primary problem of looking at it from your point of view is 240w/m2 suggests both a maximum and a minumum mean temperature of 255k. In other words no temperature change over a day. then you guys jump right in with backradiation to explain why the mean temperature is some 33k warmer but you still haven’t explained the diurnal cycle.
If you use 480w/m2 for 12 hours and 240w/m2 you can explain the diurnal cycle and you are moving toward a more realistic model to explain the greenhouse effect and the diurnal cycle. But maybe some people don’t want us to think about such things.
That makes perfect sense in a political world! Thinking of it as Postma and DREMT allows for insulation to play a role in the greenhouse effect. but one cannot pin down a warmist scientist to whether its an insulating effect or the sun did it! they vaccilate between the two as jabs against the skeptical arguments.
To me its clearly an insulating effect. But there is no insulation in an atmosphere via radiation restricting itself by any known cause except for some silly mathematical extrapolations of an effect never demonstrated by mankind in any experiment.
The warmist backradiation crowd is exactly like the UFO crowd. Damned if they aren’t going to believe it until somebody proves to them UFOs don’t exist. Thats a religion bud!
\
If you accept that 240 W-2m is a hard limit, Bill, then you cut all the middlemen Joe would imagine to bypass it. The con should be obvious to anyone who knows about double accounting. Mulling over the concept of average will not change that.
In the end, two thirds of the Dragon Cranks playbook have now been refuted with a few elementary facts. Racehorsing never gets you anything, not even a thank you by Graham. Why continue: it only gives me a reason to pay due diligence to your previous gaslighting.
Should I begin, or should I thank you for the easy win?
“Both are permissable, both balance just fine.”
Yes, absolutely, Bill. Both 1) 480 W/m^2 input over the hemisphere with 240 W/m^2 output over the sphere and 2) 240 W/m^2 input over the sphere with 240 W/m^2 output over the sphere are permissible, and both balance energy in and out just fine.
The only problem with 2) is that it treats the Earth as though it were flat, i.e: able to absorb 240 W/m^2 constantly over its entire surface area all at once, with no night and day. Well, you touched on the diurnal cycle in your response, anyway. You basically nailed it all, so thanks for continuing to try to talk some sense into Willard. He will not listen, but never mind.
Willard says:
”If you accept that 240 W-2m is a hard limit, Bill, then you cut all the middlemen Joe would imagine to bypass it. The con should be obvious to anyone who knows about double accounting. Mulling over the concept of average will not change that.”
Wrong Willard. Its only a hard limit if in fact the insolation is uniform. And its not. One has to be careful when dealing with ‘mean’ values.
Now you are playing squirrels, Bill. Insulation will not had more energy to the system. Either you balance energy or you do not. If you do, you are stuck with a hard limit.
Of course if all you want to say is that something must increase the effective temperature, something like a greenhouse effect say, then you are not doing your job of protecting Graham.
Willard says:”Now you are playing squirrels, Bill. Insulation will not had more energy to the system. Either you balance energy or you do not. If you do, you are stuck with a hard limit.
Of course if all you want to say is that something must increase the effective temperature, something like a greenhouse effect say, then you are not doing your job of protecting Graham.”
——————
i can’t fix yoour ignorance on this topic for you. you can only do it for yourself. and the prerequisite for that is for you to want to understand what it requires to sequester energy in a system.
Bill, Bill,
You need to start with your own ignorance. You ignored what was the shadow. You ignore what it represents. You ignored that Graham was too using averages. You ignore that the hard limit I am talking about cannot be arm waved away with insulation.
The ratio disc/hemisphere does not model the Earth. The ratio hemisphere/sphere omits the Beer-Lambert law. Graham has little else than to fall back on the same calculations as everybody else. Which means that his litany of excuses about time, flatness, and rotation are just that: pathetic excuses by silly trolls.
At least you tried.
Thanks for the win.
“i can’t fix yoour ignorance on this topic for you. you can only do it for yourself”
I think he’s just trolling, Bill. Nobody can be that stupid.
And so Graham soldiers on, oblivious that his Motte-and-Bailey has been found out.
I mean, he does agree that the energy of the Earth balances at 240 W/m^2.
But second by second.
But flat Earth.
But days and nights.
But rotation.
So it must not be 240 W/m^2 in the end.
Years spent on a silly pragmatic contradiction.
Ah well.
You are right DREMT. Now he is barfing on a wall hoping something will stick.
You can now run away, Bill.
#2
Willard, please stop trolling.
Willard says:
”Bill, Bill,
You need to start with your own ignorance. You ignored what was the shadow. You ignore what it represents. You ignored that Graham was too using averages. You ignore that the hard limit I am talking about cannot be arm waved away with insulation.”
—————————–
Thats a lie and you know its a lie!
You were given the formula xy(1-a)/z for the insolation of a hemisphere and sitting in that formula is ‘y’ the shadow! That has been pointed out to you numerous times above.
You can’t win by lying. Liars are nothing but big losers.
Yes Bindidon, you’ve finally stumbled onto some reality.
The “weighting factor of 0.5” means the 960 W/m^2 incoming becomes 480 W/m^2, which corresponds to a surface temperature of 303K. Earth’s oceans and atmosphere moderate that down to the 289K we observe.
You’ve been studying something other than astrology. That’s good!
What’s half a hemisphere, Pup?
Willard, please stop trolling.
> Sun’s energy is intercepted by Earth’s lit hemisphere, and by nothing else.
Oh, Binny:
https://andthentheresphysics.wordpress.com/2021/04/25/mind-your-units/#comment-190372
Perhaps you should have a word with AT, otherwise tu peux garder ton attitude de cul pour toi.
Wrong Willard. It won’t be the same answer. You simply have no clue what you’re talking about. Perpendicular flux is NOT the same as at-an-angle flux.
Here’s a clue, Pup:
“Integrating cos(angle)*cos(angle) over the hemisphere gives exactly a weighting factor of 0.5.”
Yes worthless Willard, the simple calculus is anathema to your cult nonsense, proving once again, you don’t understand anything about this.
Since you can’t buy a clue, Pup, here it is:
“Applying this weighting to the hemispheres surface (2*pi*R^2) finally gives pi*R^2.”
That’s the area of a “blah-blah-disk,” right?
Correct, 0.5 times 960 is 480.
Silly sock puppet.
Check equation (1) in Binny’s source.
You might notice the blah-blah-disk.
Eq. 1 is for an imaginary sphere. But, the claim (blah-blah) is that it’s for a “gray body”.
That’s the blah-blah that exemplifies your cult nonsense.
I’m growing tired to proving how worthless you are.
Please stop denying that the Earth is a sphere, Pup.
For your thermo trolling, it’s the other door.
Willard, please stop trolling.
Some did not at all understand what I meant (especially the Pseudomod and Clint R, as usual).
They should read
Elementary, Analytic Models of Climate: The Mean Global Heat Balance
Joseph W. Chamberlain 1979
https://ntrs.nasa.gov/api/citations/19790010343/downloads/19790010343.pdf
and then come back to discuss about what really matters.
Well, Binny, your “This disk blah blah is nonsense” threw red meat at them.
What did you expect?
Bindidon, that link has NOTHING to do with the correct calculus result for solar flux.
Once you understood that you had stumbled into reality, it’s fascinating how quickly you fled your own comment.
That’s why this is so much fun.
https://www.drroyspencer.com/2022/06/uah-global-temperature-update-for-may-2022-0-17-deg-c/#comment-1325463
All that really matters is “the simple, trivial fact that energy per m^2 absorbed by a hemisphere is exactly twice that emitted by a full sphere”.
Some remarks
1. ” This disk blah blah is nonsense ” has nothing to do with the absorp-tion / emission ratios.
2. I didn’t expect anything. Simple-minded GHE deniers keep what they are. They don’t understand that this equality of absorp-tion / emission is a non-sequitur.
That is the reason to show other, more relevant information helping to get out of this eternal circular reasoning.
3. But when we look at Clint R’s dumb reply
” Bindidon, that link has NOTHING to do with the correct calculus result for solar flux. ”
I understand that it is hopeless.
He is not even able to grasp why I gave the link to read, as Willard very well did:
https://imgur.com/a/bktLC3Y
*
For those who have an open mind, I recommend A.P. Smith’s paper
Proof of the Atmospheric Greenhouse Effect (2008)
https://arxiv.org/pdf/0802.4324.pdf
in which he clearly contradicted Gerlich and Tscheuchner.
Later on, Gerlich tried a counter-reply; so did later Kramm, Dlugi and Moelders, but without success.
Both Gerlich and Kramm kept surprisingly opinionated on allegedly wrong integrations by Smith.
Finally, Kramm gave up his trial to contradict Smith during a long discussion with Smith and Chris Ho-Stuart in 2009 on Joshua Halpern’s blog.
*
The best is to keep away from this tedious discussion, exactly as it is best to keep away from the tedious discussion concerning the lunar spin: deniers are and keep always right.
I have omitted a further link:
Chamberlain / Hunten
Theory of Planetary Atmospheres (1979 – 1987)
https://tinyurl.com/248749wv
Bindidon, that Smith nonsense is NOT “proof” of the GHE. He discusses solar flus, rotating vs. non-rotating planets, and atmospheric infrared absorp.tion. Nowhere did he “prove” that the atmosphere can warm the surface. There is no proof of your GHE nonsense.
You’ve only found another link you can’t understand.
All that really matters is that that the Earth shadow is a disc is a cross-section of the Earth is pi*R^2.
I repeat for one of the dumbest posters:
” The best is to keep away from this tedious discussion, exactly as it is best to keep away from the tedious discussion concerning the lunar spin: deniers are and keep always right. “
A fact that all agree on, Willard.
A fact that contradicts what you consider is the only thing that matters here, Graham,
Thank you for finally admitting that you are trolling.
Willard is doing his OID thing again. He will be here all day if we let him. I am not going to bother, today.
Here are the objects to identify:
A hemisphere, which is half a sphere.
A disc, which is half a hemisphere.
Energy, which limits the amount of trolling Graham can do over a week.
“1. ” This disk blah blah is nonsense ” has nothing to do with the absorp-tion / emission ratios.”
Exactly.
“[Pup] is not even able to grasp why I gave the link to read, as Willard very well did:
https://imgur.com/a/bktLC3Y”
Neither does Graham, whom can’t grok equations.
Bindidon must have found the correct calculus for solar flux arriving a sphere. Not understanding the physics, he must have believed it supported his cult nonsense. So he started this, based on his bogus belief that he really had something.
https://www.drroyspencer.com/2022/06/uah-global-temperature-update-for-may-2022-0-17-deg-c/#comment-1325365
When it was pointed out to him that his “finding” was counter to his beliefs, he quickly reversed himself. He was even so desperate that he had to snuggle up with worthless Willard.
Bindidon’s knowledge of science is as pathetic as his ability to predict La Niña.
Binny indeed found the correct calculus, Pup.
I already told you:
https://www.drroyspencer.com/2022/06/uah-global-temperature-update-for-may-2022-0-17-deg-c/#comment-1325446
The hemisphere, when corrected for angles and such, is a blah blah disc.
Hence why eq (1) of his source includes a pi*R^2.
Please stop trolling, Graham is trying to have a rest day.
Willard’s accusation that I do not “grok” equations, is false. He needs to:
1) Apologize for his continuous false accusations.
2) Acknowledge that 480 W/m^2 input over the hemisphere and 240 W/m^2 output over the sphere does conserve energy, but not flux.
3) Acknowledge that there was no misspecification.
4) Change most of his article at ATTP.
He will do none of those things, because he is simply a troll.
He needs to acknowledge that he fails to turn his value assignments into equations, does not provide an energy balance model, does not understand Joe’s con, never really met Gator’s criticisms, is special pleading with “but rotation”, is trying to exploit Binny’s misunderstanding of his trick, cannot reconcile his calculations with Binny’s model, presents my demonstrations as mere accusations, and cannot stop trolling.
He can’t even bring himself to do 2) and 3). Pitiful.
I am starting to suspect that Graham understood nothing of that exchange a year ago for a few weeks under my Mind Your Unit post.
He *still* does not realize that his concerns regarding the usual zero-dimension energy balance model are unjustified, and that he has yet to provide an alternative model.
Heck, he *still* cannot find the one from Joe.
So of course he is trolling.
What many people can’t understand is the FACT that instantaneous pictures of what happens in a moving environment aren’t even worth the waste bag they should go in even before they are typed in.
One has to integrate differential equations over time.
And that is exactly what not only A.P. Smith but also Gerlich and Tscheuchner and all other knowledgeable scientists did and do.
For all these people, statements like
” Averaged over the entire planet, the amount of sunlight arriving at the top of Earths atmosphere is only one-fourth of the total solar irradiance, or approximately 340 watts per square meter. ”
perfectly match what they learned and later themselves teached.
For Pseudoskeptics, this is wrong, because they always consider tiny parts of the problems they ‘discuss’.
…and if we’re going to average the insolation over the entire planet, and get 240 W/m^2 input after correcting for albedo, then we should say that the BP receives 200 W/m^2 from the Sun in the original Green Plate Effect scenario, and not 400 W/m^2.
The plate is not spinning.
It warms through.
“When I use warming,” Graham said, in rather a scornful tone, “it means just what I choose it to meanneither more nor less.”
“The question is,” said Bob, “whether blankets warm.”
“The question is,” replied Graham, “which is to be masterthat’s all.”
Willard, please stop trolling.
Strong argument you got there, Bill.
When will correct your misconception about he shadow of the Earth?
Thank you for the win again, Graham.
#2
Willard, please stop trolling.
Bindidon says:
That somebody disputes the simple, trivial fact that energy per m^2 absorbed by a hemisphere is exactly twice that emitted by a full sphere, wonders me a bit indeed.
———————-
thank you Bindidon! I was trying to get Nate to do this. Its good to see someone arguing honestly.
Glad you finally found someone who confirms what nobody ever disputed, Bill.
Perhaps we should add Binny to the list of the commenters over there:
https://andthentheresphysics.wordpress.com/2021/04/25/mind-your-units/
Saying stuff for years can save an hour reading a comment thread, however.
You were disputing it Willard.
Bill, Bill,
You are confusing what I am saying with what Graham whines about to make sure that his litany becomes what we should discuss. You use the same trick all the time.
As a Grandmaster of Geometry, I implore you to enlighten me –
When we say that the hemisphere, when corrected for angles, is a disc, what does the disc represent?
Yes, Bill, Willard has been disputing it for over a year. He just cannot bring himself to admit he was wrong, and everyone here sees that he was wrong. Up-thread he is still saying my equations are incorrect! Now watch him wriggle…
See, Bill?
Graham is really good at ignoring what is being said.
It is as if the point I just made did not exist at all.
Such a genuine conversationalist.
So, what does the disc represent?
Now watch him wriggle…
Even you should get it, Graham.
The hemisphere, corrected at angles, is a disc.
What does the disc represent?
Should be easy for you.
Still wriggling…
How you ignore what I am saying while accusing me of wriggling is delicious, Graham.
Let us try to see if you will get the irony –
The hemisphere.
When corrected for angles.
Is a disc.
What does represent the disc?
He can’t stop wriggling…
Here is the hemispherical model in the Magnum Opus:
https://andthentheresphysics.files.wordpress.com/2021/05/joe-s-con-2.png
https://andthentheresphysics.wordpress.com/2021/04/25/mind-your-units/#comment-191111
Do you recall when you were denying that Joe did do that?
I do.
You were wrong, but I let it go at the time.
There was no need to rub it in.
Sometimes things change.
Want me to remind you of your denial?
You’re wrong, Willard. I’m right.
About what, Graham – your misspecification? I just *showed* you where Joe takes his division by two. You cannot grok equations.
One does not simply specify the Earth with a mere hemisphere.
https://www.drroyspencer.com/2022/06/uah-global-temperature-update-for-may-2022-0-17-deg-c/#comment-1325998
He is still wriggling…
Still no equation, Graham. 1-0 me.
Still no model. 2-0 me.
Joe divides by 2 in a hemispherical model. 3-0 me.
Still no model for the Earth by Joe. 4-0.
You were wrong about what Joe was doing. 5-0.
The disc already represents the hemisphere at zenith. 6-0.
Are you not tired of winning so brilliantly?
It is obviously impossible to write a single equation balancing flux in and flux out from the Earth, when the flux amounts are not equal because the surface area involved in the input is different to the surface area involved in the output. Hence all of your supposed victories fall apart, accordingly.
480 W/m^2 input over the hemisphere and 240 W/m^2 output over the sphere does conserve energy. Can you at least admit that, first of all?
Willard says:
”When we say that the hemisphere, when corrected for angles, is a disc, what does the disc represent?”
———————————-
Willard the shadow disk is where the sun doesn’t shine. It is also the ‘base’ of the hemisphere inside of the earth.
The hemisphere is the lit side of earth. Despite all your nonsense disputing the fact that the area of a hemisphere is twice its shadow/base. . . .rest assured it is a fact.
And your complaint that incoming flux has to be divided by 4 was a misspecification.
Nobody but you and a few Dragon Cranks care about flux by itself, Graham.
> the shadow disk is where the sun doesn’t shine.
What if I told you that the shadow of the Earth was the exact dimension of the area that receives the Sun’s light at zenith, Bill?
(Testing what the parser dislikes once again:)
We are discussing an Energy Balance Model (EBM). If you want to criticize the EBM we got, you got to work within it or provide a better one. And, to repeat what Holger said, “The energy_in = energy_out is *independent* of arbitrary surfaces used in defining the averages.”
Nothing in Graham’s pet topic matters. Nothing at all. The only thing noteworthy is his One Single Tactic and your One Single Strategy.
More on that later.
480 W/m^2 input over the hemisphere and 240 W/m^2 output over the sphere does conserve energy. Can you at least admit that, first of all?
If only you had a model in which you could demonstrate that, Graham. Here could be one:
Plug the two together:
F_{\odot} \pi R_E^2 = 4 \pi R_E^2 \sigma T_E^4
This is an equation.
This is a model.
This is correctly specified.
Now, where is Joe’s alternative model, and how does it give different results?
“That somebody disputes the simple, trivial fact that energy per m^2 absorbed by a hemisphere is exactly twice that emitted by a full sphere, wonders me a bit indeed.”
Keep wriggling, Graham:
“If we know the albedo and F_{\odot} then we could equate these two to estimate T_E.”
Could you at least agree that without an energy balance model you cannot balance energy?
Willard says:
”What if I told you that the shadow of the Earth was the exact dimension of the area that receives the Suns light at zenith, Bill?”
You would be wrong Willard. The sun does not shine on a flat disk it shines on a concave hemisphere.
The flat disk can be used to estimate the total power received by earth but then it must be distributed correctly. Your insistence that it be divided by 4 is wrong. Thats the only misspecification I see in the whole argument and it has you totally spinning in circles.
You specifically said that DREMT and Postma were wrong in using 1/2 the solar constant as the mean power over the dimensions of a hemisphere. But you have been making a fool of yourself continuing to try to rescue that misspecification of yours. Just admit you were wrong and move on.
> You would be wrong
Splendid, Bill!
You should give geometry lessons to AT:
https://andthentheresphysics.wordpress.com/2021/04/25/mind-your-units/#comment-190372
Alternatively, you can always skool Binny:
https://www.drroyspencer.com/2022/06/uah-global-temperature-update-for-may-2022-0-17-deg-c/#comment-1325365
Perhaps you’re not helping Graham right now.
Just a thought.
I have demonstrated time and time again that energy balances, Willard.
https://www.drroyspencer.com/2022/06/uah-global-temperature-update-for-may-2022-0-17-deg-c/#comment-1325283
Just admit you were wrong and move on, as Bill says.
Keep wriggling, Graham –
You still have not presented an explicit energy balance model.
You still have not acknowledged that without an energy balance model, you cannot balance energy in a correct manner.
This is why you still do not get Joe’s con and why he’s stuck with his division-by-two. You do not understand his equations. You do not understand his diagrams.
This is why I keep insisting on your model.
And we have yet to reach your “second by second” armwaving!
So wonderful.
I already explained, at 9:40 AM, that it’s obviously impossible to write a single equation balancing flux in and flux out from the Earth, when the flux amounts are not equal because the surface area involved in the input is different to the surface area involved in the output.
That doesn’t mean that energy in doesn’t balance energy out. How could it not? All I’m doing is taking the total power in, dividing it by the surface area that it’s received over, then taking the total power out, and dividing it by the surface area that it leaves from! We are already treating total power in as being equal to total power out before the divisions take place. So the fact that energy is conserved is a given in the calculations!
You are asking for something mathematically impossible, then going, "tee hee hee, I win, you can’t provide what I asked for".
It’s pathetic.
As I already wrote in my 10:21 comment, nobody but a handful of Sky Dragon Cranks care about balancing flux.
This is a discussion about the energy balance of the Earth.
Graham cannot bring himself to model the Earth.
Instead we get his favorite tactic:
THE MASTER BAITER
You are the stupidest person I have ever met
unless you discuss my pet topic
You are wrong, wrong, wrong
about the very pet topic I want to discuss.
You are wriggling, still wriggling, still wriggling
away from the pet topic I will only discuss.
You are a pathetic liar
about the very thing you never address.
You are really funny, entertaining, bemusing
because you ridiculously stay away from my pet topic.
***
Oh, well.
Oh, the irony. You are the one that wants to balance flux, Willard. You want 240 W/m^2 in to balance 240 W/m^2 out. I am the one saying that flux does not have to balance, because the surface area that input is received over is half that from which the output leaves. I am the one balancing energy at the expense of balancing flux. 480 W/m^2 in does not equal 240 W/m^2 out. Yet energy balances, due to the differing surface areas over which the energy is received or leaves from.
Thank you for telling me what I want, Graham.
I really really want flux to balance when I keep telling you that nobody cares about balancing flux and all that matters is if you can produce an energy balance model that differs from the one we got.
I’ll add it to my poem:
You are the one who really really really wants
the very thing you keep dodging, which happens to be my pet topic.
I promised to talk about the one and only strategy you keep using.
It is a famous one.
The silly motte-and-bailey.
You did it with the Moon. You do it when you armwave about “second by second.” I bet you do it with your plate discussion.
This is what’s coming.
What will have left when all this will be displayed to everyone to contemplate?
You will keep wriggling.
480 W/m^2 input over the hemisphere and 240 W/m^2 output over the sphere is a different model "from the one we got". "The one we got" says we divide by 4 for the input.
Keep asserting, Graham. See if anyone cares.
Without an energy balance model, there is nothing to balance.
Sorry, let’s say it like Pup:
Without an energy balance model, you got NOTHING.
Where’s your energy balance model?
I can show me yours if you want.
Alternatively, we can move on to your “second by second” crap.
(No, it’s not exactly a different request – it’s just a different way to show that you got not model.)
> I can show me yours if you want.
Hehe.
I can show you mine, of course.
Go ahead, Master Baiter – show me your model.
Willard, please stop trolling.
[GRAHAM] “The one we got” says we divide by 4 for the input.
[AT] E_{in} = F_{\odot} \pi R_E^2.
Do you realize that the hypothesis that you cannot read equations is the most generous one I can give you?
The current "consensus" is that we should divide by 4 for the input, Willard.
If you don’t think that the incoming flux is 240 W/m^2, and the outgoing flux is 240 W/m^2, then I’ll happily take the win.
The model AT presents is the same as everyone else, Graham.
A disc is all we need to define what gets into the system.
So that’s one place you’re wrong.
And you *completely* misunderstand why we divide by 4.
Hint: it is to turn energy into an Effective Temperature (ET).)
Another place where you’re wrong.
Keep on winning, son!
"The model AT presents is the same as everyone else, Graham."
Yes, I know.
"A disc is all we need to define what gets into the system."
In terms of the total power, only. To get to the flux received, you need to divide by the surface area receiving said power.
"And you *completely* misunderstand why we divide by 4.
Hint: it is to turn energy into an Effective Temperature (ET)."
Willard, you seem to think you can read my mind. You cannot.
What do you think is the incoming flux, if not 240 W/m^2?
> Yes, I know.
Then please reread that assignment, Graham:
E_{in} = F_{\odot} \pi R_E^2.
It defines the quantity of energy that gets into the system.
There are three terms.
Do you see a division by 4?
Obviously not, Willard. Yet, as I was saying, the current "consensus" is that we should divide by 4 for the input, so that the incoming flux is 240 W/m^2. If you disagree with that, as I do, then we have nothing left to argue about.
So all you have to do is answer one simple question:
What do you think is the value of the incoming flux for the Earth?
You’re wrong, Graham:
[G] “The one we got” says we divide by 4 for the input.
[W] Here is the input: E_{in} = F_{\odot} \pi R_E^2.
[G] The current “consensus” is that we should divide by 4 for the inpu
[W] The model AT presents is the same as everyone else, Graham.
[G] Yes, I know.
[W] Then please reread that assignment. Do you see a division by 4?
[G] Obviously not.
That’s why there’s a contradiction in this story, and this is what I mean by misspecification.
I see that, as usual, there’s no chance of you ever answering a straightforward question.
Anyway…it appears you agree with Bill that it’s a misspecification to divide the input by 4. Excellent. We’re getting somewhere.
Worthless Willard is so confused by Bindidon’s confusion that he can’t get anything right.
His pathetic attempt at an equation is probably copied from someone else. Willard understands none of this.
Bindidon has confused himself and Willard.
That’s why this is so much fun.
Yes, Clint R, he currently doesn’t even seem to realize that those on his own side of the debate divide the input to the Earth by 4, to get a flux for insolation of 240 W/m^2. It’s like he’s only hearing of this for the very first time.
I already answered a thousand times, Graham. Doesn’t matter to you. You are still powered by 386.
Getting the right numbers means little if you can’t know *why* you get them right. Too easy to get the right numbers for the wrong reasons. Without specifying a model first, you will never know.
Willard is acting like a child with a tantrum, just stomping his feet and repeating over and over again his mistake.
(Testing again:)
So all that matters is the energy balance model. It contains everything we need. The one under discussion has a left part and a right part.
There is no Flux out made explicit in that model. Nobody cares about that. All we want is to balance energy.
The division by 4 comes at the very same moment that Joe divides by 2. He simply replaced “4” by “2”. It comes from the E_out part. So in the end he has no model for the Earth. Just for one hemisphere.
Where have you ever answered the question? You’re not lying again, are you?
I know why I get the numbers right, Willard. It’s because it’s a "simple, trivial fact that energy per m^2 absorbed by a hemisphere is exactly twice that emitted by a full sphere".
Oh, Bill. You *really* have no idea.
Let’s try to post the last part of my comment:
So yeah, Graham is making a specification error. Big deal. If this gets him shout every six months “but in real time! but in real time,” suit himself. If he keeps trolling every single day for all summer, that’s a problem for the sanity of this place and for his mental health.
There are a shit ton of other models, with various dimensions and boxes. If he can’t grok a simple equation, you’re in no position to try to undermine climate science. He still can try. Suppose he succeeds. Who cares? He’d contribute to science, and everybody will turn out wiser for it.
I supported all the claims I made. Time to stop. Twas fun.
Take care.
So now he’s just going to run away, without ever having admitted that he was wrong!
> Where have you ever answered the question?
Among other places here, Graham:
https://andthentheresphysics.wordpress.com/2021/04/25/mind-your-units/#comment-190521
I already cited it above. It does not matter. I also cited Holger a few times. Everything goes above your head. Obviously a spectrum thing.
Gator was right in suggesting that without any physics intuition, all this is quite useless. I tried to improve on his suggestion by insisting on specification. The idea works, but it’s nor worth it.
You still believe that the division by four is for the input, and that you need to add a hemisphere. Why is the disc doing there then? You really are shuffling numbers around without really understanding what you’re doing.
Enough for now.
> So now he’s just going to run away
I just proved you wrong, punk.
There is no division by 4 in E_in.
This cannot be clearer.
You lost.
Give it a rest..
"You still believe that the division by four is for the input"
No, Willard. I believe the division by four is for the output. Your side of the argument divides the input (and the output) by four. 240 W/m^2 in, and 240 W/m^2 out.
You’re so confused it’s unbelievable.
480 W/m^2 input over the hemisphere, and 240 W/m^2 output over the sphere, is my argument. One that I have explained so clearly by now that even a child could understand.
Not my side, Graham. The side that has a the modulz.
Got one? No, not a flux equation that is not really an equation. A model of the energy balance of the Earth. Joe only got one for the hemisphere.
No? Ah, shoot. Next time.
Thanks for the game. Happy with the win.
Ta.
Willard returns for another “last word”. Here is a better one:
“That somebody disputes the simple, trivial fact that energy per m^2 absorbed by a hemisphere is exactly twice that emitted by a full sphere, wonders me a bit indeed.”
He has been in full meltdown ever since. Wriggling, deflecting, outright lying, falsely accusing, demanding the impossible, throwing absolutely everything at the wall in the hope that something will stick. All because he realizes yet another person sees through his nonsense.
The more it has gone on, the less credible he has become. Not that he was particularly credible to begin with.
Willard says:
”Lets try to post the last part of my comment:
So yeah, Graham is making a specification error. Big deal. If this gets him shout every six months but in real time! but in real time, suit himself. If he keeps trolling every single day for all summer, thats a problem for the sanity of this place and for his mental health.
There are a shit ton of other models, with various dimensions and boxes. If he cant grok a simple equation, youre in no position to try to undermine climate science. He still can try. Suppose he succeeds. Who cares? Hed contribute to science, and everybody will turn out wiser for it.”
the only one here making a specification error is you Willard. And if pointing that out undermines climate science all it means is that ‘climate science’ isn’t science.
Strong argument there, Bill. When will you correct your misconception about the shadow of the Earth?
Thank you again for the win, Graham, I enjoyed it.
Narcissist!
You can run away now, Willard.
How does it feel to have wasted a week on trying to force an empty door with a gotcha that has been answered more than a year ago, Graham?
No need to thank me. Awaiting your energy balance model, I am your humble servant.
Cheers.
Not a waste of time at all. Chic, Bill and Bindidon now see through your nonsense. Who knows how many others do also, but just haven’t spoken up. Your credibility has taken a massive hit. We all know you don’t have the integrity to admit you were wrong, so I didn’t really expect anything else but a prolonged “dishonesty display” from you, like we got last year, when even some of the regulars at ATTP started to question you. So, every little helps. Gradually, a bad person is being revealed for what he is, and that can only be a good thing.
You have enough straw to build at least ten energy balance models by now, Graham.
When will you build one different than the one we use as a toy example?
Take your time, second by second, wink wink.
Alternatively, you can try to find the Joe has to sell.
You know the hemispheric one where he is stuck with a division by two?
I have demonstrated a dozen times that energy balances, and explained twice already why it cannot be written in one single equation. You have total power in = total power out, and you calculate what that amount of power is by multiplying the solar constant by the shadow disk surface area, and correcting for albedo. You then divide the total power in and total power out by the surface area receiving or emitting said total power to get the flux in and flux out. The divide by two and divide by four shortcuts are fully explained here:
https://www.drroyspencer.com/2022/06/uah-global-temperature-update-for-may-2022-0-17-deg-c/#comment-1321429
So that is the “model”. Simple enough for most people following to understand.
Narcissistic sociopaths will be narcissistic sociopaths, I suppose.
You do not have an energy balance of the Earth, Graham. You just have a collection of posts where you shuffle quantities around. An energy balance has one equation.
Energy in equals energy out.
You do not have that. You cannot exploit what Joe writes because he stops in the middle of his acrobatics. Hence why he is stuck with a division by two.
We already went through this a year ago. AT and other commenters started to ignore your comments when they realized it would be overkill to pile on a guy who obviously has no physics bone in him.
So the least you could do is to build yourself a solid motte.
"You do not have an energy balance of the Earth, Graham."
False. Total power in = total power out. That is for the whole Earth. What I do balances energy in and out for the entire Earth.
"You just have a collection of posts where you shuffle quantities around."
I do not "shuffle quantities around". I have explained what I do in the previous comment. It’s perfectly clear, to everyone but you it seems (if we were to take you as being genuine, which is unlikely).
"An energy balance has one equation."
Your beloved EBM equation has very little to do with Postma’s arguments, other than it’s the origin of the "divide by four" rule. Now, even with your general inability to read equations and utter lack of understanding of basic physics, you were able to note that there is actually no divide by 4 present on the "in" side of that equation. Yet, the general "consensus" is to divide by 4 for the input so that the insolation is treated as being 240 W/m^2, after correcting for albedo. This is because the whole issue does not begin and end with your EBM equation! The total input power (which we get from the left side of your equation) still has to be divided over the surface area receiving said power. The "consensus" is to divide it over the surface area of the entire planet, as if the power was somehow being received over the entire Earth’s surface area at once. This is where Postma’s disagreement begins…so his arguments actually transcend your EBM equation. A major problem with your article, and your understanding generally. You simply cannot see outside the framework of your equation, to look at the bigger picture!
"You cannot exploit what Joe writes because he stops in the middle of his acrobatics. Hence why he is stuck with a division by two."
This is complete nonsense.
"We already went through this a year ago. AT and other commenters started to ignore your comments when they realized it would be overkill to pile on a guy who obviously has no physics bone in him."
That is most definitely not what happened, Willard. I was bombarded with comments from all sides, throughout, most of which did not even relate to the points in your article I was trying to correct. I still managed to answer a lot of their comments, even though you removed a lot of my responses for absolutely no valid reason.
"So the least you could do is to build yourself a solid motte."
More nonsense.
Compare and contrast:
[AT] F_{\odot} \pi R_E^2 = 4 \pi R_E^2 \sigma T_E^4
[GRAHAM] Flux in (W/m^2) = xy(1-a)/z
AT’s equation has two sides that equates energy in and energy out. Graham’s has only one side, and it’s about flux.
AT has an energy balance model of the Earth. Graham has a definition of Flux in, which he can’t equate to flux out anyway.
AT’s model is correctly specified. Graham is playing The Game. When he’ll provide a correct model of the energy balance of the Earth, he will get the same numbers as everybody else. That will be his motte.
Only then will he be able to sensibly move to his “second by second” or “real time” bailey.
You just ignored every single word I said in my last two comments, Willard. This is why it’s pointless talking to you. What I said refutes what you just said. Instead of responding, point by point, to what I bring up, you simply ignore it, and repeat yourself. You are playing "the Game", and then you falsely accuse me of doing so! When it’s not that, you’re doing your OID thing. Or you simply say something that’s totally incoherent. Begone, troll.
[HAMM] You do not have an energy balance model.
[CLOV] Oh yes sir I do! Check here.
[HAMM] A definition of Flux_in is not it.
[CLOV] You *never* listen to what I say!
A work of art and a thing of beauty.
Falsely summarizing arguments is just more trolling, Willard.
Dis U, Graham:
Here’s one equation that balances energy:
[AT] F_{\odot} \pi R_E^2 = 4 \pi R_E^2 \sigma T_E^4
To deny that the usual energy balance model does not balance energy is the bailey part of the Sky Dragon Cranks argument.
The motte part is to show that it does.
I meant, I have explained twice already why what I do cannot be written in one single equation. Won’t stop you asking for one single equation though, will it?
I agree that it would be hard for you to specify what you are doing into equational form, Graham. The Game disappears when we formalize. I doubt that to divide twice by two instead of dividing by four is impossible. Correct me if I’m wrong, but I believe that 2 x 2 = 4.
Nevertheless, here is you again:
“You then divide the total power in and total power out by the surface area receiving or emitting said total power to get the flux in and flux out”
This might be the crux of your confusion.
The area that receives the total power is the disc.
What does the disc represent again?
Ah, yes – the hemisphere at zenith.
So you and Joe had a hemisphere under your nose all along.
Willard reveals he still doesn’t understand any of this.
Where have we measured the energy falling on the hemisphere?
That should give us a clue as to who is right and who is wrong.
Here is how I closed the thread at AT’s, Bob:
https://i.imgflip.com/58jyyj.jpg
Source: https://andthentheresphysics.wordpress.com/2021/04/25/mind-your-units/#comment-191184
Graham *never* really understood what I have been saying all along.
He just can’t grok equations.
Not really, bob, no. Willard is wrong in the argument between us because he "disputes the simple, trivial fact that energy per m^2 absorbed by a hemisphere is exactly twice that emitted by a full sphere". He simply cannot understand (or portrays a person who cannot understand, in order to troll) that the total power received might be calculated by multiplying the shadow disk surface area by the solar constant and correcting for albedo, but you then need to divide that total power received by the surface area receiving said power to get the flux in. You also need to divide the total power emitted by the surface area emitting said power, to get the flux out.
He does not understand (or portrays a person who does not understand, in order to troll) any of that. That is why he is wrong. Once he understands the actual argument being made, and admits that he has been wrong all this time, then we can move on to other points.
The point being DREMPY is that your light falling on the hemisphere is calculated from the measurement of the light falling on the disc.
"The point being DREMPY is that your light falling on the hemisphere is calculated from the measurement of the light falling on the disc."
The total power received by the Earth is equal to the disk surface area multiplied by the solar constant, and corrected for albedo, bob. To get from that to the flux received, you need to divide the total input power by the surface area receiving that total power.
Except you don’t need to do that, you already have the energy in from the disc.
Graham is spreading lies as elegantly as he is spreading the light received by the Earth on half its surface instead of a whole sphere.
As far as energy models of the Earth is concerned, Joe’s division by two is a complete blunder.
As far as a con to swindle marks such as Graham, it is pure genius.
You have the total power in, from the disk surface area multiplied by the solar constant and corrected for albedo, bob. You don’t get a value for the flux in until you divide that power by the surface area it is received over.
If you divide the total power received by the disk surface area, you get a value for the incoming flux of 960 W/m^2. If you divide the total power received by the hemisphere’s surface area, you get a value for the incoming flux of 480 W/m^2. If you divide the total power received by the sphere’s surface area, you get a value for the incoming flux of 240 W/m^2.
These sociology majors need to get out of here.
Flux in does not need to equal flux out. It only does if the area is the same.
xy(1-a) gives the total power absorbed by the earth system in watts, not watts/m2.
x is in w/m2 (flux) and y is in m2, thus the m2 cancels out and you are left with watts (power).
xy(1-a)/z has the area of a hemisphere and puts the m2 back in and so it converts it to a power to flux for a hemisphere.
xy(1-a)/2z has the total surface area of the earth and also puts a different m2 in and thus converts power to flux for the entire earth.
None of this is violation of 1LOT as the power has not changed.
These morons are simply being stupid or are obfuscating. A high school student should be able to see through this stupid charade.
[ASTROPHYSICIST] So, you can see that if you do the integral over the hemisphere and take the solar zenith angle into account, you recover that the energy intercepted per unit time is the incoming flux times the cross-sectional area of the Earth.
[GEOPHYSICIST] The geometry says that the sunlight passing through 1 m^2 measured perpendicular to the sun’s rays gets spread over a larger horizontal area on the earth’s surface of 1/cos(z) m^2, where z is the zenith angle (the angle between where the sun is in the sky and the vertical line perpendicular to the earth’s surface). So, the flux is 1368*cos(z) W/m^2 on 1m^2 of the earth’s surface. (Well, at the top of the atmosphere.)
[CHARTMASTER] I don’t disagree with that integration, if that’s what you are asking.
"the energy intercepted per unit time is the incoming flux times the cross-sectional area of the Earth."
Exactly. Energy per unit time is power. So the total input power is the incoming flux (solar constant) times the shadow disk surface area, then correct for albedo. You then need to divide that total input power by the surface area receiving said power…
…well, Bill already re-explained it perfectly clearly.
And so the point flies by Graham’s head once more:
[CHARTMASTER] But back to my point…a hemisphere has half the surface area of the entire sphere.
[GEOPHYSICIST] Yes, and that hemisphere is lit by the sun – but not equally. Only the one location where the sun is directly overhead does it see the full solar flux at right angles to the sun’s rays. By the time you adjust for the weaker angled sun everywhere else, the average amount of solar radiation received is cut by half again. What the earth’s surface sees is the amount spread over 1m^2 of the earth’s surface, not 1^m2 of a surface pointing directly at the sun.
You have noticed how much less light there on a horizontal surface near sunrise and sunset, haven’t you?
https://andthentheresphysics.wordpress.com/2021/04/25/mind-your-units/#comment-190490
And round and round Graham goes.
It’s not really clear what he’s saying, Willard. If by "the average amount of solar radiation received is cut by half again" he means "960 W/m^2 is cut in half so that the hemisphere receives 480 W/m^2", then I agree with what he’s saying, overall.
If, as you seem to be implying, he’s saying that "480 W/m^2 is cut in half so that the hemisphere receives 240 W/m^2", then that is obviously wrong.
You have no end of comments to link to, to obfuscate and distract from the simple and obviously correct math and logic that has been presented. You will no doubt respond to this, with more.
The Sociologist notes that sunlight on a hemisphere is less at dawn than at noon.
Yes Mr. Sociologist major the light on the hemisphere is a ‘mean’ insolation. Even a sociologist should know what it means to be a mean.
Is the sociologist still confused?
And so we return to where we started:
https://www.drroyspencer.com/2022/06/uah-global-temperature-update-for-may-2022-0-17-deg-c/#comment-1324879
Graham insists in working with flux. Then he whines that he cannot do anything with it. And then Pup lulzes about the fact that fluxes don’t add.
Sky Dragon Cranks are not meant to advance science at all.
> Even a sociologist should know what it means to be a mean.
That rings a bell, Bill:
[ASTROPHYSICIST] Not every square metre on the lit hemisphere is receiving 480 W/m^2. A one square metre patch with the Sun directly overhead receives ~960 W/m^2 while a 1 square metre patch with the Sun on the horizon receives almost nothing. So, it’s still an average.
https://andthentheresphysics.wordpress.com/2021/04/25/mind-your-units/#comment-191004
It’s Ninja, BTW.
"Is the sociologist still confused?"
Yes, Bill, as we see from Willard’s latest, he is still confused. Or, at least, he’s acting like he’s confused, in order to troll.
Very confused:
[GUY WHO DESIGNED A FRIDGE THAT OPERATES AT MILLI-KELVIN USING ELI’S PLATES MODEL] This is supposed to be about units, right? Maybe it is better to think in terms of power, J/s, instead of flux, J/s/m2. Physically, the earth absorbs a certain power, and radiates the same power in equilibrium. The point of flux vs. disk area vs. hemisphere etc is really just to make calculating *power* easier. Whatever combination of flux&area you pick, the power input from the sun should be the same.
[PROFESSOR OF FLUID DYNAMICS AT SIEGEN] The energy_in = energy_out is independent of arbitrary surfaces used in defining the averages, but it doesn’t fit some people’s narrative to arbitrarily define an averaged flux (now over a hemisphere by dividing by z) based on using an already averaged flux (solar constant).
The best Graham could get is a draw, but for that he needs an energy balance model of the Earth.
He does not have one. So he shuffles numbers around and trolls.
Not even wrong.
"Whatever combination of flux&area you pick, the power input from the sun should be the same."
…and it is. Willard’s doing that OID thing again.
> And it is.
And so Graham returns to his motte where everybody agrees on everything and none of this matters.
This motte might be hard to reconcile with the bailey:
[CHARTMASTER] But, it’s at least an average that reflects what is really happening. 240 W/m^2 implies the whole Earth receiving the Sun’s energy at once, which is of course impossible.
[ASTROPHYSICIST] Except, this is the energy input to the climate system. And, no, it doesn’t imply the whole planet receives the Sun’s energy at once, it just implies that the Earth is absorbing an average of 240 J of Solar energy every second per square metre.
https://andthentheresphysics.wordpress.com/2021/04/25/mind-your-units/#comment-191020
Hard to work out the implication of anything without a model.
Does Graham have an energy balance model of the Earth that differs from the one we got?
#2
Willard, please stop trolling.
You can run away now, Graham.
#3
Willard, please stop trolling.
Do you now understand why you should not have tried to exploit Binny’s pronunciamento, Graham?
#4
Willard, please stop trolling.
Good. I’m glad this is finally settled.
You can now run away.
#5
Willard, please stop trolling.
Bye, Graham!
#6
Willard, please stop trolling.
I am just happy with the win, Graham.
#7
Willard, please stop trolling.
We left the Climateball field on good terms yesterday, Graham.
Yet here you are this morning:
https://www.drroyspencer.com/2022/06/uah-global-temperature-update-for-may-2022-0-17-deg-c/#comment-1327182
Why?
#8
Willard, please stop trolling.
The bears repeating:
https://www.drroyspencer.com/2022/06/uah-global-temperature-update-for-may-2022-0-17-deg-c/#comment-1327309
All this poetry to shield your silly misspecification, Graham.
#9
Willard, please stop trolling.
Bill is doubling down, Graham:
https://www.drroyspencer.com/2022/06/uah-global-temperature-update-for-may-2022-0-17-deg-c/#comment-1327406
Please stop refusing him your help.
#10
Willard, please stop trolling.
Graham is still PST-ing!
#11
Willard, please stop trolling.
Graham is still confused about power and flux:
https://www.drroyspencer.com/2022/06/uah-global-temperature-update-for-may-2022-0-17-deg-c/#comment-1327863
#12
Willard, please stop trolling.
Graham is still squirming second by second:
https://www.drroyspencer.com/2022/06/uah-global-temperature-update-for-may-2022-0-17-deg-c/#comment-1327903
#13
Willard, please stop trolling.
Graham is still denying his Motte-and-Bailey:
https://www.drroyspencer.com/2022/06/uah-global-temperature-update-for-may-2022-0-17-deg-c/#comment-1327951
#14
Willard, please stop trolling.
Bill is *still* racehorcing, Graham:
https://www.drroyspencer.com/2022/06/uah-global-temperature-update-for-may-2022-0-17-deg-c/#comment-1328272
Please help him acknowledge that the output of the energy balance model of the Earth imposes a hard constraint on those who abide by the laws of thermodynamics.
#15
Willard, please stop trolling.
Willard is lost in the trees like that MTA guy.
Bill is still fumbling a fairly basic accounting problem.
#16
Willard, please stop trolling.
Bill has almost conceded that you are running a con, Graham.
Please make him stop.
#17
Willard, please stop trolling.
Graham is still clinging to his silly talking points, this time it is the Flat Earth silliness:
https://www.drroyspencer.com/2022/06/uah-global-temperature-update-for-may-2022-0-17-deg-c/#comment-1328735
After having provided a model that only specifies a disc, it is quite a cheeky move!
#18
Willard, please stop trolling.
Have you *still* not found a way to make the Earth produce more energy than it receives with a diurnal cycle, Graham?
#19
Willard, please stop trolling.
Please tell me to PST, Graham.
#20
Willard, please stop trolling.
Thank you, Graham.
One last Dragon Crank leg to go.
#21
Willard, please stop trolling.
Bindiwrong Foresting update – La Nina not gone by April
https://youtu.be/XdUbpCNxS8A?t=336
Superdeveloping triple-dipper La Nina effect, Experts are starting to catch up,
Bindidong very sad, very sad
https://youtu.be/W9bfdv0jMRw
Vietnamese called. triple-dipper La Nina did not finish by April, they want their money back
https://youtu.be/Uk7nBEgtGzA
Ask me again , where is the superdeveloping La Nina ???
https://youtu.be/KrE3JOMuTWg
To add to why the ONI (and the ENS ONI) is useless for long term trends, look at the 15 year HQLP filtered signal.
https://climatedatablog.files.wordpress.com/2022/06/oni.jpeg
https://climatedatablog.files.wordpress.com/2022/06/ens-oni.jpeg
See how it reflects the constantly changing reference periods in both series.
The effect of rolling reference periods might be that they detrend the resulting time series:
https://drive.google.com/file/d/1IqX-mIkyIsi1PEhkJy6dGjku1oB0TlKm/view
Who knows…
Source
https://psl.noaa.gov/data/correlation/oni.data
https://www.metoffice.gov.uk/hadobs/hadisst/data/download.html
Your source for ONI data is the same as mine.
The source for the Nino 3.4 data is as specified.
https://climatedatablog.files.wordpress.com/2022/06/nino34-6.jpeg
With just a 36 month LP filter it will not show the results I have shown.
P.S. The Nino 3.4 series is NOT detrended. The ONI uses a continuously changing reference period as my graph shows.
P.P.S. You S-G filter is still letting though too much HF. Either you are using a very high curve factor (I use a second order as is usual) or there is something wrong with your implementation. If you use a CTRM (or even an SRM) of the same window length you will see that it does not pass those high frequencies. The SRM will display some distortions as expected though.
” You[r] S-G filter is still letting though too much HF. ”
As usual, insinuations and claims instead of proofs.
Linsley Hood, it seems that you deliberately ignored what Mark B told about the similarity between my S-G implementation’s output and that of the one he uses, based on Python libraries.
I hope you aren’t arrogant enough to doubt about their quality, but…
“As usual, insinuations and claims instead of proofs”
I am quite prepared to put a CTRM and an S-G with the same window on the same graph to show what I claim.
Are you?
“Mark B told about the similarity between my S-G implementations output and that of the one he uses, based on Python libraries”
So either you believe that Vaughn Prat was wrong when he came up with the factors for the CTRM or SavitzkyGolay were when they came up with their methodology for their filter. Which is it?
Me? I put it down to the fact that you never could get rounding correct.
SG is a family of filters so we’d need clarification on what you’ve done to assess your claims.
To really settle the matter, you’d want to show the complete specification of the filter, the convolution coefficients generated from the specification you’re using, and the software or software package used to generate it.
To be precise I’m asking for
1) Identification of the software you’re using for SG.
2) The specific call(s) to the software.
3) Convolution coefficients generated by SG software.
1). The source for the S-G algorithm I am using in C#
https://github.com/mathnet/mathnet-filtering/issues/4
2). My calling of it (for a 15 year window)
double[] filteredLongTermSignal = new Filtering.SavitzkyGolayFilter(15 * 12, 2).Process(noisyLongTermSignal);
3) See 1.
A direct comparison between a CTRM and a S-G of the same window size is the verification step I am using that what I am doing is correct.
RLH says: A direct comparison between a CTRM and a S-G of the same window size is the verification step I am using that what I am doing is correct.
Your SG code produces the same impulse response as the Python library I referenced earlier and it’s not at all the same as the CTRM impulse response.
As a low-pass filter, SG will have high frequency leakage as per Bindidon’s plots.
If you’re getting the same output, you’re doing something more than what you’ve told us.
Both S-G and CTRM are low pass filters.
Are you saying that Vaughn Pratt is wrong in the claim about CTRM?
“As a low-pass filter, SG will have high frequency leakage”
In the very, very low dB possibly. Certainty none worth speaking of more than 4 times the corner frequency. That will not show up in the plot which is not log based.
“Your SG code produces the same impulse response as the Python library I referenced earlier and its not at all the same as the CTRM impulse response.”
So my S-G is correct but for some reason you think that a CTRM is not an equivalent LP filter. Why is that?
….360 month LP filter….
i.e. 30 years.
This will even out what the 180 month (i.e. 15 years) filters shows.
The ONI reference period is updated every 5 years.
https://origin.cpc.ncep.noaa.gov/products/analysis_monitoring/ensostuff/ONI_v5.php
Linsley Hood
Stop replying before having a proof of what you arrogantly claim.
And stop teaching the world all the time about what we all can find by ourselves.
Jesus!
I am very precise in what I claim. Do you want the vertical or horizontal precision per pixel in degrees or in days of the year?
I have absolute proof of what I claim. You use (badly) Excel (or the equivalent) and we all know that you cannot get rounding correct.
Until you can present, on the same graph, both a CTRM and an S-G with the same window showing the same result then you are just a boasting idiot. As we all know you are.
https://www.drroyspencer.com/2022/06/uah-global-temperature-update-for-may-2022-0-17-deg-c/#comment-1326233
Bindidon says: The effect of rolling reference periods might be that they detrend the resulting time series:
Yes, the ONI process detrends the resulting time series. It’s not a linear detrending, rather it essentially follows any multi-decadal tendencies in the average whether warming or cooling. The resultant ONI product retains the part of the raw signal with variations on the order of a decade or faster.
In other words the ONI product is essentially the Nino 3.4 SST after passing through a particular high pass filter that passes frequencies faster than about a decade.
More here
Yup. And its effects are as displayed in my graph. The ONI is useless for any ‘trend’ that is longer than 5 years as its base reference period changes that often.
” Its not a linear detrending, rather it essentially follows any multi-decadal tendencies in the average whether warming or cooling. ”
Thank you Mark B for your comment with the usual precision.
Eye-balling the S-G smoothing for ONI shows already that the detrending was not the result of any intention.
Otherwise, the trends for both source and smoothing would be very near zero, like for e.g. the detrended AMO.
*
It seems by the way that Linsley Hood is still not ready to acknowledge your comment on my Savitzky-Golay outputs, let alone my reaction to your comment:
https://www.drroyspencer.com/2022/06/uah-global-temperature-update-for-may-2022-0-17-deg-c/#comment-1324408
*
He can name me a boasting idiot as long as he wants, or lie about alleged rounding errors in my computations: no problem for me.
I still await his technical contradiction for my USCRN results which would be wrong because I don’t use USCRN’s subhourly data:
https://drive.google.com/file/d/15gED_1O6F5g5vvCulg71D3APZw9Nl9Ky/view
All Eyes on SCOTUS: Supreme Court to Issue Climate Endangerment Finding Ruling To Decide if EPA, or Congress, has authority to regulate CO2
Has anyone read the ruling? They ruled against the EPA, but did they correct the previous opinion that CO2 is a pollutant?
The Court appoints itself instead of Congress or the expert agencythe decisionmaker on climate policy. I cannot think of many things more frightening, Kagan wrote.
I can think of a few things more frightening, like she being on the Supreme Court in the first place. A general problem with the US congress is handing over legislation-making authority to unelected so-called experts.
Congress is the ultimate authority. All the Supreme Court is deciding is whether Congress delegated that authority to the executive.
Its hard to imagine a person being appointed to the Supreme Court somebody who couldn’t get that question right on a high school civics examination. If thats not frightening enough its even scarier if she knows the answer and is still willing to politicize the court to do what Congress can’t agree on doing.
Prepare for the third dip
and ask Bindiwrong Forecasting .Ink for your refund
https://youtu.be/Lyiq0UI1Zkg
So now Blinny’s supporter, Mark B, has agreed that my S-G implementation is the same as his (and was so all along), what will Blinny do now?
Jesus Linsley Hood!
https://www.drroyspencer.com/2022/06/uah-global-temperature-update-for-may-2022-0-17-deg-c/#comment-1326229
I cite Mark B:
1. ” Your SG code produces the same impulse response as the Python library I referenced earlier and its not at all the same as the CTRM impulse response. ”
2. ” As a low-pass filter, SG will have high frequency leakage as per Bindidons plots. ”
3. ” If youre getting the same output, youre doing something more than what youve told us. ”
It is clear that you manipulate this blog’s readers, for example with wrong window sizes, as I explained you already.
You are such a poor, disgusting liar, Linsley Hood.
Mark B did not at all agree with you. NOT AT ALL!
“1. Your SG code produces the same impulse response as the Python library I referenced earlier
Sure. Idiot. The S-G produces the same result.
Notice that the window size for the S-G is correct, in this case 15 * 12 months.
It produces the nice clean lines you see.
Want to actually publish a CTRM and a S-G with the same window size?
https://www.drroyspencer.com/2022/06/uah-global-temperature-update-for-may-2022-0-17-deg-c/#comment-1326233
https://climatedatablog.files.wordpress.com/2022/06/oni.jpeg
https://climatedatablog.files.wordpress.com/2022/06/ens-oni.jpeg
P.S. The thick blue 15 year line is a CTRM.
I repeat:
Mark B did not at all agree with you. NOT AT ALL!
And that is what matters here, Linsley-Hood.
“1. Your SG code produces the same impulse response as the Python library I referenced earlier”
So Blinny, what 3 measuring periods do you think that a 12 month Cascaded Triple Running Mean (CTRM) should have?
I think they should be 12, 10 and 8 months based on Vaughan Pratt’s calculations of using factors of 1.2067 then 1.5478.
12 / 1.2067 = 9.9445 = ~10
12 / 1.5478 = 7.7529 = ~8
And 180, 149 and 116 months for the longer 15 year CTRM.
And you think that CRTMs are ‘wrong’ but don’t have the guts or competence to say that Vaughan Pratt is.
Fearless forecast for June UAH Global >> +0.21.
gbaikie is the forecast record holder, hard to beat a humble record holder….
zero point zero
missed by this much |
0.15
https://oz4caster.files.wordpress.com/2022/06/d1-gfs-gta-daily-2022-06-30.gif
is what CFSR says about surface temperatures recently.
So less than this month for UAH would seem appropriate. How much is the question.
Australia has been so col.
ENSO still at 18.
Surely time for a little temperature drop?
0.20C???
Comment count by poster for May anomaly blog post.
JunePosts.png
RLH : 1569
Willard : 598
Dr Roys Emergency Moderation Team : 416
barry : 352
Bill Hunter : 223
Antonin Qwerty : 194
Nate : 194
Bindidon : 174
Clint R : 128
Gordon Robertson : 116
Ball4 : 113
Eben : 93
gbaikie : 68
E. Swanson : 66
bdgwx : 61
bobdroege : 44
Ireneusz Palmowski : 40
stephen p anderson : 36
Chic Bowdrie : 35
Entropic man : 31
I must try harder.
You live in here
RLH is completely out of control. barry is in full meltdown.
And poor Norman has flamed out.
I’m not terribly suprised to see that Dr Roys Emergency Moderation Team, despite having posted a lot more than barry and Norman, neither ‘is in full meltdown’ let alone ‘has flamed out’.
Au royaume des aveugles, le borgne est roi!
Correct Bindidon, DREMT keeps his comments on science. He only gets personal if attacked.
barry and Norman don’t know any science, like you, so they must resort to insults and false accusations. barry recently went over the top (full meltdown), and Norman no longer comments (flame out).
So his popular please stop trolling comments are science.
Well that’s good to know.
The mooncalf squad has redefined science.
Hmmm, they do a lot of redefining.
“DREMT keeps his comments on science.”
Hahahaha. Oh really?
Clint, please stop trolling.
bobdroege, barry, please stop trolling.
testGreat Post
PGslot new arrival with good promotion and can try to play for free, free of charge, fast deposit, fast withdrawal, try to play at ลองเล่นสล็อตpg
I am creating 800$per hour on-line from my workstation. A month within the past I got take a look at of roughly 45k$, this on line paintings is straightforward and direct, dont wish to go office, Its domestic on line activity. (nh+65 By then this paintings chance is begin your paintings. Here->>
speak for you.
comprare patente di Guida
” Maculae in corpore Solis ad eundem situm in discus Solis redeunt diebus 27 1/2 circiter, respectu Terrae; ideóque respectu fixarum Sol revolvitur diebus 25 1/2 circiter. “