Summary
The simple CO2 budget model I introduced in 2019 is updated with the latest Mauna Loa measurements of atmospheric CO2 and with new Energy Information Administration estimates of global CO2 emissions through 2050. The model suggests that atmospheric CO2 will barely double pre-industrial levels by 2100, with a total radiative forcing of the climate system well below the most extreme scenario (RCP8.5) used in alarmist literature (and the U.S. national climate assessment), with the closest match to RCP4.5. The model also clearly shows the CO2 reducing effect of the Mt. Pinatubo eruption of 1991.
The Model
As described here, the simple CO2 budget model uses yearly sources and sinks of atmospheric CO2 to compute how much the atmospheric CO2 concentration changes from one year to the next.
The sink (removal) of “excess” atmospheric CO2 assumes that all of the biological and geophysical processes that remove CO2 from the atmosphere do so at a net rate proportional to the excess of the CO2 value above some ‘equilibrium’ value. When the model is calibrated with the yearly Mauna Loa CO2 data from 1959 through 2021, this rate of removal is 2.02% of the atmospheric excess above 294 ppm. So, for example, at the current CO2 concentration of 417 ppm, the biological and geophysical removal processes are removing 0.0202 x [417 – 294] = 2.48 ppm per year for 2022 (preliminary estimate).
The long-term source of CO2 increase is assumed to be anthropogenic. There are various estimates of yearly CO2 emissions, some from energy use alone, some including cement production and land use. I’ve used the Boden et al. (2017) and Our World in Data yearly estimates for 1750 through 2009, and EIA.gov estimates of yearly emissions growth rates from 2010 to 2050, and then assumed their 2050 growth rate is constant to 2100.
I also have included an ENSO term (El Nino and La Nina) to empirically account for CO2 rising during El Nino and decreasing during La Nina. This term amounts to 0.45 times the Multivariate Enso Index (MEI) value averaged from May of the previous year through April of the current year. For example, the latest yearly-average MEI value is -1.29 (La Nina conditions), so 0.45 x [-1.29] = -0.58 ppm CO2 decrease in 2022 from La Nina activity.
The model is initialized in 1750. The MEI data are included starting in 1958-59.
Results
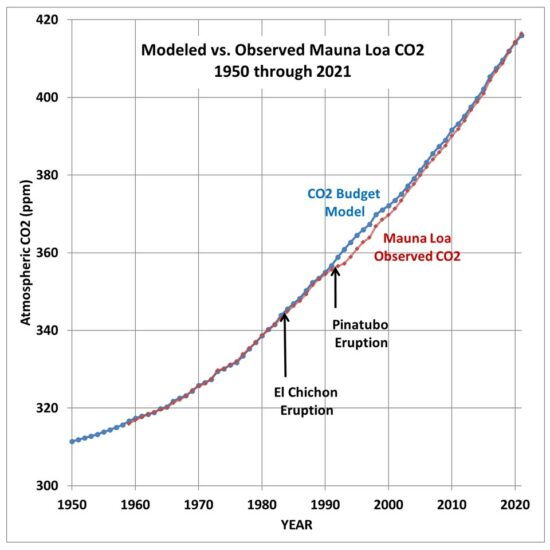
The model fit to Mauna Loa CO2 data is shown in Fig. 1. Note that the largest discrepancies between model and observations are due to major volcanic eruptions, especially Mt. Pinatubo in 1991.
Contrary to popular perception, these eruptions actually remove CO2 from the atmosphere. This is likely due to increased photosynthesis due to a large increase in diffuse solar radiation from the sky, from sunlight scattered by volcanic aerosols, which can penetrate deeper into vegetation canopies.
When we run the model using 2021 EIA estimates of yearly CO2 emissions increases from 2010 through 2050, and then assuming the 2050 increase remains the same to 2100, the resulting atmospheric CO2 scenario is closest to the IPCC RCP4.5 scenario. The model CO2 concentration barely reaches the 2XCO2 level, a doubling of the pre-industrial CO2 level.
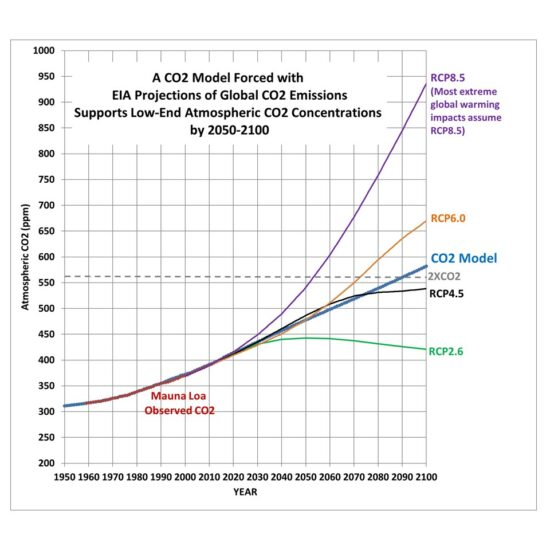
Note the model is well below the RCP8.5 scenario, which is the one most often used to promote alarmist projections of sea level rise, temperature increase, etc. The weaker the future radiative forcing from increasing CO2, the weaker resulting climate change will be.
Discussion
Climate model projections depend critically upon how much atmospheric CO2 will rise in the future. That, in turn, depends upon (1) future anthropogenic emissions, and (2) how fast nature removes “excess” CO2 from the atmosphere.
A simple budget model of the atmospheric CO2 concentration very accurately matches the Mauna Loa CO2 data during 1959-2021 using yearly estimates of global anthropogenic CO2 emissions as a CO2 source, and the observed average rate of removal of CO2 by biological and physical processes, which is proportional to the “excess” of atmospheric CO2 over a baseline of 295 ppm as a sink. An empirical factor to account for El Nino and La Nina activity is also included, which mostly affects year-to-year fluctuations in CO2.
The resulting model projection produces atmospheric CO2 concentrations late this century well below the IPCC RCP8.5 scenario, and even below the RCP6.0 scenario. This suggests that the most dire climate change impacts the public hears about will not happen. Note that this likely reduction in future global warming impacts is in addition to the evidence that the climate system is not as sensitive to increasing CO2 as is claimed by the IPCC. In other words, future climate change will likely be much weaker than projected due not only to (1) lower climate sensitivity, but also (2) weaker anthropogenic forcing, and it is the combination of the two that determines the outcome.
Dr. Spencer,
Why don’t climate model projections have natural emissions as one of the components?
They do. IPCC climate models use radiative forcing scenarios that come from carbon cycle models. Those models simulate the huge natural flows of CO2 in and out of the surface. But like the climate models, they are “calibrated” so that the natural flows balance, and then only humans cause an imbalance (atmospheric increase).
I actually have made $18k within a calendar month via working easy jobs from a laptop~ni185~As I had lost my last business, I was so upset and thank God I searched this simple job achieving this Im ready to achieve thousand of dollars just from my home~ni185~All of you can certainly join this best job and could collect extra money on-line visiting this site> http://lifechange.gq
Great
Greats
That
is a construct that fits their Carbon Cycle Model narrative which treats natural and fossil fuel CO2 differently. Chic Bowdrie’s model (based on Berry et.al.’s work) also matches the Mauna Loa data and doesn’t treat anthropogenic CO2 differently. However, I do understand the point you’re making. Even, if we accept their assumptions, there is no dire scenario.If you implement in a model that the only change in CO2 comes from human sources, then the climate model will always infer that all change in the climate model comes from the humans.
What do I miss?
Some claim that the anthro emissions are too small to matter.
And that there has been a much larger change in natural emissions that just so happens to match the 150 year history of the anthro emissions.
Thus human emissions vanish, but are replaced by natural with an identical appearance.
This is the ‘Body Snatchers’ theory.
But they never offer evidence that these extra natural emissions exist, nor ever plausibly explain a mechanism for them.
What about the sinks?
For the human emissions to not matter, there should be less natural emissions if sinks were the same.
So would one not have to explain away natural emissions?
AJ,
The natural emissions and sinking are mostly cyclical. Daily or seasonal. For example the summer leafing out of the N. Hem. forests, absorbing vast amounts of CO2, then dropping leaves in the Fall and releasing carbon back to the atmosphere. This produces the major annual oscillation in the Mauna Loa CO2 record.
Daily there is plant respiration. When the ocean warms in summer it outgasses, when it cools in winter it sinks back into the ocean.
These natural emissions are moving carbon around cyclically between three reservoirs (ocean surface mixed layer, atmosphere, biosphere), but not adding any new carbon.
While anthro carbon is adding new (long stored) carbon to the system every year.
Two different phenomena happening at the same time.
Much of the sinking you mention is simply part of the seasonal or daily cycles, and is happening for both anthro carbon and natural. The added carbon also gets moved around to all 3 reservoirs.
As a result, all 3 have increased their carbon content.
The sinking of the excess carbon in all 3 reservoirs to the deep ocean is what matters here. That is a very slow process.
Thus added anthro carbon is persistent in the atmosphere (and mixed layer, and biosphere).
Maybe of interest,
https://www.sciencedaily.com/releases/2010/11/101102131108.htm
Humans absorb and emit about 2 tons of carbon per year, in a cyclic process.
A growing human might gain 2-3 kG, NET, per year. 1/1000 as much. This added carbon can persist in the human for ~ 80 y, before sinking back to the atmosphere.
Roy W Spencer says:
Those (carbon cycle) models simulate the huge natural flows of CO2 in and out of the surface. But like the climate models, they are calibrated so that the natural flows balance, and then only humans cause an imbalance (atmospheric increase).
I’m not sure what to make of this assertion. It would be kind of silly for a model not to achieve a net balance in accounting for whatever reservoirs it models. It’s also clear that the carbon cycle models don’t wind up with all human emissions in the atmospheric reservoir. So what exactly is “calibrated” to balance?
One question I have that I’d like to see addressed here, the population and tourist trade in and around the Hawaiin Islands has absolutely exploded since the Second World War. Therefore, how can we be completely sure that at least part of the CO2 getting picked up on Mauna Loa isn’t from local sources rather than global?
Local sources can and often do affect climate. It is a statistical fact that Phoenix and Tucson, AZ, are both a lot hotter than they were just 50 years ago. But how much of that increase in heating is coming from “global warming” and how much of it is locally generated from the heat island effects of those large urban areas?
Regards,
Fred M. Cain
CO2 observations are made in sites other than Mauna Loa and the corroborate the growth rates seen there.
The link below show the annualized growth rate from observation sites at MLO (Mauna Loa, Hawaii), SMO (American Samoa), and SPO (South Pole, Antarctica):
CO2 Growth Rates
Also, Mauna Loa is very high above the less populated Big Island.
The trade winds bring CO2 from the East over a vast expanse of ocean.
I’m not seeing the figures on my Kindle Fire. The error message was that the website redirected me too many times.
I sometimes get that, too. I don’t know why.
GeekSpeak: It’s likely your ISP doesn’t have a direct DNS (Domain Name Service) route to drroyspencer.com, so it routes “upward” to a larger and larger IP umbrella until it finds a DNS match.
More GeekSpeak: If you are curious, open a shell (cmd.exe, bash, etc.) and run ‘tracert 172.67.184.213’ without the quotes. You’ll likely see several lines with your ISP’s domain indicating its DNS search chain. If you are using a VPN service, it may insert a few hops too. If you are in a remote area, expect a couple more.
They give American state $85 associate hour to end work on an Apple laptop. I definitely didnt assume it had been possible, however my sure friend created $26,000 in mere four weeks acting on this easy chance {ec83} and he or she influenced me to offer it a try. Discover a lot of directions by
visiting the subsequent link http://takegoodwork24.blogspot.com/
Dr Spencer, for what it’s worth, I believe you.
Question about CO2 concentrations.
Currently its 410 ppm.
The reconstructions point to concentrations higher than 5000 ppm. Does that mean there was more CO2 in the atmosphere as now or does that mean there was less atmosphere and CO2 made up a larger percentage because there was less O2 and N2?
How do we know that there was 1 atmosphere of pressure a million years ago and more?
I answered this on the previous thread.
How do we know that there was 1 atmosphere of pressure a million years ago and more?
“We dont know.
We can infer limits. If pressure or oxygen content gets too low animal breathing systems like lungs, gills and trachea cannot supply enough oxygen. Low oxygen levels may have contributed to mass extinctions. In at least one of them low oxygen tolerant genera survived better than those intolerant of low oxygen.
During the Carboniferous there were some very large flying insects. These would have need a higher oxygen content to generate enough energy and a higher atmospheric pressure to make flight aerodynamically possible. “
You should be a science fiction writer. You’re all about speculation.
Not sure why you say that.
Speculation about historical atmospheric pressure is fiction if we do not have the science to back it up. And if there is some science arguments, then it becomes a theory.
Talking of it. This sounds like science fiction too:
Contrary to popular perception, these eruptions actually remove CO2 from the atmosphere. This is likely due to increased photosynthesis due to a large increase in diffuse solar radiation from the sky, from sunlight scattered by volcanic aerosols, which can penetrate deeper into vegetation canopies.
Shield volcanoes are very different beasts from small intermittent eruptors like Pinatubo. They erupt massive amounts of material and enough carbon dioxide to trigger significantly changed temperatures, ocean PH and oxygenation.
I suggest you research the Deccan and Siberian Traps.
Untestable theories are speculation.
Name a few then! I can think of some.
Yes. I’m that sort of scientist.
I take what data is available about the past or present in the field and try to infer local conditions from them. I’ve been doing so since the 1970s when I was inferring local average temperatures from the pollen species present in peat bogs.
Rather different from the comforting certainties of controlled experiments in laboratories.
They give American state $85 associate hour to end work on an Apple laptop. I definitely didnt assume it had been possible, however my sure friend created $26,000 in mere four weeks acting on this easy chance {ec84} and he or she influenced me to offer it a try. Discover a lot of directions by
visiting the subsequent link http://takegoodwork24.blogspot.com/
This is why skeptics are losing the debate , by debating the wrong points.
If you debunk the CO2 can cause warming by using the demonstrable laws of fizzix you don’t need to argue how much is in there, especially pointing out the thermodynamics law breaking energy budget where ground is reabsorbing its own emitted energy and increasing its temperature that way.
When you just keep arguing the amount of CO2 you basically just handed it to the ararmistas
In terms lukewarmer [skeptics] the debate over as results are in.
The facts are we in icehouse global climate which currently has very
cold ocean. The cold ocean has made last couple million year the coldest period in our Ice Age. Having a cold ocean anything less than say average ocean temperature 6 C or colder causes low global CO2 levels.
The warmest time of the Holocene was over 5000 years ago, or global average surface air [and ocean] have been slowly cooling for 5000 years.
What left to argue about is how cold will get in say 1000 years.
In terms of CO2 emissions, it seems to me that China has reached peak Coal.
It seems the stupid idea of burning wood for electrical power, is done.
There will be increase in CO2 emission from coal burning in poorer countries [and Germany which has no excuse}. This could be limited by focusing on natural gas. But if not, it’s not much of addition to CO2.
Though perhaps nuclear energy use can also lower CO2 emission in poorer countries [including Germany].
We might in the future want higher levels of CO2, and we could burn wood to do that.
Can you go be lunatick in somebody elses threads ,
Thank you
All these threads are Roy’s threads.
And with superhuman power, he manages to ignore most of them.
“If you debunk the CO2 can cause warming by using the demonstrable laws of fizzix”
Yep, Eben, fizziks will do the trick.
So, if those of us who think masks are of limited help in protecting against COVID would just claim they are of zero use, we could win the debate? Thanks for the tip!
Or, based on this study, “Carbon dioxide increases with face masks but remains below short-term NIOSH limits”, one might conclude that long term mask wearing is more deleterious to health, than the danger of going maskless.
I would point out that Covid 19 virus bodies are significantly larger than CO2 molecules, and are presumably retained by the mask to an even greater extent, thereby increasing the chance of infection by rebreathing the trapped virus.
As only one virus is sufficient to infect a human, why concentrate them within a mask?
Maybe a garland of garlic may be as useful, “In conclusion, Allium sativum may be an acceptable preventive measure against COVID-19 infection to boost immune system cells and to repress the production and secretion of proinflammatory cytokines as well as an adipose tissue derived hormone leptin having the proinflammatory nature.” (from a peer reviewed Elsevier paper), with the added benefit that nobody wearing garlic has ever been attacked by a vampire!
I ascribe my Covid free status to good luck.
I’ve wondered if all CO2 with “old” carbon is considered anthropogenic in models like these? Natural sources of old carbon include oil and gas seeps, coal fires and weathering of coal outcrops, volcanoes and warming oceans. As the last major Ice Age ended about 13,000 years ago massive sources of CO2 with old carbon began to be released naturally as their frozen sources warmed and/or melted. These include: 1) Oxidizing peat and other vegetation trapped in melting permafrost, 2) Onshore gas hydrates released from melting permafrost, 3) Offshore gas hydrates like the massive bubble trains — termed VAmpS — seen during 1980s cruises of R.V. S.P. Lee in the Bering Sea and Aleutians, 4) Unstable methane hydrates on the continental slopes of northern oceans, and possibly 5) decreased solubility of CO2 in warming ocean water. All these sources of carbon are older than three or four ~5000-year half lives of C14 and could mostly be mistaken for C from people burning fossil fuels. Rapid natural cycling of carbon is indicated by the quick reduction in atmospheric C14 following the end of atmospheric nuclear testing. Presumably this draws on some sources with old carbon. Models treating all old carbon as anthropogenic would overstate man made CO2 and man made climate change.
IPCC differentiates carbon into fast carbon and slow carbon.
You can come at human emissions from two directions. You can estimate them from changes in concentration, subject to the usual uncertainties or you can do it by accounting for the amount of fossil fuel burned and the release from other human activities.
Put them all together and you get human emissions about equivalent to 4mm/year and 2mm/year taken out of the atmosphere into other reservoirs.
Other natural sources and sinks are so far fairly small by comparison
The concern about natural CO2 emissions is that they are temperature sensitive and non-linear, so they ma continue to increase CO2 concentrations even if we stop.
https://www.nature.com/articles/s41598-020-75481-z
Entropic Man, please stop trolling.
http://paradigm2.net.au/the-regression-of-atmospheric-concentration-on-carbon-dioxide-emissions/
Plain Language Summary
When using climate models to make projections of future climate it is important to know how the atmospheric concentration of CO2 will change in response to changes in carbon emissions. The impulse response of concentration due to emissions summarizes the required information in a single curve from which the response to any arbitrary emissions scenario can be easily determined. It is a curve showing how the concentration will change following a single short impulse in emissions. The impulse responses widely accepted by the modelling community all have a remnant fraction of between 10 and 20 percent implying that this fraction of emitted CO2 remains in the atmosphere forever. These curves are, themselves, based on circulation models similar to climate models. This paper develops a statistical technique for estimating the impulse response directly from the data while making no assumptions about the underlying physics. The impulse response estimated in this way shows that CO2 remains in the atmosphere for a shorter time than hitherto supposed and has no remnant fraction. All the CO2 presently generated by fossil fuel will ultimately leave the atmosphere; half will be gone in the next half century.
I can see why it was rejected.
No mention that the atmosphere is one of three interconnected reservoirs that make up the pool of circulating carbon; land, atmosphere and ocean. No mention of the dynamics of carbon sinks. No mention of the mechanisms of the mechanisms which control the movement between reservoirs and the equilibria involved.
This guy was trying to “debunk” the current theories regarding the fate of carbon released into the atmosphere without even understanding the carbon cycle.
Entropic Man, please stop trolling.
Any indications of impact of the recent Tonga submarine eruption on weather/CO2 levels/climate?
Negligible.
They give American state $85 associate hour to end work on an Apple laptop. I definitely didnt assume it had been possible, however my sure friend created $26,000 in mere four weeks acting on this easy chance {ec85} and he or she influenced me to offer it a try. Discover a lot of directions by
visiting the subsequent link http://takegoodwork24.blogspot.com/
Why is global temperatures lower when there a huge mile thick ice sheet on most of North America.
Kind of obvious.
What causes global surface air temperature?
70% of the surface which is ocean.
Our average ocean surface air temperature is about 17 C
And average land surface air temperature is about 10 C
The total equals an average global surface temperature of
about 15 C.
So the ice sheet on most of North American doesn’t make much
difference.
What makes a significant difference is when the ocean is covered with sea ice.
And the amount sea ice depends upon the average temperature of the ocean.
Am Ocean with average temperature of 3.5 C, has a lot polar sea ice and ocean average temperature of 3 C, has a lot more. And ocean of 4 C doesn’t have much in the winter..
Care to comment on the effect of ice albedo?
Yeah, sure, cover Mars with snow, and it warms Mars.
Venus at Earth distance, absorbs less sunlight and emits less energy
and it’s colder than Earth.
Mars atmosphere is so small, warming or cooling the vacuum like air
doesn’t make Mars warmer or cooler in any significant way.
Or Moon has has lower average surface temperature as compared to Mars, one could say Mars whatever Mars average air temperature is it’s warmer than Moon.
But say, talking about at 1 meter depth of lunar surface, that would an average temperature higher than it average surface temperature.
And in sense 1 meter below surface Moon is warmer than Mars.
And say living in caves in either Mars or Moon, they roughly the same. A Cave on Moon could be very cold, like 50 K, and probably will not find any cave on Mars which is this cold. But a cave temperature
on Mars or Moon is not really a problem. A cold cave could be useful as cold storage area. But one make into a sauna, if you wanted to.
Anyhow a cold cave could be regarded as a resource, and to get a hot cave resource, one have to go really deep under the surface.
With both Mars and Moon, it seems one could go really deep- ie, 10 km or more under the surface, where this not really possible on Earth.
Predictions are difficult — especially about the future.
So don’t make predictions, make projections.
What’s the difference?
A prediction is a forecast of an exact outcome.
“The GISS global annual average temperature for 2042 will be 1.50C.”
A projection includes a measure of uncertainty.
“There is a 95% probability that the GISS global annual average temperature for 2042 will in the range 1.5.0C +/- 0.1C.”
There’s no uncertainty in a prediction?
And a projection characterized by a 95% confidence interval doesnt have an exact center of mass?
“‘Prediction’ conveys a sense of certainty while ‘projection’ is associated more with the possibility of something happening given a certain set of plausible, but not necessarily probable, circumstances.”
The uncertain circumstances are the future human emissions.
The uncertain circumstances are the impact of future human emissions.
The difference between prediction and projection is that for a prediction given circumstances are fixed and the result is specific, while for a projection it is allowed that the given circumstances are mutable, and therefore projections tend to be more probabilistic and are usually expressed via alternative scenarios.
Other waysof looking at it.
A prediction implies certainty while a projection implies uncertainty.
A prediction may just be a guess while a projection is the result of some form of analysis. For example, many projections are couched as a frequency distribution.
You can then give a range and probabilities within that range. The mean or mode may be the most likely outcomes, but there is no reason why they are inevitable.
Tim, based on the projection of the responses I predict that there will be no consensus on the differences of the meaning. But I am only 50 percent sure.
A “projection” is nothing more than a word game. The correct technical term for a projection is extrapolation. That requires an assumption that the missing data will behave in the same way as the previous data with all of the inputs and relationships being the same. Does anyone seriously believe that? For example, structural engineers are allowed to use linear interpolation of data in between data points for strength vs temperature values. Extrapolation is never allowed.
RCP 4.5 might not be a walk in the park:
https://andthentheresphysics.wordpress.com/2020/02/09/but-rcps/
Well, given that you’re deeply, profoundly, wrong about anything, when you’re not trolling, that is good news.
Oh, Kennui.
Willard, please stop trolling.
WHOOSH!
Brandon, please stop trolling.
Please read for comprehension, DREMT.
#2
Brandon, please stop trolling.
Anybody contemplating discussion of carbon and carbon dioxide concentrations might want to study the carbon cycle first.
https://projects.noc.ac.uk/greenhouse_gas_science/sites/greenhouse_gas_science/files/images/ccycle.jpg
Hey Evolution man,
Which decided to come first, the chicken or the egg?
For egg substitute DNA.
A chicken is it’s DNA’s way of making more copies of its DNA.
How does DNA make a decision?
It doesnt, but a population of DNA molecules is subject to mutation and to natural selection of the organisms they build.
Succcess is passing on more copies of their DNA and that DNA becomes more abundant.
Failure is dying or passing on fewer copies of their DNA, which becomes less abundant.
By the way, genetic mutations almost always lead to the specie’s death.
The “decision” is encoded in the DNA analogous to a flowchart in computer science. DNA uses Messenger RNA to communicate that “decision” to protein synthesis mechanisms that in turn affect biological processes.
“By the way, genetic mutations almost always lead to the species death. ”
Yes. It has been estimated that at least a billion species have evolved since life started here. Almost all of them are now extinct. By its nature, natural selection is a short term process.
On the other hand, the DNA which codes for glycolysis enzymes has been outstandingly successful and has been copied in every organism on the planet for the last 3 billion years.
More speculation. I’ll offer my own more plausible. Maybe it was programmed into every single organism.
The egg was around before chickens first appeared.
Is that the IPCC carbon cycle I asked you questions about? Are you ready to answer now?
Like, how did the anthropogenic carbon get into the deep ocean?
Offhand, diffusion, turbulent mixing and the thermohaline circulation.
And of course the constant rain of organic material.
The concern about natural CO2 emissions is that they are temperature sensitive and non-linear, so they may continue to increase CO2 concentrations even if we stop.
https://www.nature.com/articles/s41598-020-75481-z
Dr. Spencer, you assume, “all of the biological and geophysical processes that remove CO2 from the atmosphere do so at a net rate proportional to the excess of the CO2 value above some ‘equilibrium’ value.”
This is contraposed to the more physically correct model that those processes more likely remove CO2 by a first-order kinetic mechanism. IOW, the removal of CO2 is proportional to all the CO2 in the air, not just the excess over some assumed, and probably non-existent, equilibrium value.
I will update my model, based on a revision of yours, using a constant removal rate constant. That model requires CO2 sources in addition to the Boden data emissions. The difference between the models greatly affects future predictions.
Can’t wait.
“This is contraposed to the more physically correct model that those processes more likely remove CO2 by a first-order kinetic mechanism. IOW, the removal of CO2 is proportional to all the CO2 in the air, not just the excess over some assumed,”
Remove CO2 to another reservoir, like the deep ocean.
Which has processes that remove its “CO2 by a first-order kinetic mechanism” back to the atmosphere,
with a removal rate proportional to all the CO2 in that reservoir. Which for the deep ocean is essentially unchanged from the equilibrium value.
Thus the NET removal rate is proportional to the DIFFERENCE in CO2 between the two reservoirs, which is proportional to the difference between the atmospheric CO2 and the equilibrium value.
correction:
“proportional to the DIFFERENCE in CO2 concentration in the two reservoirs”
The atmosphere’s removal rate is only proportional to the concentration in the atmosphere, not the net difference between the two. Chic just told you it’s a FIRST ORDER differential equation. The surface ocean and the deep ocean have completely different e-times. Berry calculated those in his third paper and shows their interrelationships. That’s how Berry showed that the IPCC’s anthropogenic carbon cycle is BS. By the way, maybe you can answer since you brought it up, how did the anthropogenic CO2 get into the Deep Ocean?
Also, the model Dr. Spencer presented does not claim removal is proportional to the difference. It argues that the removal rate is only proportional to
CO2.“not the net difference between the two.’
No Stephen, the deep ocean is sending CO2 flux to the surface ocean (mixed layer) every year via upwelling of CO2 rich water…
In the absence of the excess atm CO2, the downward and upward fluxes were near balance, in equilibrium.
For the deep ocean, it is so large that its concentration is essentially unchanged from the equilibrium value.
So it is indeed a reasonable approximation to assume the difference in concentration from the equilibrium value is what drives the NET flux from the atmosphere into the ocean and biosphere.
Assume? Really? Nothing you just wrote makes any sense. By the way, the IPCC disagrees with you. There is no human CO2 in the mixed layer. How did that happen? I’ll wait for you not to answer the question.
By the way, the IPCC disagrees with you. There is no human CO2 in the mixed layer.
Supporting evidence,please. The only way that would happen would be if there had been no exchange between the mixed layer and the atmosphere since 1880.
What you keep calling the IPCC carbon cycle shows that about 90Gt of carbon including human carbon, moves from atmosphere to mixed layer each year.
https://projects.noc.ac.uk/greenhouse_gas_science/sites/greenhouse_gas_science/files/images/ccycle.jpg
NO, according to the IPCC, there is no human carbon in the mixed layer. Explain that. How did the human carbon get into the Deep Ocean? Still waiting for your answer.
“the IPCC disagrees with you.”
Nope
” There is no human CO2 in the mixed layer. How did that happen?”
Nope.
More declared ‘truths’ that are never backed up, from Stephen.
Here’s Eman’s link genius. Eman attaches a link and doesn’t know what’s in it. Then you and Eman spread disinformation and propaganda and neither of you knows what’s happening. You two are the most prominent propagandists on this board. You have no scruples.
https://projects.noc.ac.uk/greenhouse_gas_science/sites/greenhouse_gas_science/files/images/ccycle.jpg
Then You respond with some nonsense about the difference between the equilibrium and the mixed layer, or is it the excess. WTF knows. The change in atmospheric concentration with respect to time is equal to Emissions (Inflows) minus Absorp.tions(Outflows). That is the DIFFERENCE, genius. That is the conservation of mass in its entirety. Continue with your idiotic obfuscations.
Stephen
I’ve already answered. You must have missed it.
stephen p anderson says:
July 19, 2022 at 5:59 PM
Like, how did the anthropogenic carbon get into the deep ocean?
Reply
Entropic man says:
July 20, 2022 at 12:16 AM
Offhand, diffusion, turbulent mixing and the thermohaline circulation.
Reply
Entropic man says:
July 20, 2022 at 12:43 AM
And of course the constant rain of organic material.
The fact is, Stephen, you make claims, like these, and cant back them up.
Eman says>
Stephen
Ive already answered. You must have missed it.
stephen p anderson says:
July 19, 2022 at 5:59 PM
Like, how did the anthropogenic carbon get into the deep ocean?
Reply
Entropic man says:
July 20, 2022 at 12:16 AM
Offhand, diffusion, turbulent mixing and the thermohaline circulation.
Reply
Entropic man says:
July 20, 2022 at 12:43 AM
And of course the constant rain of organic material.
Offhand? How can it diffuse, mix and thrmohaline circulate when there is no anthropogenic carbon in the mix layer, according to your linked Carbon Cycle Model?
Stephen
I burn some coal. The carbon enters the atmosphere as CO2 molecules.
Once in the atmosphere those molecules move through the carbon cycle like any other CO2 molecules, even dissolving through the sea surface into the mixed layer.
The carbon cycle diagram does not distinguish between “natural” and “human” CO2 molecules except at their point of origin. Once in the atmosphere they behave in exactly the same way.
Which makes your claim that there is no human carbon in the mixed layer bullshit.
>The carbon cycle diagram does not distinguish between natural and human CO2 molecules except at their point of origin. Once in the atmosphere they behave in exactly the same way.
You still don’t understand your own link, Dork.
However, it was nice to see you admit that natural CO2 and fossil fuel CO2 are the same.
You know, I’m not letting you off that easy. The red arrows show the FF flows. The dark arrows show the natural flows. The red numbers show the anthropogenic carbon. The dark numbers show the natural carbon. There is no red number in the mixed layer. There are no red arrows from the mixed layer to the Deep Ocean. However, there is a red number in the Deep Ocean. Can you explain without obfuscation how it got there?
“There is no red number in the mixed layer. “
Actually ….
* there is a box for “surface ocean” (900)
* there is a box for “Intermediate & deep sea” (37,100)
* there is an *additional* box surrounding *both* of these (155 +/- 30).
So it is pretty clear, if we think carefully, that the diagram says that *together* these two layers have gained “+155 +/- 30”. So there *IS* a “red number in the mixed layer”. (Presumably they were not confident enough to know how big the flows are nor how much has accumulated in the various sublayers. That is ‘beyond the scope’ of this diagram.)
I can see how a cursory glance might make it look like the “155” is specifically associated with only the “37,100”, but one should be extra careful when drawing adamant conclusions from diagram (doubly so if one has not read the paper(s) that led to the diagram).
Hey Tim,
The mixed layer is essentially the surface. Read any study, and when they refer to the mixed layer, they are referring to the layer where you get wind and ocean turbulence. It isn’t the intermediate and deep ocean. Again, how did the human carbon get there?
Tim,
Do Nate and Eman agree with your assertions?
“Again, how did the human carbon get there [intermediate and deep ocean]?”
You are trying to read too much into a simplified diagram.
Anthropogenic carbon exchange with the ocean is 20 in and 17.7 out per year = 2.3 net into the ocean.
This 2.3 goes into the surface layer (the “mixed layer”). From there it would impact the flows out of the surface ocean. Without reading the paper(s) and/or talking to the creator(s), it is tough to guess if they
* forgot to add it
* don’t know all the values for the flows
* wanted to keep it simple
* other??
In any case, don’t try to draw detailed conclusions from a infographic on a webpage. Anthropogenic CO2 goes into the ocean at the surface (2.3) and has accumulated throughout the ocean (155). If you want details, read the literature!
“Do Nate and Eman agree with your assertions?”
Yes. All these diagrams are different in terms of what details they include.
Absence of evidence in one diagram is not really evidence of absence..
>Yes. All these diagrams are different in terms of what details they include.
Absence of evidence in one diagram is not really evidence of absence..
OK, since the Anthropogenic carbon is in the mixed layer, which you agree with, the Revelle Factor isn’t a factor.
Also, this is to both of you, if there is Anthropogenic carbon in the mixed layer, why isn’t there any in the Deep Ocean?
“Also, this is to both of you, if there is Anthropogenic carbon in the mixed layer, why isnt there any in the Deep Ocean?”
Non sequitur, Stephen.
Where do u get these notions?
” in the mixed layer, which you agree with, the Revelle Factor isnt a factor.”
Also a non sequitur.
“You still dont understand your own link, Dork. ”
Yes, my mistake.
I’m glad to see that you’ve acknowledged your own mistake.
You now accept that there is anthropogenic carbon in both the mixed layer and the deep ocean.
“You still dont understand your own link, Dork. ”
Yes, my mistake.
I’m glad to see that you’ve acknowledged your own mistake.
You now accept that there is anthropogenic carbon in both the mixed layer and the deep ocean.
Non sequitur, LOL….FOS. What mistake did I admit? The arrows show the flux between the atmosphere and ocean, the mixed and deep layers, and the atmosphere and the land. There are no red arrows in the ocean, but they just stuck this red 155PgC down there because their model doesn’t balance, and they didn’t know what to do with it. But have either of you read IPCC 2013? I’m sure not. They claim those numbers and flows in the diagrams have 90% confidence. You guys realize it’s a piece of crap, and you tried to pass it off as, what did Nate say,
and then he concluded with the brilliant,“if there is Anthropogenic carbon in the mixed layer, why isnt there any in the Deep Ocean?”
But there IS anthropogenic CO2 in the deep oceans! The “155” is spread (in unspecified ways) between surface, intermediate and deep oceans. Which is exactly what I said before and exactly what the diagram shows.
“Yes. All these diagrams are different in terms of what details they include.
Absence of evidence in one diagram is not really evidence of absence..”
Here is one with different details shown.
https://www.researchgate.net/profile/Gavin-Cawley/publication/263946928/figure/fig1/AS:296577282396162@1447720943003/The-global-carbon-cycle-for-the-1990s-showing-the-main-annual-fluxes-in-GtC-yr-1_Q640.jpg
Both mixed layer and deep ocean have anthro carbon, as expected.
>Yep, and many skeptics like Roy Spencer as well.
I’ve never seen Dr. Spencer state his position about the Revelle Factor. Maybe I missed it. Perhaps you can link it. However, he will present the IPCC or some paper’s position. The only positions he puts his reputation behind are the satellite measurement data and some of his research like cloud feedback, cloud formation, etc. Like this model above, Dr. Spencer presents the model mainly to show that even if this model is correct, there is no dire scenario as alarmists claim.
I don’t know if Roy has ever directly talked about the Revelle Factor, but he has certainly alluded to it on this board.
Roy Spencer: “The rate of rise in atmospheric CO2 is currently 2 ppm/yr, a rate which is 100 times as fast as any time in the 300,000 year Vostok ice core record. And we know our consumption of fossil fuels is emitting CO2 200 times as fast! So, where is the 100x as fast rise in today’s temperature causing this CO2 rise? C’mon people, think. But not to worry… CO2 is the elixir of life… let’s embrace more of it!”
Perhaps appropriately to this discussion, he wrote this under the heading Skeptical Arguments That Don’t Hold Water.
Barry,
I dont know if Roy has ever directly talked about the Revelle Factor, but he has certainly alluded to it on this board.
Roy Spencer: The rate of rise in atmospheric CO2 is currently 2 ppm/yr, a rate which is 100 times as fast as any time in the 300,000 year Vostok ice core record. And we know our consumption of fossil fuels is emitting CO2 200 times as fast! So, where is the 100x as fast rise in todays temperature causing this CO2 rise? Cmon people, think. But not to worry CO2 is the elixir of life lets embrace more of it!
Perhaps appropriately to this discussion, he wrote this under the heading Skeptical Arguments That Dont Hold Water.
You’ll need to connect Vostok ice core data with the Revelle Factor. Don’t see the allusion there. Also, Dr. Spencer will need to show me how you can use proxy data for rate comparison from several hundred thousand years ago to actual temperature readings today and then say we don’t know how much of the temperature rise is natural or manmade.
And then he says downwelling IR is 300w/m^2 when in the 5th assessment it is 159w/m^2 (of which 30 can be assigned to CO2). And, doubling CO2 will only add 3w/m^2.
You’re right. It isn’t. It is irrelevant. It is part of the slow carbon cycle.
The Revelle Factor is about the resistance in ocean solubility to CO2. Roy is clearly alluding to it in that comment when he says that the rate of increase of atmospheric CO2 is half the rate of anthropogenic output. It’s the Revelle Factor causing that, and Roy clearly believes the increase in atmos CO2 to be anthropogenic in origin.
“Also, this is to both of you, if there is Anthropogenic carbon in the mixed layer, why isnt there any in the Deep Ocean?”
Still a non sequitur, Stephen.
The diagram clearly shows anthro carbon in the deep ocean. Your question makes no sense.
“in the mixed layer, which you agree with, the Revelle Factor isnt a factor.”
Nothing discussed here supports your claim that Revelle Factor isnt a factor.
You are just tossing BS all over the place.
You guys are full of crap. You can’t keep your stories straight. You say whatever is expedient at the moment. You flail in the wind. It’s junk science and difficult to defend.
>Nothing discussed here supports your claim that Revelle Factor isn’t a factor.
You claim the Revelle Factor inhibits anthropogenic inflow into the ocean, don’t you? You claim Berry didn’t take the Revelle Factor into his model. But here it is in their diagram, in the ocean.
>Here is one with different details shown.
Dimwit, the one that Eman linked, comes from AR6.
>if there is Anthropogenic carbon in the mixed layer, why isnt there any in the Deep Ocean?
But there IS anthropogenic CO2 in the deep oceans! The 155 is spread (in unspecified ways) between surface, intermediate and deep oceans. Which is exactly what I said before and exactly what the diagram shows.
Tim,
That’s BS. They stuck the 155 there because they didn’t know where to put it because their model is crap. They have 90% confidence in the numbers and flows, but have no confidence in the natural numbers or the flows? They claim they know exactly what the anthropogenic numbers and flows are.
Sorry, I meant to say they have no confidence in the anthropogenic numbers and flows? Distributed throughout? Doesn’t make any sense.
“You claim the Revelle Factor inhibits anthropogenic inflow into the ocean, dont you?”
Yep, and many skeptics like Roy Spencer as well.
“But here it is in their diagram, in the ocean.”
Do you know what ‘inhibit’ means?
Seems you don’t.
It seems science with any complexity is beyond your capabilities, Stephen.
In this diagram from the 90’s,
https://www.researchgate.net/profile/Gavin-Cawley/publication/263946928/figure/fig1/AS:296577282396162@1447720943003/The-global-carbon-cycle-for-the-1990s-showing-the-main-annual-fluxes-in-GtC-yr-1_Q640.jpg
You can see that there is 165 anthro in the atmosphere, and only 18 in the ML and 100 in the deep ocean.
If as claimed by Berry, the e-time was 4 years, then with 165 added to the atmosphere, about 41 should be flowing into the ocean annually.
But only 2.2 is annually flowing into the ocean, and only 1.6 into the deep ocean in the diagram.
I’d say there is inhibiting going on. Consistent with a Revelle Factor.
“Dimwit, the one that Eman linked, comes from AR6.”
No, the one Entropic Man linked is here:
https://projects.noc.ac.uk/greenhouse_gas_science/sites/greenhouse_gas_science/files/images/ccycle.jpg
“The material on this website is based on lectures and activities that were developed for a series of residential summer schools held in 2015 at the University of Edinburgh and in 2016 at the National Oceanography Centre … ”
Not part of IPCC AR6.
(The AR6 report is here: https://www.ipcc.ch/report/ar6/wg1/ I skimmed and saw nothing like this diagram at all.)
“They stuck the 155 there because they didnt know where to put it because their model is crap. They have 90% confidence in the numbers and flows, but have no confidence in the natural numbers or the flows? They claim they know exactly what the anthropogenic numbers and flows are.”
Again, don’t base your knowledge on one diagram taken out of context. One diagram is not a 100% complete accounting of what “they” know. Read the papers. Understand the models. Find out what is measured and what is theoretical. Then (and only then) are you in a position to determine what is ‘crap’ or how confident ‘they’ might be about different numbers.
*This* is what “flailing” looks like.
Tim,
They said they have 90% confidence in those numbers and flows in 2013.
>If as claimed by Berry, the e-time was 4 years, then with 165 added to the atmosphere, about 41 should be flowing into the ocean annually.
You don’t understand e-time. Also, the IPCC says the e-time or e-folding time is about four years. e-time is the time required for the level to move 0.693 the distance toward the balance level. Finally, Berry makes no claims or is required to adhere to your chart’s numbers. Berry states that the different treatment of natural and anthropogenic CO2 violates the principle of equivalence.
Tim,
Thanks for linking that. It blows up your argument. The one Eman linked was AR5. The AR6 on page 700 has updated numbers. The anthropogenic number is plunked into the intermediate and deep ocean, not throughout.
“You dont understand e-time.”
Uhh, yes I do.
“Also, the IPCC says the e-time or e-folding time is about four years.”
Show us that.
“e-time is the time required for the level to move 0.693 the distance toward the balance level.”
Yep, if the level in the atmosphere is 165 higher than the equilibrium level, then you would expect it to drop by 165*0.693 = 114 in 4 years.
Or, as I noted, this requires an outflow of 165/4 ~ 41, in 1 year, according to Berry. It hasnt been.
“Finally, Berry makes no claims or is required to adhere to your charts numbers.”
YOU have been arguing thoughout this discussion about how our claims are inconsistent with what the charts say.
Now you wanna move the goal posts by ignoring the charts?
Nate,
Come on, you’re the one who pulled up a new chart.
>YOU have been arguing thoughout this discussion about how our claims are inconsistent with what the charts say.
No, I’ve been arguing that the IPCC chart Eman linked doesn’t make sense. How did the human CO2 get into the Deep Ocean? There’s none in the surface ocean.
>Or, as I noted, this requires an outflow of 165/4 ~ 41, in 1 year, according to Berry. It hasnt been.
You don’t know what it’s been. Who says your chart’s correct? Chick will produce a model that fits Mauna Loa data with both natural and human CO2.
Stephen,
“How did the human CO2 get into the Deep Ocean? Theres none in the surface ocean.”
The other chart indicated there is.
‘Or, as I noted, this requires an outflow of 165/4 ~ 41, in 1 year, according to Berry. It hasnt been.’
“You dont know what its been”
Thats his model.
Do you have evidence that the natural emissions grew by > 41 Gton/y by the 1990s?
From where and by what mechanism?
And more since then?
Whereas we have strong evidence that anthro emissions grew over the last century to current ~ 10 Gt/year. And that is all that is needed to explain current levels, because of the Revelle Factor.
We have a mechanism, we have required emissions.
You have neither.
>Stephen,
How did the human CO2 get into the Deep Ocean? Theres none in the surface ocean.
The other chart indicated there is.
No, it didn’t. The chart in AR6 clarified it. It was assigned to the intermediate and deep oceans. So, you just pick whichever chart you want even though they’re very different? Doesn’t work that way.
Or, as I noted, this requires an outflow of 165/4 ~ 41, in 1 year, according to Berry. It hasnt been.
You dont know what its been
Thats his model.
YOU said it hasn’t been, not him.
Do you have evidence that the natural emissions grew by > 41 Gton/y by the 1990s?
From where and by what mechanism?
And more since then?
Yes, look at Berry’s model based on conservation of mass. Also, Chic will provide a model based on Berry’s theory.
Whereas we have strong evidence that anthro emissions grew over the last century to current ~ 10 Gt/year. And that is all that is needed to explain current levels, because of the Revelle Factor.
We have a mechanism, we have required emissions.
You have neither.
I have that anthropogenic emissions are only about 4% of total emissions. CO2 flows through the atmosphere and is absorbed by the sinks. So anthropogenic can’t be much more than 4% of current levels. Also, your etime calculations are wrong but don’t have time to go into it now. I’ll show you this weekend if I have time.
“Do you have evidence that the natural emissions grew by > 41 Gton/y by the 1990s?
From where and by what mechanism?
And more since then?”
“Yes, look at Berrys model based on conservation of mass.”
A model is not not an observation, Stephen.
His model neglects Revelle Factor, but instead assumes a large increase in natural emissions to explain the rise in atm CO2 in the last century or so.
But you guys offer no evidence or data to show that there has been such a rise. Nor have you offered a mechanism for this rise that works.
Without any of that, it is pure speculation.
“I have that anthropogenic emissions are only about 4% of total emissions. CO2 flows through the atmosphere and is absorbed by the sinks. So anthropogenic cant be much more than 4% of current levels. ”
This is all unproven assertion by Berry without evidence.
Out of all the research on the Carbon cycle, Berry’s view is an extreme outlier.
He has also admitted that he is not very familiar with much of the previous modeling work, and Revelle Factor. I know this because I showed him classic papers he had never seen before.
Its fair to ask, why do you favor Berry’s as being the correct view out of all the research by many on this topic?
Is it because you are very familiar with carbon cycle science, and are able to detect scientific flaws in all other work, except Berry’s?
Be honest.
No, it is because the simplest explanation is usually correct… Einstein. Berry derives his solution from the conservation of mass and energy. His only hypothesis in his model is outflow is proportional to the level. Berry explains it using the ideal gas law, and real-world C14 data fit his hypothesis. If real-world Te is small, then Revelle Factor isn’t a factor. If Revelle Factor was a factor it would be a factor for Natural CO2 also. And, Chic has shown it isn’t. I’m looking forward to seeing Chic’s newer model when he posts it. His previous one was very good so don’t see how he’s going to improve it. I know it’s a lot of work on his part.
“Everything should be made as simple as possible, but not simpler.” is the Einstein quote.
Berry has made it simpler than the actual carbon cycle of the Earth, as shown by lots of research over 60 y.
But of course, you are only familiar with Berry’s model, and assume he must be correct.
Again, you’re wrong. Berry uses the exact carbon cycle for natural carbon as IPCC. Also, you’re the one linking different numbers and stating all this stuff is kind of fuzzy, contradicting the IPCC claim of 90% confidence. Berry shows that the IPCC unscientifically uses different physics for the human cycle, violating the principle of equivalence to promote these long e-times for human carbon only. Please explain how the same molecule can have two different e-times. How does nature differentiate between human carbon and natural carbon? I’ll wait patiently for your answer.
“Berry uses the exact carbon cycle for natural carbon as IPCC.”
No Stephen, that makes no sense. Since the IPCC does incorporate a Revelle Factor and doesnt agree that anthro carbon is only 4% and doesnt agree that added carbon should decay in 4 years, their understanding of the carbon cycle is very different.
For 60 y it has been understood why the added carbon from anthro emissions are not removed quickly into the ocean, as assumed prior.
The understanding that the ocean carbon chemistry slows the ocean uptake of carbon is simply ignored and of no interest to Berry et al.
If you only read contrarian ‘science’, you will remain uninformed, and unable to have an educated opinion.
Good grief, here are the numbers.
Natural Carbon:
Atmosphere=589PgC
Flow to land= 108PgC
Flow to ocean=60PgC
Te(land)=5.4 years
Te(ocean)=9.7 years
THIS IS FROM 2013 ASSESSMENT!!!!!!
So, here’s your Revelle Factor:
Fossil Fuel=240PgC
Te(land)=17.1 years
Te(ocean)=12.0 years
Te=7 years
So, please, tell me how Revelle Factor is a factor with an e-time of 7 years even using THEIR F*ked up numbers.
And, by the way, using THEIR numbers gives a natural carbon e-time of 3.3 years.
What is Te Stephen? Is it calculated or measured?
How are Te telling you about Revelle?
You apparently think the ‘carbon cycle’ is just the annual flow numbers.
No, the carbon cycle considers the various time scales that carbon persists in various reservoirs, not just the annual flows.
These times matter for calculating how long added carbon will require to be removed.
“And, by the way, using THEIR numbers gives a natural carbon e-time of 3.3 years.”
A good example of why this is not correct is the Bomb curve, which has a MEASURED etime for removal of at least 16 y, as Berry agrees.
This shows that your calculated e time is not the same as the etime to remove ADDED carbon.
Te is e folding time. The IPCC refers to it as residence time. And we’re not talking about the carbon in all the reservoirs. We’re talking about atmospheric carbon.
Yes, that is for C14 carbon. 98% of atmospheric carbon is C12.
“the carbon cycle considers the various time scales that carbon persists in various reservoirs, not just the annual flows.”
I’ll give you just one example. A forest of long lived trees. The trees may grow for 80 years, die, decay and release carbon over the next 20 years.
So if we have added ‘extra’ carbon to this forest, it won’t be returned to the atmosphere for 100 y.
Your 4 y etime is not capturing that.
“Yes, that is for C14 carbon. 98% of atmospheric carbon is C12.”
CO2 has molecular weight 44. With C14 it is 46.
You think that small difference could produce a 4 fold increase in etime?
Evidence? Berry had none.
You’re right. It isn’t. It is part of the slow carbon cycle, according to IPCC.
“Were talking about atmospheric carbon.”
Which is not isolated from all the others. Any flows to/from it must be from/to the others.
I think C14 e-times were calculated at closer to 10 years. Also, Berry referenced this study which showed reaction rates are slower for C14 than C12.
https://accp1.onlinelibrary.wiley.com/doi/10.1002/j.1552-4604.1986.tb03545.x
Also, to calculate atmospheric e-times, the amount of carbon accumulating in reservoirs is irrelevant. Berry and Spencer recently showed that CO2 flows are first-order reaction kinetics. So the flows from the atmosphere are independent, the flows from land are independent, the flows from the surface ocean are independent, and the flows from the deep ocean are independentfirst order.
“It isnt. It is part of the slow carbon cycle, according to IPCC.”
Yes! And that is highly relevant to removal of carbon added to the fast cycle. Your 4 y, is the time to circulate carbon around amongst the fast responding reservoirs. That would include the ocean surface, soil surface, seasonal growth of plants. Plant respiration.
But anthro carbon is ADDED to the fast cycle from an external source. It is not removed from the fast cycle until it can be moved into the slow responding reservoirs, which includes the deep ocean, long lived forests, etc.
You’re going in circles. The Te for fossil fuel carbon, according to IPCC numbers, is 7 years. (It is really the same as natural at 3.3 years but I won’t quibble.)
“Berry and Spencer recently showed that CO2 flows are first-order reaction kinetics”
“flows from the atmosphere are independent, the flows from land are independent, the flows from the surface ocean are independent, and the flows from the deep ocean are independent”
The reservoirs are obviously connected to each other. Previous work used diff eqns that included flow from atm to ocean and ocean to atmosphere.
What is the rationale for ignoring the return flux?
“The Te for fossil fuel carbon, according to IPCC numbers, is 7 years. (It is really the same as natural at 3.3 years but I wont quibble.”
That is the mantra, but it is too simple.. It ignores what you already agreed about the existence of a slow cycle.
He’s not ignoring the return flows. The master equation is
dL/dT= Inflow – Outflow
“reaction rates are slower for C14 than C12.”
How much slower? I see nothing giving a 4-fold increase.
Diffusion into the ocean by a molecule with molecular weight 46 vs one with 44 is NOT going to be 4 x slower.
The thermohaline current is not going to carry these slightly heavier molecules any more slowly to the deep ocean.
Perhaps plants will uptake C14 more slowly , but there must be data on that..
“Inflow-outflow”
Good,
Inflow will depend on carbon concentration in the reservoir it is coming from.
Then the atm concentration is not independent of other surrounding reservoirs.
It isn’t diffusion into the ocean. You can see from IPCC’s data that e-time for the atmosphere to land is a much more significant factor. For another thing, it is the number of collisions. It is collisions with plants, algae, and absorb.tion into soil and organics from more collisions, etc. As the level in the atmosphere increases, C12 undergoes more collisions than C14 because it is a lower mass.
You’re starting to understand. Inflow sets the balance level. Level sets the outflow. Te(Natural + FF)= Balance Level.
Level/Outflow=Te
Since natural = 97ppm, and FF=4ppm, Te=4 (approximations)
4x(101)=404ppm
FF = 4X4=16ppm
Natural = 4X97=388ppm.
FF is about 4% of the atmospheric concentration.
“It isnt diffusion into the ocean. ”
Yes, it is. Where do you get these made up facts?
“For another thing, it is the number of collisions.”
This is handwaving. Nothing you have shown is quantitative.
We have an observed e-time of > 16 y. You have no evidence to support a 4-fold increase from the small difference in mass. Berry’s model cannot explain it.
“Youre starting to understand. Inflow sets the balance level. Level sets the outflow. Te(Natural + FF)= Balance Level.
Level/Outflow=Te”
You keep repeating this mantra. But this is not an observation. This is what the over-simplified Berry model gives.
As we’ve just discussed, there is a slow carbon cycle that doesnt fit this model. There is a bomb decay curve that doesnt fit this model.
>We have an observed e-time of > 16 y. You have no evidence to support a 4-fold increase from the small difference in mass. Berrys model cannot explain it.
More circles from Nate. You agreed that dL/dT=Inflow = Outflow. So if dL/dT=0, then inflow = outflow. The level is at the balance level so Te=Level/inflow=Level/outflow. So, if we know that level is around 400ppm (Mauna Loa data) and inflow and outflow are about 100ppm, then Te is approximately 4 years.
You’re a funny booger and not very logical. So, you will accept Berry’s paper that C14 e time is 16yr, but you won’t accept his argument that heavier isotopes react slower? And, you won’t accept the IPCC data that indicates short e times. Maybe you’ll accept this from Wiki. Or maybe go to countless physics and chemistry texts that will help.
https://simple.m.wikipedia.org/wiki/Isotope
Oh, and by the way, even a 16yr e time renders the Revelle Factor a nonfactor.
>You keep repeating this mantra. But this is not an observation. This is what the over-simplified Berry model gives.
LOL, then you need to tell IPCC they’re wrong and to stop publishing it.
The level is at the balance level so Te=Level/inflow=Level/outflow.”
”
What you are calculating is residence time. The e-time for individual molecules to remain in a reservoir before being exchanged.
As discussed many times, this is not required to be the same as the e-time for carbon concentration.
The evidence is clear that it is not the same. Much of the extra concentration produced by adding anthro carbon, has persisted for the last century. But these are not necessarily the same carbon atoms.
“Youre a funny booger and not very logical. So, you will accept Berrys paper that C14 e time is 16yr, but you wont accept his argument that heavier isotopes react slower?”
Unlike you, I understand that science needs to be quantitative. His heavier isotopes argument is NOT quantitative. His claim that it can explain a 4x increase is wild speculation. There is no evidence that either of you provided of a 4 x increase.
The 16 y e-time is simply a fit to the curve, an observation, and Berry was not the first to show that.
But the 16 y is the e-time for tracer concentration. Again the overly simplistic model assumes that once it leaves the atmosphere, C14, is gone forever. This is wrong. The C14 that has entered the surface ocean or the land biosphere, it can return to the atmosphere. Only when it has penetrated the deep ocean will it return to the previous level.
However, the C14 won’t return to the previous level, since fossil fuel carbon is depleted of C14, as it continues to be added to the atmosphere, the C14 concentration in the atmosphere will decrease below the previous equilibrium level.
This is the Seuss effect, and it was already observed to be happening (from tree rings) in the 1950s before the Bomb tests added new C14. And it is affecting the apparent e-time we observe. Without the Seuss effect, the Bomb C14 e-time would be longer.
https://www.pnas.org/doi/10.1073/pnas.1504467112
>There is no evidence that either of you provided of a 4 x increase.
Do you mean a 4X decrease? What about the 3.3 year and 7 year e times calculated from IPCC data? Again, the C14 evidence only shows that e times are short, not 50 or 150 years. Berry has proven that. Talk about providing no evidence, you just ramble on and on without really saying anything but throwing out red herring after red herring. You and Eman, the propagandists.
Oh, and thanks for linking your red herring paper. By eyeballing their C14 chart, it looks like it gives an e time of about ten years. C13 and C12 will only be shorter.
“Talk about providing no evidence”
4 years is your predicted e-time. 16 y is 4 x larger than this.
Where is your evidence that a factor of 4 increase in e-time would be expected or predicted for C14?? Where is a source for this claim?
You seem to accept hand-waving with no numbers, as valid science.
It aint.
’10 y by eye-balling’ is again, not quantitative science.
Berry and all others found 16 y or more in a proper fit. A while ago, I downloaded data and fit it, and got 16-17 y. You can try it yourself.
The observation does not agree with your simple model. As Feynman said: then your model is wrong!
Oh well.
That seems to be your tactic. You do the same thing to everyone else. You ask for evidence. Evidence is provided. You ignore it and ask for it again. It is provided again. You ignore it and ask again. Rules for radicals?
I have no problem accepting your fit of 16.5 years. C13 and C12 will be shorter. It still blows up your Revelle Factor.
>The observation does not agree with your simple model. As Feynman said: then your model is wrong!
That’s funny you quoting Feynman. CalTech is where Berry went on scholarship.
Stephen,
As you can see in the paper, in the rate equation for atmospheric carbon concentration, they include terms connecting all other reservoirs, which are themselves connected to others. There are terms connecting to the biosphere and mixed layer (which includes Revelle Factor) which in turn connects to multiple ‘boxes’ of the ocean.
This is a so-called multi-box model, which got more complex over decades. The observations demanded that.
I can see the appeal of the simplicity of Berry’s model for the common man.
But there really is no requirement that the Earth actually be that simple. It need not be so simple that everyone, even non-experts, can understand it.
“You ask for evidence. Evidence is provided. You ignore it and ask for it again. It is provided again. You ignore it and ask again.”
Where, Stephen, did you show me evidence that the isotope factor can account for a 4x increase in e-time?
Either you are clueless about what evidence means, about what quantitative means, or you are simply a liar-troll.
That paper has nothing to do with atmospheric CO2 other than C14 absorp.tion, it provides no hypotheses. It offers equations to a one-box diffusion model and has nothing to do with Berry’s model. It is an entirely different type of study. Who knows if it even fits actual data? However, it does fit something because it supports Berry’s claim that atmospheric e times are short.
The evidence I keep giving you is the IPCC data is used to calculate the e times. It isn’t Berry’s data. It is IPCC’s data. The e-times are short, 3.3 years and seven years, and you keep ignoring and asking again.
“calculate the e times.”
With Berry’s MODEL. They dont match any OBSERVED e-time. They don’t account for any observation, while the models in the paper and others before it, do.
It seems you will never get this, Stephen.
“the natural equilibrium level of CO2 in the atmosphere inplied by the model is about 295 ppm, rather than 265 or 270 ppm as is often assumed”
My question is whether the assumption of a constant “equilibrium level” might not be correct if you are adding in external carbon into the atmosphere/ocean/ecosystem pools. Could you make a version of your model where there’s an assumption that some percentage of fossil fuel emissions actually increase the equilibrium concentration? The IPCC value is about 22%, but it would be interesting to see what would happen if you made it an uncertain parameter and see what your model finds as the best value.
And if you added this adjustable “equilibrium” value, it might be interesting to see if the initial equilibrium value ends up being closer to 270 ppm.
-Marcus
You’re not reading the board. That discussion is already underway.
Very interesting to see the effect of volcanic eruptions.
I wonder if one reason for the reduction in CO2 could be the fertilizing effect of oceans from volcanic ash.
This will lead to increased algae growth, and increased photosynthesis in the surface water and more uptake of CO2 from air to water
They give American state $85 associate hour to end work on an Apple laptop. I definitely didnt assume it had been possible, however my sure friend created $26,000 in mere four weeks acting on this easy chance {ec86} and he or she influenced me to offer it a try. Discover a lot of directions by
visiting the subsequent link http://takegoodwork24.blogspot.com/
My explanation is that volcanic particles in the upper atmosphere reflect sunlight away from earth. This shows up as cooling in the following year in the UAH data. This changes the equilibrium of CO2 between the oceans and the atmosphere. This results in the oceans absorbing more CO2 and so the annual increase in CO2 goes down.
Yes, John, your explanation also seems plausible.
I see that there was indeed a drop in global temperatures for two – three years after the eruption.
Thank you Dr. S. for continuing the good work.
“Note the model is well below the RCP8.5 scenario, which is the one most often used to promote alarmist projections of sea level rise, temperature increase, etc. ”
How is RCP8.5 not just embarrassingly stupid?
It’s seems RCP2.6 if governments stop causing more CO2 emissions.
It seems govt is backing off from have tax dollars support wood burning. Wood burning is worse than burning Coal. And we can hope govt will not want start burning dung to generate electrical power.
The billions of dollars government have wasted paying for solar farms and wind farms, have been a not net reduction of CO2 emissions either. And the damage to the environment has been enormous.
That some governments have allowed fracking, is the most amount of CO2 reduction that any governments have done related to CO2 reduction. And governmental interfere with allow natural gas to be mining can amount one most that governments have done to increase CO2. But you probably could point out other things which have worse
that governments have done, but might complicated to go over it.
Preventing natural gas use is just most obvious and clearly the most stupid thing.
Of course nuclear energy over the years has done more than natural gas reduce CO2 emissions but there also a multitude of other aspects
in which government causing more CO2 emissions- due corruption in general and just dumbness.
Or if governments were wise, RCP2.6 is likely. But government have been and will continue to be what they are, maybe, for forever.
And it seems even possible that despite government efforts which cause more CO2 emission, RCP2.6 is possible.
This is related:
https://www.youtube.com/watch?v=18_yXt1s2yc&t=1988s
From:
https://legalinsurrection.com/2022/07/rep-massie-tears-apart-buttigiegs-argument-that-electric-cars-would-save-americans-money/
from:
https://instapundit.com/
Meanwhile, President Biden is proposing to declare a national emergency so that our 9% of world wide carbon emissions will stop destroying the planet. The people advising him on this are insane.
I like John Kennedy Senator Louisiana.
Deeply, profoundly stupid. That is the only way I know how to describe one of the worst decisions behind an administration that has become famous for bad decisions. I am talking about Pres. Bidens assault on sustainable, affordable energy.
If that prediction is accurate, it’s alarming.
We won’t even get to 550 ppm in the next 50 years! That’s not going to be good. We’ll need all the CO2 in the atmosphere we can get. It’s time to get some adults in leadership positions.
If we all get together, we can do it — “550 by 2050”!
More than 90% of global warming
“More than 90 percent of the excess heat trapped in the Earth system due to human-caused global warming has been absorbed by the oceans.”
https://www.climate.gov/news-features/understanding-climate/climate-change-ocean-heat-content
“Jan 22, 2020 Scientists have determined that the ocean absorbs more than 90 percent of the excess heat, which is attributed to greenhouse gas emissions.”
https://www.ncei.noaa.gov/news/ocean-heat-content-rises
–This is where 90 percent of global warming is going
https://www.washingtonpost.com news 2016/01/18
Jan 18, 2016 Scientists find that the world’s oceans are storing vastly more heat than before.”
Ocean Heat Content | Vital Signs – NASA Climate Change
https://climate.nasa.gov vital-signs ocean-heat
Covering more than 70% of Earth’s surface, our global ocean has a very high heat capacity. It has absorbed 90% of the warming that has occurred in recent …
2018 was the ocean’s hottest year. We’ll feel it a long time.
https://www.nationalgeographic.com article oceans-…
Jan 16, 2019 The oceans have sopped up more than 90 percent of the heat trapped by human-emitted greenhouse gases, slowing the warming of the …
Anyways I wonder if this is anything like Rorschach test.
And/or wonder all above is saying the same thing, or some of saying it “better” or some are wrong.
And what if ocean didn’t absorb more than 90% of all manmade warming, what is result. And does ocean only absorb manmade warming??
My way of saying it, is more than 95% of global warming is a slightly warmed ocean. Which seems like a simpler way of saying it.
Or global warming is mostly about a warmer ocean.
And global cooling is mostly about a cooler ocean.
Though it can a bit more complicated, like where warmed or cooled water goes, exactly. Vast amounts of cooled water can pool at bottom of ocean, like say Pacific ocean basin {and this as has been noted by people}. And/or we know cool water upwell as during La Nina, but in regards to that, how is really cold water or how fairly warm cold water. Or is just some cold water within 500 meter of the surface or whatever. If it’s really warm cold water, it’s just cold water at the surface. Or takes a bit longer to warm up, or less cooling until it warms up.
The Hunga Tonga-Hunga Ha’apai volcano eruption will have a bigger impact than Pinatubo had.
Hi Roy,
How do you explain times in Earth’s history when CO2 was higher than now, but Earth was in an ice age or glacial/cold period?
Thanks.
We are currently in the Late Cenozoic Ice Age.
It is called a ice house global climate.
The last couple million years have been the coldest period
within this Late Cenozoic Ice Age.
Ice house global climates have ocean with a cold average temperature.
Our Ocean averages 3.5 C.
You said glacial/cold period, and after rock that caused Dinosaurs extinction, what followed was a cold period, but not ice house global climate or also called an Ice Age.
It was cold because there so much dust in atmosphere that sunlight was quite dim for many years. And there would be been high levels of CO2. When living in Ice House global climate one has low CO2 level.
Before the impactor, Earth was not in a ice house climate.
Let’s see what said it was:
This has a graph of CO2 but to 66 million years:
https://today.tamu.edu/2021/06/14/ancient-deepsea-shells-reveal-66-million-years-of-carbon-dioxide-levels/
Kind interesting because it indicates higher CO2 within the 33.9 million years of our Late Cenozoic Ice Age.
So it was in Ice Age, and graph shows CO2 peaking at around 800 ppm, but that part of our Ice Age was much warmer than we are now. AND warmer than warmest peak temperature of any recent interglacial periods- Eemian or Holocene [Or ones before Eemian within last 1/2 million years].
Here is 600 million years:
https://medium.com/@ghornerhb/heres-a-better-graph-of-co2-and-temperature-for-the-last-600-million-years-f83169a68046
which indicate before dinosaur killing space rock, over 2000 ppm of
CO2. And the impactor would incinerated a lot stuff.
Weaker sun.
https://www.britannica.com/science/climate-change/Faint-young-Sun-paradox
“Weaker sun”
@Entropic man
Ah, so if a ‘weaker Sun’ was a factor back then, then a stronger Sun is a factor now with current ‘warming’.
The astronomers tell us that the Sun has warned by 25% in 3.8 billion years, yet the rocks tell us that the planetary average has stayed between 5C and 25C for a
The astronomers tell us that the Sun has warned by 25% in 3.8 billion years, yet the rocks tell us that the planetary average has stayed between 5C and 25C for at least
The astronomers tell us that the Sun has warned by 25% in 3.8 billion years That is six billionth of a degree per year, far too small to explain modern global warming.
The rocks tell us that the planetary average temperature has stayed between 5C and 25C for at least 700 million years.
The consensus view is that the warming due to the increase in solar intensity has been counterbalanced by the reduced greenhouse effect due to decreasing CO2 from thousands of ppm to a few hundred ppm. Some kind of feedback may be involved.
Those who do not believe in the greenhouse effect may have an alternative explaination, but I haven’t heard it.
“The astronomers tell us that the Sun has warned by 25% …”
To be more precise, it is the LUMINOSITY that has increased by 25%. The TEMPERATURE has remained fairly constant, but the radius is slowly increasing, which leads to more energy emitted from the surface.
Good question, Joe.
More CO2 would result in more emission to space. More emission to space would result in more cooling.
Spectrum is already saturated so no, it won’t result in any further changes in direct thermal radiation to space.
Ken
We went over this. Saturation only occurs close to the 15 micrometres spot absor*ption frequency.
Over most of the 13-17 micrometres band CO2 absor*option is not saturated. Increasing CO2 reduces radiation to space in the band.
Ent
See Happer’s paper here. The spectrum is saturated. According to Happer if you double CO2 to 820 ppm you get 3Wm-2 reduction in direct thermal radiation to space.
https://ddears.com/2021/01/12/dr-happer-explains-effects-of-co2/
If Happer claims complete CO2 saturation he is shading the truth.
His own outward thermal radiation graphs show the notch due to absorbed CO2. It is a wedge shape between wavenumber 580 and 780.
You can see the flat spot around 680. That is the part of the band which is saturated. The outer part of the band is not saturated and will continue to absorb more radiation as CO2 increases.
If the whole band were saturated you would not see a wedge, you would see a rectangle with a vertical drop at 680, then a flat graph until a vertical rise at 780.
Research band spreading.
His 3W/m^2 per doubling is actually quite close, but don’t be misled by his temperature estimate. The DIRECT warming per doubling is about 1C. When you add the feedback due to climate sensitivity you get close to 3C.
Mars has more CO2 than Earth does, particular per square meter.
Mars is not cooler because atmosphere is about 95% CO2 and 3% nitrogen.
Nor with Venus which is about :
“96.5% Carbon Dioxide (CO2), 3.5% Nitrogen (N2)”
Both Mars and Venus absorb very little sunlight.
If Mars was covered with snow or covered a ocean, it would
absorb more energy from sunlight.
With Venus rocky surface, it does not matter if snow or ocean, as very little sunlight reaches the surface.
If you want Venus to absorb more energy, you have to put swimming pools in the sky. Or dark colored balloons or bunch greenhouses in the sky. And all Venus has is lots of acid clouds which absorb some sunlight which aren’t as reflective as water clouds, but they do reflect and scatter a lot sunlight. Which results in Venus only emitted about 160 watts per square meter, and Earth emits about 240 watts and gets about 1/2 as much sunlight due it’s further distance from the sun.
Venus at Earth distance would absorb less sunlight and emit less sunlight [and it’s runaway effect would reverse}.
What are elements of Venus runway effect.
One is that Venus has a global winds, which makes cloudy surface have a day, which is 4 to 5 Earth days.
Which is quite important when a surface does not absorb energy. Such as lunar surface likewise doesn’t absorb much sunlight, and if it had a day equal to 4 to 5 earth day, the moon would be warmer.
And other factor in the elevation of it’s cloudy surface.
And if Venus absorbs less sunlight because it’s at Earth distance, the cloudy layer will lower and global wind slows or stops.
@gbaikie
You forgot something – Mars has little to no clouds, so despite being further from the Sun, much of the Sun’s energy is reaching the surface, and should be just as warm as Earth, if CO2 was such a potent greenhouse gas. But it’s not, & therefore Mars is cold.
–Joe says:
July 23, 2022 at 9:26 PM
@gbaikie
You forgot something Mars has little to no clouds, so despite being further from the Sun, much of the Suns energy is reaching the surface, and should be just as warm as Earth, if CO2 was such a potent greenhouse gas. But its not, & therefore Mars is cold.–
Well Mars is not particularly cold. Or to say Mars is cold, you have to say our Moon is colder. And with lunar noon surface temperature of 120 C, one might imagine the Moon is hot.
But the average surface temperature of the Moon is colder than average temperature of Mars.
But neither have much of atmosphere and think of temperatures as air temperatures.
And I would say an air temperature on Earth which 15 C is cold.
But if need it colder, both Mars and Moon could make or store stuff at very cold temperatures- easily.
Or say on Moon and surface is 120 C, you dig a hole and have a refrigerator [no electrical power needed].
I would say, Mercury is a cold planet. But usually all that’s mentioned is how hot it is. but at any time more than 1/2 of Mercury surface is quite cold. And lunar polar region has craters which are 50 K, and Mercury likewise has these cold craters in it’s lunar polar region. And likewise at sun rise and set, both Mercury and Moon surfaces are cold but anything vertical to surface could be heated quite bit by the sunlight. One could be waist deep in shadowed frozen ground and be able to face the very bright [and hot} sunlight.
Though Mars has enough atmosphere that less stark contrast- you might see our feet from sky glowing a little bit.
Anyhow Mars average air temperature of -60 C is not cold. And if Mars air is -100 C, it’s still not cold. There not enough air to be cold like Earth is cold at 15 C.
Though it does snow in Mars, and it would be very cold CO2 snow.
Anyhow, it seems one make warm lakes with frozen surface.
Warm being 20 C [or 68 F, a cool room temperature].
Ken is so ignorant of the science that he doesn’t realize adding more CO2 changes everything. A simple analogy is a glass of water saturated with sugar. Saturation here means if you add more sugar, it will not dissolve. The water is saturated.
But, if you add more water….
The strength of the sun’s northern magnetic field is rapidly decreasing, and the spots in the northern hemisphere are aligning near the equator. This means that the maximum of solar activity in the northern hemisphere is approaching.
https://solen.info/solar/images/cycle24.png
Episode 1811 Scott Adams: Fun Times Ahead. I Will Follow The Money And Tell You The Future
https://www.youtube.com/watch?v=XznFH3aFdUI
Scott thinks nothing is real- or we are in simulation.
I don’t agree with him, but it’s possible as far as I am concerned
that Scott is in a simulation.
Or I have weird religious views, but not quite as crazy as Scott’s who doesn’t believe we landed on the Moon and their aren’t any robotic missions on Mars. And he think global warming is problem.
How he thinks global warming is problem and he living in Sim, is weirdly interesting. I get it, in sense, we wasting effort related to
topic, and in real world from which the sim is controlled, they might have problem with global warming problem.
But if this was sim, the sim is actually saying we are in the coldest period is millions of years and the only real problem is that at some point we returning to another glaciation period. Though returning to glaciation period is not really much of problem. Or global warming or cooling is not much of issue.
Anyways, Scott follows news, I don’t want to listen these lying brain dead idiots. And Scott is entertaining.
What wondered about, is why the Chinese govt is not spending a lot money on space activities. Or:
“The Chinese government spent an estimated US$13.35 billion on space activities in 2020, a dramatic increase from the $1.79 billion spent in 2009.”
But with US, NASA also doesn’t spend much money either, or Military Space spends about twice as much as NASA. Though we don’t actually know how much money is spent on military space. But we have better idea of money US spends on Military Space, as compared to Chinese number of 13.35 billion and I could not find any guess on what Chinese military spends on Space.
Anyhow, what actually wondering about, is the cost of doing anything in space is dropping a lot- we lowering the cost building satellites, and launch costs. If removed what SpaceX is doing, US is not launching a lot satellites as compared to China, SpaceX launching 1/2 of worlds payload mass to orbit. And China used to have a low launch costs, but Falcon-9 is cheapest launch in world.
But point is what is US military Space going to do with all the money their are saving due to having much lower costs, now, and what will they be doing with much lower costs in the future?
Sure, they can waste it on their bureaucracies and corruption in general, which is what normally is the case. But they have get funding from Congress and people in Congress are dumb as bricks, but they manage simple math [sometimes}.
While estimating the long term rate of CO2 concentration growth has valid uses, estimating climate change is not one of them.
The addition of CO2 to the atmosphere above 200 ppm will not cause warming. The ability of CO2 to produce warming is based on absorbing IR from the surface and adding that energy to the atmosphere. Once you get above 200 ppm over 99.9% of the surface IR is already absorbed very low in the atmosphere. As a result, the IPCC has moved to another mechanism for warming called the enhanced greenhouse effect.
The IPCC claims that future warming is based on 34 watts/m2 increase in downward directed energy from doubling CO2. They argue the energy is taken out of the atmosphere by CO2 via kinetic energy transfers and half is directed toward the surface. This is true as far as it goes, but other factors come into play.
The IPCC claims that increased CO2 blocks more energy high in the atmosphere which is then redirected downward. However, this violates basic physics known as Kirchhoffs Law of Radiation.
This physical law leads to a requirement that every layer of the atmosphere exist in radiation exchange equilibrium (REE) with the rest of the atmosphere. Since increases in CO2 are well mixed in the atmosphere, the relative proportions of CO2 in every layer remain the same. Hence, REE is maintained when the CO2 concentration is doubled.
With REE you end up with the same proportional flows of energy at every layer in the atmosphere. If you increase CO2, the flows will increase in exactly the same manner all through the atmosphere.
The net flow of energy to space by CO2 molecules must therefore increase since it is already a positive value.
The upward decreasing density of the atmosphere keeps upward directed energy flowing to space. It cannot be redirected downward in any significant quantities. That means the only energy that reaches the surface comes from very low in the atmosphere. This is where the 3-4 watts/m2 specified by the IPCC is emitted.
The vast amount of this energy comes from within what is known as the atmospheric boundary layer. This layer is known to exist in thermal equilibrium with the surface itself.
Two entities can only exist in thermal equilibrium if there exist quick and significant energy transfers between the entities. If one of the entities warms a little from any cause, energy is quickly transferred to its partner and vice versa.
Basic thermodynamics tells us there can be no warming or cooling by energy moved around within a system defined to be in thermal equilibrium. All internal transfers are met with equal and opposite energy transfers by definition.
As a result, the 34 watts/m2 of energy is moved right back into the atmosphere (via conduction, evaporation and radiation) and equilibrium is maintained.
Clearly, the IPCC and those who quote their numbers are not following basic physical laws.
This seems reasonable to me.
And in terms of:
“Clearly, the IPCC and those who quote their numbers are not following basic physical laws.”
The left tends to be anti-science.
As Left say men can give birth to children and endless other things, in addition to simply opposed anything from Age of Enlightenment and western civilization in general [America itself and Europe- unless Russia is Europe. And are quite opposed to industrial revolution which is why they always talking about returning to pre industrial times {when the world’s climate was better world, for some strange reason, which can sum up as, everything was better, and less population as big thing}.
You do not seem to understand that higher concentrations of CO2 increases back radiation. Period. The question is how much and to what effect? Kirchhoff’s law is not violated. Cooling of the upper atmosphere is enhanced, but that is a different issue than the surface effect which is slower cooling.
See Happers paper here. The spectrum is saturated. According to Happer if you double CO2 to 820 ppm you get 3Wm-2 reduction in direct thermal radiation to space. 3Wm-2 is too small to have any significant effect on climate.
https://ddears.com/2021/01/12/dr-happer-explains-effects-of-co2/
Tim S, you do create more localized back radiation. However, since there are also more CO2 molecules at lower elevations, they absorb that back radiation. It never reaches the surface.
The key is that the proportion of molecules stays the same with gravity always in control. Look at the average CO2 emission. Any downward emission will be reabsorbed sooner than a upward emission. This means the average emission is always upward. When you double CO2 you increase the total number of emissions but the average stays the same.
I understand the concept, but we know that increased humidity slows nighttime cooling. Why should the contribution from CO2 be different? The surface is the source of the heat. Everything above is at a lower temperature except when there is an inversion. Increases in the GH gases should slow surface cooling and increase upper atmosphere cooling.
Why should an increase in GH gas do anything without a corresponding change to energy from the sun? CO2 spectrum is saturated.
Tim S: “…we know that increased humidity slows nighttime cooling. Why should the contribution from CO2 be different?”
Water vapor and CO2 have very different emissions. CO2 emits mainly at the 15μ photon energy level, while water vapor emits in a broad band, centered around about 2.5μ. In rough figures, water vapor emits about 6 times as much energy per photon. The impact on Earth’s surface is significantly different.
It’s the energy/photon that is relevant to the ability to heat a surface. 6 CO2 photons have the same energy as one molecule of water vapor, but that energy does NOT add, as related to being about to heat something. That’s why ice cube can NOT boil water, no matter how many ice cubes are used.
This relationship is extremely complex. There are different surfaces on earth at different temperatures and with different spectrum depending on surface features. There are different amounts of water vapor with an even more complex interaction with CO2. I did not believe that a simplistic analysis from a Professor at Princeton is any more accurate than a very complex analysis from the IPCC models. Everyone is guessing, even those are very educated guesses.
” The ability of CO2 to produce warming is based on absorbing IR from the surface and adding that energy to the atmosphere. “
That is half of the equation. The other half is based on EMISSION of IR from the atmosphere and adding that energy to outer space.
It is the IMBALANCE of these two that leads to warming (or cooling).
“The IPCC claims that increased CO2 blocks more energy high in the atmosphere ” … which is true.
“this violates basic physics known as Kirchhoffs Law of Radiation.”
No. At its core, Kirchhoff’s Law says emissivity = absor.ptivity. Adding more CO2 to a thin layer of the atmosphere (eg ‘high in the atmosphere’) changes both emissivity and absor.ptivity. No violation of Kirchhoff’s Law.
“This physical law leads to a requirement that every layer of the atmosphere exist in radiation exchange equilibrium (REE) with the rest of the atmosphere. ”
No, this is only an approximate result, not a ‘requirement’. Various parts of the atmosphere are often not in “REE”, resulting in various parts warming or cooling.
“The upward decreasing density of the atmosphere keeps upward directed energy flowing to space.”
Specifically, the upward decreasing TEMPERAURE of the atmosphere keeps upward directed energy flowing to space. Density just happens to correlate pretty well with temperature in the atmosphere.
“If you increase CO2, the flows will increase in exactly the same manner all through the atmosphere.”
Your intuition is wrong here. If you INCREASE the CO2, the radiation travels a SHORTER distance and comes from (and goes to) layers that are CLOSER in temperature. This results in less energy transferred, not more.
If you increase CO2, you DECREASE the flow through the atmosphere.
“This layer is known to exist in thermal equilibrium with the surface itself.”
No. This layer is in (approximate) “steady-state”, but NOT “equilibrium.” This distinction is important and messes with all of the conclusions you are trying to draw using “thermal equilibrium”.
Still wrong Fokerts.
CO2 can NOT warm the surface. Ice cubes can NOT boil water.
I am grateful you shared this. This is the key point:
“The sink (removal) of excess atmospheric CO2 assumes that all of the biological and geophysical processes that remove CO2 from the atmosphere do so at a net rate proportional to the excess of the CO2 value above some equilibrium value.”
Le Chatelier’s Equilibrium principle establishes that more CO2 in the atmosphere will allow for more in solution in the oceans; the oceans can hold many times (~37 times) the CO2 of the atmosphere at equilibrium, in a process that is derated /slowed by the Revelle factor. The chemistry aligns with this model.
People are not told about these natural carbon sinks, ie, they don’t know that half our CO2 emissions are taken up by the biosphere and by the oceans (plankton and chemical processes), and that far from getting reduced over time, these will increase. Instead, the IPCC states that somehow these sinks are at capacity or will decline. From the IPCC: “Models indicate that the fraction of fossil fuel and cement emissions of CO2 taken up by the ocean will decline if atmospheric CO2 continues to increase.” They don’t apparently model any increase due to further dis-equilibrium between atmosphere and ocean as the CO2 ppm levels increase.
I saw this contradiction in the IPCC reports some years ago, and I ran a calculation on the basis of a CO2 ocean uptake that obeyed equilibrium laws and came to similar conclusion as Dr Spencer above; namely, when the combined uptake increases another 60% and absorbs most/all of the emitted CO2, CO2 concentrations will ‘flatten out’ below 550 ppm. There will be no climate crisis.
So the increase in carbon sinks as CO2 concentration rises is a very important point to make.
patrick…”Instead, the IPCC states that somehow these sinks are at capacity or will decline”.
***
The IPCC are notorious liars.
Yes, and that’s why correcting this IPCC misrepresentation is a public service. This is one key place where they put the thumbs on the scale.
“Models indicate that the fraction of fossil fuel and cement emissions of CO2 taken up by the ocean will decline if atmospheric CO2 continues to increase. They dont apparently model any increase due to further dis-equilibrium between atmosphere and ocean as the CO2 ppm levels increase.”
I dont see what error you belive you have found, and the evidence you have for it.
They must find a way how to resolve this problem, What will happen to our next generation if this problem will continue.
What problem? The salient climate data does not indicate a problem.
Lord please save us from those who would save us.
You may not have a problem but the UK record recorded temperature jumped from 38.7C in 2019 to 40.3C this month.
That’s an increase of 1.7C when the increase is usually a few tenths.
We don’t have infrastructure designed for these temperatures because when it was built such temperatures were regarded as impossible. Remember the record was set at 51N, the same latitude as Hudson’s Bay.
Oh, and before you mention 1976, I was there. Temperatures never passed 34.1C.
I posted a link to the Met Office record for 2019 and not one month of the year, especially July, had an average of 38.7 C.
I looked at every July in Oxford, UK, going back to 1879, and a typical July average was in the 24C range. Whoever is spreading this nonsense about a 38C average in the UK is an abject liar. Likely the BBC.
Heathrow airport, in the outskirts of London, only goes back to 1948 but it corroborates that average July temperatures in London have been around 24C till 2021.
“… and not one month of the year, especially July, had an average of 38.7 C.”
It was clearly stated that 38.7C and 40.3C were daily record highs, not monthly average highs.
“Whoever is spreading this nonsense about a 38C average in the UK is ” … Gordon.
Tim.. the problem is, a few days of unusual heat is being sold as catastrophic climate change. I look forward to seeing how those hot days changes the typical 24C monthly average in the UK.
I noted that some years got as high as 25C+ over a month. I presume that means there were months in past Julys where temperatures also rose as high.
This is not a few days of ‘unusual heat’ — this is a few days of exceptional (dare I say “unprecedented”) heat. And it has been happening throughout the summer so far.
” I presume that means there were months in past Julys where temperatures also rose as high.”
You presume wrong! There is no reason to ‘presume’ at all. There are clear records of temperatures back over 200 years for London, and this was the single hottest day. So no, the temperatures have NOT risen this high before. Those ‘month’s above 25C+’ simply had a number of hot days, but not this hot. We can wait until the end of the month to see if this indeed becomes the hottest July on record.
We had the same thing happen last year here in BC. Lat 50N.
Its an extreme weather event; not climate change.
If you can’t survive 40C for a day or two the problem is with your health.
NOAA claimed our heat event was related to La Nina. Environment Canada claimed it was due to climate change. Of course, EC is now called Environment and Climate Change Canada and I guess lying comes with the mandate.
“NOAA claimed our heat event was related to La Nina. Environment Canada claimed it was due to climate change. ”
I know this might be hard to understand, but an outcome can depend on more than one factor. An extreme heat event could be due to a Ln Nina that is amplified by a rising temperature trend. One does not negate the other.
We could solve the problem easily by sending off all the alarmists on an Elon Musk rocket to populate Mars. There they can rant and rave among themselves about the runaway greenhouse effect on Mars.
Much easier to send the denialists who are a much smaller group.
The fossil fuel lobby can pay their fares, as they’ve paid them for decades.
https://www.bbc.co.uk/news/science-environment-62225696
Entropic Man, please stop trolling.
RSS for Jun 2022
https://climatedatablog.files.wordpress.com/2022/07/rss-3.jpeg
UAH for Jun 2022
https://climatedatablog.files.wordpress.com/2022/07/uah-global-1.jpeg
tim s…”Predictions are difficult especially about the future”.
***
Would have been nice had you given credit to Neils Bohr for issuing that comment.
Thought it might have been Yogi Berra…
Example…’I really didn’t say everything I said’
“You can observe a lot by watching.”
More Yogi…
“When you come to a fork in the road, take it.”
“It’s deja vu all over again.”
Samuel Clemens used it before Niels Bohr, and he possibly got it from somebody else,
Roy, this analysis feels mostly like a good “senior research project” for an undergraduate in the natural sciences or math. It is interesting and well-done, but it has too many uncertain assumptions to really be predictive.
John von Neumann famously said “With four parameters I can fit an elephant, and with five I can make him wiggle his trunk.” This model has 3 such adjustable parameters:
* 2.02% removal rate
* 294 equilibrium value
* 0.45 MEI factor.
Each of these are empirically fit to the data. Given 3 factors that are adjusted to give the best fit, it is not surprising that the fit is good.
Furthermore, the assumption that the rate is *proportional* to the excess is just that — an assumption. There is no real theoretical basis for that assumption. The rate could be proportional to the square of the excess or the square root of the excess; the rate could plateau at some maximum removal value, or accelerate at some tipping point. The point is that we just don’t know what function to use, given the complex biological and geological and hydrological features of the system.
So … the fact that “a simple budget model of the atmospheric CO2 concentration very accurately matches” is not that impressive given 3 adjustable parameters. And the projection that the “resulting model projection produces atmospheric CO2 concentrations late this century well below the IPCC RCP8.5 scenario” is not very robust given the nature of this model. It *might* be close to correct, but it might be quite far off in either direction.
*****
A couple quick challenges that this model seems to fail.
1) After Pinatubo, the rate of removal seems to have increased my at least an order of magnitude. So the 2.02% “constant” is not actually constant at all in real life.
2) If 294 is truly an equilibrium value, and concentrations ABOVE 294 decrease at a 2.02% rate, then logically, concentrations BELOW 294 should INCREASE at 2.02% per year. But historically, concentrations stayed near 275 for a centuries (or millennia!). Within a century, a concentration of 275 should increase over 290 if 2.02% is accurate, but it didn’t. Clearly 294 is NOT a long-term equilibrium level.
tim…”John von Neumann famously said With four parameters I can fit an elephant, and with five I can make him wiggle his trunk.
***
Dawkins, one of the evolution theory propagandists, supported the theory that a monkey sitting at a typewriter hitting keys randomly could possibly produce a work of Shakespeare over millions of tries.
Roy is trying to quantify the CO2 issues using simple models. Most of us can see intuitively that CO2 is having no effect on climate but Roy is only trying to add some science to the observations.
Gordon.
1) Whatever Dawkins may have said has nothing to do with what I said. And nothing to do with what Roy said. My quote was at least germane to the discussion at hand — Roy’s model DOES have 3 adjustable parameters that are empirically set to fit the data.
2) Roy is trying to model CO2. And his model is an excellent start.
The question of its effect on climate is a COMPLETELY separate issue. Roy is adding NOTHING here to the question of CO2’s impact on climate.
3) Arguing science based on intuition is shaky at best. Intuition has been wrong on many issues in science in the past and will be wrong on many more in the future. (Especially among those with little education or experience in the field).
But all the works of Shakespeare are in the digits of Pi.
Tim, bobdroege, please stop trolling.
In fact, all of DREMPTY’s please stop trolling comments are in the digits of Pi, so you can shut the fuck up, it’s already been said.
bobdroege, please stop trolling.
My question is: why doesn’t the increase in CO2 affect winter temperatures in the southern hemisphere?
https://i.ibb.co/cycPTny/gfs-world-ced2-t2anom-1-day.png
https://i.ibb.co/cKqj31K/S-daily-extent-hires.png
RSS South Polar for Jun 2022
https://climatedatablog.files.wordpress.com/2022/07/rss-southern-polar.jpeg
UAH South Polar for Jun 2022
https://climatedatablog.files.wordpress.com/2022/07/uah-sopol.jpeg
RSS Northern Polar for Jun 2022
https://climatedatablog.files.wordpress.com/2022/07/rss-northern-polar.jpeg
UAH Northern Polar for Jun 2022
https://climatedatablog.files.wordpress.com/2022/07/uah-nopol.jpeg
My answer is: because the effect of the difference between the hemispheres
– North: landmasses surrounding a frozen ocean
– South: oceans surrounding a frozen land mass
is greater than the effect of CO2.
Above Antarctica and NE Siberia, the lower troposphere is often warmer than the surface below; why then should the effects of any atmospheric component be there the same as where the opposite is true?
So are you saying that AGW does not apply in the tropics in the central Pacific and also in Antarctica/NE Siberia?
What a dumb, polemic, useless, stoopid, insinuating reply.
You are saying here, not me.
You are the one saying
“Above Antarctica and NE Siberia, the lower troposphere is often warmer than the surface below; why then should the effects of any atmospheric component be there the same as where the opposite is true?”
Whenever RLH says “So are you saying” what comes after is guaranteed to have no connection to what you are saying.
It is BS, and can be safely ignored.
Whenever Nate says that AGW applies to everything other than El Nino….
I was only repeating what he had said previously.
The ENSO cycle doesnt stop with AGW. How hard is that?
AGW is global but not uniform.
Are you claiming it was predicted to be uniform?
There exists a “negative greenhouse” effect over much of Antarctica due to persistent temperature inversion, particularly Jun through August.
https://www.nature.com/articles/s41612-018-0031-y
Negative GHE??? June through August is mid-winter in Antarctica, could it possibly be cooling due to winter?
The question isn’t why winter is colder than summer, Gordon, but rather why Antarctica isn’t warming in winter as CO2 levels rise.
If it makes you feel better, this paper — while affirming the existence of a negative GHE over Antarctica — disputes that it is the cause of lack of warming there:
https://www.nature.com/articles/s41612-020-00143-w
I think this is fascinating stuff, pity that you’re so dismissive of it.
Brandon, please stop trolling.
You’ve probably never heard of E Bruce Harrison, but lots of you here have been programmed by his PR campaign.
https://www.bbc.co.uk/news/science-environment-62225696
In order to get a job writing for BBC, your resume must provide absolute proof that you are a raving ninny, incapable of logical thought or honesty.
The poobahs at BBC walk around in baggy trousers with 3″ cuffs located at least six inches above their shoes, with mismatched plaid socks, and the trousers held up by suspenders and a belt in case the suspenders fail. None of them qualify for management unless they have won at least one Monty Pythoneque ‘twit of the year’ contest.
You are trying to discredit the source rather than discussing E Bruce Harrison.
You must agree that climate change denial is a PR campaign paid for by the fossil fuel industry to protect their profits.
I agree it’s necessary to combat the AGW nonsense with a PR campaign. Most people don’t understand the science, so it’s necessary to negate as much of the alarmism as possible.
It’s hard to combat people that attempt to pervert science to support their cult beliefs. But, reality always wins.
You don’t know much about the ‘fossil fuel’ industry. Here is something to work with – All fossil fuel resources are owned by governments. The private companies that actually have visible profits and losses represent about 10 to 15% of world production. People like Putin have more. The one thing these companies might do is invent a transition solution, they have done it before they know what a replacement needs to be able to do.
If you have a political policy to shut in fossil fuels globally you create even more profits for that small group of companies no PR required at all. BUT more importantly you create mega profits for countries like Russia or saudi or nigeria etc..
This plan is not possible globally with a world that is adding a net population the size of Europe every 5 years anyway.
Until you create a reliable, viable replacement (not done yet) that must be cheap and freely available to the 90% of the world outside the rich west, profits will continue rise as cheap available resources are shut in. Climate change will not be addressed because you need oil and gas to make the stuff you are going to replace oil and gas with for now.
So far nothing done or spent in the west will have any impact (very small relative population but rich enough to have lots of virtuesignalling projects). The world needs to create alternatives and it needs money and fossil fuels to do it. THEN you might have a transition and then it might work but might not. Carry on as we are and more profits will be made mainly by countries that are not on the green bandwagon—– forget combating climate change or cooling the earth.
Changing energy is a technical challenege but it has become a religion and a political and economic weapon so nothing will be done. Deniers or supporters are irrelevant at this point – Bankrupt economies can’t address climate change.
“If you have a political policy to shut in fossil fuels globally”
What does shut in mean?
If the policy is to reduce consumption of fossil fuels, reduce demand, then I don’t see how that makes them more profitable for Russia?
Dr Spencer
Wouldnt it be better to use CO2e instead of CO2 in your model?
Probably not.
This is supposed to be a simple model.
Other changing GHGs making up CO2e; water vapour, methane, CFCs etc behave differently from CO2. Accounting for these differences would make the model much more complex.
Go back to your alarmist man-cave, Joel. I thought you had retired.
I guess things must be pretty slow over at Eli Rabbet’s rabbett hutch, after you were all schooled by Gerlich and Tsceuschner on thermodynamics and the 2nd law.
“Ocean Atmosphere Response to Solar EMR at Top of the Atmosphere
Richard Willoughby
Summary
This technical note shows how the ocean surface temperature responds to the solar radiation at the top of the atmosphere. It highlights that the ocean surface is temperature constrained to the range -1.8C to 30C over a yearly cycle apart from less than 1% of the ocean surface near land masses in the tropics where the deep convection cycle is disrupted.”
https://wattsupwiththat.com/2022/07/23/ocean-atmosphere-response-to-solar-emr-at-top-of-the-atmosphere/
“Reliable temperature records show the global oceans are not undergoing universal warming. The ocean water in the mid northern latitudes is warming. The Equatorial oceans are showing no cooling or warning trend. The Southern Ocean is showing a sustained cooling trend. How can CO2 be selective in how it warms, cools or neither cools nor warms different locations on the globe?”
Interesting question. Short answer is CO2 doesn’t warm ocean.
But when does Southern Ocean warm?
The southern ocean has been cooling for 33.9 million years, it’s why we in an Ice Age. But it must have cycles of cooling and warming back up.
As general thing it seems to warm, it can’t have ice free polar sea in the Summer as it does now. Or when doesn’t ice free summer, it gets more older polar sea ice, and winter polar sea ice become larger.
Richard M…”The vast amount of this energy comes from within what is known as the atmospheric boundary layer. This layer is known to exist in thermal equilibrium with the surface itself”.
***
If that was true, no heat could be dissipated from the surface since heat cannot be transferred between bodies in thermal equilibrium. That’s where convection comes in.
As parcels of air are heated by the surface, the heated air rises and cooler air from aloft replaces it. Then heat can be transferred to the cooler air.
Lindzen has estimated that the surface would rise to 70C+ if that convection was not present. I have experienced such conditions on a very hot, windless day at 45C. It’s not at all comfortable. We were camping and had to relocate due to the oppressive, stifling heat.
With regard to back-radiation from CO2, there are two problems. The surface layers to which you refer, if in thermal equilibrium with the surface, would not allow heat transfer from the surface. Presuming that air above the surface, but in contact with it, can never be cooler than the surface, it must get progressively cooler with altitude.
The 2nd law states clearly that heat can never be transferred by its own means from a colder region (body) to a warmer region (body). Climate alarmists have tried all forms of chicanery to get around this simple statement, but Clausius made it very clear that the law stands as written. There is no ‘net’ transfer and no mysterious net balance of energy implied.
Therefore, back radiation comes from either GHGs that are cooler than the surface or in thermal equilibrium with it. That means heat transfer is impossible from any GHGs to the surface. If such a process was possible it would be perpetual motion, plain and simple. The AGW theory is based on heat transferred from the surface to GHGs, therefore any back radiation that raised the temperature of the surface would represent a perpetual motion machine.
Again, alarmists have argued that back-radiation is added to solar radiation, an impossibility. The spectrum of the terrestrial IR is outside the solar spectrum and is not conducive to addition.
Air can warm the surface in winter, through the influx of moist tropical air, when the temperature of the incoming air is higher than the surface temperature. It can, for example, accelerate the melting of ice. This is why air circulation, which is not constant and is subject to long-term cycles, is so important.
ren…”Air can warm the surface in winter, through the influx of moist tropical air, when the temperature of the incoming air is higher than the surface temperature”.
***
I agree, Ren, but the source of the WV is the ocean not anthropogenic sources. Here in Vancouver, Canada, we benefit immensely from the warming effect of heat from currents in the Pacific Ocean that originate in warmer climates. Also, we benefit from the effect of winds from those warmer areas.
That’s not the same as arguing the trace gases produced by humans can transfer heat from cooler GHGs in the atmosphere to the surface in such a manner as to raise the surface temperature.
Alarmists argue that more of this trace gas produces higher levels of WV, which enables more back-radiation. The truth is that most WV, by far, is produced naturally by the oceans, lakes, rivers, and even ground water and has nothing to do with anthropogenic CO2.
ps. remember that WV is a trace gas itself and the warming we receive in Vancouver from the oceans will be from the 99% nitrogen and oxygen making up the atmosphere.
If you had two real greenhouses, one in an arid region and another in a rain forest climate, I doubt that the temperature of air in the greenhouse would be affected much by WV.
There is no good reason why WV, as a trace gas, should warm the atmosphere any more than CO2.
> There is no good reason why WV, as a trace gas, should warm the atmosphere any more than CO2.
Try harder, Gordon:
a) there’s more WV than CO2
b) WV is a stronger abso.rber than CO2 on a molecule for molecule basis
The “trace gas” argument is silly. Abs.orbance is (among several other things) a function of the number of abs.orbing species contained in a given optical path, not the ratio of active to inactive species in the sample.
In the case of Earth’s atmosphere the concentration of CO2 and WV are sufficient enough that it is completely opaque to LW radiation in many spectral bands, the 15 micron band of CO2 being a notable one.
Brandon, please stop trolling.
When moist air from over the ocean reaches the middle and high latitudes in winter and it starts to snow, temperatures on the continent can rise. Perhaps this is related to latent heat carried by water vapor.
Gordon Robertson
You want others to “open their minds” but at the same time you are not able to open yours. You are stuck in false beliefs and cannot get out of them. Like your own prison, you get the key and throw it back out.
Scientists are NOT saying heat transfers from a cold atmosphere to a warmer surface. Energy does transfer both ways and always has. Heat is a one way transfer.
The energy the atmosphere radiates to the surface acts to lower the amount of HEAT (not energy) the surface emits away. The total energy is what is emitting (based upon its temperature and make up) away minus what it receives from the colder source. The HEAT is always moving from the hot to the cold but as the cold gets warmer relative to the hot less heat is lost by the hotter object.
If you need to consider two balls colliding. if one ball is stationary it receives all the energy from the moving ball and returns none to the previous moving ball. If one is moving faster the slower moving ball receives this energy and transfers what it has to the faster ball. Energy transfer is a two way process.
https://en.wikipedia.org/wiki/Elastic_collision
Open your mind a bit Gordon.
No, dry air in the Earth’s troposphere has a constant vertical temperature gradient up to the tropopause, where the temperature is lowest. Warmer air rises due to its greater kinetic energy and expands as radius and volume increase with altitude. Only the water vapor content changes the value of the temperature gradient. Therefore, the global average
vertical gradient depends only on the global amount of water vapor in the air and changes minimally.
https://www.cpc.ncep.noaa.gov/products/stratosphere/strat-trop/gif_files/time_pres_TEMP_MEAN_ALL_EQ_2021.png
Norman, your analogy is wrong. Heat is not analogous to an elastic collision. You are terribly confused, as you are about a “real 255K surface”. Then there is the “two fluxes adding to raise temperature” that you can’t support.
Your confusion is getting worse, instead of better.
Clint R
Please kindly quit jumping in my posts with your stupid points. I have already addressed both your points many times. I can’t help you that you are too stupid to comprehend what I have already stated. You keep bringing up these old points over and over which is why I think you are a non-human BOT. A human can learn a little.
Roy Spencer, proved with actual experiment, that two fluxes add together to raise a temperature. You have the link.
So just please stop. Again if you bring my name up in your idiot posting, please refer to my 255 K surface as a radiating surface (I guess around 10 Km above the solid earth surface). You pervert the Truth with your claim “real 255K surface” attached to me. If you include real 255K radiating surface I will agree with that.
https://www.aos.wisc.edu/~aos121br/radn/radn/sld012.htm
Norman,
So you admit that there is no “real 255 K surface”, (earthen or otherwise) do you? You just “guess” that it exists!
That’s a start, at least.
Now you just need to admit that neither Dr Spencer, nor anybody else has managed to add two fluxes from objects at identical temperatures to make something else even hotter!
That would be as stupid as claiming that 10,000 watts of radiation from ice could be used to boil water – which would be rather idiotic, don’t you think?
Get over it, fool. CO2 has no warming or heating properties. The Earth has cooled over the last four and a half billion years – deny reality all you wish. I am sure I am not the only one laughing at your attempts to make inconvenient facts vanish.
Carry on,
Swenson
I have made the statement so many times. If you want to comment on it you should know what I have already said or refrain.
I do not guess a radiating surface that has an effective temperature of 255 K. It is in fact an average measured value.
I would agree that 10,000 watts of radiation from ice will not boil water. I will not accept that this false comparison equates to that two fluxes do not add.
Dr. Spencer actually used the emitted radiant energy of a colder object to warm a hotter one.
Norman, we are talking about a “surface”. You are talking about levels in the atmosphere. The problem is, there are TWO levels in the atmosphere that are at 255K. Neither are at 10 km.
You have NOTHING.
You’re a braindead cult idiot. You have NO knowledge of the relevant physics. Also, you forgot to provide a valid source that two equal fluxes can add to produce an increase in temperature.
Please continue.
(Your nonsense is duly recorded for future real scientists so they can learn how your cult perverts reality.)
Norman,
Here are your words “I guess around 10 Km above the solid earth surface”. Or maybe somewhere else – in your imagination?
You also wrote –
“Dr. Spencer actually used the emitted radiant energy of a colder object to warm a hotter one.”
Well, actually he didn’t. You are fantasizing. What Dr Spencer showed, (quite rightly), is that allowing more radiation from a hotter object to impinge upon a colder one, raises the temperature of the colder.
Go away, you silly little person. Seek professional advice, and adhere to the recommended treatment plan. Or not, as you wish.
It’s a relatively free world, after all.
The Earth has cooled to its present temperature. Energy use results in waste heat. Local ephemeral temperature rises result.
Dimwits like climate catastrophists refuse to accept reality. Boo hoo!
Swenson
I have no clue why you are so dumb.
YOU: “Well, actually he didnt. You are fantasizing. What Dr Spencer showed, (quite rightly), is that allowing more radiation from a hotter object to impinge upon a colder one, raises the temperature of the colder.”
Wrong silly one.
Here:
https://www.drroyspencer.com/2016/08/experiment-results-show-a-cool-object-can-make-a-warm-object-warmer-still/
Clint R is permanently stupid, do you have to follow him with your own stupid points that are easily proven wrong? What is the point of all you endless dumb people pretending you know science. You, Clint R, Gordon Robertson have never taken a physics class but pretend to be experts. Why are dumb people so arrogant. It is a mystery but it has been studied. Dumb people can be the most arrogant.
Clint R
Instead of being a total moron maybe you should learn what the term effective temperature means.
You are just such a dumb BOT your programmers are really lazy when they wrote your program.
YOU: “Then there is the two fluxes adding to raise temperature that you cant support.
Read this post and drop the subject. You don’t have a clue but you think you do.
https://www.drroyspencer.com/2016/08/experiment-results-show-a-cool-object-can-make-a-warm-object-warmer-still/
The flux from the lamp impinging upon a black painted surface heats the surface to a certain temp. With ice emitting toward it it drops the temperature when the warmer lid is put back on the surface temperature increases. The black surface receives both energy from the lamp and energy from the lid. The resulting temperature is higher than when the energy was coming from ice. This experiment satisfies your request that fluxes add and increase temperature. Drop it dumb one. Your stupidity baffles me on how little you know and how much you pretend to know.
Read a textbook, learn, come back when you have some real knowledge.
Wrong Norman. You don’t even understand the issue. The issue is about two fluxes arriving a surface adding to raise the surface to a higher temperature than either flux could do by itself.
You can’t provide ANY valid reference for such nonsense, because it’s IMPOSSIBLE. All you can do is insult, misrepresent and falsely accuse.
Cult Leader grammie pups wrote:
Wrong. That the addition of fluxes result in greater surface temperature is easy to prove.
Thanks for linking to that nonsense again, willard jr.
It’s fun when you cult idiots prove your own incompetence.
Please continue.
Cult Leader grammie pups, it’s heartening to see that your comment supports the conclusions from my efforts. Those two lights surely did heat that aluminum plate. If I had used 125 watt “heat lamps” instead, the temperature increase would have been greater still.
Swanson, please stop trolling.
Absolute nonsense, Norman. EM, like heat, transfers in one direction as well, hot to cold. There is no two-way energy transfer of any kind between bodies of different temperatures.
Climate alarmists would like to think so because the 2nd law is a thorn in their sides, just as UAH revelations about global temps is a thorn in their sides.
Gordon Robertson
Again you are just wrong. You can declare your false teachings on this blog but they are still wrong. You basically do not know enough physics to understand why your points are wrong. There is a two-way energy transfer between objects at different temperatures.
You make claims that are invalid and you have no support for them.
I have already proven your ideas as false and suggest you do as well so you do not continue in misleading anyone who might read your posts. Take a common IR thermometer. Go between two objects with different temperatures. Point the IR gun at one object and get a temperature. What you read is based upon the IR the object is emitting and converting it to a temperature reading. Now rotate and face the other object at a different temperature and point the IR gun at it. It has a different amount of IR reaching your instrument. This IR will continue to the other object.
Your ideas are garbage and easy to prove wrong. It won’t matter you are not one who likes the Truth. A few threads later you will peddle some more of your make believe bunk and pretend you never looked at this post.
Norman, you are confusing “energy transfer” with “heat”. Two objects can emit toward each other, and that means energy is transferring between them. It does NOT automatically imply that the energy will be absorbed by the hotter object. For “heat” to occur, energy must be transferred from “hot” to “cold”. And that means the energy is absorbed, raising the temperature of the colder object.
You don’t understand the basics. You keep trying to boil water with ice cubes.
> You dont understand the basics.
You’re funny, Clint.
The emissivity of ice in the “thermal” IR range is 0.97, so a cube of it is going to absorb most of what’s beamed its way.
> You keep trying to boil water with ice cubes.
Wrong. A drop of water placed directly between the two cubes will not be evenly exposed to thermal IR over its entire surface. Thus the net radiation abs.orbed will not equal the simple sum of the two converging fluxes; it will be much less depending on view angles, and in no case greater than the flux emitted from each cube. Thus the water droplet does not boil.
Correct Brandon, you can NOT boil water with ice cubes.
You didn’t deal with where we disagree, Clint. Namely that ice cubes at the same temperature absorb incident IR emitted by the other.
Where did you ever get the idea that I believe ice cubes cant absorb IR?
Are you making stuff up Brandon, like some desperate troll?
> Where did you ever get the idea that I believe ice cubes cant absorb IR?
It’s a Dragon Crank article of faith that absor.ptivity of a receiving object is dependent on the temperature of the emitting object, and you are devout, Clint:
https://www.drroyspencer.com/2022/07/updated-atmospheric-co2-concentration-forecast-through-2050-and-beyond/#comment-1338102
Okay, I see you don’t understand any of this.
But, at least you can imitate your hero quite well — misrepresenting, format, and even the lame “Dragon Crank” thrown in for good measure.
You’re an accomplished troll, Brandon!
> Where did you ever get the idea that I believe ice cubes cant absorb IR?
The question is the abs.orbtion dependency on the temperature of the emitting object, Clint. From just above:
And here:
https://www.drroyspencer.com/2022/07/uah-global-temperature-update-for-june-2022-0-06-deg-c/#comment-1335859
Now’s your chance to clarify.
You don’t want clarification, willard. You want obfuscation.
If you sincerely wanted clarification, that would mean you wanted to learn. If you sincerely wanted clarification, you would pose a responsible question that could be directly answered without trying to filter through all your garbage. But, you don’t want clarification, you want obfuscation.
That’s why I no longer babysit you braindead trolls.
> pose a responsible question that could be directly answered
Try these, Clint. Yes or No to each will suffice:
1) Given two identical objects A and B, but A warmer than B, will A absorb photons from B?
2) Same two objects but at the same temperature. Will A absorb from B and vice versa?
Use “H” for the hotter object, and “C” for the colder object, rather than “A” and “B” — less confusion.
1) Both H and C will emit a spectrum, or range, of photons. The photons will range in energy from lower to higher. The higher energy photons from C may be absorbed by H, but they will not be able to raise the temperature of H. H would need a higher average energy than it has for its temperature to be raised. That would never happen from C.
2) Same answer as above.
> The higher energy photons from C may be absorbed by H
The energy of a photon depends solely on its frequency. As I have shown you before, the emission spectra of two bodies close but not equal to each other in temperature all but completely overlap:
https://imgur.com/gallery/kKHVJVl
Given the overlap, how can H “know” that C is cooler on the basis of the frequency of incident photons from C alone?
The fact that the C spectrum is below the H spectrum is your clue. If somehow ALL of the C spectrum were forced to be absorbed by H, it would lower the temperature of H.
No matter what you try, cold can NOT increase the temperature of hot. Ice cubes can NOT boil water.
What will you try next?
> The fact that the C spectrum is below the H spectrum is your clue.
Just above you wrote, “The higher energy photons from C may be absorbed by H”. Indicate on the chart which photons from C are the “higher energy” ones.
> You want obfuscation.
Thank you for telling what I want, Pup, but I ain’t Brandon.
Here’s proof:
https://imgflip.com/i/5i87xv
Brandon, do you not even understand your own words: “…the emission spectra of two bodies close but not equal to each other in temperature all but completely overlap:”
And, “Given the overlap…”
Maybe H can’t absorb frequencies below the “overlap”, huh?
No matter what you try, cold can NOT increase the temperature of hot. Ice cubes can NOT boil water.
What will you try next?
> Maybe H cant absorb frequencies below the overlap
According to you, C emits some “high energy” photons which H can absorb. For the second time, where are those photons in the plot?
For the second time — Your overlap is calling you.
Also for the second time —
If somehow ALL of the C spectrum were forced to be absorbed by H, it would lower the temperature of H.
No matter what you try, cold can NOT increase the temperature of hot. Ice cubes can NOT boil water. Reality always wins.
What will you try next, Brandon?
> Your overlap is calling you.
I must defer to Planck for these curves.
https://imgur.com/gallery/kKHVJVl
Meanwhile, the overlap is your problem because it prevents you from showing which of C’s photons are of the “higher energy” that can be absorbed by H, so I’ll break the suspense: all of C’s photons can be absorbed by H across all frequencies, and vice versa.
> If somehow ALL of the C spectrum were forced to be absorbed by H, it would lower the temperature of H.
Congrats, Clint, you’ve just invented negative energy photons.
Wrong again, Brandon. You’ve got it backwards.
All of C’s photons can NOT be absorbed by H, but all of H’s photons can be absorbed by C.
That’s what you could learn from the emission spectra, if you understood any of this.
And, no “negative energy” needed. Low energy photons that manage to be absorbed by a mass where the average vibrational energy is higher, will cool the mass. Again, you can’t understand any of this.
No matter what you try, cold can NOT increase the temperature of hot. Ice cubes can NOT boil water. Reality always wins.
What will you try next?
> Thats what you could learn from the emission spectra
I asked you twice to point out on the plot which of the “higher energy” photons from C can be absorbed by H, and twice you have failed to do so.
Will you go for the hat trick, Clint?
Clint R constantly thinks rational scientists are cultist. He is obsessed with cults since he belongs to one. He is a complete idiot saying foolish things and making up garbage yet he pretends he understands physics. Quite hilarious to see this level of ignorance and arrogance mixed in one simple minded poster.
Can’t really believe a real human is that stupid so the most obvious conclusion is Clint R is not human but a word generating BOT. Can humans really be as stupid as Clint R? Maybe if they belong to a cult it is possible.
Clint R theme song:
https://www.youtube.com/watch?v=Oc88DU8dzQg
Brandon, I asked you twice to understand your own “overlap”, and twice you have failed to do so.
And now you’ve brought in braindead Norman to help you. He’ll help you go in the wrong direction, for sure.
No matter what you try, cold can NOT increase the temperature of hot. Ice cubes can NOT boil water. Reality always wins.
What will you try next?
> I asked you twice to understand your own overlap
You should be asking yourself that question, Clint. If you actually thought about it you’d realize why you can’t point to which “higher energy” photons emitted from C are able to be absorbed by H … as you have previously claimed exist.
Good luck.
Brandon, see if this simple analogy helps:
H is emitting 7 energy level photons — 1,2,3,4,5,6,7, with 7 being the highest level. The average energy level, corresponding to a temperature, is 4.
C is emitting 5 energy levels photons — 1,2,3,4,5, with 5 being the highest level. The average energy level, corresponding to a temperature, is 3.
H is hotter than C, as 4 has more energy than 3.
Now what is the temperature of H if it absorbs the entire flux from C?
The answer is 4. The lower energy photons do NOT raise the average energy level.
Cold can NOT raise the temperature of Hot. That’s why ice cubes can NOT boil water.
Does that help?
Clint R
Please quit being so stupid. Your example means nothing. Roy Spencer experiment plus countless experiments previously established the Law you call bogus.
Real Physics (not cult Clint R made up bullshit):
https://phys.libretexts.org/Bookshelves/College_Physics/Book%3A_College_Physics_(OpenStax)/14%3A_Heat_and_Heat_Transfer_Methods/14.07%3A_Radiation
Learn real physics and quit peddling your cult nonsense.
What evidence do you provide for your incorrect ideas? None. You just spout opinions of what you think are correct.
Norman, that’s what I like about simple analogies — they annihilate your confused cult beliefs. And that makes you ramble incoherently.
Did you ever find a valid reference for your belief that two 315 W/m^2 fluxes arriving a surface can heat it to 325K?
You know you’ve claimed you ALWAYS back up your beliefs….
“Maybe H cant absorb frequencies below the ‘overlap’, huh?”
There is no “below the overlap”. Both object emit photons down to zero energy / zero frequency. The difference is the *intensity*.
So I guess technically, you are correct. H cannot absorb photons with a frequency below zero! And H can therefore — by your own logic!– absorb any photons above 0 Hz from C!
“Two objects can emit toward each other, and that means energy is transferring between them. It does NOT automatically imply that the energy will be absorbed by the hotter object. ”
Suppose we have two large blackbody sheets close together. “H” is at 500 K emitting 1452 W/m^2. “C” is at 300 K and emitting 459 W/m^2.
What do you imagine happens to the 459 W/m^2? All of the photons get absorbed by H? All of the photons get reflected by “H”? Some get absorbed (which??) and the rest … get reflect? disappear? Something else?
Also, what is the net loss from H? What is the net gain by C?
Clint R
No your analogies do nothing expect expose your ignorance of science.
Yes I have linked you to a condition where the energy of a colder object is combined with the energy of a hotter object to raise a surface temperature.
If you are not a BOT then look at the data and think. If you are a BOT you will repeat the same things over and over several times.
https://www.drroyspencer.com/2016/08/experiment-results-show-a-cool-object-can-make-a-warm-object-warmer-still/
There is a constant input energy from a lamp. When ice is emitting to the surface it has a lower temperature. When the warmer lid is emitting to the surface the temperature rises (look at Roy’s graphs). The energy of the lamp and the lid reaching the surface warm it to a higher temperature than the colder ice and lamp. The ice would also warm it to a higher temperature than the IR emitted from much colder dry ice. The answer you request is there in the data. Read it. Think of it and have the courage to admit you are wrong. Or be a BOT and repeat your points hundreds of times.
Wrong again, Norman. You’ve found another link you can’t understand.
That is NOT an example of “cold” warming “hot”. The high energy photons from the lamp are being reflected back to the hot plate. What Spencer built is called a “radiative reflector”. It’s in the same category as how a Thermos bottle works. The EMITTED photons from the “ice shield” can NOT warm the hot plate.
You don’t understand any of this.
Also, I see your cult hero has shown up. Maybe you could ask him for his “valid reference for your belief that two 315 W/m^2 fluxes arriving a surface can heat it to 325K”. After all, he’s the one that made up that nonsense….
> see if this simple analogy helps
It just digs you further into the hole you’ve made for yourself, Clint. First of all, it again fails to show “higher energy” photons emitted by C that can be absorbed by H — which you earlier claimed exist.
Next, you show overlapping energy levels 1-5, which is near enough reality ***, but presents you the same problem you’ve had all along: how does H know that photons 1-5 came from a cooler object? Which can H absorb from C and which must it reject?
——
* In reality C emits 1-7 just as H does, but at lower intensity, i.e. fewer photons per unit time in each frequency band.
Brandon, you didn’t understand the simple analogy.
The analogy specified all of the photons from C were absorbed:
“Now what is the temperature of H if it absorbs the entire flux from C?”
And it is NOT the “intensity” that is considered in natural processes. You may be thinking about lasers or microwave ovens. These are manmade devices that use “design” and external energy sources. In natural processes, it is the frequency/wavelength that determines whether or not the temperature will increase. A whole bunch of ice cubes can’t heat a surface more that one ice cube. C is NOT emitting the same spectrum as H.
Study the simple analogy. Learning science requires discarding your bogus beliefs. Cold can NOT raise the temperature of Hot. That’s why ice cubes can NOT boil water. And that’s also why a cold sky can NOT increase the temperature of a warmer surface.
Clint R
What are you claiming with Roy Spencer experiment. You are too irrational to follow. Read the article by Roy and come back when you understand the process. At this time you make no sense.
Norman, you can’t understand my comment because you don’t understand the “experiment”. You can’t understand ANY of this. That’s why you couldn’t solve the simple problem about the plate with 0.5 emissivity. You’re all blather, but no substance. You’re a complete phony.
Did you ever find a valid reference for your belief that two 315 W/m^2 fluxes arriving a surface can heat it to 325K?
You know you’ve claimed you ALWAYS back up your beliefs….
> In natural processes, it is the frequency/wavelength that determines whether or not the temperature will increase.
As shown you several times now, bodies close to each other in temperature emit over the same range of frequencies, Clint.
https://imgur.com/gallery/kKHVJVl
Your “analogy” showed the same thing, H and C both emitting over the same “energy levels” 1 through 5. It did not show any “higher energy” photons emitted by C that can be absorbed by H as you previously claimed exist.
In sum, you’ve not proposed a mechanism by H knows the temperature of C and vice versa and you’ve contradicted yourself.
Reality is so much simpler; it does not require objects to “know” the temperature of any of its surroundings. Real objects “decide” whether to absorb an incident photon by its emissivity at that photon’s specific frequency.
Well that’s a lot of rambling Brandon. But at least you seem to be making some progress.
It’s the photon frequency/wavelength, combined with surface properties and temperature, that determine absorp.tion.
I’m always happy to see any progress.
> But at least you seem to be making some progress.
I’ve been saying the same things all along, Clint. Too many times more than should be necessary if you ask me.
OTOH, you keep changing your story:
[Clint] Two objects can emit toward each other, and that means energy is transferring between them. It does NOT automatically imply that the energy will be absorbed by the hotter object.
[Also Clint] The analogy specified all of the photons from C were absorbed [by H]
Wrong again, Brandon.
I haven’t contradicted myself, and I haven’t changed my story.
The simple analogy was to explain to you how even IF the entire flux from a colder object were absorbed, the temperature of H would not be raised.
I can explain it to you, but I cant understand it for you.
No matter what you try, cold can NOT increase the temperature of hot. Ice cubes can NOT boil water. A cold sky can NOT raise the temperature of a warmer surface. Reality always wins.
What will you try next?
(PS Any more false accusations and I will stop babysitting you.)
“H is emitting 7 energy level photons 1,2,3,4,5,6,7, with 7 being the highest level.”
That is not how it works. Objects emit a range of photons based described by Planck’s Law. There is not a cut-off at some particular energy. (For a ‘simple analogy’, we can assume the surfaces are black bodies. If not, the discussion would be a bit more complicated, but the end conclusions the same.)
“The average energy level, corresponding to a temperature, is 4.
That is not quite right either, but we can assume the temperature is “4” in some units.
“C is emitting 5 energy levels photons 1,2,3,4,5, with 5 being the highest level.”
No! C emits according to Planck’s Law as well. If it is cooler the intensities drop across the board, but it would still emit over ‘all seven’ levels. The photons emitted by the 7th level would be less intense, but still there.
“The average energy level, corresponding to a temperature, is 3.”
Again, not exactly, but we can go with it. The average might be 3, but there are still “energy 7” photons coming out.
“H is hotter than C, as 4 has more energy than 3.”
OK. That is fine. Good work!
“Now what is the temperature of H if it absorbs the entire flux from C?”
This is a meaningless questions to ask about “the” temperature of “H”! If “H” was initially at temperature “4” but emitting all those photons you mention, then it is cooling! There is no fixed, constant temperature for “H”. It will go from 4 to 3.9 to 3.8 ….
H could only have a fixed temperature if it has some heater to make up for the continuous lost of energy by photons. So we could imagine that “H” is losing 4 units of energy via those photons in some unit of time, but also has an electrical neater supplying 4 units of energy.
But now to answer your question, if “H” ALSO absorbs the entire 3 units of flux from “C”, then H is receiving SEVEN units of energy but only losing 4. Now H would indeed warm up from the combo of electric heater and “C”. Warm up until it was hot enough to enough 7 units of photons.
“Cold can NOT raise the temperature of Hot.”
Quite true. If H it losing 4 units of energy and cooling quickly, the best C could do is make it cool slowly.
But if an electric heater is supplying a steady 4 units of energy to hold H at a temperature of “4” and then we add the 3 units from C, H will definitely warm up!
(Or similarly, if the sun is supplying a steady 240 W/m^2 (corresponding to 255 K) and then an additional flux from the cool atmosphere is added, then the surface willl warm above 255 K from the ‘colder flux’.)
Does that help?
Yeah Folkerts, it’s a simple analogy. I like simple analogies because it’s fun to watch you cult idiots work laboriously to confuse the issue.
Good job….
Did you ever find a valid, credible reference to support your belief that two 315 W/m^2 fluxes arriving a surface can raise its temperature to 325K?
Yeah Clint, its a simple BUT WRONG analogy. Using a bad analogy will only lead to bad conclusions.
Its fascinating to watch you work laboriously to confuse the issue with a bad analogy. We are just trying to point you gently in the right direction. Can you point to any reference that says hot objects emit 7 energies, but cooler objects only emit 5?
Yes Clint your trolling is obvious. You’re not without your amusements though; cooling photons is one of the funniest things I’ve ever read on the Internet.
Never stop being you!
Wrong Folkerts. It’s a good analogy for its intended purpose.
You don’t like it because it can be easily understood. Your cult hates simple, reality-based analogies like the ball-on-a-string.
Now, get back to perverting physics like you did with your two 315 W/m^2 fluses heating a surface to 325K. That is a classic. It even has poor Norman bamfoozled. If it were true, it would mean you could boil water with ice cubes!
That’s why this is so much fun.
> reality-based analogies
What’s the wavelength of a level 4 photon, Clint?
Sorry Brando, I’m not babysitting you today.
You’ll need to troll someone else.
That’s what I thought. Thanks for playing.
Are these photons intelligent photons, or did they skip the class on Maxwell Boltzmann distributions?
lol. One wonders.
bobdroege, Brandon, please stop trolling.
“Heat transfer is always from hot to cold unless work is done on the system.”
“Cold can not warm Hot.”
One of these statements is bullshit and one is the second law of thermodynamics.
bobdroege, please stop trolling.
Drempty,
Looks like you insist on being a fucking moron.
Fine by me.
I’ll keep trying to explain the correct science, but some morons won’t learn.
#2
bobdroege, please stop trolling.
“Its a good analogy for its intended purpose.”
No, it’s clearly not, because it leads to wrong conclusions.
“You dont like it because it can be easily understood.”
No, I don’t like it because it leads to wrong conclusions. Like the caloric model is easily understood but wrong. Or the geocentric model is easily understood, but wrong. Being ‘easily understood’ is no indication that a model is correct.
Tim, please stop trolling.
— Gordon Robertson says:
July 23, 2022 at 5:17 PM
Richard MThe vast amount of this energy comes from within what is known as the atmospheric boundary layer. This layer is known to exist in thermal equilibrium with the surface itself.
***
If that was true, no heat could be dissipated from the surface since heat cannot be transferred between bodies in thermal equilibrium. Thats where convection comes in.–
It seems can’t/don’t have thermal equilibrium unless heat is dissipated or transferred.
The surface of sun is violently disturbed {and is no place for a human} but has thermal equilibrium.
It seems one can show the equilibrium of our atmosphere with stick dynamite. If detonated, dynamite very quickly gets hot, and one gets a localized disruption of the thermal equilibrium.
Or things get violent when it’s changed significantly.
The atmosphere thermal equilibrium is disturbed/disrupted by the 6 hours of peak solar hours each 24 hr day.
If turned off the sun, one would still have weather.
The land regions warm and cool faster than ocean regions.
If Earth was entirely covered with oceans, the surface of ocean has different temperature, thereby still give weather.
In say 1 month period, most of ocean surface would cool to the average temperature of ocean.
If Ocean average temperature was 5 C or more. In month of time the ocean will still be ice free.
The tropical ocean has most warmed water near it’s surface, and would take a lot longer the cool to average ocean temperature.
When ice forms on the ocean, the ocean acts more like land- cools quickly, and create weather.
Years later, with all ocean frozen, you would have little or no weather.
And actual global temperature, hasn’t changed much, atmosphere is very cold, average ocean temperature is only slightly cooler.
Turn the sun back on, and model it.
Or you starting with snowball earth with a warm ocean [if 3.5 C or 5 C counts as warm]. But in terms of an Ice house global climate, 6 C average temperature of the ocean is still a cold ocean or still in an Ice Age. So, could have average temp of Ocean of 6 C, model that and see how “hot” that gets.
“If turned off the sun, one would still have weather.”
Not really. No gaseous atmosphere, no aquasphere, surface around 35K.
Irrelevant in any case. The Sun stays on, there is weather, and the finest minds in the world cannot predict what the “weather” will be in an hour, any better than an average 12 year old child.
gb…”It seems cant/dont have thermal equilibrium unless heat is dissipated or transferred”.
***
The theory goes that because two bodies of the same temperature are in contact, heat will be evenly transferred between the bodies, at the boundary, and cancel out. If you have air contacting the Earth’s surface there is conduction between individual air molecules and the surface. However, conduction won’t take place unless the air molecules touching the surface have a lower kinetic energy, hence heat content.
The magic re heat transfer occurs because heated air rises, due to its higher acquired KE. As it rises, it cannot leave a vacuum, therefore cooler air from above replaces it. Of course, that air has a lower KE therefore conduction is possible since it acquires heat from the surface.
That rising air and replacement air is convection. As Lindzen once claimed, without that convection, the surface temperature would rise to 70C+.
Most of heating of atmosphere is done over 70% of Earth surface which ocean and evaporation is creating pressure and water vapor condensing has latent heat in which droplets water are heating air.
If spray water, one quickly cool or if warmer water, heat air.
“The surface of sun is violently disturbed {and is no place for a human} but has thermal equilibrium.”
It is an oxymoron to have equilibrium that is constantly disturbed. So that makes this statement wrong right off the bat.
Furthermore, it is well known that there is a temperature gradient from the center of the sun up through the photosphere and into the chromosphere. But definition, “thermal equilibrium” means a constant temperature throughout the system, so even a ‘calm sun’ would not be in thermal equilibrium.
–Furthermore, it is well known that there is a temperature gradient from the center of the sun up through the photosphere and into the chromosphere. But definition, thermal equilibrium means a constant temperature throughout the system, so even a calm sun would not be in thermal equilibrium.–
So, you saying stars can’t have a thermal equilibrium?
Nor could a planet?
Or more specifically, a planet which mostly molten rock, can’t have thermal equilibrium?
I thought climate guys, were somewhat interested in Earth’s thermal equilibrium.
Which seems to me, to be mostly about Earth’s ocean.
“So, you saying stars cant have a thermal equilibrium?”
Correct!
“A system is said to be in thermal equilibrium with itself if the temperature within the system is spatially uniform and temporally constant.”
This is from wikipedia, but you will find a similar definition in any thermo textbook. Stars do not have spatially uniform temperatures, so they are not in thermal equilibrium.
******
Many people informally and/or incorrectly say “equilibrium” when truly mean “steady-state”. Steady-state can have a steady gradient. But when speaking precisely, it is important to know which one you truly mean. Stars are in a (nearly) steady-state condition. The climate is in a (nearly) steady-state condition (on various scales of time and space).
– Tim Folkerts says:
July 26, 2022 at 4:34 AM
So, you saying stars cant have a thermal equilibrium?
Correct! —
Ok, so how about the surface of Venus?
But going back to our nearest star.
The Sun has very uniform temperature.
And our star is suppose to be more variable than other stars.
You could say that. by definition, all parts of the sun that are at 6013 K are in thermal equilibrium with all other parts at 6013 K. or that all parts of Venus that are at at 730 K are in thermal equilibrium with all other part that are at at 730 K.
But those are pretty meaningless statements.
You cannot say the top of the photosphere is in thermal equilibrium with the bottom of the photosphere. So the sun as a whole is not in thermal equilibrium.
But since each part of the sun stays (approximately) constant in temperature, you CAN say the sun as a whole is in thermal steady-state.
–You cannot say the top of the photosphere is in thermal equilibrium with the bottom of the photosphere. So the sun as a whole is not in thermal equilibrium. —
Well, top of photosphere, is sort like the top of our atmosphere.
I regard Earth’s entire ocean as Earth surface. Or whatever above the rocky surface of Earth.
So most of Sun surface is below the photosphere. And of course, Sun’s surface is very vast region which does include the photosphere.
A strong solar wind surge will boost eastward circulation in the equatorial Pacific.
https://i.ibb.co/zrYth60/latest2day.png
https://i.ibb.co/4Z4wS8z/203-A-image-Ocean-Currents.jpg
https://www.tropicaltidbits.com/analysis/ocean/nino34.png
Solar wind
speed: 494.6 km/sec
density: 5.71 protons/cm3
Daily Sun: 24 Jul 22
Sunspot number: 96
Thermosphere Climate Index
today: 13.48×10^10 W Neutral
Oulu Neutron Counts
Percentages of the Space Age average:
today: -0.8% Below Average
48-hr change: -3.2%
Lowest neutron count I”ve seen in 25 Cycle,
but probably climb back up- and I would guess it might make
another run going spotless, within a week.
It seems spots were going towards equator, but it’s northern
ones. Anyhow, not saying I can predict anything. It about like
predicting, next month global temp.
I guess it will continue to go down a bit.
And it seems Hurricane season isn’t happening, yet.
Nothing in next 48 hours seems common, which I am sure
many are happy about.
But it seems SlS launch might happen around time [end August], when situation will have changed.
La Nia is almost certain as heat from the western Pacific disappears and the Humboldt Current remains cold.
https://www.tropicaltidbits.com/analysis/ocean/nino4.png
https://www.tropicaltidbits.com/analysis/ocean/nino12.png
In red you see the F10.7cm solar flux till Jul 22:
https://drive.google.com/file/d/10QX3O6JIK3RIhUJgiqdhim4yUaG9ZwfR/view
You seem to differ about when SC25 started.
https://www.iup.uni-bremen.de/gome/solar/mgii_composite_2.png
Wrong.
My starting date is absolutely correct: cf. Patrick Geryl and Jan Alvestad.
https://community.spaceweatherlive.com/topic/1798-when-did-solar-cycle-25-start/
Your problem is that you don’t understand the difference between
– SSN and F10.7
– Mg II.
Search and learn, instead of permanently posting your boring, personal guesses a la ‘No warming since 1878’ (your usual college boy niveau).
No warming since 1878 in the central Pacific please. That is not a guess it is backed up by the data.
https://climatedatablog.files.wordpress.com/2022/07/nino34-absolute.jpeg
I just posted what bemen.de (and apparently NASA) use for SC25. They differ from you. Live and learn.
“Patrick Geryl and Jan Alvestad developed a new theory” which just might be wrong.
Linsley-Hood, you keep being a stalker, liar and trickster.
1. ” No warming since 1878 in the central Pacific please. ”
I just need to remember your college boy stuff:
” If the maximum sea surface temperatures have not changed that much in the central Pacific in over 130 years, how does AGW account for that fact? ”
You are not talking solely about the Central Pacific, Linsley Hood.
You are guessing about no warming in a minuscule region (less than a Mio km^2) being a possible proof for ‘no AGW’.
One couldn’t behave more tricky.
By the way: while the trend for NCEP-Nino3+4 since 1979 is -0.03 C / decade, that for UAH in exactly the same region (2.5 degree grid cells within 5N-5S — 170W-120W) is +0.06.
*
2. ” I just posted what b[r]emen.de (and apparently NASA) use for SC25. They differ from you. ”
So? Apparently NASA?
Look at this page
https://www.nasa.gov/press-release/solar-cycle-25-is-here-nasa-noaa-scientists-explain-what-that-means
” The Solar Cycle 25 Prediction Panel, an international group of experts co-sponsored by NASA and NOAA, announced that solar minimum occurred in December 2019, marking the start of a new solar cycle. ”
December 2019: this is EXACTLY what I use, and what Geryl/Alvestad computed out of F10.7 data.
As usual, you are not only incompetent: you were lying as well.
I did not incompetently predict that La Nina would be completely gone earlier this year, that was you (or your repetition of something that others claimed that you just repeated).
The Nino 3.4 data shows that you (and they) were wrong in fact and that is not a prediction but a reality.
“You are not talking solely about the Central Pacific”
Ah, but I am, as that is supposed to be the maximum temperature that is achieved in the oceans. Unless you know somewhere on the water that is consistently higher of course.
I know that you and others claim that AGW operates on everything other than the maximum temperatures (El Nino) but without saying just how that could occur (of course).
The G/A claim for the start of SC25 is that a minimum determines the start of a cycle no matter if it could just be an exceptionally low point in the last cycle. We shall see if that is borne out by the maximum and the overall cycle in a few years time. Bemen.de still thinks that SC25 started later than your claim. Live with it.
Got away from your claims that CTRM and 5 pass S-G are ‘wrong’ somehow I see.
” Bemen.de still thinks that SC25 started later than your claim. Live with it. ”
It seems that you are opinionated to such an extent that you even can’t correctly read the Bremen graph.
There you read that the Mg II composite start for SC25 was 2018, March 3; the SC25 Mg II plot is currently in the 4th year, and not in the 3rd, as it is wrt SSN and F10.7cm.
This is easily confirmed by downloading
http://www.iup.uni-bremen.de/gome/solar/MgII_composite.dat
and looking for the lowest value since 2017, giving 2018, March 2.
*
” Got away from your claims that CTRM and 5 pass S-G are wrong somehow I see. ”
Again, your stupid lies.
I NEVER said CTRM let alone a multipass S-G would be wrong.
YOU, Linsley Hood, are insinuating that all the time.
I claimed – together with Mark B – that you were kidding and belying the blog when telling us CTRM and S-G would give the same results, what is UTTERLY wrong, as I explained many times (12 month CTRMs are equivalent to 16 month original S-G output).
Some weeks later, you silently admitted to have used a tool which manifestly performs a big smoothing of the original S-G output, what makes it of course similar to CTRM.
*
All I see is your repeated lack of competence and urge in lying.
Live with them!
“I NEVER said CTRM let alone a multipass S-G would be wrong.”
Just that my using them was wrong then I guess.
“12 month CTRMs are equivalent to 16 month original S-G output”
But it is the equivalent to only 12 months of 5 pass S-G which is what I was comparing it to. Indeed I verified that it was before using it (as I said in my original post).
So my CTRM and the 5 pass S-G (which has been my method since 2014) are of exactly the same window size, something that both you and Mark B said was ‘impossible’. Both you and he were wrong.
As to bemen.de their SC24 to SC25 comparison is
https://www.iup.uni-bremen.de/gome/solar/mgii_composite_2.png
red trace versa green trace. Duck and dive all you like. Those are the facts.
Once again a decrease in magnetic activity on the solar disk.
https://spaceweather.com/images2022/25jul22/hmi1898.gif
UV radiation is falling again.
Cycle 25 is weaker than 24. Compare yourself 2012 and 2022. 2012 saw the peak of activity in the northern hemisphere.
https://i.ibb.co/t25H7wn/ises-solar-cycle-sunspot.png
https://i.ibb.co/LQ2GLXR/ises-solar-cycle-f107cm.png
https://solen.info/solar/images/cycle24.png
Come back when you have more to show than… simple predictions.
What I show, Mr Palmowski, is… reality.
These charts shows the latest data, not any predictions. Show others.
You show your imaginations.
But… you yourself compared red predictions and a blue reality bypassing the predictions by a lot, nonetheless wrote above:
” Cycle 25 is weaker than 24. ”
I can only suppose that you simply misunderstood what the graph you posted really shows.
You must compare SC24 and SC25 during the same cycle periods:
https://drive.google.com/file/d/10QX3O6JIK3RIhUJgiqdhim4yUaG9ZwfR/view
This is current solar activity data.
https://i.ibb.co/TrHR6tN/wolfjmms.png
Your prediction has no basis because the Sun’s magnetic dipoles are weakening and the spots have weak magnetic activity and are fading fast.
I don’t post predictions. I post about existing, available data.
Namely this:
https://www.spaceweather.gc.ca/forecast-prevision/solar-solaire/solarflux/sx-5-flux-en.php
WSO Stanford is observing very low magnetic activity in the solar equatorial region.
https://i.ibb.co/zRwYhS4/gfs-nh-sat4-t2anom-1-day.png
Solar Dipole from WSO.
https://i.ibb.co/xFH51Mt/Dipall.png
Solar wind
speed: 528.7 km/sec
density: 12.40 protons/cm3
Sunspot number: 100
Updated 26 Jul 2022
Thermosphere Climate Index
today: 13.42×10^10 W Neutral
Oulu Neutron Counts
Percentages of the Space Age average:
today: -0.0% Below Average
48-hr change: +0.8%
“COSMIC RAY UPDATE: Cosmic rays in the atmosphere are rapidly subsiding. In the past year alone, radiation levels in the air high above California have plummeted more than 15%, according to regular launches of cosmic ray balloons by Spaceweather.com and Earth to Sky Calculus. The latest measurement on July 23, 2022, registered a 6 year low…
…
The sun makes it more difficult for these cosmic rays to reach Earth. Simply put, when the sun is active, its magnetic field gets stronger and more tangled. Cosmic rays have trouble penetrating the magnetic thicket. Also, individual CMEs sweep aside cosmic rays, causing sharp reductions called “Forbush Decreases.” The two effects blend together to bring daily radiation levels down.”
There is mediun spot entering our side, but still think could get towards spotless, in next week. Not that it means anything, except the lower level of cosmic rays, might climb back around 3% and then later dive back down to 0% and probably lower as we get further in to the solar Max
–Could Natural Hydrogen Kill Green Hydrogen?
Eric Worrall
Essay by Eric Worrall
h/t David S. If you have never heard of natural hydrogen deposits before, youre not alone. But discoveries of substantial underground gas fields which mostly contain almost pure hydrogen have the potential to completely upend efforts to develop a green hydrogen economy. —
https://wattsupwiththat.com/2022/07/24/could-natural-hydrogen-kill-green-hydrogen/
As usual, we must carefully read all what WUWT posts, from the first down to the last line and, if possible, even between them.
” A word of caution, information about natural hydrogen is pretty sparse, so I have no validation of the claim natural hydrogen occurs in sufficient quantity in exploitable deposits, other than a handful of papers. It may prove to be the cold fusion of the zero carbon industry. But serious people seem to be taking it seriously. “
Water Vapor is a potent greenhouse gas. Too, water vapor turns into water that will cause sea levels to rise and atmospheric oxygen levels to drop. I don’t know why people could think of hydrogen as a potential fuel replacement for fossil fuels.
If you burn Hydrogen, water vapor is formed and oxygen is removed from the atmosphere.
Your concerns are negligible by four orders of magnitude, Ken:
https://iopscience.iop.org/article/10.1088/1748-9326/aa8390
If my concerns about H2O emissions are negligible then so are your concerns about CO2 emissions ‘negligible by four orders of magnitude’.
It doesn’t rain CO2, Ken.
You might want to read up on ‘carbon cycle’.
It doesn’t rain diamonds either, Ken. At least not on our planet.
https://www.americanscientist.org/article/on-neptune-its-raining-diamonds
Brandon, please stop trolling.
I’ll spell it out for you, DREMT, though you should already know this.
The fast carbon cycle is slower than the atmospheric water cycle, by several orders of magnitude. Thus, even though burning fossil fuels releases about the same amount of water molecules as CO2 molecules, the water precipitates out in a matter of days, leaving total water content of the atmosphere virtually unchanged.
For CO2 the the residence time is on the order of 5-10 years. However, the adjustment time to a CO2 pulse — the time it takes CO2 concentration to return to the pre-pulse equilibrium — is on the order of 50-100 years.
This is why we don’t worry about water vapor emissions from our tailpipes. It doesn’t stick around long enough to be a factor.
Where we do need to consider water vapor is as a positive feedback to a change in temperature, due to any cause anthropogenic or not. In that scenario as the most abundant GHG it can have a profound effect.
#2
Brandon, please stop trolling.
Please stop PSTing, DREMT.
#3
Brandon, please stop trolling.
Please stop acting like a bot, DREMT.
#4
Brandon, please stop trolling.
Some people with OCD have to touch all lamps. DREMT has to post last. Else he gets anxious.
La Nina is working and will continue to work.
https://i.ibb.co/zRwYhS4/gfs-nh-sat4-t2anom-1-day.png
Is the probably triple dip La Nina responsible for this year’s unusual warm period in Europe?
Tell us everything you (really) know!
How many coal-fired power plants does Germany have to run before the coming winter?
Is the probably triple dip La Nina responsible for this years unusual warm period in Europe?
Three days is not a period.
La Nina affects global and regional temperatures and weather world wide.
Three days, ren?
Maybe in Poland, hu?
You are simply kidding us.
Look at recent data for Portugal, Spain, France, Italy, Greece.
Do you foresee a warm winter in Germany because of this?
Look for spots on the sun.
https://i.ibb.co/L6xYg42/latest.jpg
87!
You have great eyesight! Just envy it.
“The “sunspot number” is then given by the sum of the number of individual sunspots and ten times the number of groups. Since most sunspot groups have, on average, about ten spots, this formula for counting sunspots gives reliable numbers even when the observing conditions are less than ideal and small spots are hard to see.”
https://solarscience.msfc.nasa.gov/SunspotCycle.shtml
How many spots were there in 2012, and how many in 2022? Is the cycle of 25 weaker than 24 so far? Don’t mention forecasts, because they are fortune telling.
http://www.solen.info/solar/images/cycles23_24.png
— Ireneusz Palmowski says:
July 25, 2022 at 10:22 PM
How many spots were there in 2012, and how many in 2022? Is the cycle of 25 weaker than 24 so far? —
I wondering if 25 is going to give any hints about 26.
And I am mostly interested in cosmic rays.
So in terms 2012, you had about 2 years of moderately low levels
of cosmic rays, it seems we could have less than 2 years with
25.
Which sort of means 25 would be weaker. But say in next 3 weeks, I expect we will get over 150 sunspot level for over a week of time.
But the erratic nature, is sort of, kind of what I mean about clues
about 26.
But Sun is as unpredictable as weather on Earth.
And don’t think is has much to do global climate.
Cyclical 66-year changes in solar activity have a huge impact on changes in circulation and climate. The prolonged La Nia is a harbinger of such changes.
“During the Maunder Minimum, the Sun emitted less strong ultraviolet light, and so less ozone formed. The decrease in ozone affected planetary waves, the giant wiggles in the jet stream that we are used to seeing on television weather reports.”
https://earthobservatory.nasa.gov/images/7122/chilly-temperatures-during-the-maunder-minimum
“Cyclical 66-year changes in solar activity have a huge impact on changes in circulation and climate. The prolonged La Nia is a harbinger of such changes.”
One might have severe weather effect.
And whether we in Solar Grand Minimum is dependent on solar cycle 26.
The idea/theory that 25 would be like 24, seems mostly correct, in terms of what 26 is going to be like could be correct.
In terms of global climate, it seems to me, we had more than hundred years of warming and warming was good thing, and I would prefer more warming. And doesn’t appear to me, we going to get much more warming, but I don’t think it due to solar activity, rather I would say we have recovered to the cool time of Little Ice Age, and we are not going to get as cool as LIA within a short period of several decades.
And part of LIA was it’s volcanic activity, and similar or greater volcanic events which occurred within LIA is possible.
But I have no confidence of predicting solar activity nor greater volcanic events. But it seems if had larger volcanic event as the worst during LIA, that would/should effect global climate in rapid way.
But most volcanic activity occurs within the ocean- as some say over 80%. What volcanic activity in ocean during LIA is “unknown” and what oceanic activity in ocean happening recently is slightly less “unknown”. Or we have not explored our ocean, we have starting to do this to some degree, but a lot remains, unknown.
Btw, if we make ocean settlements this would predicatively cause a Golden Age of ocean exploration.
And if we explore Mars and have Mars settlements, we “have to” have ocean settlements.
And we could have an ocean settlement before we send crew to Mars surface.
Though this ocean settlement doesn’t have to be connected to launching rockets from the ocean.
Other than governments preventing ocean settlements, due to general nature of governments, we could have had ocean settlements a long time ago.
What I think which needed for ocean settlements is cheap breakwaters.
And government can never do anything cheap, but it’s possible a government could allow cheap breakwaters to be made- just they have so far, allowed cheaper rockets to be made.
So, if we explore Mars, and Mars has mineable water and other stuff
which allow towns on Mars. Government will not be able to stop ocean settlements from being made.
But me being optimistic, before this, one could hopeful some government may allow, may even encourage private efforts to make towns on the ocean.
https://tinyurl.com/2p8646z6
21 July : 119
22 July : 102
23 July : 102
24 July : 84
25 July : 87
I think I hear it singing
Im so lonely . . .
The “battle for coal” will soon begin in Europe. Prices will skyrocket.
China is currently paying $414 per US ton, and in few months highest price was $420.
What price is skyrocket compared to that?
Back in the day when coal was less than $150 per ton and crude oil was less than $80 per barrel and now is about $100 per barrel.
What is a bigger jump $200 to $400 for coal or $50 to $100 per barrel of oil.
It seems difficult to have cheap electrical power when coal is $400 per ton.
Though if paying 40 cent per kwh, it’s not cheap electrical power.
But maybe Europeans can pay 60 to 80 cent per Kwh, but I don’t think Chinese can pay 40 cent per Kwh
La Nina is causing droughts in Europe. Rivers are no longer navigable.
Let’s compare the 4 top temperature series (2 ground, 2 satellite) since 1979
Had5
https://climatedatablog.files.wordpress.com/2022/07/had5-recent.jpeg
GISS
https://climatedatablog.files.wordpress.com/2022/07/giss-recent.jpeg
RSS
https://climatedatablog.files.wordpress.com/2022/07/rss-3.jpeg
UAH
https://climatedatablog.files.wordpress.com/2022/07/uah-global-1.jpeg
So why is it that 1998 is so different in those 4 graphs? UAH has it’s peak as nearly the same as in 2016 and 2020 but the other 3 don’t. Why?
https://en.wikipedia.org/wiki/1997%E2%80%9398_El_Ni%C3%B1o_event
“199798 El Nio event”
UAH has a lower warming trend post 2000 than the other datasets.
That’s why the smaller difference between 1998/2016 el Nino peaks in UAH.
When you read about comparative strength in 1998/2016 el Ninos, that is based on detrended temperature data.
In fact, whenever research is published comparing relative el Nino intensity, that is ALWAYS based on detrended temperature data (and other metrics, like SOI).
Why not?
Oh yes! Let’s really compare them – with regard to one and the same reference period, of course, because all four series have their own one (UAH: 1991-2020, GISS:1951-1980, Had:1961-1990, RSS: 1979-1998):
https://drive.google.com/file/d/1Ni14vZsfKCNoq7u8OAOQQw9A1KMicUao/view
and with 60 month running means looking like… 60 month running means :- )
Running means again I see. Did you learn nothing from before. Others claim that running means are useless for anything other than a amateur, first pass, look at things, but I suppose that describes you pretty well.
https://judithcurry.com/2013/11/22/data-corruption-by-running-mean-smoothers/
Stubborn, opinionated reply again I see, nothing unusual from the stalking liar and trickster Linsley Hood.
I intentionally avoided to add my (original, real) S-G filter’s low pass smoothing, to see what would happen, and… it happened.
As usual too, your four simple-minded, separate charts show exaggerated low pass filtering (with, in addition, your manipulation with an alleged S-G ‘projection’, but allow for zero dot zero meaningful comparison. Useless college boy fancy work.
*
By the way 1, you little trickster: why do you show only the right ends of your ‘S-G’ plots, and stupidly misname them ‘projection’s, what they obviously are not at all?
Why don’t you show the entire plots – of course with the ‘5 year’ low pass as thin as the ‘S-G’, so we can really compare them?
*
By the way 2, I downloaded years ago Goodman’s R3M ICOADS CTRM example: his 12 month CTRM has the same effect as a 16 month running mean as well. Nothing new since then…
“I intentionally avoided to add my (original, real) S-G filters low pass smoothing, to see what would happen, and it happened.”
As I use CTRMs for the bulk of my graphs all you have done is prove that SRM are pathetically poor. As VP said they would be.
“Why do you show only the right ends of your ‘S-G’ plots, and stupidly misname them ‘projection’s”
Ever heard of end effects? If you continue the S-G up to the end of the data, as I do then, it is subject to end effects. This means that the line is not 100% certain and the nearer you get to the end the less certain that it is. That goes for single pass or 5 pass S-G. It all comes down to fitting a 2nd order curve to unknown future data.
To see this in action see
https://en.wikipedia.org/wiki/Savitzky%E2%80%93Golay_filter#/media/File:Lissage_sg3_anim.gif
and look at how the end of the red line changes after the circles.
“As usual too, your four simple-minded, separate charts show exaggerated low pass filtering”
aka CTRM as preferred by Vaughan Pratt.
“his 12 month CTRM has the same effect as a 16 month running mean as well”
So VP was wrong in all his calculations. Nice to know that. /Sarc.
https://www.drroyspencer.com/2022/07/updated-atmospheric-co2-concentration-forecast-through-2050-and-beyond/#comment-1338503
What has reference periods to do with comparisons as such? Of course they are all different which makes a strict number to number comparison ridiculous.
What is interesting is how the various maximums and minimums compare across the whole period. The thermometer series are in general less in range than satellite.
Plus I should point out that the actual difference between RSS and UAH becomes quite clear in the 2002-2008 period. Something that is quite lost if OLS is just taken over the whole datasets.
These are the only reasonable predictions of solar activity.
https://i.ibb.co/NZ0QbM8/295530875-477599434367038-5126776339027231087-n.jpg
The La Nia pattern is well established in North America.
https://i.ibb.co/25FjFKq/gfs-nh-sat1-t2anom-1-day.png
First the Φ -Factor!
in order to have the Planet RADIATIVE BALANCE calculated precisely!
Second the Planet Rotational Warming Phenomenon
in order to have the Planet Mean Surface Temperature NEW Equation completed!
Not one, but two issues should be seen differently that is why the WHOLE ISSUE is not obvious at first glance,
and it cannot wait, and it is not some difficult things, people have decoded DNA, people have invented INTERNET, the Planet Rotational Warming Phenomenon is not difficult at all, just FOCUS.
It is not a Revolution in Physics, it is just the CORRECT PHYSICS!
https://www.cristos-vournas.com
” It is not a Revolution in Physics, it is just the CORRECT PHYSICS! ”
Why then don’t you publish it in some official science journal?
Bindidon, the Planet Rotational Warming Phenomenon is not difficult at all, just FOCUS.
https://www.cristos-vournas.com
Publish as suggested by Bindidon. And quit flogging your version of ‘science’ on us until it has had some sort of quality assurance.
Ken, publish it in some official science journal?
https://www.cristos-vournas.com
Vournas, don’t try to dodge again, you’ve done it enough times already.
The problem is not that we wouldn’t understand what you write: the problem is that we can’t verify if it is correct.
Thus I repeat:
Why then dont you (try to) publish your stuff in some official science journal, and come back with the result of their review?
Bindidon
“The problem is not that we wouldnt understand what you write: the problem is that we cant verify if it is correct.”
You do not FOCUS enough, that is the problem!
https://www.cristos-vournas.com
christos…”You do not FOCUS enough, that is the problem!”
***
The real problem is that Binny cannot think for himself. He constantly appeals to authority, even when the authority is obviously wrong.
So far Vournas hasn’t convinced me (or anyone else) that he is right.
Nothing to do with appeal to authority; its that there are no indications that quality assurance has been done to which Vournas can point.
ken…you mean there’s quality assurance on any of the stuff posted here? The argument presented by Christos is sound mathematically and intuitively.
Again, the trickster Linsley Hood tries to kid us.
1. ” What has reference periods to do with comparisons as such? Of course they are all different which makes a strict number to number comparison ridiculous. ”
Aha. Thus, comparing two times series wrt the same reference period is useless, or what does genius Linsley Hood think?
Here is a correct comparison of UAH’s and RSS’s global time series:
https://drive.google.com/file/d/1p38CfnhJVwcNMfAuNXM5ey-GXRKstrci/view
A comparison which of course isn’t based on OLS but on original Savitzy-Golay low pass runs (i.e., not the result of any subsequent, multipass filtering).
*
It seems that the genius still did not grasp that departures from the very same mean are very well useful for comparison.
And his (resp. Greg Goodman’s) repeated denigrating of running means looks even more ridiculous when we compare, in the chart above, the thin running means perfectly meandering around the thick Savitzy-Golay outputs.
**
2. ” Plus I should point out that the actual difference between RSS and UAH becomes quite clear in the 2002-2008 period. Something that is quite lost if OLS is just taken over the whole datasets. ”
When we look at the chart above, we see that the difference between RSS and UAH has not anything to do with what happened in 2002-2008.
The difference encompasses the entire record.
But like Robertson, who endlessly repeats his Putin, virus, Einstein, Moon spin and other nonsense despite being repeatedly corrected, Linsley Hood will endlessly stay opinionated on his strange, tricky manipulation, the probably dumbest WFT crackpottery I have ever seen:
https://www.woodfortrees.org/plot/rss/to:2002/offset:-0.23/plot/rss/from:2008/offset:-0.41/plot/uah6
So what!
*
A technical, secondary point has nevertheless amazed me: the fact that the Swedish Savitzy-Golay tool I use, shows such a precision that its 60 month window outputs for RSS and UAH cross exactly at the same point as do the time series themselves, namely in January 2004.
Well done, Mr Jonsson!
Still fails to address the differences between RSS and USA between 2002 and 2008 (the major difference in those 2) and why 1998 is so different between UAH and the other 3.
P.S. VP recommended CTRMs (which is what I mostly use). Why does Blinny not try and refute that instead of complaining about me using them?
….RSS and UAH….
P.P.S. https://www.woodfortrees.org/plot/rss/to:2002/offset:-0.23/plot/rss/from:2008/offset:-0.41/plot/uah6
Shows that RSS is very close to UAH after 2008 and before 2002, not that I expect Blinny to recognize that.
RLH, Here’s a different analysis of that data. Is there a bias in one of the 2 data sets and which one has it?
RSS Global
https://climatedatablog.files.wordpress.com/2022/07/rss-3.jpeg
UAH Global
https://climatedatablog.files.wordpress.com/2022/07/uah-global-1.jpeg
You tell me which one is wrong and why.
P.S. Please also tell why me 1998 is so different in the 2 sets.
RLH, Lest you have forgotten, RSS excludes data poleward of 70S, Greenland and other regions with high elevations. UAH uses an algorithm which combines data from three sensor channels, while RSS uses only the MSU ch2/ AMSU ch5. But, that does not address my question regarding a bias in one of the series. I found one in the UAH data, remember?
I know that the coverage areas are different are different and that does explain some of the differences. But do I think it is pure coincidence that during the period where the 2 differ, 2002 to 2008, is the same as when RSS and UAH are using different satellites as Roy has previously documented? No.
That also does not explain why 1998 is so different in the 2 sets. UAH shows it to be nearly the same as 2016. RSS does not.
RLH, Your comments don’t answer my comment regarding a bias in either time series. Of course, there’s also the NOAA STAR data analysis, which you have so far ignored. In addition, it appears that the 1996 El Nino is stronger than the 2016 event in the UAH data, as I see it.
What effects do you think that “multipass filtering” has on the data?
What a dumb, ignorant question!
Why don’t you finally start doing the correct job like I did
https://drive.google.com/file/d/1p38CfnhJVwcNMfAuNXM5ey-GXRKstrci/view
by
– displacing the RSS anomalies with RSS’s 1991-2020 average
and
– showing, IN ONE CHART PLEASE, the two time series together with your multipass filtering on them and the filtering output differences, like here:
https://drive.google.com/file/d/1zUov34Ag15anjLngigFBBEgvf5lcT5rO/view
From 2002 till 2008, the differences between the 60 month SG outputs for RSS resp. UAH are lower than anywhere else in the two series.
*
Why is that so difficult to you?
Maybe you then discover the blind-alley into which you ran when telling us about alleged differences between RSS and UAH from 2002 till 2008, and finally understand what E. Swanson explained.
What a dumb, ignorant question!
For which you do not have an answer.
Why does RSS between 2002 and 2008 show such a difference to UAH over the same period? Could it be that they are including different satellites?
https://imgur.com/JX5lHgw
RSS Global
https://climatedatablog.files.wordpress.com/2022/07/rss-3.jpeg
UAH Global
https://climatedatablog.files.wordpress.com/2022/07/uah-global-1.jpeg
You tell me which one is ‘wrong’ and why.
So Blinny yet again says that CTRMs are bad but won’t admit that Vaughan Pratt said otherwise and that they were MUCH better than Simple Running Means.
So the stalking, lying trickster and crackpot Linsley Hood again and again lies and lies.
For the umpteenth time: I never said that CTRMs are bad nor wrong nor anything else negative.
I said AND say that at 12 month CTRM has the same effect on data not only as a 16 month running means, but also as an ORIGINAL 16 month Savitzky-Golay, and that anybody posting a chart mentioning ’12 month low pass’ intentionally misrepresents the reality.
Not CTRMs, let alone Vaughan Pratt, are here a problem, but people like Greg Goodman and Linsley Hood who misuse what he did.
But Linsley Hood will continue and continue and continue to lie.
Should read
” … and that anybody using something like CTRM or equivalent, posting a chart mentioning 12 month low pass intentionally misrepresents the reality.
“For the umpteenth time: I never said that CTRMs are bad nor wrong nor anything else negative.”
So all my graphs which predominately use CTRMs are correct then.
12 month low pass and 15 year low pass ARE CTRMs. Only the parts labeled S-G projections are S-G (and they are projections as I set out previously).
You are the liar and mis-representer, not me.
Some are 5 year CTRMs also.
e.g.
https://climatedatablog.files.wordpress.com/2022/07/uah-global-1.jpeg
and
https://climatedatablog.files.wordpress.com/2022/07/rss-3.jpeg
Open them both up in separate tabs and flip between them. Then you will see quite clearly the differences between them.
For the stubborn, over-opinionated trickster, I repeat:
” I said AND say that at 12 month CTRM has the same effect on data not only as a 16 month running means, but also as an ORIGINAL 16 month Savitzky-Golay, and that anybody using something like CTRM or equivalent, posting a chart mentioning 12 month low pass intentionally misrepresents the reality. ”
Your use of CTRM is correct, you genial college boy!
What is incorrect and a lie, is
– how you misuse its results;
– how you kid us with alleged S-G outputs which are BY NO MEANS generated by an original, single pass S-G filter.
And I have said, and can prove, a CTRM and a 5 pass S-G with the same window size have nearly identical outputs, the difference between which can be attributed to integer nearest rather than floating point usage in the various algorithms.
A 5 pass, multi-pass S-G is like using a higher order Butterworth, does not alter the corner frequency only the rate of roll off.
VP said, and I have no reason to doubt him, that a 12, 10, 8 month CTRM is the same as a Gaussian 12 month filter (or better) and that is what I use.
You however do not understand anything of what VP said or the fact that I use what he said precisely.
12 month low pass and 5/15 year low pass ARE CTRMs.
“how you kid us with alleged S-G outputs which are BY NO MEANS generated by an original, single pass S-G filter”
Nothing alleged about it. Those are results I plot from a 5 pass multi-pass S-G of the stated window size.
Blinny is the problem as others can see quite clearly. The longer he deliberately mis-represents what is occurring, the more foolish he looks.
Others?
Hmmmmh.
Ask VP if you doubt me.
See how TSI has grown since 1882. Can you see the reason for the gradual rise in global temperature?
https://i.ibb.co/7YY8tRY/Screenshot-1.png
Can you see it?
https://drive.google.com/file/d/1OxT8789_CGmfj_vH1luTkmaQWjSF4Rmh/view
Source for the TSI reconstruction (based of course on the SSN)
https://spot.colorado.edu/~koppg/TSI/Historical_TSI_Reconstruction.txt
It is not the number of spots that determines solar activity, but the sun’s magnetic activity. The methods of counting spots are constantly changing and counting little active spots does not give anything.
http://wso.stanford.edu/gifs/Polar.gif
We are approaching TSI levels from the early 20th century.
The solar magnetic field shows that cycle 25 promised to be quite strong, but it is now apparent that it may be quite short.
“What a dumb, ignorant question!”
For which you do not have an answer.
Why does RSS between 2002 and 2008 show such a difference to UAH over the same period? Could it be that they are including different satellites?
https://imgur.com/JX5lHgw
Oh how interesting!
Suddenly, OLS trends become useful and correct again, after having been discredited so many times.
Forgotten is the proud, teachy
” Linear fits (OLS etc.) are always suspect IMHO.
Not only are they subject to potential cherry picking of start/end dates (possibly inadvertently) but also they take no account of how the maximums and minimums change over that time. That may also be relevant. ”
*
But apart from that funny moment, I strongly recommend you to compute, in a spreadsheet, all consecutive trends for different periods (5 years, 7 years, 10 years or so) of the UAH and the RSS time series, and to look at their differences.
Maybe you understand that you are, like so many others, victim of an artifact.
“Suddenly, OLS trends become useful and correct again, after having been discredited so many times.”
OLS trends are useful for comparing that HAS happened. They are useless for predicting that WILL happen.
If you think that that period between 2002 and 2008 is something that happens ‘all the time’ perhaps you will explain how come
https://climatedatablog.files.wordpress.com/2022/07/rss-3.jpeg
and
https://climatedatablog.files.wordpress.com/2022/07/uah-global-1.jpeg
differ so obviously in that period.
If you can only work with both images at the same time in the same window try
https://imgur.com/a/Y96Ph5O
Please note the thick traces (blue and green) are CTRMs of 12 month and 5 year periods. The thin traces at the end are a 5 pass, multi-pass 5 year S-G.
The next lie:
” OLS trends are useful for comparing that HAS happened. They are useless for predicting that WILL happen. ”
No, Linsley Hood, I won’t let you taking such a convenient exit.
You ARE discrediting ALL uses of OLS, not only those used for predictions.
Go back in all Spencer threads within the last 12 months, and collect ALL your posts concerning your OLS attitudes.
*
“If you can only work with both images at the same time in the same window try… ”
But… who asks here for an overlay of two charts containing anomalies wrt completely different reference periods?
This is completely useless!
Manifestly, you are absolutely unable to generate a chart out of a spreadsheet containing different time series.
Now you are becoming completely ridiculous.
*
Linsley Hood, learn how anomalies really work, learn how to use spreadsheets correctly, and come back when you are finally able to generate this:
https://drive.google.com/file/d/1zUov34Ag15anjLngigFBBEgvf5lcT5rO/view
with your multipass filters instead.
*
Now I begin to understand why, after one year, you still are unable to generate a subhourly data based alternative to this chart comparing middle, median and mean series out of USCRN station data:
https://drive.google.com/file/d/15gED_1O6F5g5vvCulg71D3APZw9Nl9Ky/view
and prove my hourly data is wrong.
It’s simply because you can’t even create a chart out of several time series, let alone would you be able to generate latitude weighted monthly anomalies out of any station or grid data.
*
I know: you will endlessly continue to stalk me. You will never stop that, and nobody on this blog will stop you.
“You ARE discrediting ALL uses of OLS, not only those used for predictions”
I have always made clear what OLS is useful for and what it is not. Others like you want to show what will happen in the future by referring to OLS.
“This is completely useless!”
But shows quite clearly when the 2 series diverge.
It was a quick paint response to you being unable to see what was in front of your face in 2 separate graphs. Do you think that making the code display both on the same image will be any different?
“learn how anomalies really work”
Now you are being your usual arrogant self. I know very well how anomalies are created and used thank you.
“learn how to use spreadsheets correctly”
I learned about spreadsheets when Visicalc and Muliplan first came out, unlike you it seems.
If you want the same in woodfortrees.org try
https://imgur.com/8IsfLYw
because you don’t trust my paint.net skills.
Go to Moyhu’s Latest Temperatures section. You will find a graph of the usual monthly temperature datasets plotted on a common baseline.
RSS tends to follow the surface datasets. UAH is usually the lowest, sometimes several tenths below the others.
Your graph confirms my previous opinion that UAH is underreading.
RSS is deliberately constructed to follow the surface datasets by using incorrect or known bad sat6ellites between 2002 (2000 if you wish) and 2008 (see Roy for the detailed explanation).
No-one has answered why 1998 is so low in everything other than UAH. At the time is was hailed as one of the biggest El Nino in history, now it languishes well down the pecking order, well below 2016 (which in itself is only the same as 1878).
RSS over the period since 2008 to go with the one above in the earlier part before 2002.
https://www.woodfortrees.org/plot/uah6/mean:12/mean:10/mean:8/plot/rss/mean:12/mean:10/mean:8/offset:-0.45
The problem with comparing the 2 series. RSS and UAH, over their whole time period is that the ‘error’ is not present in the later part or the later part, only in the center.
….in the earlier part or the later part….
No-one has answered why 1998 is so low in everything other than UAH. At the time is was hailed as one of the biggest El Nino in history, now it languishes well down the pecking order, well below 2016 (which in itself is only the same as 1878).
You’ve repeatedly referenced a study that says 1998 is also ‘statistically indistinguishable’ from 1878 as part of your fixation with the 1878 and 2016 El Nino events. The statistical argument is largely down to the error estimation for the older part of the record.
1998 is visually lower than 2016 in most of the time series because of the stronger underlying trend versus UAH. The trend relative magnitudes are similar. Also, the magnitude of El Nino events is higher in the satellite measurements because they’re measuring something different than the surface datasets.
“The statistical argument is largely down to the error estimation for the older part of the record.”
Except that L’Heureux has herself co-published a paper that says the exact opposite. 1878 is statistically similar to 2016.
“Also, the magnitude of El Nino events is higher in the satellite measurements because they’re measuring something different than the surface datasets”
You might be on stronger grounds if you claim that looking from outside the PBL/SBL inwards is different to looking outwards from inside the PBL/SBL. Both estimate the overall outcome from different perspectives.
“Youve repeatedly referenced a study that says 1998 is also statistically indistinguishable from 1878 as part of your fixation with the 1878 and 2016 El Nino events”
But GISS, Had5 and RSS say that 1998 is insignificant compared to 2016/1878.
And GISS and Had5 say that 1878 is insignificant compared to 2016.
You seem to be confusing two different metrics.
The ‘How Significant Was the 1877/78 El Nio?‘ paper compares Nino indices and finds no significant difference between 1877/78 and each of the 1982/83, 1997/98, and 2015/16 El Nino events by that metric. From the paper’s abstract, ‘Based on the estimated uncertainties, the differences among the strength of these four major El Nio events are not statistically significant.’
Now you’re comparing the magnitude of these events using global temperature metrics rather than Nino regional metrics. The global temperature metrics each have significant trends which will reduce the global average peak of earlier El Nino events. The UAH trend is lower, so it will reduce those events by less than the other time series.
And the non trended absolute Nino 3.4 data backs up that observation.
https://climatedatablog.files.wordpress.com/2022/07/nino34-absolute.jpeg
“Now youre comparing the magnitude of these events using global temperature metrics rather than Nino regional metrics.”
Nino 3.4 data is regional data agreed. But 1878 was felt all over the world with many, many papers saying that was the case world wide.
So are you saying that 1998 was similar to 2016 or not? UAH says that it was.
https://www.newscientist.com/article/2183901-a-freak-1870s-climate-event-caused-drought-across-three-continents/
“A freak 1870s climate event caused drought across three continents”
RLH says: So are you saying that 1998 was similar to 2016 or not? UAH says that it was.
I’m saying there are different metrics and fixating on one to the exclusion of others is a sub-optimal path to understanding the natural world and the limitations to that understanding.
If, on the other hand one is looking to start a food fight, one’s optimum strategy might be different.
“I’m saying there are different metrics and fixating on one to the exclusion of others is a sub-optimal path to understanding the natural world and the limitations to that understanding.”
Do you agree that there are multiple papers that say that 1878 was felt world wide, not just in the central Pacific, and that the El Nino affected world wide temperatures?
Although GISS and Had5 do not represent that fact.
GISS and Had5 also show that 1998 was considerably different to 2016 even though there are a lot of papers that say quite different.
RLH says: Do you agree that there are multiple papers that say that 1878 was felt world wide, not just in the central Pacific, and that the El Nino affected world wide temperatures?
Although GISS and Had5 do not represent that fact.
Relative to the time period the 1878/79 El Nino global temperature had perhaps it’s largest warm spike according to the Had global series. The GISS time series doesn’t go back that far.
No one disagrees that 1878 was an unusually large El Nino event with broad impacts. That doesn’t change the fact that Had also says the 1998 event occurred on a warmer planet and the 2016 event on an even warmer planet.
As Had5 does not record the 1878 event as being similar to 2016 in the global series even though other papers referring to the event say it was important world wide then I do not believe that Had is as accurate as you think it is.
GISS and Had track quite well back to 1880 so I rather suspect that it is not that accurate either.
Both do not show the 1998 event to be similar world wide to the 2016/1878 events even though other papers do.
mark b…”RLH says: So are you saying that 1998 was similar to 2016 or not? UAH says that it was.
[Mark]Im saying there are different metrics and fixating on one to the exclusion of others is a sub-optimal path to understanding the natural world and the limitations to that understanding.
***
Mark, I’ve heard so pretty good bafflebag in my life but yours rates right up there.
“Others like you want to show what will happen in the future by referring to OLS.”
That IS a lie, RLH. No one here has done that in any of the threads that I have seen.
The only person talking about this notion is you.
There is very little warming in the NINO3.4 region since 1870 (especially in the Had data set), while there is significant warming in the global temperature record, regardless of dataset used.
Therefore, the very strong 1878 el Nino will have a similar amplitude to 2016 if you use only the NINO3.4 data, especially the Had data set, but the 2016 will have a higher amplitude in the global dataset because of the underlying warming globally.
These results do not contradict because they are based on different metrics.
And that’s before we talk about l’Heureux’s paper, which uses a detrended NINO3.4 dataset to compare el Ninos.
Remember, RLH: if you think the Had.CRU global temperature record is suspect, then you must also find HadISST suspect, as it is a subset of the Had.CRU dataset, including the adjustments, made by the same people.
And if you think detrending is illegitimate, then you must reject l’Heureux’s paper, which relies on detrended data (ONI).
“there is significant warming in the global temperature record”
Which does not show that 1878 was a global phenomena even though there are numerous papers that show it affected things world wide.
The ‘global temperature record’ does not even show that 1998 was ‘significant’, at least as far as RSS, GISS and Had5 go.
“if you think detrending is illegitimate, then you must reject lHeureuxs paper, which relies on detrended data (ONI)”
Why? The Nino 3.4 non-trended data set (which is the only way you can truly compare things over very long periods without first removing the difference in trends over that time) supports her argument. You really don’t understand how trending works do you?
Look at the artificial regularity in
https://climatedatablog.files.wordpress.com/2022/06/ens-oni.jpeg
compared to the fully natural
https://climatedatablog.files.wordpress.com/2022/07/nino34-absolute.jpeg
“No one here has done that in any of the threads that I have seen”
OLS trends (often stated as n degrees per decade with implications that it will continue unchanged far into the future) are often used in many threads, so you are demonstrably incorrect in that.
“OLS trends (often stated as n degrees per decade with implications that it will continue unchanged far into the future) are often used in many threads”
You will not find that notion put forward by any of the regulars here.
Your claim, yours to corroborate.
“there is significant warming in the global temperature record”
“Which does not show that 1878 was a global phenomena”
It certainly does. The 1878 spike in global temperatures is quite extreme compared to surrounding years. That spike is not exceeded for another 50 years, so, yes, that event shows up very clearly in the global temperature record. You can see it here.
https://tinyurl.com/mr3hcnx7
Global temperatures were about 0.8C warmer in the 2010s than they were in the 1870s. The 2016 el Nino has a taller spike in the global record simply because of this change in background temperatures.
It’s like having a day in Winter that is 10C warmer than the average for Winter, and then comparing it with a day in Summer 10C warmer than the average for Summer. Both departures are 10C, equal in the departure from normal, but the background state is different, so the absolute temperature on those days will be different because they occur in different climate regimes.
Because the NINO3.4 region has barely warmed in the same period, if at all, the el Nino spikes are little different in THAT record.
Do you understand?
“The 1878 spike in global temperatures is quite extreme compared to surrounding years.”
But 1878 is not the same in global temperatures as 2016 even though many papers says the results were global in nature.
Likewise 1998 is nowhere near the same as 2016 except in UAH.
Often stated as n degrees per decade with implications that it will continue unchanged far into the future.
You have many times claimed that AWG will continue rising unabated into the future have you not? At n degrees per decade.
….AGW….
“But 1878 is not the same in global temperatures as 2016 even though many papers says the results were global in nature.”
Of course it’s not the same in global temperatures. That’s because global temperatures are 0.8C warmer in the 2010s than they are in the 1870s. So 2 el Ninos of equal strength will have 0.8C difference in their peaks simply because the background temperature has changed.
A day 10C above average in Winter won’t be as warm as a day 10C above average in Summer. Because these events occur in a different climate state, even though they both have the same departure from normal.
“You have many times claimed that AWG will continue rising unabated into the future have you not? At n degrees per decade.”
I have NEVER said that temperatures will rise in the future at N degrees per decade.
Your memory is atrocious.
I have repeatedly said that my expectation of future global warming is based on physics, not on past statistics and trend lines, and I have NEVER extrapolated a current trend line into the future and claimed that this is going to be the rate of warming.
I’ve been debating this stuff since 2007, and have NEVER proposed such a stupid thing.
I challenge you to find one post from the regulars here that does such a thing, RLH. You have simply come to this board with that idea in your head, and projected it when no one does this. And you have continued to project this idea when I and others have told you differently.
What is wrong with you?
“too many people settle for a simple running mean, whose frequency response you would not wish on your worst enemy because of the nasty side lobes.
The frequency response starts to look more reasonable as you cascade filters because the side lobes die down.
There are no side lobes with a perfect Gaussian filter, though there are very tiny ones with any finite-impulse-response (FIR) approximation to one. For a low-pass filter you could do a lot worse than a Gaussian filter.”
Vaughan Pratt
http://clim.stanford.edu/RLHF3.jpg
12, 10, 8 (or 8, 10, 12) CTRM is definitely the preferred option.
Simply look at the horrible difference between
– a simple running mean
and
– the output of a Savitzky-Golay filter in the same window:
https://drive.google.com/file/d/1p38CfnhJVwcNMfAuNXM5ey-GXRKstrci/view
My guess is that, after having elevated Savitzy-Golay up to heaven some months ago, but having had to discover in between that this low pass technique does not differ enough from simple running means, you have started ignoring it, and decided that from now on, only CTRMs and multipass S-G are worth considering.
As VP and I discussed, a CTRM compared to a SRM is a no-brainer (see above). We did not discuss S-G.
5 pass, multi-pass S-G is what I have been using from 2014 when Nate recommended it. As I said before I used it I verified it compared well to a CTRM of the same window size.
No doubt Blinny will continue to ignore this fact having argued himself into a corner.
Blinny is dumb enough to believe that Simple Running Means and single pass S-G are what should be used by everybody when Vaughan and Nate say that CRTM and 5 pass, multi-pass S-G are what we should use instead. But what do they know? Right?
brandon gates…”[anon]> The higher energy photons from C may be absorbed by H
[BG]The energy of a photon depends solely on its frequency. As I have shown you before, the emission spectra of two bodies close but not equal to each other in temperature all but completely overlap:
https://imgur.com/gallery/kKHVJVl
Given the overlap, how can H know that C is cooler on the basis of the frequency of incident photons from C alone?”
***
In the first part of your response you refer to the energy of a photon being dependent on its frequency. The equation may say that, as in E = hf, but we must be aware of the origins of E and f and why they are related as such.
The relationship is due to an electron transitioning from a higher orbital energy level to a lower orbital energy level. The E in E = hf comes from the difference in electron volts between those energy levels and the freguency comes from the angular frequency of the electron.
It’s obvious that the difference in electron volts between energy levels will depend not only on the atom to which the electron belongs but also to the temperature of the mass in which the atom resides. In order to reverse that transition those properties and conditions must be taken into account.
In a cooler object, E = Eu – El which is the difference between the upper and lower energy levels, is obviously lower than in a hotter body. That means the frequency will be lower as well, since the electrons in the atoms of the cooler body won’t be orbiting as quickly.
Ergo, when that cooler body’s electrons emit EM, they will have an E to f relationship that is inadequate for absorp-tion by electrons in a hotter body. The corresponds to the claims of the 2nd law.
Planck’s curve has nothing to do with this since his curve represents the probability of tiny oscillators (frequencies) of EM having the shape of his curve. When we talk about an electron emitting a quantum of EM, we are talking about a single frequency, not a spectrum of frequencies.
Quantum theory cannot be visualized using graphs because there is no complete theory covering bazzillions of electrons in atoms of a body emitting single-frequency quanta of EM. No one knows how that is converted to a wave front or whether photons exist at all.
Remember, the photon is an invention to particalize EM. A photon is a definition, a quantum of EM with momentum but no mass.
Gordon,
WTF are you talking about?
Anyway, whatever it is, has no relation to modern physics.
You should get a physics textbook and start over.
bob d …”WTF are you talking about?”
***
We are talking about Bohr’s theory, Schrodinger’s wave equation, and all related theories in quantum physics. Since you are just a janitor at a nuclear facility, I would not expect you to understand.
Gordon,
Maybe you could explain with a reference showing how the related theories of Quantum Physics support your bullshit.
And since I have a degree in Chemistry, which requires study of Quantum Mechanics, and that allows me to call bullshit on your bullshit.
Let’s take a look at this
“When we talk about an electron emitting a quantum of EM, we are talking about a single frequency, not a spectrum of frequencies.”
Lyman, Balmer, Paschen, Brackett, Pfund, and Humphreys all say you are wrong, the single electron in a hydrogen atom emits a series of frequencies. Depending on the energy level from and to.
I though you were familiar with the Bohr theory!!!!!!!!!!!
And the Nuclear Power Plant I worked at didn’t have janitors, they had Utility Men, just another thing you know nothing about.
bobdroege, please stop trolling.
> we are talking about a single frequency, not a spectrum of frequencies
We need to talk about both, Gordon. The Planck curve of the emitting object tells us what photons to expect at the intercepting object, and the curve of the intercepting object tells us the probability an incident photon will be absorbed or rejected.
The key point remains that the probability the intercepting object absorbs a photon is solely determined by its own emissivity at that specific wavelength. Period. It has nothing to do with the relative temperature of the emitting object; photons don’t carry that information.
Brando, a photon does NOT have an emissivity. “Emissivity” refers to a surface.
Wikipedia provides a poor foundation in physics, just ask Norman….
> a photon does NOT have an emissivity
Congratulations, Clint, that’s the first correct thing you’ve written in some time now.
No, but it’s the first thing you’ve understood.
Don’t confuse disagreeing with not understanding, Clint. You’re confused enough already.
Brandon, please stop trolling.
brandon…”The key point remains that the probability the intercepting object absorbs a photon is solely determined by its own emissivity at that specific wavelength”.
***
Hardly. If you speak of a photon you must reference it to an individual electron on an atom of the receiving surface. It is electrons that do the receiving and transmitting, there are no magical properties in a surface related to emissivity that governs whether a photon with be absorbed or not.
If the energy state of of an electron and it’s angular frequency don’t match the photon’s energy or frequency, the photon will not be absorbed. That’s basic quantum theory. That theory supports the 2nd law since it prohibits EM from colder bodies being absorbed by warmer bodies.
Gordon,
Do you have a reference that supports this?
“If the energy state of of an electron and its angular frequency dont match the photons energy or frequency, the photon will not be absorbed.”
Or can we just call it made up?
> there are no magical properties in a surface related to emissivity that governs whether a photon with be absorbed or not
Correct, there are actual properties of that surface which determine it, Gordon. Those properties result in what is called absorpbtivity (which equals emissivity at thermodynamic equilibrium, see Kirchhoff), and it has nothing to do with the temperature of the emitting object.
The upshot of all of this is that hot bodies can and do absorb photons emitted by cooler ones.
Brandon, H absorbing some photons from a C does NOT result in increasing the H’s temperature.
See if this simple analogy helps:
H is emitting 7 energy level photons — 1,2,3,4,5,6,7, with 7 being the highest level. The average energy level, corresponding to a temperature, is 4.
C is emitting 5 energy levels photons — 1,2,3,4,5, with 5 being the highest level. The average energy level, corresponding to a temperature, is 3.
H is hotter than C, as 4 has more energy than 3.
Now what is the temperature of H if it absorbs the entire flux from C?
The answer is 4. The lower energy photons do NOT raise the average energy level.
Cold can NOT raise the temperature of Hot. That’s why ice cubes can NOT boil water.
Does that help?
> H absorbing some photons from a C does NOT result in increasing the Hs temperature.
I’m so glad you’re here to tell me these things, Clint.
No it doesn’t help.
“Cold can NOT raise the temperature of Hot. Thats why ice cubes can NOT boil water.
Does that help?”
Because it’s made up.
Find a decent textbook and educate your ass.
I know, that’s work, something you are not accustomed to.
Braindead bob, you’re always accusing others of not understanding physics, yet you have not been able to answer even one of the simple problems I have presented.
If you were mature and responsible, that should tell you something….
> yet you have not been able to answer even one of the simple problems I have presented
What’s the wavelength of a level 4 photon, Clint. I have asked several times now.
A “level 4 photon” comes from the simple analogy above. The simple analogy explains why “cold” can NOT raise the temperature of “hot”.
So a “level 4 photon” would have level 4 photon energy, wavelength, and frequency. You could put in numbers, but then it would only complicate the simple analogy.
When I’m explaining to people with no science background, I like to keep things as simple as possible.
(BTW, your 3-minute response time was great stalking. No one likes a slacker stalker.)
Clint R,
“Braindead bob, youre always accusing others of not understanding physics, yet you have not been able to answer even one of the simple problems I have presented.”
That’s because you can’t get the correct answer to all your “simple problems.”
They are bullshit questions, in my best Maria Tomei voice.
You don’t understand the physics, that’s why you claim bullshit like cold can’t warm hot and the bullshit about ice cubes.
When it has been experimentally verifies that cold can warm hot and ice cubes can cause water to boil.
You are just a fucking moron, that’s all I got.
> You could put in numbers, but then it would only complicate the simple analogy.
This plot uses real numbers, Clint:
https://imgur.com/gallery/kKHVJVl
What do you find too complex about it?
Life is so frustrating when you reject reality, huh bob?
Brandon, my browser doesn’t get along with imgur, so you’ll have to conjure up some other lame, distracting question.
Pure gold, Clint. I’m guessing the dog ate a lot of your homework too.
Keep conjuring, Brando.
Also, your response time is slipping. Step it up.
Go argue with Planck, Clint, Figure 1.15:
https://ahtt.mit.edu/wp-content/uploads/2019/08/AHTTv500.pdf
Clint R,
Who said this?
“So, yes, a cooler body can make a warm body even warmer stillas evidenced by putting your clothes on.”
Maybe you should argue with him, although he is a lot smarter than you.
Clint runs around outside naked in the winter, Bob:
https://www.drroyspencer.com/2022/07/uah-global-temperature-update-for-june-2022-0-06-deg-c/#comment-1335615
I couldn’t make this up.
No argument with Planck, Brando.
What did you not understand about Fig. 1-15?
Troll Brando goes on to make a fool of himself: “I couldn’t make this up.”
You couldn’t understand it either, Brando. Clothes are NOT warming a person. It is the person’s body heat that provides the heating. If you put clothes on a dead body, the clothes will NOT warm it. The heat transfer is from a person’s body to the clothes. The clothes act as insulation.
You don’t understand any of this.
> Clothes are NOT warming a person.
Yet your body warms up when you put them on, Clint.
Something else has a heat source too, and a barrier to energy loss which causes it to be warmer than it would be otherwise.
Bet you can’t guess what.
Clint R,
Mz Reality says you got the answers to your own questions wrong.
She is laughing at you.
Brando, you’ve tried level 4 photons, Fig 1-15, and clothes.
What will you try next?
> What will you try next?
I might try pointing out that there’s something seriously wrong with you comparing a dead body to the planet, Clint, but that was already obvious.
But I didn’t compare a dead body to the planet, Brando. That’s a false accusation. Which means it’s time to end this session of babysitting you.
> I didnt compare a dead body to the planet
Of course not, Clint. Why else to bring it up in a thread about greenhouse gasses.
Brandon, please stop trolling.
I was wondering if you can magnified Coronal loops of the sun:
The giant coronal loops are filled with gas particles heated to 3.5 million degrees Fahrenheit — a temperature hot enough to emit high-energy X-rays, which are invisible to the human eye.”
And could you get say 1/2 million degrees?
Or is it just low density plasma.
Roughly, like a big fluorescent bulb.
The discussion is circling the drain again.
Meanwhile our economies are being shut down because of Nitrous Oxide emissions.
Nothing to do with nitrous, it’s abut brain-dead politicians who are butt-kissing liars like the IPCC.
Ken says:
July 26, 2022 at 6:15 PM
“So far Vournas hasnt convinced me (or anyone else) that he is right.
Nothing to do with appeal to authority; its that there are no indications that quality assurance has been done to which Vournas can point.”
“(or anyone else)” ??? You cannot claim that!
Now, a simplest question to Ken:
As we know Moon orbits sun at the same distance from the sun.
Moon’s Albedo is a=0,11 whereas Earth’s Albedo is a=0,306
Thus Moon “absorbs” 28% MORE THAN EARTH solar energy.
Moon’s effective temperature Te = 270,4K
Moon’s measured mean surface temperature Tsat = 220K
Let’s Ken explain what PHENOMENON makes Moon’s mean surface temperature (Tsat=220K) to appear 50,4C lower than Moon’s effective temperature (Τε=270,4Κ) ???
Ken, there are no ways getting around it…
The PLANET ROTATIONAL WARMING PHENOMENON explains all the satellite measured planets and moons mean surface temperatures.
Bindidon, it is the same question for you too.
Please, explain, why Earth’s surface is on average 68C warmer than Moon’s?
And, don’t you know Earth receives 28% less solar energy than Moon?
So why? Why you go around of THAT HUGE discrepancy in your way of thinking?
Bindidon:
“The problem is not that we wouldnt understand what you write: the problem is that we cant verify if it is correct.”
Why can’t you?
https://www.cristos-vournas.com
christos…”The PLANET ROTATIONAL WARMING PHENOMENON explains all the satellite measured planets and moons mean surface temperatures”.
***
I agree, Christos, it’s obvious.
Thank you, Gordon!
https://www.cristos-vournas.com
It seems if Earth’s day was 1 month long, Earth would be colder.
And if Earth day was 12 hours rather 24 hours, Earth would be warmer.
[And solar power would work better.]
But the Moon does not absorb much energy.
Most of Earth is covered by a transparent ocean and about 1/2 of energy of sunlight directly warm 1 meter below the ocean surface.
Whereas very little of heat of sunlight warms as deep as one meter below the lunar surface.
The lunar surface is covered with fluffy dust which is very good insulation.
Sand on Earth is not as good of insulation as lunar dust is, but sunlight doesn’t sand much below 8″ of below surface.
If you simply step on the lunar dust, it will absorb more sunlight.
If covered the lunar surface with 1 meter of transparent glass, the the lunar surface would absorb more energy from the sun.
But ocean water is better than glass, 1 meter of water has twice heat capacity as 1 meter of glass.
But say put 1 meter of glass over 10 meters of water, that should absorb a lot energy from sunlight. But water does not conduct heat well, mixing the water a bit, would make it absorb more energy.
And on Earth, you have waves doing this.
gbaikie says:
“It seems if Earths day was 1 month long, Earth would be colder.
And if Earth day was 12 hours rather 24 hours, Earth would be warmer.
[And solar power would work better.]
But the Moon does not absorb much energy.”
It is the planet (N*cp) product in sixteenth root that matters.
For Earth (N*cp) = 1
For Moon (N*cp) = (1\29,5)*0,19 = 0,00664 = 1\155,6
If Moon had (N*cp) = 1 Moon would had been warmer than Earth, because of the Moon’s lower than Earth’s Albedo.
If Moon rotated 155,26 times faster, 155,6\24h = 6,47 rotations\day
Moon’s mean surface temperature would have been warmer than Earth’s.
https://www.cristos-vournas.com
The moon could only rotate up to certain speed before flying apart.
Small objects [space rock] can and do spin very fast compared planet, like day of 9 mins, and they average around 5 C.
Of course Earth is a very cold ice house global climate. A more normal Earth has average temperature of more than 20 C.
gb…”It seems if Earths day was 1 month long, Earth would be colder”.
***
Depends which side you were on, the solar side or the dark side. The average would likely be colder but that would be meaningless if you were on the hot side or the cold aide.
Hmm. Well:
Currently we are in coldest time of an Ice Age and so to become colder, it’s the Snowball Earth.
We are not just cold, we also dry, and would become even drier.
But I don’t think Earth could have a Snowball global climate.
But it could sort of a Slushball-ish global climate, which means a lot more “polar sea ice” than we have ever had before and drier world than we have ever had before.
Anyhow, instead Canada with average yearly temperature of -3 C, Canada average yearly temperature would around -20 C or colder.
Whereas the tropics is a bit cooler and drier.
It seems in Southern California, we should get sea ice during winter.
One could/might possibly travel via sea ice to Hawaii in winter and during the long night
And you wouldn’t live in Canada.
It seems humans would live in Ocean settlements.
gbaikie :
“Currently we are in coldest time of an Ice Age and so to become colder, its the Snowball Earth.”
Why do you think, gbaikie, we are currently in coldest time of an Ice Age?
https://www.cristos-vournas.com
–Why do you think, gbaikie, we are currently in coldest time of an Ice Age?–
Coldest time in the Late Cenozoic Ice Age:
https://en.wikipedia.org/wiki/Late_Cenozoic_Ice_Age
Because this is what everyone says.
Ie: Greenland ice sheet formed about 2 million years ago and last glaciation period was the coldest.
Last interglacial periods were warmer and higher sea levels.
No one dispute it.
I would say an important question is, what would Venus temperature be if Venus was at Earth distance from the sun?
Now, Christos Vournas seems to understand the speed of rotation of planet effects it’s temperature.
Venus rocky surface is the slowest rotating planet compared to any know planet in the universe.
And Venus is hot.
Now, Venus upper atmosphere rotates every 4 to 5 Earth days.
This alone, should logically inform anyone, that the upper atmosphere
is warmed by sunlight
And I know of no one that disagrees that upper atmosphere is warmed
by sunlight, but if one believe rotational speed matters, regardless of what other say, this should confirm upper atmosphere is warmed by sunlight.
And, if the rotation of atmosphere were to slow, it would not be rotating as fast, and so would be colder.
{if slower rotation cools}.
If Venus was at Earth distance it receives less sunlight.
{unless you think Venus is not warmed by sunlight} then Venus
should be cooler
Therefore, less sunlight “probably” would make atmosphere rotate slower.
Agree or disagree?
If rotates slower, it cools.
And if cools, it would probably make it rotate slower
One to call that, a runaway effect.
{There seems to me to be other cooling runaway effects but I think rotation aspect is a fairly important issue which can be addressed, first}
gbaikie, you mean, if Venus were at Earth’s orbit, Venusian atmosphere would be receiving less solar energy, as a result atmosphere would rotate less, and Venusian surface temperature would be less because of the bigger distance from the sun and because of the atmosphere the slower rotational spin.
Yes, I agree.
https://www.cristos-vournas.com
“Yes, I agree.”
I can’t imagine anyone disagreeing.
Though I can imagine much disagreeing about how much
colder would be if Venus was at Earth distance.
Much of the religion concerning “global warming” is that Venus
was once like Earth. And the craziest think Earth could become like
Venus.
I think if made Earth have same rotational speed and at same distance
from the sun as Venus, Earth would not become vaguely like Venus.
And I think if Venus was at Earth distance, Venus would be colder than Earth. Colder is the sense of having lower average surface air temperature than 15 C. And colder because there would higher air pressure and higher air density and thereby quickly make a human feel cold [and/or die of freezing quicker even if the air was somewhere in Venus having a air temperature as warm as 15 C.
But if there any science related global climate, one understood it should able to predict the average surface air temperature of Venus if it was at 1 AU distance from the sun.
gbaikie:
“But if there any science related global climate, one understood it should able to predict the average surface air temperature of Venus if it was at 1 AU distance from the sun.”
I calculate Venus surface temperature at 1 AU distance from the sun approximately as:
Tvenus = 670K
https://www.cristos-vournas.com
–I calculate Venus surface temperature at 1 AU distance from the sun approximately as:
Tvenus = 670K–
You missed YOUR point. The question is how fast in Venus atmosphere
rotating.
Venus is slowest rocky surface rotating planet, but it’s atmosphere rotates in 4 to 5 Earth day.
How many earths days does upper atmosphere rotate it
{as Venus in heated at it’s upper atmosphere NOT it’s slow moving
rocky surface.
Your answer is all about it’s rotational speed.
Let’s see if I can answer your point.
Your number for temperature is 670 K or 397 C
for some kind average surface temperature [since rocky surface
temperature varies with the varying elevation of Venus surface, which varies a lot more then Earth- because Earth has an ocean sea level covering 70% of the planet.
And though it’s claimed air temperature doesn’t vary [if at same elevation] on it’s rocky by more than 5 C {it’s probably wrong and probably varies more in polar region- and if cooler, probably varies more in polar region].
“Surface pressure: 92 bars
Surface density: ~65. kg/m3
Scale height: 15.9 km
Total mass of atmosphere: ~4.8 x 10²⁰ kg
Average temperature: 737 K (464 C)
Diurnal temperature range: ~0
Wind speeds: 0.3 to 1.0 m/s (surface)
Mean molecular weight: 43.45 ”
Well, diurnal temperature range, is fairly meaningless
and could remain at about 0
and Mean molecular weight, should increase. But temperature
of 737 vs your Earth distance temp of 670 K
or 67 K difference.
As starting exercise what happen is Earth 15 C were 15 K cooler?
Earth atmosphere lowers and stays the same pressure.
Standard Atmospheric is given at 15 C, though sometimes it’s 20 C
and you have different surface air density, because of a mere difference of 5 K.
Or if at 1 atm on Venus, and temperature drops, you can be at 1 atm,
but you become closer to rocky surface.
Oh I also have a table, bookmarked:
https://www.engineeringtoolbox.com/air-temperature-pressure-density-d_771.html
1 atm: 10 C: 1.25 kg and 65.6 C: 1.04 kg per cubic meter
68.95 atm: 10 C: 86.50 and 65.6: 72.08 kg
Or if at 65.6 C and cools to 10 C it increases density by about 20%
And if at 50 km elevation times .8 you drop to 40 km elevation at 1 atm pressure with temperature difference of 55.6 K
So, Venus at Earth distance you at 1 atm at around 40 km from surface
and at north pole. Sun is at very low horizon and is very dim.
Now be at equator. Sunlight is bright and air is 67 K colder then if at Venus distance, so 0 to 5 C.
Drop to surface and air is 670 K if surface somewhere at zero sea level elevation. Sunlight at surface is very dim. At Venus distance
it’s dim, with half as much sunlight it’s dimmer.
Go up to 30 degrees latidute and sunlight has to pas thru twice as much atmosphere, sunlight is lighter portion of very dark sky.
This part:
“Wind speeds: 0.3 to 1.0 m/s (surface)”
Would be slower.
And go back up to 40 km elevation, it’s wind speed rather than 100 m/s would also be going slower.
Vournas
https://www.drroyspencer.com/2022/07/updated-atmospheric-co2-concentration-forecast-through-2050-and-beyond/#comment-1338638
Bindidon says: July 26, 2022 at 9:28 AM
“Vournas, dont try to dodge again, youve done it enough times already.
The problem is not that we wouldnt understand what you write: the problem is that we cant verify if it is correct.
Thus I repeat:
Why then dont you (try to) publish your stuff in some official science journal, and come back with the result of their review?”
“Why then don’t you (try to) … ?”
Bindidon, I see now, the question is why (?)
Please, Bindidon, could you write (offer) a selection of supposed answers, so I would choose one, among many? Please make the job easier for me.
Just write the cause (in your opinion) of why I am not “publish my stuff in some official science journal”.
You may as well propose some several causes of why.
Maybe it will take an entire thread, maybe two threads or more… Just start suggesting and commenting on the matter…
Bindidon, I am looking forward to it…
Why, actually, I don’t publish (?)
You made me become very much interested on the matter.
https://www.cristos-vournas.com
It seems that northern and central Europe must prepare for early autumn.
http://en.sat24.com/en
Where is it hot at night now.
https://climatereanalyzer.org/wx/DailySummary/#t2min
Unusually hot/cold (anomaly)
https://climatereanalyzer.org/wx/DailySummary/#t2anom
In the Northern Hemisphere we call it summer. The only explanation I have for the current heat in the Southern Hemisphere is La Nina effects.
I was born in the UK and I was used to summers that were covered with cloud much of the time. I recall getting out of bed on a summer morning in Scotland, during a visit, at the latitude of Glasgow and finding it uncomfortably cold. Whn I tired to shave using a mirror in the bathroom, the hot water steamed the mirror glass so much I could not see my reflection. Of course, that may have something to do with vampirism.
The first thing that affected me as a child, moving to Vancouver, Canada, was the hot summers. I got nauseous from the heat at first, likely due to heat prostration. Why was it that much hotter during a Vancouver summer than a summer in Scotland? I get it that Scotland is part of a narrow island surrounded by ocean, but Vancouver is right on the ocean.
We now receive warnings about heat waves but in my childhood, it was just as hot, sans the heat wave warnings. The Sun was hot enough to give you a bad sunburn within an hour of being exposed. I mean a sunburn where the skin actually turns red and blisters.
I recently supplied a link to Oxford, UK, where the average temperature in July was in the vicinity of 24C, dating back to 1860.
“In the Northern Hemisphere we call it summer”
Anomalies take account of the seasons.
RSS and UAH directly compared, first before 2002 (2000)
https://www.woodfortrees.org/plot/uah6/mean:12/mean:10/mean:8/plot/rss/mean:12/mean:10/mean:8/offset:-0.23
and then from 2008
https://www.woodfortrees.org/plot/uah6/mean:12/mean:10/mean:8/plot/rss/mean:12/mean:10/mean:8/offset:-0.45
It is apparent that UAH is not that dissimilar to RSS except for the central period between 2002 to 2008.
And if you want the both together
https://imgur.com/gallery/4MVQ8HU
Linsley Hood definitely does not understand that you can’t simply shift anomalies as you want when you compare time series whose anomalies were constructed with respect to different reference periods.
You have to ensure that all anomalies are correctly displaced by the mean of the major reference period chosen, here: UAH’s, i.e. 1991-2020.
The anomaly mean within 1991-2020 for RSS Globe is 0.356; that for GISS LOTI is 0.613.
*
Here is a correct CTRM simulation using WFT, comparing UAH, RSS and GISS LOTI for the Globe:
https://www.woodfortrees.org/graph/uah6/from:1979/mean:12/mean:10/mean:8/plot/rss/from:1979/mean:12/mean:10/mean:8/offset:-0.365/plot/gistemp/from:1979/mean:12/mean:10/mean:8/offset:-0.613
As you can see here too, this 2002-2008 stuff is sheer nonsense, solely due to Linsley Hood’s own incompetence.
He should ask for example Vaughan Pratt what he means about that, before naming me ‘arrogant’.
Interestingly, CTRM-ing the three time series didn’t change the facts that
– UAH clearly is the outlier here;
– UAH crosses RSS near the beginning of 2004.
**
And let me add that a person who needs to physically overlay two plots to show what s/he means
https://imgur.com/a/Y96Ph5O
instead of simply creating a graph in a spreadsheet calculator and letting it produce a picture in e.g. tiff, gif or png format
https://drive.google.com/file/d/1p38CfnhJVwcNMfAuNXM5ey-GXRKstrci/view
can’t really know how to use such tools.
No one having Excel and/or Libre Office Calc experience would be stupid enough to show us the level of the own incompetence by showing such an incredibly primitive picture like this Y96Ph5O.
“Linsley Hood definitely does not understand that you can’t simply shift anomalies as you want when you compare time series whose anomalies were constructed with respect to different reference periods.”
Wrong. Different reference periods which construct anomalies can simply be subtracted, one from the other in order to make direct comparisons.
Anyway, in this case, the earlier part of the record and the later part both agree if you use different offsets. Nothing about single reference periods will correct that error.
Now Blinny wants to say that woodfortrees.org is wrong because it does not show what HE wants.
Of course the 2 series ‘cross’ in the middle. That is what
https://imgur.com/gallery/4MVQ8HU
shows quite clearly. Idiot.
P.S. https://imgur.com/gallery/4MVQ8HU shows the same as https://imgur.com/a/Y96Ph5O
Linsley Hood, you can name me ‘idiot’ as long as you want.
I repeat: you don’t understand how anomalies must be handled.
Even Robertson wouldn’t make your mistakes.
And, as usual, you continue stalking and lying
” Now Blinny wants to say that woodfortrees.org is wrong because it does not show what HE wants. ”
like a 15 year old college boy.
YOU dirty liar are the one saying I would want to ‘say that woodfortrees.org is wrong’.
I never said woodfortrees.org would be wrong.
What is utterly wrong, dirty liar, is how YOU use it.
Question: If I add back in the normals in one case and then subtract a different set of normals in the other case how is that different to just subtracting the difference one from the other?
“What is utterly wrong, dirty liar, is how YOU use it.”
I just use it to display what happens if you use a different offset for RSS to produce 2 different traces and how that allows a single UAH trace to align with it at both ends.
https://imgur.com/gallery/4MVQ8HU
As we all can see, woodfortrees.org is absolutely correct:
https://www.woodfortrees.org/graph/uah6/from:1979/mean:12/mean:10/mean:8/plot/rss/from:1979/mean:12/mean:10/mean:8/offset:-0.365/plot/gistemp/from:1979/mean:12/mean:10/mean:8/offset:-0.613
What is utterly wrong is how Linsley Hood misuses Paul Clark’s WFT software by shifting anomaly values with arbitrary values:
https://imgur.com/gallery/4MVQ8HU
But Linsley Hood will endlessly continue stalking, lying and cheating.
Question: If I add back in the normals in one case and then subtract a different set of normals in the other case how is that different to just subtracting the difference one from the other?
What is utterly wrong, dirty liar, is how YOU use it.
I just use it to display what happens if you use 2 different offsets for RSS to produce 2 different traces and how that allows a single UAH trace to align with it at both ends over quite long periods.
https://imgur.com/gallery/4MVQ8HU
offset:-0.365
So, yet again, you try and use a single offset to reason why the 2 ends are aligned but the middle is not between RSS and UAH. You dont get maths or logic do you?
Question: If I add back in the normals in one case and then subtract a different set of normals in the other case how is that different to just subtracting the difference one from the other?
“What is utterly wrong, dirty liar, is how YOU use it.”
I just use it to display what happens if you use 2 different offsets for RSS to produce 2 different traces and how that allows a single UAH trace to align with it at both ends over quite long periods.
https://imgur.com/gallery/4MVQ8HU
“offset:-0.365”
So, yet again, you try and use a single offset to reason why the 2 ends are aligned but the middle is not between RSS and UAH. You don’t get maths or logic do you?
” So, yet again, you try and use a single offset to reason why the 2 ends are aligned but the middle is not between RSS and UAH. ”
Linsley Hood, you give here more and more the proof that you either don’t know how anomalies must be handled, or deliberately ignore it.
You can subtract or average them, like absolute temperatures.
What you can’t do is to arbitrarily shift parts of them using different offsets, in order to let the artificial result look like what you want to see, which is an artifact.
*
Moreover, I don’t try anything.
The number ‘0.365’ for RSS Globe is nothing arbitrary, Linsley Hood, exactly as least as is ‘0.613’ for GISS LOTI, or 0.618 for NOAA Globe, 0.544 for Had-CRUT5, -0,004916 for JMA, or 0.509 for… RSS land-only.
All these numbers are the mean of all anomalies between Jan 1991 and Dec 2020 for these time series.
Why is JMA’s value so small, Linsley Hood? Simply because JMA has switched from 1981-2010 to 1991-2020, like did UAH. It should be zero but isn’t, due to… rounding differences between JMA’s internal values and those they publish (with poor two digits after the decimal point – NOAA uses 6 if I well do recall).
*
Of course you don’t view anything I write as being relevant to you.
If you don’t dare ask Emeritus Pratt about all this (because you fear his possibly harsh answer), why not ask Roy Spencer? His response will certainly be above suspicion of being against you, as I am very unlikely to be his favorite commentator.
Ask him, Linsley Hood! Ask him!
So adding in the reference period to the first set of anomalies to make a set of absolute temperatures for the first set then taking away another different reference period to make a second set of anomalies cannot be done without visiting the absolute temperatures? You definitely don’t do logic or maths.
T1 + R1 = A = T2 + R2
But not according to Blinny. Idiot.
“What you cant do is to arbitrarily shift parts of them using different offsets”
There is nothing arbitrary in what I have done.
https://imgur.com/gallery/4MVQ8HU
speaks for itself.
P.S. The whole set is moved in the above example. There is no different parts. I did not make the parts align, maths did.
Roy has already had his say about all this.
“Despite the most obvious explanation that the NOAA-14 MSU was no longer usable, RSS, NOAA, and UW continue to use all of the NOAA-14 data through its entire lifetime and treat it as just as accurate as NOAA-15 AMSU data. Since NOAA-14 was warming significantly relative to NOAA-15, this puts a stronger warming trend into their satellite datasets, raising the temperature of all subsequent satellites’ measurements after about 2000”
https://www.drroyspencer.com/2019/04/uah-rss-noaa-uw-which-satellite-dataset-should-we-believe/
My direct comparison between RSS and UAH just proves that to be correct assessment.
rlh…”Despite the most obvious explanation that the NOAA-14 MSU was no longer usable, RSS, NOAA, and UW continue to use all of the NOAA-14 data through its entire lifetime…”
Roy is being professional and diplomatic. I don’t have to be, I call NOAA, RSS, and UW cheaters. Not only that, they are politically motivated, so much so, they are willing to cheat to get a political lie across to the public.
It’s quite well known here that UAH global temp record has a lower trend post-2000. We’ve discussed on this board multiple times, particularly after Roy posted the methodology.
It’s also well-known to regulars here that UAH change from version 5.6 to 6.0 significantly lowered the long term trend for UAH, while the change from RSS3 to RSS4 significantly raised the long term trend.
Fawning regard for the UAH revision is always qualitative, as is the antipathy to RSS.
barry: I have just illustrated what Roy’s words mean in the actual data.
https://imgur.com/gallery/4MVQ8HU
speaks for itself.
Nothing Roy said is about anything to do with ‘long term trends’, just about the period in which the drifting satellite is incorrectly used.
This produces the permanent offset to be seen in the RSS output data from 2000/2002.
We haven’t contradicted each other.
Roy disagrees with RSS and the other satellite temperature groups on their use of NOAA14 satellite, obviously. You have chosen to accept what Roy says without question.
“RSS, NOAA, and UW continue to use all of the NOAA-14 data through its entire lifetime and treat it as just as accurate as NOAA-15 AMSU data.”
I’d be curious to know how you interpret this statement. Is Roy saying that RSS believe NOAA14 to be accurate, like NOAA15? What do you reckon he means?
“You have chosen to accept what Roy says without question”
The data shows that he is accurate in his analysis.
https://imgur.com/gallery/4MVQ8HU
Do you believe that it is OK to continue to use NOAA-14 as though it had no drift when it demonstrably does indeed have some?
“Is Roy saying that RSS believe NOAA14 to be accurate, like NOAA15”
NOAA-14 is inaccurate, NOAA-15 is accurate. How you can you construe his words any differently?
If RSS continues to treat NOAA14 as accurate they will be in error.
Barry: What is your explanation for the differences shown in
https://imgur.com/gallery/4MVQ8HU
between RSS and UAH?
The data only shows that there are different datasets, not which is more accurate.
barry: “Is Roy saying that RSS believe NOAA14 to be accurate, like NOAA15”
RLH: “NOAA-14 is inaccurate, NOAA-15 is accurate. How you can you construe his words any differently?”
There are various ways to construe it.
“RSS, NOAA, and UW continue to use all of the NOAA-14 data through its entire lifetime and treat it as just as accurate as NOAA-15 AMSU data.”
That could mean that RSS treat both datasets as if they were equally inaccurate.
The reason I ask is that RSS absolutely do not treat NOA14 or NOAA15 as if they are accurate. RSS state that they do not know which is accurate, or if they are both inaccurate, as there is no other robust data to compare the brief period of overlap. They make their methodology choice assuming that both are inaccurate.
My point is that you wouldn’t know this was the case from the way Roy put it. You choose to accept his interpretation of other methodologies without question. And you are misled by it.
When did you read the RSS methodology paper to see for yourself how they “treat” NOAA14?
Barry: Just what is your explanation for the differences shown in
https://imgur.com/gallery/4MVQ8HU
between RSS and UAH?
Barry: Why are the major differences between UAH and RSS concentrated in the period 2000 to 2008?
The major difference is the different handling of the switch from MSU to AMSU satellites, NOAA14 to NOAA15. Obviously, both groups argue that their methodology is superior.
What do you think of Roy’s wording that misled you to believe that RSS think both NOAA14 and NOAA15 is accurate?
“When did you read the RSS v4 paper to see how RSS ‘treat’ NOAA14?”
I’ll take your silence to mean that you have not read it, and have simply accepted Roy’s interpretation without question.
Barry: Why are the major differences between UAH and RSS concentrated in the period 2000 to 2008?
https://www.drroyspencer.com/2022/07/updated-atmospheric-co2-concentration-forecast-through-2050-and-beyond/#comment-1339494
“The major difference is the different handling of the switch from MSU to AMSU satellites”
So outside of that period (2000 to 22008) are you saying that RSS and UAH both agree in their trends and it is only in that period that they differ?
….2000 to 2008….
Barry: Are you also saying that 1998 was completely insignificant as RSS shows whereas UAH shows it to be similar to 2016 in its strength?
“Why are the major differences between UAH and RSS concentrated in the period 2000 to 2008?”
NOAA4 to NOAA15 covers that period. The major difference regarding methodology and its effect is as I said, but that is not the only difference in how UAH and RSS process almost exactly the same data.
Why don’t you read the methods papers? Why are you asking me when you could be reading from source? You obviously haven’t done this, so you are arguing in a vacuum. Educate yourself.
https://journals.ametsoc.org/view/journals/clim/30/19/jcli-d-16-0768.1.xml
https://www.drroyspencer.com/wp-content/uploads/APJAS-2016-UAH-Version-6-Global-Satellite-Temperature-Products-for-blog-post.pdf
The data from both UAH and RSS when compared says that Roy’s analysis is correct.
The only major differences between RSS and UAH are during the period 2000 to 2008.
Outside of that period they agree quite well one with the other.
The only difference during this period is that RSS continues to use NOAA-14 whereas UAH does not. Why would the major differences between the 2 series only be during that period if it was not down to the use of NOAA-14?
To say that it is impossible to decide if NOAA-15 is accurate or not is obviously wrong when you look at the data.
Are you (and RSS) saying that only NOAA-15 is inaccurate and all others before and since then are accurate?
“Are you (and RSS) saying that only NOAA-15 is inaccurate and all others before and since then are accurate?”
I’ve already answered this.
https://www.drroyspencer.com/2022/07/updated-atmospheric-co2-concentration-forecast-through-2050-and-beyond/#comment-1339501
And supplied the links to the methodology papers of both UAH and RSS that discuss inter-satellite calibration.
You are proceeding, whether you realize it or not, on the assumption that UAH is correct, without questioning that assumption.
What did you think of RSS take on the MSU/AMSU merge (NOAA14/15) when you read their paper?
“To say that it is impossible to decide if NOAA-15 is accurate or not is obviously wrong when you look at the data…
NOAA-14 is inaccurate, NOAA-15 is accurate. How you can you construe his words any differently?”
Roy Spencer thinks NOAA15 is inaccurate and needs adjustments to account for its drift.
You would know that if you read the methods papers. You were given direct links to them 2 days ago, just a few posts up. It is appalling that you continue to talk about these matters without taking a little time to educate yourself from the direct source material.
You think you are doing science by comparing graphs. You aren’t. You are compounding your ignorance.
RLH wrote:
To which, barry replied with a link to the UAH v6 paper. If one reads that paper, page 7, one finds:
We know that RSS corrects for this problem by simply excluding those areas of high altitude from their resulting data, particularly, the Antarctic (poleward of 70S) and Greenland. We also know that increasing the incidence angle moves the effective scan altitude upward into cooler air with more influence from the Stratospheric cooling trend.
RLH, playing with graphs won’t show which data set represents the most accurate indicator of climate change. My latest comparisons present a different perspective than your filtering, suggesting a step downward in the UAH series around the year 2000, as found in the North Polar portion of the LT. Unlike you, I can’t say that my graphs “prove” anything.
> My direct comparison between RSS and UAH just proves that to be correct assessment.
No, all that proves is that they’re different.
As if everybody didn’t already know that.
The point that it is only 2000-2008 that the 2 series differ that much is most certainly not discussed. The claim usually is that over the whole time 1979 to present do they differ.
It’s worth having a look at the difference between UAH current and former version.
https://www.woodfortrees.org/plot/uah6/to:2017.55/mean:12/offset:0.08/plot/uah6/to:2017.55/mean:12/offset:0.08/trend/plot/uah5/mean:12/plot/uah5/mean:12/trend
I centred both plots on the peak of the 1998 el Nino, as it seems that they diverge after that.
This divergence appears to have occurred from 2000, with a marked departure in late 2001, that increases over time.
https://www.woodfortrees.org/plot/uah5/from:2000/to:2008/plot/uah6/from:2000/to:2008/offset:0.08/plot/uah5/from:2000/to:2008
This comes from UAH handling the NOAA14/15 crossover differently in each version.
“The point that it is only 2000-2008 that the 2 series differ that much is most certainly not discussed.”
It certainly is discussed, both in the literature and more informally such as on blogs and other fora. The specific time period varies a bit, but the conversations cover the crossover from NOAA14 to NOAA15.
You might be interested in Roy Spencer’s informal take on NOAA15:
“Anyway, my UAH cohort and boss John Christy, who does the detailed matching between satellites, is pretty convinced that the RSS data is undergoing spurious cooling because RSS is still using the old NOAA-15 satellite which has a decaying orbit, to which they are then applying a diurnal cycle drift correction based upon a climate model, which does not quite match reality. We have not used NOAA-15 for trend information in years… we use the NASA Aqua AMSU, since that satellite carries extra fuel to maintain a precise orbit.”
Roy says on the same page:
“The RSS folks are our friends, and we both are interested in building the best possible datasets.”
https://www.drroyspencer.com/2011/07/on-the-divergence-between-the-uah-and-rss-global-temperature-records/
In these climate debates people who are tribalistic about their position will laud the datasets that confirm their opinions and trash the ones that don’t. This kind of thinking is the antithesis of science, and is patently absurd when the interlocutor has no fucking clue about the validity or otherwise of these datasets. These people typically don’t even read the methodology papers behind the datasets.
So Brandon, you agree that
https://imgur.com/gallery/4MVQ8HU
is a correct assessment of the data.
I agree that it’s a correct presentation of the data, Richard. The point you’re now doing your level best to miss is that simply comparing one or more data series to each other doesn’t tell you much about how correctly those data represent reality.
So the data tells you that during the early part of the record RSS agrees with UAH and in the later part also but that in the middle, where the 2 series use different satellites, there is no agreement. Indeed all of the major differences between the 2 series are contained between 2000-2008.
Not quite the assessment usual delivered about RSS and UAH.
> Indeed all of the major differences between the 2 series are contained between 2000-2008.
Looking at rolling 10-year linear trends, GISS ran cooler than RSS between 1992 and 1997. They are in quite good agreement everywhere else.
I would put the divergence of RSS to UAH at 1997 and ending around 2010, close enough to your assessment as to not quibble.
My point stands that these comparisons don’t in and of themselves tells us about which product best represents reality.
https://imgur.com/gallery/92RSylQ
Units are degrees C per century.
I didn’t do HAD, I’m watching baseball and just can’t be arsed.
“I would put the divergence of RSS to UAH at 1997 and ending around 2010, close enough to your assessment as to not quibble”
The 12 month CTRM of both series says you are wrong. It is 2000 to 2008. See the graph from woodfortrees.org.
https://imgur.com/gallery/4MVQ8HU
I should have known you would want to quibble, Richard. No matter, anyone interested can look at both our presentations and decide for themselves.
I got around to adding HAD5 to the comparison:
https://imgur.com/gallery/dPn6Gmd
The surface record shows much better coherence than the satellite record, suggesting more robust results for the former than the latter.
RSS shows better agreement to the surface data than UAH.
We know that the period 2000-2008 is particularly problematic for the sats due to issues with NOAA-15 and Aqua. There is no equivalent issue in the surface record over the same period.
To this layperson, the surface record inspires more confidence.
“The data from both UAH and RSS when compared says that Roys analysis is correct.”
“The data shows that he is accurate in his analysis.”
How’s that? You look at the one that shows less warming and ASSUME it is the correct one?
The fact is that the both teams have made rational arguments as to why their analysis is correct.
Understanding this controversy requires technical expertise in remote sensing that you have not demonstrated that you have, RLH.
Lacking technical expertise, there is no way for you to judge who is correct, other than by applying bias.
“the artificial result look like what you want to see, which is an artifact”
An artifact that is backed up by Roy’s observation about NOAA-14 (see above).
Independent analyses show better agreement between RSS and balloon (radiosonde) measurements.
https://journals.ametsoc.org/view/journals/clim/33/19/full-jcliD190998-f8.jpg
In 5 data sets (2 balloon and 3 satellite) UAH is consistently the outlier with lower trends. All but UAH show the predicted amplification of the warming in the tropical troposphere.
A large drop in the surface temperature of the equatorial western Pacific.
https://i.ibb.co/2c8prTX/nino4.png
Bremen composite Mg II index
Original 55 day smoothed plot chart
https://www.iup.uni-bremen.de/gome/solar/mgii_composite_2.png
Their daily data
https://www.iup.uni-bremen.de/gome/solar/MgII_composite.dat
A chart out of their daily data comparing SC24 and SC25
https://drive.google.com/file/d/1TeTmv3aYPCjUhQcP2HMgftcEFwNOVlNH/view
Are you as wrong on this as you are about RSS versa UAH?
As to bemen.de their SC24 to SC25 comparison is
https://www.iup.uni-bremen.de/gome/solar/mgii_composite_2.png
P.S. Their start date for SC25 is a LOT earlier than yours. 03/03/2018
You can now see a big drop in both UV and SSN.
https://i.ibb.co/wBNYGZ2/ises-solar-cycle-sunspot.png
Sunspot number: 53
Updated 27 Jul 2022
Even this blog’s dumbest lunar spin denier at least is able to correctly read what others write!
But manifestly, the stalking, lying and trickstering college boy Linsley Hood aka RLH is not even able to do that.
Look at what he writes…
” P.S. Their start date for SC25 is a LOT earlier than yours. 03/03/2018 ”
And look at what I posted.
*
1. Bottom line in my Bremen data comparison chart
https://drive.google.com/file/d/1TeTmv3aYPCjUhQcP2HMgftcEFwNOVlNH/view
” Jan 2009 – Aug 2013 versus Mar 2018 – Jul 2022 ”
*
2. Starting Bremen day indices in their source file
https://www.iup.uni-bremen.de/gome/solar/MgII_composite.dat
I used for representing the graph:
– SC24: 1536 (2009 01 08)
– SC25: 4877 (2018 03 03)
*
3. Compare the bold emphasized sequences above with the numbers for SC 24 and SC25 in Bremen’s chart
https://www.iup.uni-bremen.de/gome/solar/mgii_composite_2.png
Incredible.
*
But the very best is that a few days earlier, the very same Linsley Hood wrote:
” B[r]emen.de still thinks that SC25 started later than your claim. Live with it. ”
*
Who on Earth would ever trust such a person saying plus X on July 25 and minus X three days later?
I was wrong in the earlier/later claim. 2018 03 03 is the start of SC25.
Nasa says you are still wrong.
https://www.nasa.gov/press-release/solar-cycle-25-is-here-nasa-noaa-scientists-explain-what-that-means
bobdroege, please stop trolling.
Some context for the OP:
Roy Spencer:
Skeptical Arguments that Don’t Hold Water
7. WARMING CAUSES CO2 TO RISE, NOT THE OTHER WAY AROUND
The rate of rise in atmospheric CO2 is currently 2 ppm/yr, a rate which is 100 times as fast as any time in the 300,000 year Vostok ice core record. And we know our consumption of fossil fuels is emitting CO2 200 times as fast! So, where is the 100x as fast rise in today’s temperature causing this CO2 rise? C’mon people, think.
https://www.drroyspencer.com/2014/04/skeptical-arguments-that-dont-hold-water/
I think Earth is older than 300,000 years, as are humans and polar bears.
I think this is known to Roy Spencer, isn’t it?
What you write doesn’t contribute to the discussion.
Your reaction reminds me those at WUWT, where people always write
” Record lows in April in Germany!!
The Globe is cooling”
but conversely
” Record highs in June in Spain??
Bah! It was way warmer during the Holocene. “
Holocene was and is colder than the last interglacial period which was about 130 thousand years ago, Wiki:
“The Eemian (also called the last interglacial,[1] Sangamonian Stage, Ipswichian, Mikulin, Kaydaky, penultimate,[2] Valdivia or Riss-Wrm) was the interglacial period which began about 130,000 years ago at the end of the Penultimate Glacial Period and ended about 115,000 years ago at the beginning of the Last Glacial Period
,,,
During summer months, temperatures in the Arctic region were about 2-4 C higher than today.[10] The warmest peak of the Eemian was around 125,000 years ago, when forests reached as far north as North Cape, Norway (which is now tundra) well above the Arctic Circle at 7110′21″N 2547′40″E. Hardwood trees such as hazel and oak grew as far north as Oulu, Finland.
,,,
Sea level at peak was probably 6 to 9 metres (20 to 30 feet) higher than today,”
https://en.wikipedia.org/wiki/Eemian
But couple millions ago it warmer than Eemian.
There is an observed co-incidence between the rise in CO2 and the apparent rise in global temperature. There is no proof that CO2 actually drives that increase on its own without substantial input from other sources, there is just supposition.
Please note it has been agreed that the maximum temperature caused by successive El Nino has not changed significantly in the central Pacific since at least 1878.
Explain how that occurs if increased CO2 drives increased temperature.
“Explain how that occurs”
Are saying that you believe a long-term global trend can be falsified by a one-time event in a tiny subset of the globe?
The tallest ever US President, Lincoln, was elected in 1860.
Explain how that occurs if better nutrition has driven an increase in the heights of humans.
Same dumb ill-logic as your question, RLH.
Explain how maximum temperatures are not affected by increasing CO2. Demonstrably so.
Nate, you aren’t able to separate your beliefs from reality. The fact that you can’t state your GHE nonsense, in words that you can stand by, shows it ain’t science. The GHE nonsense is a squishy mishmash of false beliefs that keeps changing almost on a daily basis.
One of the cult idiots that shows up here occasionally, tried to claim a hot vacuum tube was “proof” of the GHE! Everything is “proof” of the GHE nonsense. That ain’t science.
RLH,
So you do believe a long-term global trend can be falsified by a one-time event in a tiny subset of the globe?
If so, you have no grasp of statistics.
I understand that a maximum is a maximum and yet is unaffected by AGW.
Maximums definitely change due to global warming (or cooling). If the background temperature shifts up or down, so do maxima (and minima). So, for example, 2 el Ninos could have exactly the same intensity, but the peak in global temperatures will be different if the background temperature is different.
You can easily see that with the 1878 and 2016 el Ninos, which each had a significant influence on the global temperatures of those years.
https://tinyurl.com/mr3hcnx7
Both of very similar strength, but the latter el Nino took place while the Earth’s surface was 0.8C warmer. Therefore the peak of the two el Ninos – as seen in global temperatures – are separated by roughly 0.8C.
If you look at temperatures only in the NINO3.4 region, which has barely warmed, if at all over that period, then you will see that the peaks are little different. In fact, there is a small (not statistically significant) warming in the NINO3.4 region, and it so happens that the peak of the 2016 el Nino is slightly warmer than the 1878 (again, not statistically significant).
So, yes, if global temperatures change, then temperature maxima and minima (or in this case, el Ninos and la Ninas) will follow along.
Same as if you get a day 10C above average in Winter, and a day 10C above average in Summer. Both are equal in their departure from normal, but the absolute temperature difference between them will be equal to the difference of the average of Winter and Summer temps.
Corroborating changes in maxima and minima is that when you gather all the record-breaking hot and cold days around the globe (without cherry-picking, RLH), you find that the vast majority are hot record-breakers for each of the the last 20 years. That’s because the background (global) temperature is warmer than previous, which statistically favours that outcome.
“Maximums definitely change due to global warming”
Except in the central Pacific as you have previously agreed.
Yes, for perhaps the 20th time I am agreeing that the NINO3.4 region has barely warmed, if at all.
Will you require me to confirm this a further 20 times, or can we finally move on?
Can we also confirm you understand that if global temperatures rise, the peaks in global temperature caused by el Ninos will also get higher?
“I understand that a maximum is a maximum and yet is unaffected by AGW.”
So by simple looking at single event in a noisy data set, you are able to determine cause and effect? You are able to determine what does and doesnt affect it?
How do you do that, RLH?
>The tallest ever US President, Lincoln, was elected in 1860.
Explain how that occurs if better nutrition has driven an increase in the heights of humans.
Same dumb ill-logic as your question, RLH.
It is believed Lincoln had a genetic defect that caused his disproportions. Who’s dumb?
Solar wind
speed: 418.3 km/sec
density: 6.53 protons/cm3
Sunspot number: 53
Updated 27 Jul 2022
Thermosphere Climate Index
today: 13.34×10^10 W Neutral
Oulu Neutron Counts
Percentages of the Space Age average:
today: +0.5% Elevated
48-hr change: +1.0%
So, it’s +0.5% and seems it rise more but
it seems to me, we will back to Solar Max conditions
in couple weeks, and before this could have a spotless sun
and after this neutrons counts may dip eventually to -5%
Solar wind
speed: 337.2 km/sec
density: 8.82 protons/cm3
Sunspot number: 40
Updated 29 Jul 2022
https://www.spaceweather.com/
Thermosphere Climate Index
today: 12.97×10^10 W Neutral
Oulu Neutron Counts
Percentages of the Space Age average:
today: +0.3% Elevated
48-hr change: +0.7%
–A SUNSPOT OF INTEREST: New sunspot AR3068 near the sun’s southeastern limb is still small, but it is growing rapidly, tripling in size since yesterday. It merits watching as a possible source of near-future activity.–
I live fairly near [within 300 miles] of spot in world with highest daytime temperature ever recorded:
“Currently, the highest officially registered temperature is 56.7C (134F), recorded in California’s Death Valley back in 1913.”
Anyhow forecast say it’s going to get to 103 F in next couple days, but with pretty cool nights, and then going to get cloudy and not get over 100 F.
No hurricane predicted over in Atlantic for next 2 days:
https://www.nhc.noaa.gov/
And it’s time to guess global temperature.
I going guess more cooler mainly due to apparent lack of hurricanes,
So .1 C cooler than last month.
Maximum of cycle soon.
https://i.ibb.co/wsd1Bdf/Tilts.gif
Yeah. And sooner than most expected, but some were saying it was going peak quickly, and I was thinking they could be right.
But it seems we going to get double peak, also. But some think it’s weaker and maybe long time before we long periods of spotless.
And then weak 26 cycle.
Which would mean if happens, we are in a solar grand min, but not a large solar grand min [though maybe have a large solar grand min] either way, bad for exploring Mars.
In terms of bad for Mars, NASA needs to demonstrate a fast trajectory to Mars. It could offer a prize for it, say 1/2 billion prize, for 3 months to Mars and not a flyby, but something which enters Mars orbit and/or lands on Mars surface.
NASA also needs to make a cheap artificial gravity station which is
Mars gravity. It could also do it with a prize: 100 million for something which give a human Mars gravity for more than 1 month.
Solar northen polar field is rapidly approaching the equator.
http://wso.stanford.edu/gifs/north.gif
No, Mr Palmowski.
You are referring as usual to something differing completely from what you write.
No, it will be a weak solar maximum, when there will be a change in the magnetic fields on the Sun. The cycle will be short.
Sunspot number: 52
Updated 28 Jul 2022
“Humans evolved living in caves, and to caves we might return when we live on the moon,” said Paige, who leads the Diviner Lunar Radiometer Experiment.”
Sure.
“Future human explorers on the moon might have 99 problems but staying warm or cool won’t be one. A team led by planetary scientists at UCLA has discovered shady locations within pits on the moon that always hover around a comfortable 63 degrees Fahrenheit.”
https://www.moondaily.com/reports/UCLA_scientists_discover_places_on_the_moon_where_its_always_sweater_weather_999.html
That seems surprising to me.
I tend to think it’s wrong.
Anyhow, we need to go there and find out.
RSS to UAH global compared before 2000
https://www.woodfortrees.org/plot/rss/to:2000/mean:12/mean:10/mean:8/plot/uah6/to:2000/mean:12/mean:10/mean:8/offset:0.23
and after 2008
https://www.woodfortrees.org/plot/rss/from:2008/mean:12/mean:10/mean:8/offset:-0.44/plot/uah6/from:2008/mean:12/mean:10/mean:8
Basically they are the same given that they cover slightly different area of the globe.
And for the gap 2000 to 2008
https://www.woodfortrees.org/plot/uah6/from:2000/to:2008/mean:12/mean:10/mean:8/plot/rss/from:2000/to:2008/mean:12/mean:10/mean:8/offset:-0.28
And this is how the gap 2000 to 2008 REALLY looks like:
https://www.woodfortrees.org/graph/uah6/from:2000/to:2008/mean:12/mean:10/mean:8/plot/rss/from:2000/to:2008/mean:12/mean:10/mean:8/offset:-0.365
I deliberately started the left hand edge to be the same, RSS to UAH.
Oooooh! The second magic offset suddenly moved from -0.45 down to -0.44!
How interesting!
The ‘math formula’ was ‘corrected’, as it seems :- )
It is just a change in the last decimal place. Something you have defended on many of your posts.
But unlike you, Linsley Hood trickster, I never changed the value of a tricky, thoroughly mathless offset.
Matching things by eye has a +-1 in the last decimal place. Get over it.
RLH, There are other ways to compare the UAH and RSS data.
HERE’s an example using a different filter for your considerton. The filter adds roughly 6 months of lag. Notice the big drop in the North Polar difference around 1999, about the point at which UAH began using the AMSU data. It looks like a bias has been introduced in the data at that point.
Stefan-Boltzmann emission law doesnt work vice-versa !
The T = ( J /σ )∕ ⁴ is a mistake !
Stefan-Boltzmann emission law doesnt work vice-versa !
The old convincement that the Stefan-Boltzmann emission law works vice-versa is based on assumption, that EM energy obeys the 1st Law of Thermodynamics (1LOT). That assumption was never verified, it was never been confirmed by experiment.
Lets see:
The Stefan-Boltzmann emission law states:
J = σ*Τ⁴ (W/m) EM energy flux (1)
The mathematical ability to obtain T, for a given J led to the misfortunate believe that the Stefan-Boltzmann emission law formula can be used vise-versa:
T = ( J /σ ) ∕ ⁴ (K) (2)
as the surface (vise-versa) radiative emission temperature definition.
Well, this is theoretically right for a blackbody theoretical approach. Blackbody surface behavioral property is compared with a tiny hole in a stove. The incident in the hole radiative energy vanishes inside the stove The hole is infinitesimally smaller than the stoves inside walls area. Thus the incident in the hole EM energy cannot escape out of the stove.
After multiple interactions with the stoves walls, the incident in the hole the entire EM energy is transformed into heat and is, eventually, evenly dissipated and accumulated as HEAT in the stoves inner walls
The EM energy emitted out of the stoves hole is then only the inside stove uniform surface temperature T dependent function
J = σ*Τ⁴ (W/m).
But the
T = ( J /σ ) ∕ ⁴ (K) (2) as the irradiated surface (vise-versa) radiative emission temperature definition is utterly unacceptable, because it has not a physical analogue in the real world.
That is why we should consider planet effective temperature Te = [ (1-a) S /4σ ]∕ ⁴ (K)
as a mathematical abstraction, which doesn’t describe the real world processes.
https://www.cristos-vournas.com
Correction:
W/m should be read W/m2
https://www.cristos-vournas.com
https://www.drroyspencer.com/2022/07/updated-atmospheric-co2-concentration-forecast-through-2050-and-beyond/#comment-1338638
Bindidon says:
July 28, 2022 at 9:44 AM
https://www.drroyspencer.com/2022/07/updated-atmospheric-co2-concentration-forecast-through-2050-and-beyond/#comment-1338638
https://www.cristos-vournas.com
In a reply to genius Linsley Hood, I wrote
” What you can’t do is to arbitrarily shift parts of them using different offsets… ”
This below was his answer:
” There is nothing arbitrary in what I have done.
https://imgur.com/gallery/4MVQ8HU
speaks for itself.
P.S. The whole set is moved in the above example. There is no different parts. I did not make the parts align, maths did. ”
*
This is so incredibly brazen.
The specifications for the two RSS plots in his construction are
/rss/from:1979/mean:12/mean:10/mean:8/offset:-0.45
/rss/from:1979/mean:12/mean:10/mean:8/offset:-0.23
Which maths did compute these two offsets? Where can we find the formula leading to them? Or did it happen ‘by magic’?
Anyone having used Paul Clark’s WoodForTrees web site since over ten years knows by experience that no math was involved here.
As do all manipulators using WFT (especially on Watts’ WUWT), Linsley Hood played with the offset specifications until the plots perfectly matched his expectations.
*
Linsley Hood really thinks that we all are dumb idiots on this blog.
It is evident that when you push, on the left, RSS up where it was below UAH and vice-versa down on the right, the difference in the middle will be artificially magnified: compare this difference in a correct graph:
https://www.woodfortrees.org/graph/uah6/from:1979/mean:12/mean:10/mean:8/plot/rss/from:1979/mean:12/mean:10/mean:8/offset:-0.365
with that in Linsley Hood’s brazen manipulation:
https://www.woodfortrees.org/graph/uah6/from:1979/mean:12/mean:10/mean:8/plot/rss/from:1979/mean:12/mean:10/mean:8/offset:-0.45/plot/rss/from:1979/mean:12/mean:10/mean:8/offset:-0.23
What else could we expect???
*
Again: while Linsley Hood himself selected the ‘-0.45’ and ‘-0.23’ offsets to artificially obtain his graph, without use of any math, the ‘-0.365’ offset is what you obtain when computing for RSS the mean of its anomalies within UAH’s reference period.
Trivial math, but… math.
When correctly observed, i.e. wrt the same reference period, the anomaly differences between RSS and UAH within 1979-2022 range from -0.34 K (in December 1984) up to +0.24 K (April 2021); the smallest difference (0.00 K) was in January 2004.
*
Thus, again and again: the alleged major difference betwen RSS and UAH within 2002-2008 is a mirage directly originating from Linsley Hood’s imagination.
Try using OLS for the periods 1979 to 2000 and 2008 to 2022 for RSS and UAH.
I notice you don’t claim that the outcomes are correct, just that you do not understand how they were obtained.
https://www.drroyspencer.com/2022/07/updated-atmospheric-co2-concentration-forecast-through-2050-and-beyond/#comment-1339494
shows the 3 periods in question.
Oh Linsley Hood…
I very well understand ALL your hopeless trials to manipulate the blog.
I understand perfectly that you want to denigrate VP but do not have the balls to do so. Either he was correct or you are. Which should we believe?
Again and again:
https://www.drroyspencer.com/2022/07/updated-atmospheric-co2-concentration-forecast-through-2050-and-beyond/#comment-1339666
https://www.drroyspencer.com/2022/07/updated-atmospheric-co2-concentration-forecast-through-2050-and-beyond/#comment-1339671
Some interested commenters might have been wondering about my claim (or better: neutral statement) that a 12 month CTRM (cascaded triple running mean) has the same effect as a 16 month SRM (simple running mean).
Here is, using a WFT simulation, CTRM 12 vs SRM 12:
https://www.woodfortrees.org/graph/uah6/mean:12/mean:10/mean:8/plot/uah6/mean:12
and here is CTRM 12 vs. SRM 16:
https://www.woodfortrees.org/graph/uah6/mean:12/mean:10/mean:8/plot/uah6/mean:16
That’s all, nothing to see, move along!
So Vaughan Pratt was completely wrong when he said that a 12, 10, 8 month CTRM was the same (or better) than a month 12 gaussian LP filter in frequency response. I know who I prefer to believe.
P.S. A 16 month anything will not help remove a 12 month seasonal pattern.
Again your disgusting lies and tricky manipulations.
I never and never said that Vaughan Pratt was wrong, let alone completely, Linsley Hood.
YOU are insinuating this all the time.
I just showed the difference between CTRM 12 and SRM 12, and that’s all.
But you dirty liar of course urge in repeatedly misrepresenting what I say.
Because you have nothing else to say than discrediting and denigrating.
“I never and never said that Vaughan Pratt was wrong”
But you claim that a 12, 10, 8 month CTRM is not the same as a 12 month gaussian. Even though that is exactly what he said. You do understand that a 12 month gaussian is the preferred 12 month filter don’t you?
And if you do not understand where 12, 10, 8 months came from (or are just too lazy to look the reference up)
1.2067 then 1.5478 was VPs mathematical calculation
and from that
12 / 1.2067 = 9.94447667191514 = ~10
12 / 1.5478 = 7.752939656286342 = ~8
which he agreed is the best 12 month solution.
….preferred 12 month low pass filter….
Again: lies and lies and lies.
I never told to prefer anything: I just show what people like you prefer to hide.
I perfectly know what Vaughan Pratt wrote along Goodman’s gest post, Linsley Hood.
But… I don’t forget how you recently eulogized Savitzky-Golay to the skies.
Until you discovered how near original S-G keeps to ‘simple running means’.
I don’t forget, Linsley Hood.
How I ‘discovered’ in 2014 you mean.
You liar never discovered anything about Savitzy-Golay in 2014.
In 2014 I was informed (thus ‘discovered’) that a 5 pass, multi-pass S-G was the best use of it by Nate. As I have told you many times and is available as a simple Google search.
This was the same year that VP informed me that a 3 stage CTRM of 12, 10, 8 months was the best 12 month low pass filter (i.e. the nearest to a gaussian).
I have used that combined information ever since in all my graphs.
Now you come along and say that a 16 month SRM would do the same thing as a 12 month CTRM. Pardon me if I am not convinced and I place VP well above you in both rigor and maths.
So Vaughan Pratt was completely wrong when he said that a 12, 10, 8 month CTRM was the same (or better) than a month 12 gaussian LP filter in frequency response. I know who I prefer to believe.
https://www.drroyspencer.com/2022/07/updated-atmospheric-co2-concentration-forecast-through-2050-and-beyond/#comment-1339666
https://www.drroyspencer.com/2022/07/updated-atmospheric-co2-concentration-forecast-through-2050-and-beyond/#comment-1339671
Strong negative surface temperature anomaly of the western equatorial Pacific.
https://i.ibb.co/P4DSxQ7/ct5km-ssta-v3-1-pacific-current.png
Ah, but the Eastern edge is getting warmer : )
https://www.tropicaltidbits.com/analysis/ocean/cdas-sflux_ssta7diff_global_1.png
Don’t worry about the Atlantic getting colder though, I am sure it will all come out in the wash.
Quite cool in the North Atlantic.
https://i.ibb.co/7njpXGJ/gfs-nh-sat1-t2min-1-day.png
UAH grid trend map for 2021…
https://www.nsstc.uah.edu/climate/2021/december2021/2021_Trend_Map.png
… and for 2016
https://www.nsstc.uah.edu/climate/2016/december/DEC1978_DEC2016_trend_LT.png
It’s a bit cooler in the Arctic than in 2016, but… not in the North Atlantic.
That’s the difference between a daily look and the long term.
So Vaughan Pratt was completely wrong when he said that a 12, 10, 8 month CTRM was the same (or better) than a month 12 gaussian low pass filter in frequency response and that a gaussian 12 month low pass filter was the best year long/seasonal low pass filter that there was.
Blinny says that he could just have chosen a 16 month SRM instead!
I know who I prefer to believe and it is not Blinny.
https://www.drroyspencer.com/2022/07/updated-atmospheric-co2-concentration-forecast-through-2050-and-beyond/#comment-1339666
Linsley Hood, you can post your lies as often as you want.
Lies keep lies.
And you clearly love lying, distorting, misrepresenting, discrediting, denigrating.
So who is correct? You or Vaughan Pratt?
1. No one has ever disputed the fact that Vaughan Pratt is 100 % correct. YOU permanently, woefully, cowardly try to insinuate I would.
2. It is my right to inform other people on this blog about what you deliberately dissimulate, namely that a 12 month CTRM has the same effect as a 16 month SRM.
3. Will you now stop stalking me, you 75 year old opinionated college boy?
“No one has ever disputed the fact that Vaughan Pratt is 100 % correct”
Yet you say that a 16 month SRM is the same as a 12 month CTRM.
“namely that a 12 month CTRM has the same effect as a 16 month SRM”
as you then go on to say. Despite his opinion otherwise.
“Will you now stop stalking me”
I will continue to point out that you are not as competent as VP.
https://www.drroyspencer.com/2022/07/updated-atmospheric-co2-concentration-forecast-through-2050-and-beyond/#comment-1339850
https://www.youtube.com/watch?v=RvGS8lcgi38
Scott say Saudis are making a floating city.
[I like floating towns which have surfing.}
Something of interest?
Note that the Daily Mail is usually noted for its climate change denial.
https://www.dailymail.co.uk/sciencetech/article-11057043/Met-Office-report-reveals-sea-levels-UK-rising-0-2-inches-year.html
The Met office are notorious liars.
“too many people settle for a simple running mean, whose frequency response you would not wish on your worst enemy because of the nasty side lobes”
Vaughan Pratt says but Blinny thinks otherwise.
Blinny does not disagree.
Peterson interview with Yon
The interesting bit for the climate cognoscenti begins at 34:20
https://www.youtube.com/watch?v=R7gAEkzIgvw
Decoding the Son of Lobster:
https://decoding-the-gurus.captivate.fm/episode/recoding-jordan-peterson-think-again-sunshine
Think again, sunshine!
Interesting video. It prompted me to view more Peterson videos and I enjoyed his anti-Trudeau comments and the movement to sissify men.
Trudeau is one of them, totally sissified. An embarrassment to men and humans in general.
RLH,
Regarding maxima and minima under global warming, I got data for record-breaking local temperatures around the world since 2002 (as much data as I could find for this metric). I posted the results in 2019.
https://www.drroyspencer.com/2019/07/record-high-temperatures-in-france-3-facts-the-media-dont-tell-you/#comment-362938
3 more years of this data can now be added.
This is a count of how many record-breaking hot days, and record-breaking cold days there were at weather stations around the world for each year from 2002 to 2021.
———————————-
2002 record-breaking local temps
Maximum 204
Minimum 22
2003 record-breaking local temps
Maximum 394
Minimum 20
2004 record-breaking local temps
Maximum 113
Minimum 13
2005 record-breaking local temps
Maximum 120
Minimum 29
2006 record-breaking local temps
Maximum 145
Minimum 20
2007 record-breaking local temps
Maximum 297
Minimum 17
2008 record-breaking local temps
Maximum 90
Minimum 32
2009 record-breaking local temps
Maximum 138
Minimum 21
2010 record-breaking local temps
Maximum 505
Minimum 44
2011 record-breaking local temps
Maximum 169
Minimum 39
2012 record-breaking local temps
Maximum 296
Minimum 16
2013 record-breaking local temps
Maximum 405
Minimum 16
2014 record-breaking local temps
Maximum 217
Minimum 19
2015 record-breaking local temps
Maximum 328
Minimum 14
2016 record-breaking local temps
Maximum 323
Minimum 21
2017 record-breaking local temps
Maximum 219
Minimum 18
2018 record-breaking local temps
Maximum 435
Minimum 41
2019 record-breaking local temps
Maximum 647
Minimum 18
2020 record-breaking local temps
Maximum 354
Minimum 15
2021 record-breaking local temps
Maximum 404
Minimum 59
———————————-
As you can see, the number of record-breaking maxima far outweighs the number of record-breaking minima.
Data: 2002 – 2010, 2011 – 2020, 2021
Yes, global warming affects the distribution (and intensity) of maxima and minima.
And the reason for this is that the background temperature that extreme events occur in is warmer than before.
In the NINO3.4 region, the background temperature hasn’t changed much at all, if any. So peaks in warm temperature haven’t changed much in that region, if any.
barry…record-breaking compared to what? Most records claimed today omit pre-1960 temperature data sets. Tony Heller has covered this scam very well.
Info at bottom of page.
https://www.mherrera.org/temp.htm
RLH,
This is the notion I am replying to:
“I understand that a maximum is a maximum and yet is unaffected by AGW.”
AGW raises the ‘height’ of those maxima, because the background temperature is warmer.
The reason there are more record-breaking hot days than cold over the last 20 years is precisely because the background temperature is warmer.
The increased frequency is a result of a warmer background temperature.
It is patently obvious to Clint and others that this is a logical consequence of a warmer global surface temperature. It is also intuitively obvious. Like the difference between Winter and Summer. I do not know why it is so difficult for you to understand.
“AGW raises the ‘height’ of those maxima”
Except it doesn’t in the Nino 3.4 area as you have previously agreed.
So the FACT that a lot of natural cycles are about to change from a rising trend to a falling trend does not influence your thinking at all.
I don’t accept your premise.
But I would like you to be more specific. I am going to save your next comment to see how your prediction went.
How soon will your prediction become evident? 5 years?
Please make a testable hypothesis. A prediction that can be falsified within a given timeframe, please.
https://www.drroyspencer.com/2022/07/updated-atmospheric-co2-concentration-forecast-through-2050-and-beyond/#comment-1340043
2 to 5 years now you ask.
That’s half a testable hypothesis. Please indicate how temperatures will evolve over this time period.
I’ll tell you what I think is a reasonable hypothesis for my view regarding AGW.
The average temperatures of the past 10 years (to Dec 2021) will be cooler than the next 10 years. This will be the case regardless of the data set used.
That is a hypothesis that can be tested. Can you provide one in a similar vein, please?
“The average temperatures of the past 10 years (to Dec 2021) will be cooler than the next 10 years.”
That claim is wrong. The average temperatures of the past 10 years (to Dec 2021) will be warmer than the next 10 years.
It’s not a ‘claim’, it is a prediction. Based on physics.
RLH: “The average temperatures of the past 10 years (to Dec 2021) will be warmer than the next 10 years.”
Excellent. You have made a testable prediction.
Saved.
Now you said something about 2 to 5 years. Will you also predict that:
The average temperatures of the next 5 years will be cooler than the past 10 years.
I am willing to make a bet with you. I hope you’ll go for it, because 5 years is short enough time to likely still see you around to collect.
“the number of record-breaking maxima far outweighs the number of record-breaking minima”
So now you change from the maxima altering in height to the frequency of them instead. Even though it has been well acknowledged that during the 20th century ENSO activity has been low and only recently we have had more maxima than minima.
But L’Heureux says that La Nina is going to be more than 50% soon and as that is an indication of future cold water in the central Pacific it is quite possible that the previous history, where we are on the upside of most of the natural cycles recently, will soon change to something that favors more minima than maxima.
Both the AMO, PDO, SOI, AO and AAO all show that we are soon to be heading downwards.
https://climatedatablog.files.wordpress.com/2022/07/soi-3.jpeg
https://climatedatablog.files.wordpress.com/2022/07/pdo-1.jpeg
https://climatedatablog.files.wordpress.com/2022/07/amo-trended-1.jpeg
https://climatedatablog.files.wordpress.com/2022/07/aao.jpeg
We shall see.
https://imgur.com/CauL1SE
for the relative frequency of El Nino since the 1860.
Answered here:
https://www.drroyspencer.com/2022/07/updated-atmospheric-co2-concentration-forecast-through-2050-and-beyond/#comment-1340097
This is the notion of yours that I am contending with::
“I understand that a maximum is a maximum and yet is unaffected by AGW.”
Global warming raises the ‘height’ of those maxima, as well as the height of the minima troughs.
The reason there are more record-breaking hot days than cold over the last 20 years is precisely because the background temperature is warmer. We are getting higher peaks more often than lower troughs because the background temperature is warmer than before.
It is patently obvious to Clint and others that this is a logical consequence of a warmer global surface temperature. It is also intuitively obvious. As in – really very simple. Like the difference between Winter and Summer. A child could understand it. I do not know why it is so difficult for you to understand.
“Global warming raises the ‘height’ of those maxima”
Except in the Nino 3.4 area as you have previously agreed.
Sure. I’ve mentioned that twice in this page already. Can you progress to the next point yet?
But you continuously post as though that is not the case.
Not true. I am consistent on what I say about the NINO3.4 area, and consistent about what I say when speaking of global temperatures.
It is you having trouble understanding the difference, not me.
The future will tell who is more correct. Not you.
Your reply does not even slightly correspond to what I said. You are incoherent. It is because you are purely argumentative.
“I do not know why it is so difficult for you to understand”
I do not understand how you can ignore
https://imgur.com/CauL1SE
either.
Besides the fact that I have not ignored it, it’s completely immaterial to my point here. Take your focus off the squirrels and attend to what is being discussed, please.
To remind you of what is being discussed:
I am showing with data that AGW (or global warming) has certainly “affected maximums.”
Specifically, it has changed the distribution of record-breaking hot days compared to record-breaking cold days, when you gather information from weather stations all over the world (and refrain from cherry-picking).
That’s my point – not activity in the NINO3.4 region, which has nothing to do with what I’m saying, nor speaks against it.
I’ve provided the links for you to check the data yourself in my post just above.
“Specifically, it has changed the distribution of record-breaking hot days compared to record-breaking cold days”
So far. But I would expect that from
https://imgur.com/CauL1SE
This shows that what you say is correct but how do you see this pattern continuing into the future. A continuously rising U shape or a sinusoid?
“Both the AMO, PDO, SOI, AO and AAO all show that we are soon to be heading downwards.”
Lets see the SOI going down would mean El Nino, and warming.
PDO has recently been down at a minima, and has no where to go but up.
AMO, as you show it is not properly detrended. It may go down, but if it went all the down to the level of a century ago, that would be an unprecedented drop. Good luck with that!
The AO and AAO look like random hf noise.
Nate: Indexes are just as easily up or down, better to consider them as being previously warm or cold.
We shall see what the future brings won’t we. It will take a couple of years at least.
P.S. If you want the AMO detrended you only have to ask.
https://climatedatablog.files.wordpress.com/2022/07/amo-detrended-1.jpeg
Of all of these, only AMO is due, sometime, to move to a cooling phase.
Do you know if AMO has a large enough magnitude to reverse the present warming trend?
“how do you see this pattern continuing into the future. A continuously rising U shape or a sinusoid?”
You think that global temperatures are completely dependent on the trajectory of the “40-year moving average of ensemble ONI values greater than +1,” which is what that graph shows?
I think that is a ridiculous notion, and it has no support anywhere in the research literature.
As we have greed, ENSO does not inject heat into the climate system. It is an internal dynamic that moves heat around, mostly between ocean and surface in the mid-Pacific region. It can’t possibly be responsible for long-term global warming (or cooling).
“how do you see this pattern continuing into the future. A continuously rising U shape or a sinusoid?”
You realize that this graph is based on detrended NINO3.4 data? And this data is about 20% of the total SSTs in that area?
I do not expect a subset of a subset of SSTs, from less than 1% of the Earth’s surface, to reflect global temperatures.
“You think that global temperatures are completely dependent on the trajectory of the ’40-year moving average of ensemble ONI values greater than +1,’ which is what that graph shows?”
So all I think is that global T is strongly influenced by ENSO. That is what everybody else thinks.
“only AMO is due, sometime, to move to a cooling phase”
Not true. But we shall see won’t we.
“So all I think is that global T is strongly influenced by ENSO. That is what everybody else thinks.”
Everybody else thinks that this effect is transient – it lasts for the duration of the el Nino/la Nina event. You can see it in the spikes and troughs of the global record.
It is only you that seems to think long term global temperatures are tied to ENSO.
“Not true. But we shall see wont we.”
Oh? Which other low-frequency cycle is ‘due’ for a change to a cooler phase?
Evidence?
barry, assuming all the data are correct, isn’t that what we would expect as the planet warms out of a cold period?
If you are as serious as you pretend to be, Pup, why are you relying on an Inhofe Cheeseburger?
Yes, Clint, that’s exactly what we would expect if the planet is generally warmer over the period of record. RLH seems to want to deny this change in maxima and minima (based purely on a 2 peak SST values in the NINO3.4 region) so I’ve provided him with a more comprehensive (as in global) data set.
We have agreed that the magnitude of the maxima and minima have not changed, only the frequency.
As most natural cycles have been on the upside during the last century that is hardly surprising. If the natural cycles change to the downside as it seems most of them are going to do in the future they will not simply be an continuous upwards trajectory.
https://www.drroyspencer.com/2022/07/updated-atmospheric-co2-concentration-forecast-through-2050-and-beyond/#comment-1340043
“We have agreed that the magnitude of the maxima and minima have not changed”
What maxima and minima are you talking about?
See the Nino 3.4 un-trended data. Assuming that the central Pacific is the maxima maxima ocean that there is.
https://imgur.com/CauL1SE
is relevant here.
Ok, so you’re talking about the NINO3.4 region SSTs. Yep, the range of variability hasn’t changed.
The range of variability of ENSO hasn’t changed either.
Neither has the variability of daily temperature.
But global temperatures have changed, so when el Ninos come along, their impact on the global temperature has ever higher peaks. Even though their range of variability is the same. This is also the case for daily temperature. Generally speaking, Summer days are warmer, and so are Winter days, even though their variability around the current average (which itself is changing) is the same.
“Assuming that the central Pacific is the maxima maxima ocean that there is.”
If by this strange sentence you mean that the central Pacific has the warmest SSTs on Earth, that’s not so. And I’ve told you this twice already.
The warmest SSTs on the planet are in the Persian Gulf.
Does that mean we now have to switch our focus to the Persian Gulf? Why does it matter where the hottest SSTs are?
Based on the recent history I am unsurprised. But how do you see
https://imgur.com/a/kcrGRGr
changing in the future?
“Yep, the range of variability hasn’t changed”
https://imgur.com/CauL1SE says otherwise.
“the Persian Gulf”
covers a lot less area than the Nino 3.4 area.
https://coralreefwatch.noaa.gov/data/5km/v3.1/current/animation/gif/ssta_animation_90day_large.gif
also shows that the Persian Gulf is not changing in line with any given cycle. Unless you can determine one.
RLH,
You said:
“We have agreed that the magnitude of the maxima and minima have not changed”
but then you said:
“https://imgur.com/CauL1SE says otherwise.”
This is the problem with you being argumentative. You end up contradicting yourself.
When you have determined what you actually think I’ll be able to answer you.
the Persian Gulf
“covers a lot less area than the Nino 3.4 area.”
Have you decided that observing the highest SSTs on Earth for maxima is not so important?
“https://coralreefwatch.noaa.gov/data/5km/v3.1/current/animation/gif/ssta_animation_90day_large.gif
also shows that the Persian Gulf is not changing in line with any given cycle. Unless you can determine one.”
That data doesn’t even cover a single year and therefore is irrelevant to our discussion of long term changes over many decades. This is a very silly contribution to our conversation.
“Have you decided that observing the highest SSTs on Earth for maxima is not so important?”
Have you decided tat ENSO is not an important contributor to global T? Everybody else thinks so.
I am not sure that the Persian Gulf is considered to be so important.
What is your explanation for https://imgur.com/CauL1SE?
“Have you decided tat ENSO is not an important contributor to global T? Everybody else thinks so.”
For perhaps the 8th time:
ENSO is a transient phenomenon that affects global temperatures for the period of the significant events – el Ninos and la Ninas – for periods of between a fee months to 3 years. You can see that transient effect in the spikes and troughs of the global records.
ENSO does not contribute to long-term climate change.
RLH: “We have agreed that the magnitude of the maxima and minima have not changed”
but
RLH: “https://imgur.com/CauL1SE says otherwise.”
Have you made up your mind what opinion you hold yet, or are you going to stick with your self-contradiction?
“There is no contradiction at all in what I have said.”
Of course there is. You said:
“We have agreed that the magnitude of the maxima and minima have not changed”
And when I confirmed this you quoted me confirming it and replied:
” https://imgur.com/CauL1SE says otherwise.”
So has the magnitude of maxima and minima not changed as “we agreed”, or is it “otherwise?”
“You also seem to think that ENSO only effects the central Pacific”
Why would you say that when I have said that ENSO has regional impacts on many occasions, such as
Here
here
here
here
The issue is not with my understanding of ENSO but with your poor reading skills, and your persistent error trying to conflate spikes and troughs in NINO3.4 SSTs with long-term global temperatures.
So your belief that AGW surmounts everything is your answer to it all.
“So has the magnitude of maxima and minima not changed as ‘we agreed’, or is it ‘otherwise?'”
The maxima, aka El Nino, has not changed in magnitude since 1878.
The minima is more difficult, but the consensus appears to be that it has not changed much in that time either.
Both have been less in evidence in the early to mid 20th century.
Ok, so this:
” https://imgur.com/CauL1SE says otherwise.”
was purely argumentative because you don’t believe it.
Let’s aim to understand stuff rather than butt chests. You up for that?
“So your belief that AGW surmounts everything is your answer to it all.”
The matters you have tended to bring up to contest AGW have been transient phenomena, like ENSO events.
AGW is a multidecadal phenomenon with respect to global warming. It doesn’t counteract more transient phenomena, like weather. Weather will still always happen. ENSO will still happen. Its transient effect on global temperature will continue to occur in much the same variability of the last 170 years. If global temperature changes, the ENSO variability will continue, but against the backdrop of whatever temperature regime arises in the future, hot or cold.
So if the future is a cooling trend with more la Nnias, that longer term trend will be a stronger disindicator of AGW than the transient effects of more la Ninas. ENSO does not determine long term global temperature. ENSO DOES affect short-term (interannual) global temperature. A prevalence of one type of ENSO event in the future only offsets global temperature, at best, it doesn’t much impact long-term (multidecadal) trends.
Sunspot number: 50
Updated 29 Jul 2022
Latest SILSO numbers (EISN at the end)
2022 6 29 36
2022 6 30 42
2022 7 1 62
2022 7 2 67
2022 7 3 57
2022 7 4 65
2022 7 5 82
2022 7 6 86
2022 7 7 99
2022 7 8 92
2022 7 9 98
2022 7 10 109
2022 7 11 131
2022 7 12 115
2022 7 13 123
2022 7 14 128
2022 7 15 139
2022 7 16 158
2022 7 17 150
2022 7 18 130
2022 7 19 114
2022 7 20 142
2022 7 21 120
2022 7 22 103
2022 7 23 103
2022 7 24 84
2022 7 25 87
2022 7 26 83
2022 7 27 59
2022 7 28 45
2022 7 29 47
No need to fear.
https://drive.google.com/file/d/1WZBizGNdZJLDKBU_5flhNVsvWBYBKLXT/view
Temperature statistics will not save Europe from a looming energy crisis. The stratospheric polar vortex will provide wintry temperatures in the winter. And no statistics will help.
The shitheads in our governments are trying to kill us all.
Think about the fact that Poland will run out of coal to heat homes. Not to mention the price of coal from Colombia, Indonesia and South Africa.
The likelihood of hurricanes in the Atlantic will increase in August.
http://tropic.ssec.wisc.edu/real-time/mtpw2/webAnims/tpw_nrl_colors/natl/mimictpw_natl_latest.gif
bob d…[GR}When we talk about an electron emitting a quantum of EM, we are talking about a single frequency, not a spectrum of frequencies.
[Bob D]”Lyman, Balmer, Paschen, Brackett, Pfund, and Humphreys all say you are wrong, the single electron in a hydrogen atom emits a series of frequencies”.
***
Each one of those series represents exact and unique frequencies related to the emission of a single electron in a hydrogen atom. In the Lyman series, for example, there are several unique frequencies produced by electrons transitioning between different energy levels.
As I said, when we talk about an electron emitting a quantum of EM, we are talking about a single frequency, not a spectrum of frequencies.
In order to get a continuous spectrum, you’d need bazillions of electrons at vastly different energy levels emitting from the same source, like the Sun.
Here’s the Lyman series…all discrete frequencies, no continuous spectrum as represented by Planck.
https://en.wikipedia.org/wiki/Lyman_series#/media/File:LymanSeries.svg
All the other series are similar.
The point you are missing, as a Utility Man, is that electrons emit only at one frequency as they transition.
Gordon,
As you quoted yourself, you know you said the Hydrogen atom emits one frequency, that being the frequency of the electron as it orbits the atom.
That is what I am calling bullshit on.
The frequency of the electron orbiting the atom is not related to the frequency of the emitted photon.
Each transition has a different frequency, and it’s again, not like you claim the frequency of the electron orbiting the nucleus
I never said it was a continuous spectrum, learn to read.
Here is a cite that says the electron does not have angular momentum in the ground state.
https://www.quora.com/What-is-the-average-frequency-of-an-orbiting-electron
Kinda sucks for your case.
bob d…”As you quoted yourself, you know you said the Hydrogen atom emits one frequency, that being the frequency of the electron as it orbits the atom”.
***
I said no such thing. In previous posts I have described the Balmer series of lines and explained they were derived from electron transitions from different energy levels.
*************
“The frequency of the electron orbiting the atom is not related to the frequency of the emitted photon”.
***
Then where do you think the frequency comes from? Bohr’s theory is dependent on an electron transition having no intermediate action between energy levels. The electron must jump instantaneously between energy levels and there is no mechanism for creating a frequency in between.
It’s clear, Bob, that you have no idea how quantum theory works. It is obviously the electron, with an electric field around it, and creating a magnetic field as it orbits, is the source of emitted EM.
The electron gives up energy as it drops between levels. What kind of energy. Kinetic energy describes and energy in motion but what energy? Obviously it’s electromagnetic energy since it results in an emission of EM.
Seriously, all you alarmist, anti-science types have these miraculous theories in which EM magically appears out of nowhere…with a specific frequency. None of you can explain how EM is generated with a discrete frequency. My explanation does explain it.
The problem with your quote is a serious contradiction. The poster who claimed there is no angular momentum in the ground state also claimed it has the highest kinetic energy.
What has the KE? It’s the electron, of course. The mass in KE = 1/2mv^2 is the mass of the electron and it obviously has a velocity. If it has a velocity how can it not have an angular momentum?
I have argued in the past that the Moon has no angular momentum since angular momentum normally applies to a mass attached to an axis by a rigid connector. A tire on a rim has angular momentum, but the Moon has only linear momentum. It would be the same for an electron.
Having said that, the posters at your link are so lost in the math and the theory they fail to grasp that an electron is a real mass. No one has proved or disproved it is orbiting the nucleus, we don’t know. It needs to be understood that Schrodinger was a realist who believed an equation had to represent a reality. Therefore, it’s highly doubtful he would create an equation based on a mysterious source of electromagnetic energy with a specific frequency.
Schrodinger opted out of the quantum debate after Bohr ditched reality and began making ridiculous claims about quantum theory. Bohr endorsed entangelment theory, which means a particle in one location can affect the behavior of another particle at a distance. We are not talking electrostatic forces, we are talking sci-fi about a theory with no physical explanation.
Einstein agreed with Schrodinger, both claiming an equation with no physical reality to support it was useless. Schrodinger’s wave equation has its basis in the real world of Newtonian physics. Then Einstein undid that by claiming a non-reality like time could dilate.
Here’s a link…
https://byjus.com/jee/schrodinger-wave-equation/
“Schrodinger wave equation describes the behaviour of a particle in a field of force or the change of a physical quantity over time. Erwin Schrdinger who developed the equation was even awarded the Nobel Prize in 1933”.
And…
“Schrodinger wave equation is a mathematical expression describing the energy and position of the electron in space and time, taking into account the matter wave nature of the electron inside an atom”.
Even this explanation confuses what is meant by the alleged wave nature of an electron. Electrons have no wave phenomena as some claim. They are particles, for cripes sake. The wave nature is a reference to the electron orbiting the nucleus with a simple harmonic motion.
If you have an electrical generator and you place a mark on the rotor, you can drop a vertical line from the point onto the horizontal x-axis. The point on the x-axis traces out simple harmonic motion along the x-axis as the rotor turns. The point on the x-axis has a definite frequency. Same with the electron.
Gordon,
“Electrons have no wave phenomena as some claim. They are particles, for cripes sake.”
More bullshit, everything is both waves and particles.
How do you think an electron microscope works.
Oh wait, you have no idea.
You don’t even read the cites you post, when you do make a cite.
“Schrodinger wave equation is a mathematical expression describing the energy and position of the electron in space and time, taking into account the matter wave nature of the electron inside an atom.”
Gordon,
“The poster who claimed there is no angular momentum in the ground state also claimed it has the highest kinetic energy.”
He claimed it would have the highest kinetic energy if it was rotating, that’s why he put it in quotes.
Gordon,
“I said no such thing. In previous posts I have described the Balmer series of lines and explained they were derived from electron transitions from different energy levels.”
Stop lying, you did say the frequency of the emitted radiation is the frequency of the orbiting electron, and to be absorbed or emitted it has to match.
bobdroege, please stop trolling.
The strength of the magnetic field of the solar wind is much lower than in the 24th solar cycle.
https://i.ibb.co/2sDxZ44/onlinequery.gif
Let’s introduce to the very POWERFUL the planet surface Rotational Warming Phenomenon.
The Planet Surface Rotational Warming Phenomenon states:
Planets’ mean surface temperatures RELATE (everything else equals) as their (N*cp) products’ SIXTEENTH ROOT.
( N*cp ) ^1/16
Where
N – rotations/day, is the planet’s axial spin .
cp – cal/gr*oC, is the planet’s average surface specific heat.
This discovery has explained the origin of the formerly observed the planets’ average surface temperatures comparison discrepancies.
Earth is warmer than Moon because Earth rotates faster than Moon and because Earths surface is covered with water.
What we do in our research is to compare the satellite measured planetary temperatures.
The Planet Surface Rotational Warming Phenomenon can be expressed now also QUANTITATIVELY . And it happens so to be a very POWERFUL the planet surface warming factor.
https://www.cristos-vournas.com
“because Earths surface is covered with water”
So having a large evaporative heat sink at the surface is at least part of the reason.
christos…”Earth is warmer than Moon because Earth rotates faster than Moon and because Earths surface is covered with water”.
***
Christos…it might help to clarify that we mean average temperatures. Obviously, the Moon has one surface exposed to the Sun for 14 days therefore it gets very hot. Then that side faces away from the Sun for 14 days and gets very cold. When we average the peak hot and cold temperatures, they are lower than the Earth’s average.
The peak averages are between -180C and +106C. It’s obvious by inspection that the cold peak is almost twice as far below 0C as the hot side is above 0C. The average is not surprisingly (-180C +106C)/2 = -37C.
It does surprise me that the high is only 106C. It seem that if the Earth rotated at the same rate as the Moon, it’s high would be around 106C as well. The oceans would have boiled off long ago.
I don’t see why anyone would want to argue against the analysis of Christos. It’s blatantly obvious the difference in temperatures is due to the speed of rotation.
Gordon:
“Christosit might help to clarify that we mean average temperatures. Obviously, the Moon has one surface exposed to the Sun for 14 days therefore it gets very hot. Then that side faces away from the Sun for 14 days and gets very cold. When we average the peak hot and cold temperatures, they are lower than the Earths average.”
Yes, thank you Gordon! Every spot on planet surface experiences its peak hot and cold temperature. The less are those differences the higher is the average surface temperature for the same not reflected portion of the incident solar flux.
The (N*cp)^1\16 is the way the planet average surface temperature “responds” to that.
The faster the rotation, the less time every spot is exposed to the solar flux’ EM radiative energy, the lees the skin surface layer’s INDUCED temperature is.
The more atoms (higher surface cp) are getting exposed (INTERACTED) on the skin layer to the solar flux’ EM radiative energy, the lees the skin surface layer’s INDUCED temperature is.
https://www.cristos-vournas.com
Sometimes a thing speeds up and slows down at the same time:
> Over the past 3000 years, the core of the Earth has been speeding up a little, and the mantle-crust on which we stand is slowing down
https://www.smithsonianmag.com/smart-news/global-warming-changing-how-fast-earth-spins-180957550/
A bit like crank comments.
Less ice at the poles and more water at the equator is likely to change the rotational speeds just like an ice skater bringing in their arms does.
Water moving from the poles to the Equator will slow the Earth’s rotation.
Basic Physics
But why would water flow from the poles to the equator? Unless heated from beneath, cold water just sits pretty motionless. Gravity holds it in place, and the oceans slosh around a bit as the Moon orbits the Earth. Just up and down, and back and forth.
Don’t be misled by all the brightly coloured cartoon graphics which you see on the internet.
Of course, the forces responsible for ocean currents are chaotic in nature. Edward Lorenz (Butterfly Effect) was initially intrigued by convection currents in water, before applying chaotic behavior to convective currents in the atmosphere.
Predicting future ocean current behaviour is as impossible as predicting future climate states.
“But why would water flow from the poles to the equator? Unless heated from beneath, cold water just sits pretty motionless. ”
{It could be heated from below}
Cold water cam fill up a basin and overflow the basin {in terms of arctic ocean]. In terms of southern pole it’s more complicated, but it can flow until fills up ocean basins.
The outflow of bottom cold water of arctic ocean, makes warmer surface water come into the Arctic ocean. Southern polar ocean regions surface water are spun and open to many ocean basins.
And last I heard this outflow from Arctic has not yet been measured and measuring it from Southern Ocean would be even harder to do.
gb,
Nah. Won’t work. No cold water magically available to fill the basin. Even if there was, the water in the basin ain’t going nowhere. It just sits there.
The myth of water cooling at the North Pole, sinking, and magically deciding to move towards the Equator is just fanciful nonsense. And of course, abyssal water at the Equator is the same temperature as that at high latitudes, so magic is definitely needed to move bottom water from one place to another.
On the other hand, just applying known physical laws and chaos theory – no magic needed.
The World’s Largest Waterfall Is Deep Underwater
“Located in the little slice of ocean between Greenland and Iceland, the gigantic waterfall known as the Denmark Strait cataract is 100 miles (160 kilometers) wide. It plunges 11,500 feet (3,505 meters) straight down from the Greenland Sea into the Irminger Sea, carrying around 175 million cubic feet (5 million cubic meters) of water per second”
“The most astonishing thing about the Denmark Strait cataract isn’t, perhaps, how it got to be so tall and mighty, but that an undersea waterfall can exist at all. It’s easy to picture an ocean as a giant bathtub that sloshes around with the tides, but seawater is actually very dynamic; waters of different temperatures and salinities and, therefore, densities are always interacting on large and small scales.
The Denmark Strait cataract is formed by the difference in temperature between the ultra-cold Arctic waters of the Greenland Sea meeting those of the slightly warmer Irminger Sea. ”
https://science.howstuffworks.com/environmental/earth/oceanography/worlds-largest-waterfall-underwater-denmark-strait-cataract.htm
“The water from the Denmark Strait cataract doesn’t just hang out once it’s reached the ocean floor; it forms a massive current traveling south, replacing warmer surface water that’s flowing north. The amount of water in this massive flow equals between 20 and 40 times the sum of all river water that flows into the Atlantic.”
I guess they did measure it.
Another article:
Where is Earths Largest Waterfall?
The worlds largest waterfall is in the ocean beneath the Denmark Strait.
Last updated: 02/26/21
https://oceanservice.noaa.gov/facts/largest-waterfall.html
“In the Denmark Strait, southward-flowing frigid water from the Nordic Seas meets warmer water from the Irminger Sea. The cold, dense water quickly sinks below the warmer water and flows over the huge drop in the ocean floor, creating a downward flow estimated over 123 million cubic feet per second.”
23 million cubic feet = 3,482,972 cubic meter in a second
Or 12,538,699,200 cubic meters per hour
And there is 8760 hours in a year:
1.09839 x 10^14 cubic meter per year or
109.8 trillion cubic meter per year.
US uses about 600 billion cubic meter of water per year.
Earth ocean has:
“The volume of oceans is 1.35 billion cubic kilometres, i.e.,
1350000000000000000 cubic metres.”
1.35 x 10^18 cubic meter or less than 1/10,000th of ocean per year.
Lunar induced tides create a metre’s high bulge of water under the Moon as it orbits. That displacement has not slowed the Earth’s rotation based on recent historical evidence.
With an ice-skater spinning about an axis, the mass in the arms is significant compared to the spinning mass. I doubt if the movement of a water mass as described would offset the considerable rotating mass of the solid Earth.
Besides, if the theory is correct about ice ages, it is claimed ice built up as high as a mile in places on the Earth. That kind of mass should definitely have caused problems with the Earth’s rotational stability. Where’s the evidence?
See LOD (length of day) which has been studied well at both decadal and millennial timespans.
You really are a gullible cultist, aren’t you? People like you even believe that slow cooling is really heating!
Ah well, ignorant dimwits like yourself are obviously part of the reason that God works in mysterious ways. Either that, or you are ignorant and dim-witted for no particular reason at all!
What are your ignorant and dim-witted views on the subject?
I just noticed your comment, Mike Flynn.
Is there something you want to say?
Willard, please stop trolling.
So I have been challenged with my comments about relevant maxima being unchanged since 1878. Of course the underlying assumption is that I meant relevant maxima wrt the global temperatures, for which El Nino/La Nina are considered directly to be. I should learn to be more precise in every detail in order not to allow Barry et all to nit pick what I have said.
Richard…if Barry et al don’t find something to nitpick, they will make up something to nitpick.
When I first posted the flat trend from 1998 – 2012, Barry responded I was peddling bs. When I posted the quote from the IPCC confirming what I’d said, he replied with a red-herring argument about short term flat trends being insignificant.
The IPCC reported the 15 year flat trend in 2013, hence the reference to 2012. That flat trend continued another three years, making it 18 years total. I don’t consider an 18 year flat trend to be insignificant.
Now we are working n a 6 year flat trend.
“So I have been challenged with my comments about relevant maxima being unchanged since 1878. Of course the underlying assumption is that I meant relevant maxima wrt the global temperatures, for which El Nino/La Nina are considered directly to be. ”
You are having trouble distinguishing between “maxima” in the NINO3.4 region, and “maxima wrt the global temperatures.” That is the main source of your confusion.
“I should learn to be more precise”
Heartily agreed.
“You are having trouble distinguishing between ‘maxima’ in the NINO3.4 region, and ‘maxima wrt the global temperatures.'”
You are finding it impossible to explain how rising CO2 does not affect Nino 3.4 T.
You are very forgetful.
https://www.drroyspencer.com/2022/07/uah-global-temperature-update-for-june-2022-0-06-deg-c/#comment-1327785
“In a generally warming world there’d be no reason to expect that everywhere would warm at the same rate. There may even be a few places where it has cooled. Such as these for the past 50 years or so.
https://svs.gsfc.nasa.gov/vis/a000000/a004900/a004964/GISS2021F-Rolling1peryear-RollingAverageperyear.2021_print.jpg
If weather patterns change with climate change (and that is something you WOULD expect, even if you couldn’t predict exactly how) then with the sheer variety of weather patterns you might anticipate that some places could cool if the hydrological flow is altered. What if the prevailing wind for some place changes over time from the equator to the pole?
You see in the anomaly map above that just a few places have cooled relative to the 1951 to 1980 average. There is a time lapse of that anomaly map so you can see exactly how non-uniform weather patterns are over the Earth.
https://svs.gsfc.nasa.gov/4787”
Because you pay so little attention to what others say in reply to you, you forget what they say to you. And you don’t reply to what they say to you, preferring to repeat whatever your fixation is at the moment, which is has been the NINO3.4 region sea surface temperatures and 2 el Ninos.
Every conversation about other stuff gets hijacked by your fixation. Doesn’t matter if your obsession is tangential to the current discussion or completely unrelated to it. You just repeat like a broken record. Because you are not interested in illuminating issues, only in being argumentative.
Further to my earlier reply to you above, the oceans are expected to warm at a different rate to land, and the tropics – more slowly – because of the higher heat capacity of water compared to land.
So no, not impossible to explain at all. It’s only ‘skeptic’ goofballs who believe the Earth should behave like a featureless billiard ball and warm at the same rate everywhere.
So with your superb knowledge you will have no problem with predicting when the next El Nino will be and its relative strength compared to 2016.
Please note that ENSO is well acknowledged to have significant effects outside of just the Nino 3.4 area, such as North and South America, Europe and Africa, India and Australia.
Both these replies have nothing to do with what I said.
So I expect that before long you will once again announce that I have found it “impossible to explain how rising CO2 does not affect Nino 3.4 T.”
Because you ignored my answer yet again in order to be argumentative.
“Please note that ENSO is well acknowledged to have significant effects outside of just the Nino 3.4 area”
As I’ve said to many times.
But never fear. You’ve already switched your mind off while reading this comment, as you did the ones I’ve just linked, and you will ask me to “please note” the same thing later on.
“When I first posted the flat trend from 1998 2012, Barry responded I was peddling bs.”
THAT is bs.
I provided you at the time you first mentioned it the actual trend rate provided by the IPCC (0.05 C/decade), and alerted you to the fact that the IPCC said short term trends are uncertain and not indicative of underlying long term trends. I linked to the SPM for this.
You replied at the time with a reference to the Technical Summary, which included the word “hiatus,” and I pointed out to you that the trend given in that section was still 0.05 C/decade, and that that section also said short-term trends are uncertain and sensitive to start and end dates.
You banked your entire argumentation on the use of the word “hiatus” in the technical summary, and steadfastly refused to acknowledge everything else the IPCC said about 1998 – 2012.
I have an excellent memory, Gordon. Yours can’t be relied on, obviously.
To give you your due, Gordon, I said that IPCC had not used the word “hiatus.” When you showed that they had in the TS I immediately acknowledged it. You continued to ignore everything else the IPCC said and hung your entire argumentation on the word, not on the science.
An ice house climate is when cold oceanic water falls and a greenhouse climate is when warm oceanic water falls.
On Mars one can make warm water fall {as you can on Earth}.
On Earth you generally don’t want totally sealed house and on Mars you need a totally sealed house.
The international space station is a totally sealed house and ISS is a poor house with it’s lack of gravity is factor in making it a noisy
house and without refrigeration it would a hot house.
Making low income housing in orbit is not something we have done, but many people have considered it is possible, though it usually thought to involves very large structures, and I don’t think it require very large structures. And I tend to think they require a lot of water- and our solar system has a lot of water.
Having low income housing in space requires cheap water in space.
A reason Mars is considered most habitable planet, is it has lots of CO2 [some N2] and enough water. And the Moon, has shortage of water, CO2 [and little N2}.
Cheapest water on the moon is somewhere around $500,000 per cubic meter- if can’t get water that cheap, then water is probably not mineable. It’s “cheap” because from water, you can make rocket fuel and rocket fuel at $1000 per kg on the Moon is cheap rocket fuel on the Moon. If lunar water starts at $500,000 per cubic meter, you don’t want it to stay at the price, you want for the cost [or price] of water to lower as more water is mined. Or want lunar price to be $100,000 per cubic meter when making say 10,000 tons per year. In terms of gross sales 100,000 times 10,000 = 1 billion dollars per year. But with 100 tons which is amount you start mining lunar water:
500,000 times 100 is 50 million per year.
You are losing money if making less than 1000 tonnes per year, but any start up business starts by losing money, or they need investment dollars. So you start with say 100 tons, but to make money you have
do 1000 or 10,000 tons within the shortest time possible. And your business model, is than company will be mining millions to billion of tons of water per year, but it might not mined on the Moon. Or your business is mining water in space, which evenually involve trillion of tons of water per year. And you are starting on the Moon.
And you don’t just mine water. On Earth a iron mine would be mostly mining iron, but mining other stuff- same applies to mining water on Moon. And very significant thing you might mine other than water could be CO2.
With Mars there is more water, and rather than $500,000 per cubic meter, a cheap price is $1000 per cubic meter. And it’s not mostly about making rocket fuel, rather it’s most water for residential and industrial use, and start millions of tons of water mine per year, likewise quickly get to billions of tons per year.
The Moon could have more water than we think it does, therefore if
easier, one might start with 10,000 tons per year and much cheaper price for water- you might be mining billion tons of water per year just on the Moon, and the Moon as habitable as Mars [perhaps more habitable]
Isn’t the negative anomaly in the western equatorial Pacific breaking records this time of year?
https://i.ibb.co/qgThfwg/nino4.png
An interesting coincidence. I found these two links side by side on Moyhu.
https://wattsupwiththat.com/2022/07/29/live-corrupted-climate-stations/?utm_source=rss&utm_medium=rss&utm_campaign=live-corrupted-climate-stations
http://variable-variability.blogspot.com/2022/07/the-10th-anniversary-of-still.html
Has it really been 10 years? Time flies.
The predictable whinge is that climate gate-keepers kept the study from being published, but somehow Watts managed to get a paper on the same topic published the previous year. Couldn’t possibly be about the quality of the science could it?
Tarmac is SO representative of rural T.
RLH: “I should learn to be more precise”
This is one of those times.
As I said, Tarmac is SO representative of rural T.
That was the interesting thing about the experiment in the second link.
It showed by controlled experiment that the difference between a roadside station and a station in the middle of a field was much smaller than Watts claims.
All that money spent on USCRN was wasted then.
Don’t be silly, Richard. Multiple lines of evidence leading to the same conclusion make that conclusion stronger, i.e., reduce uncertainty — which I realize is anathema to contrarian pipe dreaming.
So why spend all that money making more accurate stations if simple ones could do as good a job?
RLH,
You need for sarcasm obscures whatever point you are trying to make. Unfortunately, you prefer to be smug than illuminate discussions, and no one benefits from this kind of contribution.
The USCRN was established in the 2000s, as work was being done to improve the US temperature record. Decisions made then were reflective of the knowledge of the time.
It’s typical of the ‘skeptic’ milieu that they trash the US temperature record because of poor siting, then complain when a network is established that can address that issue, and test whether the temperature record is robust or not.
Contrarians be contrary.
barry
Some years ago, Watts furiously ranted against the weather station located at Anchorage Airport in Alaska because it showed all the time 2 C temperature more than other stations in the near.
I searched at that time in GHCN daily (1) for Anchorage AP, (2) for a really rural station in the near, and found one in the middle of nowhere, 50 km away from the AP, the USCRN station AK Kenai 29 ENE:
https://www.google.com/maps/place/60%C2%B043'25.0%22N+150%C2%B026'53.9%22W/@60.7236,-151.0086027,122169m/data=!3m1!1e3!4m5!3m4!1s0x0:0xfd0f112dfcb37036!8m2!3d60.7236!4d-150.4483?hl=en
*
Watts’ claim was not wrong: on average, the absolute temperature of Anchorage AP was a bit over 2 C higher than that of Kenai.
But how does the difference look like when we use anomalies with annual cycle removal instead?
Here is a chart (updated with recent data till Mar 2022, and Savitzky-Golay smoothing), comparing the two on the basis of a common reference period (2011-2020):
https://drive.google.com/file/d/1OhCuDiAFUT80Ws4S8XopciaWQTp4rorn/view
So much about tarmac vs. rural.
Yes, we’ve both followed, in our own ways, the issue of weather stations and siting.
Watts was forever citing single stations and excoriating the siting issues, never doing a thorough analysis to see what effect the issues had on the US temperature record. surfacestations was actually a great project, but as data came in and reasonable people began processing the results, once you looked at larger buckets of data and understood what anomalies were and how they made absolute differences between stations redundant, it became evident that the ‘official’ temperature record was pretty good. I well remember the work of JohnV and Mosh (on climateaudit, I believe) that did the work comparing these new stations from surfacestations as they were added. It was interesting, mostly collegial work that was focussed, and endured for months.
From the period 2008 to about 2013 I collected papers and blog posts that analysed these issues, comparing rural/airport/urban/etc stations, that found insignificant differences, and sometimes small differences that were non-intuitive (like airports).
All this work was done prior to Fall et al 2011, co-authored by Anthony Watts, that found while there were trend biases for min and max temperatures between poorly and well-sited stations, the difference in trends for mean temperature between these classes was negligible.
This finding was not highlighted in the paper – it was somewhat buried – and Watts certainly didn’t allude to it in his blogposts about it.
Of course, Watts had to accept the necessity of ToB adjustments in Fall et al. Something he had pilloried for years.
More than 90% of time life’s been on Earth, Earth has had a much warmer global temperature.
How does life survive a much warmer temperature.
Well life survives in India and it’s average temperature is about 25 C.
Most of life is in the tropics, where average temperature is higher.
And a lot of life travel to polar region in the season it is warmer.
Most humans dies from cold, rather than warmth.
The word warmth is associated with life. And word death is associated with cold.
Also the News lies about many things, including the weather. If bleeds, it leads. The news want to scare people, to get more clicks.
News doesn’t like to be called fake, but they know it’s fake and they like arguing against the obvious. And funny, when they are saying they are not all about telling lies {they regard their people who get away telling lies, as best reporters, and give them awards.
It’s not argument, it too easy to make. And as far as trust, people probably trust ads, more. In theory, ads can be punished for telling lies [never happens, there is some pretense of “having to tell the truth”. Of course News has scared public with both Ice Ages and they going to die from global warming.
Anywaysm we not going to have an Ice Age, we are in an Ice Age as they teach you in elementary school [or they used to]. How they sell Al Gore lies and teach about how human evolved when world was cooling, could make the teachers even more confused then they generally are.
What is global warming. Global warming used to mean warming up from cold glaciation period.
People used to interested in why that happens. Now, they get paid to discuss how a trace gas can warm Earth. They demonize a trace gas which is essential to life, call it a poison/pollution.
People are very poorly informed.
Still we already had our global warming over 10,000 years ago, we have global warming meaning something different.
But generally speaking global warming is about causing a more uniform
temperature. As general matter, tropics has more of a uniform temperature and the Temperate Zone [where all crazy people live] has greater temperature extremes. Which related to lack of water vapor, or it drier. When planet is drier, it’s colder. Dry deserts can be hot and can be cold. Warmer winters, and warmer nights is global warming. Tropics don’t have winter or summers, they have wet and dry seasons. Tropics get the most sunlight reaching the surface, due to the sun being higher in the sky. And paradise is a tropical island paradise. Which mostly related to having a beach. A hot jungle, is only good in terms of how close it is, to the beach.
And I think we make more beaches and better surfing and have it be low income housing.
To make sure of a balanced assessment. What media says…
https://www.npr.org/2022/07/29/1114417118/because-of-climate-change-inland-flooding-is-becoming-more-common
What evidence shows:
https://www.usatoday.com/story/news/weather/2019/07/17/worst-floods-in-american-history/39692839/
The trend is up for annual rainfall in some areas.
St. Louis shows a little increase in annual rainfall but this would not suggest the recent flooding (with excessive rainfall) was from climate change. More likely a weather event like a stalled storm system so the same area continues to get rain dumped on it. This pattern may be responsible for many of the massive flood events. Is climate change causing more stalled storms? Need evidence and not opinions.
https://www.weather.gov/images/lsx/climate/STLPrecip.JPG
Norman, we need evidence for your claim that two 315 W/m^2 fluxes can add to bring a surface to 325K.
Not opinions — EVIDENCE.
You’ve said you ALWAYS support your claims.
Watts is power and not temperature.
And generally if talking sunlight, watts is how far you from the sun- assuming the sunlight isn’t scattered/blocked.
If sunlight warms something to 70 C, that which is 70 C, radiating energy expressed in watts, can not be “added”.
Sunlight can be.
On Earth one can get sunlight which goes thru enough atmosphere that it’s 315 watts of direct sunlight- which can be “added” or magnified.
Good Lord Clint R
You are for real a BOT. I had thought you were human but that thought is fading. You are a word generating BOT that takes things people post and feed it back to them.
Tim Folkerts has explained this to you many times as I have. You are not a human so cannot understand what is written. You repeat things and use some words others have posted to continue on your program.
For any human, the two fluxes are NOT what each surface emits. They are what one surface is receiving from other sources. Your false claim to fame is that fluxes do not add and you use an idiot example to convince some non-scientists of your fake knowledge. Fluxes certainly add on a receiving surface and yes two different fluxes that each contribute 315 Watts of energy to a one square meter surface will cause a blackbody to reach a steady state temperature of 325 K. You can argue this until you program blows up but you are not capable of understanding the concept no matter how many times it is clearly explained to you.
Your basic program is getting old. It is not even amusing anymore. Maybe for Ball4 but basically it just repeats endlessly. Ball on string, fluxes don’t add, cult minded idiots.
I think some with computer skills could verify you are a BOT by the repetition, lack of reasoning ability, inability to engage in discussion.
You basic program. When confused repeat. If that fails repeat again.
As you stated Norman, we “need evidence and not opinions”.
Evidence as in a “valid technical reference”.
(Hint: You won’t find any.)
Norman,
You are a delusional idiot.
Your fantasy is not supported by reproducible experiment, is it?
Temperature of real objects is not measured in terms of radiative intensity for good reason – radiative intensity does not necessarily correlate with temperature, you fool.
I assume that basic physics courses still demonstrate this phenomenon using a Leslie Cube. Read about it and weep – or just keep whining about irrelevancies.
By the way, why do you keep wasting your time talking to imaginary “bots”? No reason at all?
Oh well.
An oven thermometer measure the radiative intensity of the food in the oven.
Since radiative intensity correlates with temperature the instrument is programmed to show the temperature which correlates with the intensity measurement.
No, an oven thermometer is just a simple thermocouple.
I’m not talking about the thermocouple built into the oven. I’m talking about the IR sensitive thermometers which measure the temperature remotely.
https://www.review10best.com/uk/top10/infrared-thermometer.html
Then you’re not talking about an oven thermometer.
EM,
Quite apart from stephen p anderson being correct, you are obviously suffering from a complete lack of comprehension (typical of fact denying cultists).
I said “not necessarily”, you pillock!
Go away and play your stupid semantic diversions elsewhere.
Same as usual. A denialist loses the argument and resorts to insults.
Entropic Man, please stop trolling.
Nice summer weather in Eastern Siberia these days:
36.3 Curapca 62N
35.7 Batamaj 63N
35.0 Jakutsk 62N
For Americanistas: the temps are in C, not F.
That is SO unusual!
https://www.climatestotravel.com/climate/siberia
Scientists Are Perplexed by Mysterious Holes They Keep Finding on The Ocean Floor
FIONA MACDONALD
29 JULY 2022
https://www.sciencealert.com/scientists-perplexed-by-mysterious-holes-on-the-ocean-floor
from: https://instapundit.com/
Not enough info. I think it could have to do life or rocks or whatever they are which are not very close to holes but are somewhat near the holes.
[Or I need a wider view of it.]
“109.8 trillion cubic meter per year.”
Or 109,839 billion cubic meter or
109,839 cubic km of water per year.
“Undersea waterfalls are not a new phenomenon. Oceanographers have been studying them since the 1870s. In the early days, their great depth made them hard to study but with the appearance of modern equipment in the 1960s, further investigation became possible. Six cataracts have been discovered in the Atlantic Ocean, like for example the Ceara cataract (located between South America and Africa) or the Rio Grande cataract.”
https://xshore.com/us/news/the-earths-largest-waterfall-is-underwater
05-11-2021
Well I never heard of them before.
But I never said I was very interested in global climate.
And if ever get around exploring ocean, who knows what we will discover.
Some history.
[And the usefulness of testing nuclear weapons in the atmosphere]
An ancient article:
SCIENTIFIC AMERICAN February 1989
https://www2.whoi.edu/staff/jwhitehead/wp-content/uploads/sites/123/2017/12/1989_Whitehead_Giant_SciAmer.pdf
“The Denmark Strait cataract once again provides the prime
illustration. In 1967 L. Val Worthington of Woods Hole attempted to measure its flow rate by deploying an array of 30 current meters at various depths in the sill region. The currents were so severe that 20 of the meters were never recovered.”
RLH,
Can we confirm you understand that if global temperatures rise, the peaks in global temperature caused by el Ninos will also get higher?
If is not will.
Would you kindly answer the question?
When do you expect the next El Nino and will it be larger or smaller than 2016?
The triple dip La Nina has pumped a lot of extra heat into the Pacific Ocean. IIRC the rate of uptake by the oceans has been up from 3 to 4 zettajoules/year in recent years.
That’s a lot of extra stored heat. When it comes out in next year’s El Nino we’ll probably see a record El Nino peak and a record global annual average temperature.
“The triple dip La Nina has pumped a lot of extra heat into the Pacific Ocean.”
So all the extra cold water at the equator has increased the heat in the system. Strange logic you have.
> Strange logic you have.
Not really, Richard:
https://www.osti.gov/pages/biblio/1515583
Or to put it another way if I understand this correctly; the warmer water near the surface during El Nino is better able to shed heat into the atmosphere than colder water during La Nina can.
You could just think that cold water from the polar regions has reduced the global temperatures.
I have no idea what you’re trying to say, Richard. Please elaborate.
Your explanation does not allow for the fact that cold water in the La Nina will reduce local temperatures in the water and the air in the central Pacific. La Nina has well known pronounced effects in North and South America, Europe and Africa, India and Australia as well.
> Your explanation does not allow for the fact that cold water in the La Nina will reduce local temperatures in the water
No, Richard. La Nina cools the atmosphere of the atmosphere due to upwelling of cold water from below the surface.
> La Nina has well known pronounced effects in North and South America, Europe and Africa, India and Australia as well.
The paper takes into account energy transport to regions outside the equatorial Pacific, and again if I understand correctly, those partially offset the mechanism I have highlighted. But only partially.
RLH says: You could just think that cold water from the polar regions has reduced the global temperatures.
It has reduced global air temperature and consequently reduces Earth’s net energy radiation to space. Incoming radiation remains nominally the same, so the energy difference has to go somewhere. If not into the ocean, where do you suppose the excess is going?
Heat enters the Earth at the equator and leaves at the poles.
“La Nina cools the atmosphere of the atmosphere due to upwelling of cold water from below the surface”
That cold water at the surface is what is called La Nina. It comes from the poles(via below if you like).
No, there isn’t a marine heat exchange between the equator and the poles during ENSO events. The poleward component you might be thinking of is the Hadley Circulation, an atmospheric circulation, but even this doesn’t reach the poles. The cells stretch from the equator to the subtropics (fig 1), and influence pressure differences and winds around the equator that are directly responsible for changing the rate of heat transport in the Central Pacific.
The following description covers more of the large-scale physics, and is probably the best I’ve seen that isn’t overly technical. Really worth a read to get a good handle on the known physics of ENSO
https://worldoceanreview.com/en/wor-5/climate-change-threats-and-natural-hazards/coping-with-natural-hazards/how-el-nino-forms/
As I said, this doesn’t affect the amount of energy within the climate system, it just moves it around.
“But the surface warming and cooling during El Niño and La Niña don’t involve more or less heat energy entering or escaping the climate system as a whole. In other words, the whole climate system isn’t really cooling or warming. Heat energy that's already present in the climate system is simply shifting back and forth between the atmosphere (where it shows up in the global surface temperature value) and the deeper layers of the ocean (where it doesn't).
The changes in sea surface temperatures during El Niño and La Niña are caused and helped along by changes in the trade winds, which normally blow from east to west across the tropical Pacific Ocean. When the trade winds are stronger than normal during La Niña, the winds push more surface water to the western half of the Pacific basin. The pool of warm water grows deeper, storing excess heat at depth, and allowing for colder, deeper water to rise to the surface in the eastern half of the Pacific basin.
This wind-driven disturbance creates a large area along the equator where the ocean surface temperatures are below normal. Over the span of months to seasons, heat from the atmosphere then goes into the ocean, leading to cooler air temperatures over a region broad enough to cool down the global average temperature.
During El Niño, when the trade winds are weak or even occasionally reverse themselves, the amount of cold water that comes to the surface is reduced. Warm waters in the west Pacific Ocean slosh to the east. Now there is a large area along the equator where ocean temperatures are above normal. Heat from the ocean then goes out into the atmosphere, leading to warmer air temperatures in the Pacific and subsequently, to warmer global air temperatures (plus a cascade of other impacts).
All of this amounts to a shuffling of heat from one place (ocean) to another (the atmosphere) without affecting the Earth's overall energy budget—the balance between incoming and outgoing energy across the entire planet. So unlike volcanic eruptions, which actually block energy from the Sun from reaching the surface, or solar minimums, which reduce the total amount of energy the Sun emits, the phases of ENSO are not creating or removing energy from the climate system. La Niña hides some of Earth’s existing heat below the surface, while El Niño reveals it.”
https://tinyurl.com/53bzdppa
“When it comes out in next year’s El Nino we’ll probably see a record El Nino peak”
I will put that down as a prediction.
RLH
If you are going to comment on ENSO you need to learn more about.
First, the reason why ENSO affects the global average temperature. It shifts the balance between energy absorbed by the atmosphere and by the ocean mixed layer (the upper 700m).
La Nina increases the proportion of incoming energy absorbed by the bulk ocean. This reduces both ocean and land surface temperatures and decreases global average temperature while increasing the ocean heat content faster than usual.
El Nino decreases the proportion of energy absorbed by the bulk ocean. More energy remains at the surface and in the atmosphere.
The result is that El Nino conditions boost global average temperature by about 0.3C while La Nina conditions decrease it by 0.2C.
A triple-dip La Nina stores a lot of excess heat in the mixed layer which will turn over back to the surface come the next El Nino. That will then overheat surface and atmosphere, leading to the record year I am expecting.
I’ve based this on inference rather than detailed calculation, which probably makes it a prediction rather than a projection.
Incidentally don’t get confused between ocean surface temperatures and ocean bulk temperatures. The La Nina circulation carries warm water downwards while maintaining low ocean surface temperatures.
> Incidentally dont get confused between ocean surface temperatures and ocean bulk temperatures.
I’m pretty sure that’s what he’s doing, E-man. I also consider it possible that his “confusion” is deliberate. Difficult to know.
Barry
He’s either deliberately disingenuous or as ignorant as my goldfish. Probably both.
“La Nina increases the proportion of incoming energy absorbed by the bulk ocean”
Alternatively the cold water at the surface reduces the heat available in the central Pacific.
That cold water has to come from the poles. So the normal slow transfer of energy between the poles and the equator is short circuited for a time.
Entropic man says: . . . A triple-dip La Nina stores a lot of excess heat in the mixed layer which will turn over back to the surface come the next El Nino. That will then overheat surface and atmosphere, leading to the record year I am expecting. . . .
The strength El Nino/La Nina depends upon other factors in addition to the amount of energy stored in sub-surface waters. That we’ll see an El Nino year within the next decade or so that is globally warmer than 2016, is probably a near certainty on the fundamentals of global warming. That it will specifically be 2023 isn’t a bet I’d make.
“The La Nina circulation carries warm water downwards”
by providing cold water at the surface! Warmer now than when it arrived, not warmer compared to what was there before.
“That we’ll see an El Nino year within the next decade or so that is globally warmer than 2016, is probably a near certainty on the fundamentals of global warming.”
I rather suspect that is wrong. Time alone will tell.
So Mark B has concluded that if we do not see an EL Nino larger than the one in 2016 in the next decade, AGW is wrong.
RLH wrote:
Some locations in the polar regions produce cold, salty water due to the formation of sea-ice. This water tends to sink to the bottom of the oceans, which over millennia has produced a very cold deep ocean. AIUI, La Nina has no immediate impact on that process, but does expose cooler water near the Equator the Eastern Pacific, as strengthened trade winds push the warmer surface water toward the west.
Look at the progression of the anomalies since 30 June HERE.
The steady progression of the colder water from below to the warmer top all over the world is something that is not taken into account that much. Sure this does become more evident in the ESNO regions during La Nina but it happens all the time, everywhere.
That well see an El Nino year within the next decade or so that is globally warmer than 2016, is probably a near certainty on the fundamentals of global warming.
“I rather suspect that is wrong. Time alone will tell.”
With such a weak solar wind, there will definitely not be a strong El Nio. La Nia is prolonged for a reason. If the Kelvin wave is not strong enough, no El Nio will form.
http://www.bom.gov.au/cgi-bin/oceanography/wrap_ocean_analysis.pl?id=IDYOC007&year=2022&month=07
Warm subsurface water cools at high latitudes. Heat from below the equatorial surface disappears.
http://www.bom.gov.au/archive/oceanography/ocean_anals/IDYOC006/IDYOC006.202207.gif
https://www.tropicaltidbits.com/analysis/ocean/nino34.png
With relatively strong solar winds, La Nina’s peak is likely to occur in November, when the surface Humboldt Current is at its lowest temperature.
“So Mark B has concluded that if we do not see an EL Nino larger than the one in 2016 in the next decade, AGW is wrong.”
Nope. You really need to learn to read and comprehend.
Mark B “That we’ll see an El Nino year within the next decade or so that is globally warmer than 2016, is probably a near certainty on the fundamentals of global warming.”
You missed the nuance in time and likelihood.
Entropic,
RLH’s argumentativeness causes him to contradict himself, even within the space of a few posts. Example. It also causes reflex gainsaying in current discussions with completely off-topic remarks. Incoherence occurs fairly regularly.
It feels more like personality disorder than deliberate disingenuousness.
There is no contradiction at all in what I have said.
The graph in https://imgur.com/CauL1SE shows what happened to El Nino since the 1860s smoothed with a 40 year Moving Average, which VP says is quite a poor choice and I agree with him on that.
The question you actually need to answer is what happened to the left of that graph and will occur to the right, i.e. earlier and later than the periods covered by it.
Now we can presume that earlier is not going to be a line extending upwards towards warmer temperatures given that the little ice age lurks just to the left of it and I contend that the future to the right is not likely to be so either as it is quite easy to demonstrate that CO2 does not effect El Nino magnitudes and as you have already agreed.
Increasing La Nina, even if it only gets to 50%, means that the actual El Nino are going to be less often in the future given that some of the time it is at neutral.
You also seem to think that ENSO only effects the central Pacific whereas it it well understood that it effects climate the world over with demonstrable effects in North and South America, Europe and Africa, India and Australia.
“There is no contradiction at all in what I have said.”
I’ve answered you on the thread where this point is discussed.
https://www.drroyspencer.com/2022/07/updated-atmospheric-co2-concentration-forecast-through-2050-and-beyond/#comment-1340810
“You also seem to think that ENSO only effects the central Pacific”
I’ve answered that there, too.
No you haven’t. You have just restated that AGW surmounts everything.
Nope, you still can’t get my view right. Here it is, still in the proper thread.
https://www.drroyspencer.com/2022/07/updated-atmospheric-co2-concentration-forecast-through-2050-and-beyond/#comment-1341122
Entropic,
“When it comes out in next year’s El Nino…”
Trying to figure out how likely that will be:
“Using the aforementioned ENSO year and literature-based definitions, we find that the transition from El Niño to La Niña occurs about twice as frequently as La Niña to El Niño, which is also consistent with previous work…”
https://rmets.onlinelibrary.wiley.com/doi/pdf/10.1002/joc.7535 (p. 12)
Going by ENSO behaviour following the longest la Ninas, this current event being one of them, often an el Nino would occur within the next year, but sometimes it would be two or even three years before it would show (depending on the index).
https://origin.cpc.ncep.noaa.gov/products/analysis_monitoring/ensostuff/ONI_v5.php
https://www.webberweather.com/ensemble-oceanic-nino-index.html
“we find that the transition from El Nio to La Nia occurs about twice as frequently as La Nia to El Nio”
Interestingly I cannot find that quote in the reference you provide.
“Similar to past research, we find that ENSO events occur every 4
5 years on average, and there have been six ‘Super’ El Ninos (18771878, 18881889, 19721973, 19821983, 19971998, 20152016) that statistically rise above all other El Ninos since 1850. Finally, the time span of our work shows that El Nino events were most intense at ends of both the 19th century and the 20th century, with a lull in the mid-1900s, corroborating previous instrumental, written, and proxy records.”
Is in there though.
I thought you accepted what L’Heureux and others said about the frequency of occurrence of La Nina in the immediate future changing from the above statement. Do you disagree with what was said there?
….every 4-5 years on average….
My apologies the quote is there as you said, but that does not hold the entire picture for instance that does not negate Fig 3 or the quote I gave.
….(1877-1878, 1888-1889, 1972-1973, 1982-1983, 1997-1998, 2015-2016)….
It is noticeable that GISS and Had5 do not agree with the above (unless you assume that El Nino events do not reflect in global temperatures rises in the past).
Nothing you said negates what I quoted and has only a tangential relation to my point.
ENSO events should correspond with spikes in the global temperature record above the background temperature of the time. This is certainly evident for those events, except for the 1982/83 event, which was offset by the 1982 el Chichon volcanic eruption that depressed global temps, countering the el Nino effect.
https://tinyurl.com/mr3hcnx7
Remember that the further back in time you go the uncertainty for both temperature data and ENSO events increases, largely owing to a sparser observations.
GISS only goes back as far as 1880.
https://www.woodfortrees.org/plot/gistemp/from:1880/to:2023/mean:13
And remember that while ENSO is the primary driver of interannual global temperature variability, it is not the ONLY factor that contributes to this variability. This is most evident for the 1982/83 event, but others factors are always at play.
“ENSO events should correspond with spikes in the global temperature record above the background temperature of the time”
But does not do so significantly in the case of 1998 (at least). Except in the case of UAH.
But that’s rubbish, RLH. Let’s get a bunch of temperature records to see if “ENSO events… correspond with spikes in the global temperature record above the background temperature of the time.”
For the 1998 el Nino I choose the 10 years before and after than event as the “background temperatures.” We should be able to see if 1998 sticks out.
https://tinyurl.com/p8hsyh3m
There is definitely a spike in 4 datasets, 2 satellite and 2 surface, for 1998.
ENSO is not the only thing affecting global temps, and there is global warming over this period, so there is more to the ups and downs than the 1998 el Nino, which event is clearly present in all the global temp data sets.
“When do you expect the next El Nino and will it be larger or smaller than 2016?”
The longest gap between el Ninos is about 12 years. I think it’s fairly safe to say the next one will happen within the next 10 years. On average they occur every 3 to 6 years following an ENSO event.
Having looked deeper, I’ll predict we will get an el Nino by 2024. There is a remote chance it will happen in 2025.
To anticipate your next question, no, it will not necessarily be the highest peak yet per the global record. I believe we will see that within the next 15 years as the globe continues to warm.
So the suggestion that next year will be bigger is just plain wrong and it will take at least a decade or even 15 years for it to exceed the 2016 event.
I rather suspect that we will see something before that in the opposite direction but the future will come regardless of what we think.
I also expect the El Nino next year (or the one after) to be quite small but we shall see won’t we.
I understand Entropic’s reason for anticipating a large el Nino, but there are many processes at work transporting heat from ocean to surface. Ocean currents and other dynamics can carry away or add to the reservoir of energy that ENSO plays with.
My prediction of a peak in global temps exceeding 2015 within 15 years is based on the physics of greenhouse warming, and, loosely, the statistics of ENSO.
*2016
So what will your reaction be if the EL Nino do not rise in the the next decade?
What will you reaction be if what L’Heureux and others predict for La Nina becomes fact?
“So what will your reaction be if the EL Nino do not rise in the the next decade?”
You need to be more precise in your question. Do you mean el Nino per the ONI? Or the impact of el Nino on global temps?
“What will you reaction be if what L’Heureux and others predict for La Nina becomes fact?”
My reaction may rise to the level of “that’s interesting.”
Barry:
“You need to be more precise in your question.”
El Nino as defined by either Nino 3.4 or the ONI when comparing to 2016.
Thank you for clarifying. I actually thought more likely you were referring to el Nino impacts on global temperatures, so I’m glad we’ve cleared this up.
“El Nino as defined by either Nino 3.4 or the ONI when comparing to 2016.”
OK.
I believe that el Nino intensities are essentially random based on the data we have. Even if there is a robust reason to imagine we are currently in an el Nino ‘high’ period, as suggested by the graph of Nino values greater than +1 you have posted many, many times, I estimate it is still impossible to make a meaningful prediction about the intensity of the next el Nino. There are a maximum of 42 el Ninos over the past 170 years, ands that is too small a sample size to make generalizations from statistical analysis.
The physics are too uncertain to make a call on the very next el Nino.
“I actually thought more likely you were referring to el Nino impacts on global temperatures”
You say that individual El Nino/La Nina do not effect long term global T but do you not recognize that more or less of them in either direction during a given period WILL effect the envelope they are in? Or is that something completely beyond your grasp?
“I believe that el Nino intensities are essentially random based on the data we have”
Fig 3 (https://imgur.com/CauL1SE) proves you wrong on that point. That is most definitely NOT random.
“do you not recognize that more or less of them in either direction during a given period WILL effect the envelope they are in?””
Tired of repeating myself, RLH
https://www.drroyspencer.com/2022/07/uah-global-temperature-update-for-june-2022-0-06-deg-c/#comment-1336339
and
https://www.drroyspencer.com/2022/07/uah-global-temperature-update-for-june-2022-0-06-deg-c/#comment-1337479
“Fig 3 (https://imgur.com/CauL1SE) proves you wrong on that point. ”
Is that a trend line that you should use to predict the future RLH?
I don’t think it is. I thought we agreed we can’t extrapolate to the future just by following a line on a graph?
The graph represents the “40-year moving average of ensemble ONI values greater than +1”. You think that will help predict the specific intensity of the next el Nino, huh?
That graph doesn’t disprove the unpredictability (randomness) of individual el Nino intensity. The experts who forecast el Ninos can’t predict what the intensity of each will be. Why on Earth do you imagine anyone here could do better? Your challenges on this are insincere. What’s the point you are really trying to make?
Fig 3 shows that El Nino frequency and amplitude is now back at the same level as it was back in the 1870s.
L’Heureux has said that her own study, as well as others, show that, despite what the models show, La Nina like conditions will be more than 50% likely to be prevalent than El Nino ones from the end of this year going forwards.
But of course cold water at the equator rather than warm water cannot have ANY effect because CO2 is continuously rising /sarc.
We will see won’t we.
“But of course cold water at the equator rather than warm water cannot have ANY effect because CO2 is continuously rising /sarc.”
Transient effects yes.
Long term effects no.
You got l’Heureux’s take wrong. The 50% thing isn’t hers, it’s the Associated Press’ own calculation.
“Fig 3 shows that El Nino frequency and amplitude is now back at the same level as it was back in the 1870s.”
Amplitude yes, frequency no. Frequency of Nino values > +1 in the 1870s is among the lowest in the record. I don’t think the effect is very noticeable in terms of global temps. Not least because the global temperature profile doesn’t match that U shape over the same period.
“So the suggestion that next year will be bigger is just plain wrong”
Not what I said. Read more precisely.
Do you or do you not expect that next year will have a El Nino that will be bigger than 2016 or not.
I’ve already said:
https://www.drroyspencer.com/2022/07/updated-atmospheric-co2-concentration-forecast-through-2050-and-beyond/#comment-1340774
–The linear warming trend since January, 1979 still stands at +0.13 C/decade (+0.11 C/decade over the global-averaged oceans, and +0.18 C/decade over global-averaged land).–
Will it stay at +0.13 C/decade and/or will it reach +0.12 C or back to +0.14 C , first?
I think it will stay at +0.13 C/decade over next 4-6 months, then go to +0.12 C
Or I would say I am predicting cooling {and a fair amount- but not end of world}.
Barry: You have ducked and dived around the point, not answered it.
“My reaction may rise to the level of ‘that’s interesting'”
But not interesting enough to effect the global T (even though ENSO is well acknowledged to do just that).
“But not interesting enough to effect the global T (even though ENSO is well acknowledged to do just that).”
For the 1085th time, ENSO events affect global temperatures for their duration.
For the 1085th time, ENSO events do not have a significant impact on LONG TERM global temperatures.
Please let me know if you understand the distinction I’m making here, as I have now repeated it many times. I’m not sure that you’ve ever come to grips with understanding this simple distinction.
Please let me know if there is some lack of clarity in the way I put this that makes you not understand it.
“ENSO events affect global temperatures for their duration”
So if their duration is more or less frequent then then will affect the long term T also.
This is just like single short pulses to the high or the low side, aka Pulse Wave Modulation. If we have more in one direction than the other then the envelope will reflect that.
If you accept Fig 3 (https://imgur.com/CauL1SE) as representative of El Nino over the long term (last 160 years), then how can you argue the frequency of occurrence does not effect long term T with it rising since 1960.
If ENSO controlled long-term global temperatures then global temperatures should be the same now as they were in the 1870s per that graph you’re fixated on. Obviously, this is not the case.
No one in the ENSO research community thinks ENSO controls long term global temperature. They see it the same way I do – transient effects with respect to global surface temperature.
“If ENSO controlled long-term global temperatures then global temperatures should be the same now as they were in the 1870s per that graph youre fixated on”
So RSS, GISS and Had5 show that they are not. But they won’t even show that 1998 was the same (or nearly) as 2016.
“So RSS, GISS and Had5 show that they are not.”
So does BEST and the other reanalysis products. All global data sets that show temps from the late 1800s to present agree that temps are much warmer now than 170 years ago.
We also have a tonne of other indicators that corroborate this.
ENSO does not control long term global temps.
“But they wont even show that 1998 was the same (or nearly) as 2016.”
The globe is also warmer in the 2020s than it was in the 1990s. we were expecting for the 1998 peak to be exceeded with the next very strong el Nino and that happened.
You seem to think that if long-term global temps don’t match ENSO then something is amiss. This is a strange outlook you have, which nobody in the ENSO or temperature monitoring community shares.
Until you can come up with a good reason why the 1998 El Nino has so much less effect than 2016 one on global T then you have nothing.
RLH says: Until you can come up with a good reason why the 1998 El Nino has so much less effect than 2016 one on global T then you have nothing.
It seems that’s been done a number of times, but here again, is a graphic of UAH global temperature overlaid with an adjusted version with the estimated effect of El Nino and aerosol optical density (mostly volcanic) impacts nominally removed.
UahTltAdjMeiAod.pn
There are multiple things that drive global average temperature, but a long term rise proportional to the logarithm of atmospheric CO2 concentration plus an ENSO influence plus a volcanic influence plus a solar irradiance (not shown in figure above) is a pretty useful model of what has transpired over the last century or two.
Richard,
Using a similar multiple regression technique as Mark B.’s plot, except against HAD and GISTEMP longer term record, I don’t find that the 1998 El Nino had any less effect than 2016.
https://imgur.com/gallery/2IDOZrA
“Until you can come up with a good reason why the 1998 El Nino has so much less effect than 2016 one on global T then you have nothing.”
Don’t accept your premise, RLH.
https://southstcafe.neocities.org/UahTltAdjMeiAod.png
https://imgur.com/gallery/2IDOZrA
Hat tip Mark and Brandon.
ENSO is not the only thing affecting interannual global temperatures. Even if 1998 and 2016 were exactly the same duration and strength, other processes could mitigate or increase their impact on global T for their duration.
You have a strange idea that if the global T does not exactly match ENSO events to the second decimal point then something is amiss. I find this outlook bizarre. The ENSO research community do not expect correlation to this exactitude.
If you want to warm Earth, you can cause warmer surface ocean water into the deep ocean.
This would have to a rather large scale operation to have much effect, but the immediate result would be cooling global air temperature.
You could also do the opposite and cause global cooling but with short term warming of global air temperature.
One way would be to remove polar sea ice. You could mine polar sea ice and remove this ice from polar region.
And other way to warm global air temperature is by greening deserts.
Since we have already greened some deserts, this could count as AGW.
But it seems the greening the Sahara Desert would have a large warming effect.
One could argue that we don’t have a public interest in changing global air temperature. One could think of freezing of ocean waters, is natural way to make freshwater. And the does appear to be a public interest in having enough freshwater, and mining polar sea ice could be a way to provide freshwater to regions which need it. Though perhaps just building more dams could more effective.
It seems to be me, that it possible that most humans will not be living on the Earth surface, and if that is possible, that would be in the public interest. It seems if most people were not living on Earth surface, one would have less conflict on Earth.
Earth appears to have a shortage of cheap energy- this might change if fusion energy worked well.
I think we lacking a basic human right, which the right to live anywhere. North Korea is strong example of violation of this right, but also a global problem.
One could point to much greater and more immediate issues [such as war in Ukraine] but in terms of coming decades it seems long term goal is to have “open borders” on Earth.
But such a dream, will related to results of space exploration.
bob d…”How do you think an electron microscope works.
Oh wait, you have no idea”.
***
Is that right? I gave a full explanation of an EM a while back but I’ll do it again just to shut you up. You are not the only one who is confused about an EM, some rocket scientists think it has something to do with the sci-fi explanation about an electron having a wavelength.
An EM works like an oscilloscope or an older TV picture tube, albeit at a much higher voltage for acceleration. On an oscilloscope, electrons are boiled off a tungsten filament in a process called thermionic emission. That forms a cloud of electrons around the filament.
A high positive potential is applied to a metallic coating at the front of the cathode ray tube and it accelerates electrons toward it. En route, the electrons are focused into a beam by passing them through a cylinder with a negative potential. The beam can then be moved in a horizontal and vertical direction using plates with variable potentials to redirect the beam.
An EM works in the same manner. Electrons are accelerated toward a target (specimen) with the idea that some electrons will pass straight through to a screen behind the target. Others will be blocked or diverted, the result being a black and white depiction of whatever is in the specimen.
The process in an EM is physical and violent. The electron bombardment breaks down the specimen and measures have to be taken to protect the specimen from the electrons.
There are no wavelengths involved. When we talk about electrons moving in a conductor, no matter how many times the current reverses direction, we do not relate electrons to wavelength. Electrons moving en masse can be related to a frequency but that is a reference to how many times per second they change direction. In that regard, one can talk about a wavelength but it does not apply to a single electron’s properties but to the number of times they change direction and the measured distance between peak amplitudes in the changes.
The nonsense that electrons exhibit a wave-particle duality dates back to de Broglie in the 1920s. He was a theorist who presented that argument in his Ph.D thesis. It’s a hypothesis with no merit since electrons are physical particles. It’s part of the sci-fi side of quantum theory that lacks physical proof.
You have to understand that quantum theory as a Jekyl and Hyde element. On the good side, electronics is based on it. On the dark side, you have entanglement theory and other nonsense that is a product of imagination and consensus. Modern quantum theory is mostly bs.
David Bohm presented a quantum hypothesis that electrons exhibited a quantum potential but he did not present evidence for that. In fact, his good friend, Einstein, rejected his hypothesis when Bohm presented it to him, claiming he could not accept a science that had no physical actuality. Then, of course, he contradicted himself by presenting his relativity theory which relied on time, an idea with no physical reality to back it.
***************************
Schrodinger wave equation is a mathematical expression describing the energy and position of the electron in space and time, taking into account the matter wave nature of the electron inside an atom.
***
I have already addressed that, Bob. The ‘matter wave nature’ is a hypothesis presented by the author without explanation. Schrodinger did not accept such theories in his work. His wave equation is based purely on a physical particle moving in a field and wavelength in his equation is related to the number of times an electron orbits per second. It’s an external relationship and not an intrinsic property.
When we talk about a sinusoidal waveform produced by a rotating generator rotor, we are talking about the number of times the current produced reverses direction per second. You can see the sine wave form on an oscilloscope if you sample the changing voltage or current from the generator.
That is, the concept of a wave means different things in different contexts.
In a generator, the output voltage and current varies as the rotor turns. Although we can view it as a waveform on a scope, the physical reality is that the electromotive force producing the current is related to the angle formed by the conductors on the rotor moving through a magnetic field.
When the conductors cut the magnetic field at a 90 degree angle, the voltage is a maximum, as is the current. At any other angle, the voltage and current is reduced and falls off along a sine wave shape. The frequency of the waveform depends entirely on the rotor speed which depends on the prime mover and how the generator is geared to it. The wavelength is the length between voltage peaks.
It’s obvious this has nothing to do with individual electron properties. There is not a shred of scientific evidence to prove that electrons act like a wave, or have an inherent frequency. Electrons in an EM have no frequency since the accelerating force is a direct current potential.
There is another concept in quantum theory called electron spin. This is a purely theoretical concept derived to explain the properties of atoms with multiple electrons. No one surely believes that an electron is spinning on an axis as it orbits. Heck, we don’t even know if it orbits.
The proof of that is the quantification of spin. It is indicated as + or – and not in RPM. The real question is this: does the electron keep the same face pointed to the nucleus.
So, grab your mop and broom, Bob, and get back to work.
“Modern quantum theory is mostly bs”
Thereby spoke Gordon. About as accurately as gravity not being strong enough to obey Newton’s 3rd Law but strong enough to bend the Moon into an orbit around Earth.
You don’t understand, Richard. I am not knocking all quantum theory, as I acknowledged basic electronics theory is quantum theory just as basic chemistry is related to atomic theory and molecular theory.
This part of quantum theory can be corroborated by experiment and application. However, circa 1930, Bohr et al diverged into the sci-fi side of quantum theory, alienating Schrodinger and Einstein. That side of the theory is based on supposition and consensus with no proof it can ever work.
An example of the sci-fi side is entanglement theory. Here’s an example of the bs…
https://scienceexchange.caltech.edu/topics/quantum-science-explained/entanglement
“When two particles, such as a pair of photons or electrons, become entangled, they remain connected even when separated by vast distances”.
Einstein and Schrodinger essential called this theory crap. The proof is in the pudding, no one has ever proved entanglement theory. It’s all theoretical bs.
Decided if gravity is strong enough to obey the 3rd Law yet?
Gordon Roberstson
YOU: “Einstein and Schrodinger essential called this theory crap. The proof is in the pudding, no one has ever proved entanglement theory. Its all theoretical bs.”
https://www.extremetech.com/extreme/295013-scientists-capture-photographic-proof-of-quantum-entanglement
You are very anti-science and more cult minded like your idiot BOT Clint R. You do not accept any experiment or established physics. You go by your own “feelings” about how things should work. But you are wrong when you say this theory has not been proved. They have experiments that prove such an effect does take place. You repeat this Cult Mantra “No evidence, never been proved” Posters demonstrate this is a false declaration. This does not stop you from making up these false claims. Gallopingcamel proved you were wrong with Einstein time and mass dilation and you still don’t accept the reality of this physics. Why is it that you deny experimental and observational evidence and cling to your misguided and false opinions? What motives one such as you to cling to false views even when proven wrong? Can your cult be that strong that not even evidence works to change your status?
Hi Norman.
Are you having any luck finding a valid technical reference that two 315 W/m^2 fluxes arriving at a surface will heat the surface to 325 K?
I can imagine it’s frustrating not being able to support your claims. That’s why you’re angry and desperate all the time.
But, that’s also why I enjoy your meltdown much fun.
Clint R
Since you are stuck in an endless program loop I can’t help you. As you can surmise there would probably NOT be any specific reference to exactly two fluxes each contributing 315 W/m^2 to a surface to raise a temperature to 325 K. You can ask for such but it is unlikely such an exact request can be found. However using standard physics the answer is as given. That you don’t accept physics is a problem with your programmers. Maybe they should add a heat transfer physics textbook in your memory so you could access it.
Clint R
This could help you but the odds going against your programming are small.
Look at this link:
http://www.mhtl.uwaterloo.ca/courses/ece309_mechatronics/lectures/pdffiles/summary_ch12.pdf
Go to example 12-4 (the last one).
The total energy received by the Room is equal to both fluxes reaching the room walls. It is added. The fluxes are added so the room temperature will be hotter with two fluxes as opposed to just one. This should clear it up for you even it it is not the exact quantity you ask for.
Two fluxes reaching a surface add together and will make a room temperature higher. Best of luck with a rewrite of your cult program. It would be interesting if you could break out of it and see how flawed your program really is and how far away from any actual science.
Wrong Norman, the values given are just an example. The general form of what you believe is: two fluxes arriving at a surface simply add (F + F =2F), so that the surface is emitting 2F at steady state. The fluxes don’t have to be equal. Just show the the final surface state is emitting F1 + F2, if F1 and F2 are the arriving fluxes.
Your link is another one you can’t understand. The plates are “maintained” at their temperatures. You need to find a valid technical reference that two fluxes arriving a surface will add to the emitted flux.
First you use the excuse that you can’t match the exact numbers, then you find a link that doesn’t use the exact numbers, but doesn’t even match the problem! You’re so desperate.
Watching you twist, spin, and distort yourself into a state of maximum confusion is why this is so much fun.
Clint R
The example clearly shows the two fluxes adding to the room.
The room is receiving the combined energy of both sources. If you remove one the room gets colder. If you add it back the room warms up. The example most clearly shows fluxes add.
I do not think you can understand anything. I can go back to Roy’s actual experiment which shows the flux from the warmer lid adding enough energy to the black surface to cause its temperature to rise. You are so stupid that it is pointless to get you anything. You are not able to process information. You are a word generating BOT and not designed to analyze and think.
The example stands and it shows two fluxes adding to another surface. The amount of energy that surface receives is based upon the addition of fluxes. That means if you removed one of the heated surfaces the room temperature would receive less energy (which would lower the temperature). If you added it back the room temperature would rise. The evidence is there, you can’t understand it. You can’t understand anything regardless of how many times it has been explained to you.
Still wrong, Norman.
The situation you’re required to support, with valid technical reference, is ONE surface with TWO arriving equal fluxes which result in the surface emitting TWICE one of the fluxes. The example was 315 W/m^2 PLUS 315 W/m^2 arriving the surface, and at steady state, the surface is emitting 630 W/m^2. Your link is NOWHERE close to that. You don’t understand ANY of this.
The reason you need to be held to such nonsense is that it blows up your GHE nonsense. If your belief were valid, it would mean you could boil water with ice cubes.
Now back to your evasions, insults, and false accusations. That’s all you’ve got.
Gordon,
You don’t even have a clue.
“Schrodinger did not accept such theories in his work. His wave equation is based purely on a physical particle moving in a field and wavelength in his equation is related to the number of times an electron orbits per second. Its an external relationship and not an intrinsic property.”
Schrodinger’e equation is a wave equation, the solutions to that equation are equations that describe waves, not the motion of particles.
Some solutions can be of the form A*sin(kx) = B*cos(kx)
We are not talking about the electrical concepts that describe motors and generators.
I don’t think you have had enough math in your studies to understand this.
But it looks like you are making some progress.
“Heck, we dont even know if it orbits.”
bob d …”Schrodingere equation is a wave equation, the solutions to that equation are equations that describe waves, not the motion of particles”.
***
You are being obtuse, Robert. You fail to understand the meaning of ‘waves’
A wave, wrt a particle, like an electron, can be defined by the function, W(x,t). That is a simple function that tracks the particles x-component wrt time. In that context, a wave is nothing more than a regular oscillation which produces a wave-like shape. An oscillation, in this context, could be a particle that vibrates back and forth in a regular manner, or a particle following a circular or elliptical path in a regular manner. That describes an electron’s orbit.
Consider sound waves in the air in a room. There is no doubt that the pressure wave representing a sound wave represents many molecules of air being compressed, along with regions between pressure fronts at rarefied air pressures. At a specific audible tone, say 1 Khz, the pressure fronts vibrate 1000 times per second. The distance between pressure fronts is the wavelength of the sound at that frequency.
We can apply the same analysis to light, the difference being that sound moves through air at STP at a known velocity and light moves through the same medium at 300,000,000 metres/second. Both sound and light waves are vibrations.
There is no way to take a single molecule in air and claim it as a wave and the same applies to an electron orbiting a proton, as in hydrogen. Therefore, a lot of smoke and mirrors had to be introduced. You mentioned de Broglie, and he was doing nothing more than theorizing.
Feynman put it best when he claimed that quantum theory works but no one knows why. Schrodinger took a single electron moving in an orbit in a field and created a wave equation. How did he do that if a single electron does not behave like a wave?
He did it by treating the electron as a particle moving with simple harmonic motion in an electrostatic field. However, there was a problem. You cannot access an electron to measure its location because when you introduce instruments their action displaces the electron. Therefore, Schrodinger had to introduce a probability of finding the electron in a certain space. That probability function is the basis of molecular shapes in chemistry.
I have already explained how a voltage or current ‘waveform’ is produced by a rotating rotor in an electrical generator. The sine wave represents a varying electric field related to electrons and a varying flowing of electrons. However, you can theoretically examine the motion of one electron by applying W(x,t) to an electron moving with the rest. It’s not very practical but that wave function expression represents 1 electron, yet the electron itself cannot be defined as a wave.
In essence, the wave simply represents changes in electric field strength and electric current density. It has nothing to do with the properties of individual electrons in practice.
There are too many people doing math they don’t understand physically. I include de Broglie in that context. He had no idea whatsoever how an electron, as a particle, could also have a wave property. My description above describes how electrons move in a circuit in actuality.
I am not convinced that Schrodinger’s equation is nothing more than a mathematical fluke based on fudging math till you get an answer that represents a possible reality. Planck admitted to doing exactly that.
Since those days, no on has produced anything in quantum theory of any consequence. Some rave that quantum theory has replaced Newtonian theory, the same being claimed for Einstein’s relativity nonsense, but neither have any more application that as the basic theories in electronics and chemistry. The irony is that quantum theory is not needed in either field to understand how they work yet Newtonian mechanics is still the basis of most engineering and practical physics.
Isaac rules!!!
Gordon,
I can’t grok what you don’t understand, but Quantum Mechanics has so many modern applications.
Just a few
Many modern electronic devices are designed using quantum mechanics. Examples include the laser, the transistor (and thus the microchip), the electron microscope, magnetic resonance imaging (MRI), Global Positioning System(GPS), and computers.
The irony is you are not an engineer, yet
“The irony is that quantum theory is not needed in either field to understand how they work yet Newtonian mechanics is still the basis of most engineering and practical physics.”
And maybe you got it better before, but this statement is incomplete
“I have already explained how a voltage or current waveform is produced by a rotating rotor in an electrical generator.”
It’s produced when you have an electric field, a magnetic field and relative motion.
I am pretty much getting you now, Gordon, you reject any science that you don’t understand.
bob d…”I cant grok what you dont understand, but Quantum Mechanics has so many modern applications”.
***
Bob…don’t you have some floors to mop, some dust to sweep under a carpet?
You are merely repeating what I have already stated. With the exception of electronics and chemistry, there is little use for quantum theory. I forgot to mention university theoretical studies and those losers who think they can develop a quantum computer, or get an electron to talk to another electron a mile away.
Even in electronics and chemistry, the quantum theory is not apparent. No one teaches you quantum theory when studying electronics or chemistry, even in engineering at university. I did not know till years later that I was studying basic quantum theory.
In chemistry, you are taught about the theorized orbitals an electron can occupy and how to apply that to molecular shapes. Unless you study physics theory per se, you will never get into Schrodinger’s equation or the later modifications to it.
Again, I had no idea I was studying quantum theory. It was Linus Pauling who introduced quantum theory to chemistry in the 1920s to help explain the shape of molecules. He had gone to the UK specifically to learn the theory and using his vast experience with x-ray studies of molecules he was able to modify the theory to make it work in chemistry to figure out the shapes of molecules.
Even if you do understand the math, you will have no better understanding of quantum theory since it cannot be visualized. How convenient!!! You have a theory based purely on math that no one can prove directly. Yet some scientists tend to talk as if they do understand it, making ludicrous claims about the Bohr model being incorrect. They cannot prove it is incorrect. It is far too simplified for atoms with more than one electron but it is still the basis of modern quantum theory.
Some have bestowed that honour on Planck and Einstein but neither demonstrated the relationship between electrons in an atom and EM emission/absorp-tion. It was Bohr who got the ball rolling in that regard. Then posers like de Broglie threw in theoretical nonsense that started leading the theory astray, into a world of sci-fi..
You can apply quantum theory in electronics and chemistry but you still won’t know if the theory is correct. When I studied electrical/electronics theory in EE classes, we began at the atomic level because engineers are not interested in the fancy math underlying it. There is a layer above that theory at which even the deepest theory underlying electrical/electronics theory can begin.
For example, when you study semiconductor theory, you begin by studying how a slab of silicon is doped with other elements to proved an excess or dearth of electrons in the slab. If there is an excess of electrons it is called an N-type silicon, the opposite being a P-type silicon.
We were not particularly interested in the chemistry, the study begins when a P-type and N-type are bonded together. When that happens there is an interaction between electrons repelling each other in either slab that creates a potential hill across the junction. A silicon junction has a typical 0.7 volt potential hill across it that needs to be overcome before current will flow.
In first year chemistry, we had already learned about atomic orbitals, covalent and ionic bonds, and how they were formed by the electrons in the valence bands of atoms. Naturally, that valence band becomes a focus in the electrical/electronics field since the electrons in the valence bands form the currents we talk about.
Everything I have mentioned above is based on quantum theory. It’s not the aerey-faery, sci-fi world it is presented as in many cults, it’s rock solid physics that can be tested in the real world. The rest of it is nonsense perpetuated by idiots.
The theories I have presented in this blog about atomic structure is testable and it agrees with the 2nd law. It is also based on what I learned in electronics theory and in chemistry. I guess you missed all that.
Gordon,
As usual you don’t know what you don’t know.
“No one teaches you quantum theory when studying electronics or chemistry, even in engineering at university.”
A course in physical chemistry is required to get a degree in Chemistry, Physics, and Chemical Engineering.
So the question is, are you lying or are you ignorant?
Wait there’s more
“Unless you study physics theory per se, you will never get into Schrodingers equation or the later modifications to it.”
Yes, we study physics theory in physical chemistry.
Finding solutions to the Schrodinger’s equations is part of that.
Wait, there’s more
“Even if you do understand the math, you will have no better understanding of quantum theory since it cannot be visualized. How convenient!!! ”
Yeah right, visualization is not necessary, unless you have figured out how to visualize imaginary numbers. I haven’t but modern physics is chock full of them. Electrical engineering is also full of them.
Quantum theory is one of the most supported by evidence theories out there.
And last,
“The theories I have presented in this blog about atomic structure is testable and it agrees with the 2nd law. It is also based on what I learned in electronics theory and in chemistry.”
Where did you get the idea that electrons orbit the nucleus in atoms?
Right, that’s the Obsolete Bohr theory, and if you knew your science history you would know Bohr was instrumental in updating the theory. It is no longer considered true that electrons orbit the nucleus.
And you still don’t understand the second law, heat transfer is always from hot to cold, but that does not stop a cold object from making a warmer object warmer still.
Calling Nobel prize winners posers takes the cake.
Gordon,
“An electron microscope is a microscope that uses a beam of accelerated electrons as a source of illumination. As the wavelength of an electron can be up to 100,000 times shorter than that of visible light photons, electron microscopes have a higher resolving power than light microscopes and can reveal the structure of smaller objects.”
Look this guy up
https://en.wikipedia.org/wiki/Louis_de_Broglie
Wave-particle duality is a central part of the accepted theories of quantum mechanics.
bobdroege, please stop trolling.
Hey, Dremt, how’s it going?
Hey, Gordon. Same old, same old. I ask them to stop trolling, they just carry on anyway. One of these days they might actually stop. Who knows?
Sunspot number: 27
Updated 30 Jul 2022
“The blue dot to the right represents the number of spotless days (848) for the current cycle transition. The current projection of a high total number of spotless days makes it more likely that SC25 will be a low amplitude cycle.”
https://i.ibb.co/drKm694/SC25-SCvs-Number.png
SILSO data.
Sounds – exceptionally – quite interesting.
We will see how long it takes for real SSN, F10.7cm and Mg II data to adapt to this predictive analysis.
I am making a good MONEY (500$ to 700$ / hr. )online on my iPad .Last month my paycheck was nearly 30 k$.This online work is like drawing straight-arrow and earning money. Do not go to the office. I do not claim to be others, I just work. You will call yourself after doing this JOB, It’s a REAL job to open this web site…..www.web.slate74.com
RSS cools the past before 2008.
https://imgur.com/gallery/4MVQ8HU
https://climatedatablog.files.wordpress.com/2022/07/rss-3.jpeg
https://climatedatablog.files.wordpress.com/2022/07/uah-global-1.jpeg
Before about 2000 it agrees quite well with UAH. Between 2000 and 2008 it differs quite considerably. After about 2008 it agrees with UAH again.
In comparative terms UAH compares the 1998 El Nino as having more impact than the 2010 one whereas RSS says the opposite (after a 12 month CTRM is applied to both series).
Completely wrong analysis.
Correct is:
https://drive.google.com/file/d/1p38CfnhJVwcNMfAuNXM5ey-GXRKstrci/view
https://www.woodfortrees.org/graph/uah6/from:1979/mean:12/mean:10/mean:8/plot/rss/from:1979/mean:12/mean:10/mean:8/offset:-0.365
You are as usual stubborn and opinionated.
“Completely wrong analysis”
So you dispute VPs CTRMs which is all the above shows.
P.S. Balancing around the center does not alter things. Just makes it harder to see that the 2 are coincident before 2000 and after 2008 as mine clearly shows.
You are as usual an idiot.
“is wft with just one offset. Happier now? ”
Happier? Why?
Because you look dumber and dumber in each further reply?
Look at what you write, Linsley Hood:
” Idiot. ”
” So you dispute VPs CTRMs which is all the above shows. ”
Is that all you can offer to scientifically prove the correctness of your ‘0.23’ or ‘0.45’ ?
Insults, lies?
I use VPs CTRMs in WFT correctly and, in my own software, Savitzy-Golay correctly too.
I don’t need to play with offsets until the graphs show perfectly fitting plots.
Try to ionvent something else.
https://www.drroyspencer.com/2022/07/updated-atmospheric-co2-concentration-forecast-through-2050-and-beyond/#comment-1341405
You are wrong. Get over it.
Why not to say: UAH warms the past, and cools the present?
Apart from a simple-minded school boy manipulation using self-chosen anomaly shifts: where is the scientific evidence for your claim?
Nowhere.
https://tinyurl.com/5ycxvjt6
All offsets computed out of REAL data, as opposed to your purely invented stuff.
Single offsets will not prove what mine shows. Idiot.
“your purely invented stuff”
Now Blinny says that woodfortrees is invented (or is that CTRMs?)
https://imgur.com/gallery/bhdTr31
is wft with just one offset. Happier now?
If you believe that the El Nino of 1998 is smaller than the one of 2010 then you will be happy with RSS.
Look at MEI instead of the simple NCEP and ONI
https://psl.noaa.gov/enso/mei/img/meiv2.timeseries.png
and you understand better.
I am not ‘happy’ with any temperature series, Linsley Hood.
YOU are happy with UAH.
Apologies, here you are exceptionally right, I thought you meant 2016.
But this has nothing to do with RSS, as GISS and Had-CRUT4 have 2010 higher than 1998 as well:
https://tinyurl.com/435uk7sk
UAH is here clearly the outlier.
*
And if you extract ENSO and volcanoes out of a time series, 70 % of it remain.
*
You are totally fixated on
– UAH vs RSS;
– ENSO.
“Apologies”
Blinny finally catches on.
https://www.woodfortrees.org/plot/uah6/mean:10/mean:8/mean:6/plot/rss/mean:12/mean:10/mean:8/offset:-0.23
shows that RSS and UAH are in agreement BEFORE 2000.
https://www.woodfortrees.org/plot/uah6/mean:10/mean:8/mean:6/plot/rss/mean:12/mean:10/mean:8/offset:-0.45
shows that RSS and UAH are in agreement AFTER 2008.
He just can’t handle the above in one graph.
https://www.woodfortrees.org/plot/uah6/mean:10/mean:8/mean:6/plot/rss/mean:12/mean:10/mean:8/offset:-0.23/plot/rss/mean:12/mean:10/offset:-0.45
https://psl.noaa.gov/enso/mei/img/meiv2.timeseries.png
clearly shows that 1998 was larger than 2010. Idiot.
Indeed it shows that
“Major ENSO events were recorded in the years 179093, 1828, 187678, 1891, 192526, 197273, 198283, 199798, and 201416”
is correct. You could just try and argue that only the last one in 2016 shows up in the global temperatures as per RSS but not in UAH. Good luck with that.
….Major ENSO events were recorded in the years 1790-93, 1828, 1876-78, 1891, 1925-26, 1972-73, 1982-83, 1997-98, and 2014-16….
Linsley Hood, you keep all the time the same stalker, liar and trickster.
1. ” ‘Apologies’
Blinny finally catches on. ”
I never wrote solely ‘Apologies’, and I never needed to ‘catch on’ anything.
I wrote in fact
” Apologies, here you are exceptionally right, I thought you meant 2016. ”
*
2. Now you invent a new trick:
https://www.woodfortrees.org/plot/uah6/mean:10/mean:8/mean:6/plot/rss/mean:12/mean:10/mean:8/offset:-0.23
comparing UAH and RSS not only
– on the basis of this ridiculous ‘0.23’ offset you deliberately have chosen to get the UAH and RSS plots artificially fitting from 1979 till 2000,
but also
– on the basis of different CTRM specifications:
— for UAH: /mean:10/mean:8/mean:6
— for RSS: /mean:12/mean:10/mean:8/
You, Linsley Hood, call me an ‘idiot’.
I see that you are not only stubborn, obdurate and opinionated.
You are also brazen and dumb, exactly as are all the lunar spin deniers.
Your UAH/RSS ‘comparison’ is of exactly the same vein as are the ball-on-a-string, the merry-go-round, the coins and similar nonsensical idiocies.
*
And this, Linsley Hood, is the reason for me to repeat what I wrote above.
*
” But this has nothing to do with RSS, as GISS and Had-CRUT4 have 2010 higher than 1998 as well:
https://tinyurl.com/435uk7sk
UAH is here clearly the outlier.
*
And if you extract ENSO and volcanoes out of a time series, 70 % of it remain.
*
You are totally fixated on
UAH vs RSS;
ENSO. ”
*
Pleas continue on the same way! Your incompetence becomes more and more amazing.
“on the basis of this ridiculous ‘0.23’ offset you deliberately have chosen to get the UAH and RSS plots artificially fitting from 1979 till 2000”
There is nothing artificial about it. That is what the series and the data shows.
Like the 2 series show an offset of -0.45 after 2008. Again nothing artificial about it, just the maths.
https://www.woodfortrees.org/plot/uah6/mean:10/mean:8/mean:6/plot/rss/mean:12/mean:10/mean:8/offset:-0.23
https://www.woodfortrees.org/plot/uah6/mean:10/mean:8/mean:6/plot/rss/mean:12/mean:10/mean:8/offset:-0.45
This at just the time that RSS uses a known decaying satellite as just as good as another probably faultless new one. Just as Roy said they did.
Your as bad as GR relying on ‘feelings’ rather than what the data actually shows.
Apologies, that should have been be
https://www.woodfortrees.org/plot/uah6/mean:12/mean:10/mean:8/plot/rss/mean:12/mean:10/mean:8/offset:-0.23
and
https://www.woodfortrees.org/plot/uah6/mean:12/mean:10/mean:8/plot/rss/mean:12/mean:10/mean:8/offset:-0.45
Finger trouble I’m afraid.
You didn’t address why 1998 had so little impact on global T compared to 2010 or 2016.
Or 2020 for that matter.
https://climatedatablog.files.wordpress.com/2022/07/had5-recent.jpeg
https://climatedatablog.files.wordpress.com/2022/07/giss-recent.jpeg
https://climatedatablog.files.wordpress.com/2022/07/rss-2.jpeg
https://climatedatablog.files.wordpress.com/2022/07/uah-global-1.jpeg
“This at just the time that RSS uses a known decaying satellite”
UAH also uses the same satellite.
Both NOAA14 and NOAA15 have to be adjusted for diurnal drift. UAH and RSS handle the problem differently.
“UAH also uses the same satellite.”
No it doesn’t. That’s the whole point.
“Despite the most obvious explanation that the NOAA-14 MSU was no longer usable, RSS, NOAA, and UW continue to use all of the NOAA-14 data through its entire lifetime and treat it as just as accurate as NOAA-15 AMSU data. Since NOAA-14 was warming significantly relative to NOAA-15, this puts a stronger warming trend into their satellite datasets, raising the temperature of all subsequent satellites measurements after about 2000”
“Clearly, the RSS, NOAA, and UW satellite datasets are the outliers when it comes to comparisons to radiosondes and reanalyses, having too much warming compared to independent data.”
https://www.drroyspencer.com/2019/04/uah-rss-noaa-uw-which-satellite-dataset-should-we-believe/
RLH,
UAH use 6 years of data of the NOAA14 satellite, from July 1995 to July 2001.
You are completely wrong.
NOAA14 data runs from July 1995 to December 2004.
UAH methods paper, text from Fig. 1:
“We do not use NOAA-17 (short record), Metop (failed AMSU7), NOAA-16 (excessive calibration drifts), NOAA-14 after July, 2001…”
It’s incredible that despite being provided the methods papers for UAHv6 and RSSv4 you still haven’t read them. You are making brainless errors of fact like this all the time, inanely believing that you only have to read blog comments and look at graphs to be across the research.
High school students get Fs for this kind of basic crap. You are embarrassing yourself.
There is an idea that increasing global CO2 increase global surface air temperature.
What is known is that we are in an ice house climate or commonly called an Ice Age. And that global air temperature increases or decreases ice house climate when average temperature of the entire Ocean increases or decreases. And it’s understood that the world’s global CO2 is lower when the ocean is colder. Or when ocean is colder the ocean can hold more CO2, and the warmer ocean gets the less CO2 the ocean can hold.
Or the deeper ocean where the ocean is colder can hold more CO2, and warmer ocean surface water can hold less CO2.
Up welling of colder water bring more CO2 concentration to surface water and one gets more sea life at the surface. Or it’s well know La Nia causes more productively if sea life in area where cold water is up welling. And less predictable is that cold ocean water, can hold more CO2. Or Cold water “could” hold more CO2, but doesn’t have have more CO2. Or up welling of cold water, is sort guaranteed have more CO2, and cold water fall, could have more CO2.
One could say if cold water is highly mixed with the atmosphere such in the very windy/stormy southern ocean, there is higher confidence it will have more CO2 within the cold water.
Perhaps, due to my lack of interest in global climate issues, it’s only recently I became aware of the largest water fall on Earth which happens to be underwater {between Iceland and Greenland].
This huge underwater cataract seems like it could have higher CO2 levels but I don’t know anything about it. Or such waters maybe more isolated in terms our present atmosphere as compared to say, the roaring forties, ie, wiki: “The Roaring Forties are strong westerly winds found in the Southern Hemisphere,”
Well, google it:
Arctic Ocean full up with carbon dioxide
https://www.nature.com/articles/news.2010.372
“But research published in Science today suggests that part of the Arctic Ocean has already mopped up so much CO2 that it could have almost reached its limit”
So they are claiming quite the opposite of what thought could be the case.
But getting back to higher CO2 levels increasing global air and causing more global water vapor.
Which sounds to me like a dumb idea.
Now it said the more 90% of recent warming [in terms of decades of time] is warming the ocean.
And it’s claimed recent warming is caused higher CO2, so it’s suggest that higher CO2 levels in warming the ocean {more than 90% of warming from higher CO2 levels is warming the ocean- or that is their religion}.
But we have low CO2 levels due to cold ocean and ocean with average temperature of 6 C is or counts as a cold ocean. Many millions of years ago, we had ice house climate and had low levels of CO2.
And we say low levels being about 500 ppm or less, and ocean has cooled a lot since this time.
In most recent times {less than million years] the warmest period which lasted thousands of years, had ocean with average temperature of 4 C [or more] and had sea levels 4 to 9 meters higher than our present sea levels. And btw, our present Holocene period during it’s warmest time [lasting for thousands of years] had sea level thought to be 1 to 2 meter higher than present sea levels. Or so far, the Holocene has been cooler than past peak interglacial periods which lasted for thousands of years. But say 10 million years ago, there could been warmer interglacial periods. Or Greenland ice sheet started forming about 2.5 million years ago. So +5 million years ago
there was not a Greenland ice sheet, though large glaciers probably formed in Greenland during the colder times within the Milankovitch cycles.
Anyhow our ocean average temperature is about 3.5, and no one is claiming it will warm to about 4 C within the coming decades.
And 4 C {or 5 C} is a cold ocean.
But ocean with average temperature of 4 C is as warm as Earth has been in last million years. And ocean of 4 C will absorb CO2 over 400 ppm because it is a cold ocean, but most of CO2 stored in the ocean
will not come to surface for thousands of years, or it will immediately cause much higher fish productivity.
Anyhow, it seems optimistic that we reach 500 ppm of CO2 within a few decades or ever.
Or it’s a large part of CO2 level increase is related to China burning a lot of coal. And seems to be endless amount of natural gas, and no one wants waste money burning wood. We may not decrease the global amount Coal burning, but it seems we can will lower the amount wood and dung burning, and we will continue to be more energy efficient within next couple decades. Or it seems China like mad accelerating coal use is not going continue nor occur anywhere else in the world.
My best friend’s mother gets $66 an hour on the laptop… She has been unemployed for four months. the previous month her earnings was $21900 just working from home a few hours a day… look at this page.══════►►►www.web.slate74.com
Current solar activity.
https://i.ibb.co/bs7n9LQ/hmi1898.gif
A hurricane in the eastern Pacific, which is slowly moving north, is generating much-needed rainfall in the southwestern US.
On July 30th, a strong seismic swarm has begun just northeast of Fagradalsfjall. Trigger earthquakes are occurring east and west of Fagradalsfjall. The activity started around noon, and since then, nearly 4000 earthquakes have been recorded on the IMOs automatic system.
The most significant event so far had a preliminary magnitude of M5.4 with a depth of around 2 km (1.2 miles) and occurred on July 31st. Based on the available data, this new earthquake activity is triggered by magma movement at a depth of around 5 to 7 km (3 4 miles).
https://www.severe-weather.eu/news/powerful-earthquake-swarm-volcano-iceland-seismic-activity-2022-fa/?fbclid=IwAR0pCEwoxdROKTeTKZzP3FEgRg7OqHhjiUrXolnh2NAvoh8LImTRAgxJFlo
“Why the Sun, Not CO2, Heats the Oceans or Does Greenhouse Back-radiation Warm the Oceans?”
https://www.youtube.com/watch?v=61VxYVIHW-U
The current La Nia is unusual. The western equatorial Pacific is losing heat.
http://www.bom.gov.au/cgi-bin/oceanography/wrap_ocean_analysis.pl?id=IDYOC007&year=2022&month=07
https://www.tropicaltidbits.com/analysis/ocean/nino4.png
Not bad, except for one missing piece.
The Sun does indeed produce visible light which warms the first 10 metres of the ocean and, by mixing, the first 700m. That heat then radiates and conducts at a similar rate from the surface, keeping the ocean in approximate heat balance.
Not quite in balance, as the average bulk ocean temperature and ocean heat content are increasing. This indicates that heat is being lost from the ocean slightly slower than it is coming in.
Why? I suggest two reasons.
Atmosphere temperatures are rising. This reduces the temperature gradient between the first metre of the ocean and the air above it, and reduces the rate of heat loss.
Picking some arbitrary numbers to illustrate the principle. The ocean is at 9C, the surface film is at 8.5C and the atmosphere is at 8C. The temperature gradient is 1.0C, 0.5C between the ocean and surface film and 0.5C between the surface film and the atmosphere.
Warm the atmosphere to 8.1C. The temperature gradient between the surface film and the atmosphere drops to 0.4C and heat loss decreases accordingly.
Now increase the back radiation. This is absorbed by and warms the surface film. Most of the absorbed radiation conducts or radiates upward, so back radiation doesn’t warm the ocean much directly.
The ocean is still at 9C, the surface film rise too 8.6C and the atmosphere is 8.1C.
The gradient between surface and atmosphere recovers back to 0.5C, but the gradient between ocean and surface drops to 0.4C. The warmer surface film acts as an extra hurdle for heat loss, decreasing the rate of cooling.
The overall effect is that Increasing back radiation reduces the rate of heat loss from the ocean. The imbalance increases, more heat is retained. OHC and ocean temperature increase faster than they did before.
Increasing the back radiation does increase the temperature of the surface film. This reduces the temperature gradient
Ent, you sure love sci-fi.
A little reality for ya: You don’t KNOW OHC is increasing, that’s your BELIEF. The ocean is too big and estimates, assumptions, and measurement errors are just as big. Adding to that, we know that back-radiation can NOT warm the ocean.
But, you get high marks for the entertainment value. I read the whole thing. That’s why you’re called “Ent”!
I love these ” we know “.
Thanks Bin.
That’s nice of you to say, especially since you reject and reality.
“…reject science and reality.”
The guy in the video sounds convincing, but he makes several very flawed arguments.
1. The back radiation is absorbed in an ultra-thin skin layer, and thus isnt warming the ocean.
-Conduction quickly carries heat millimeters into the ocean, and then wave action mixes it further down.
-The NET LW radiation is upward from the surface. It is needed to help balance the solar heat gain. The back radiation REDUCES this NET LW radiative loss. The ocean must warm.
2. The skin is observed to be cooler than the subsurface, so apparently it isnt being warmed and how can heat pass downward?
-This is quite silly. That the skin is cooler doesnt mean it hasnt been warmed. Other than solar input, all other heat flow is upward and is required to balance solar heat gain. Any slight warming of the cooler surface therefore REDUCES heat loss thru the surface. A reduction in heat loss, with a steady solar heat gain, means WARMING.
3. Any warming of the skin is ‘immediately’ radiated away.
-This is quite silly. To have additional radiation from the surface, the surface MUST BE WARMER. All the heat loss from the ocean, is through that skin layer anyway. All heat loss thru that layer (now warmed slightly) will be, again, REDUCED. Again, the net effect is the ocean warms.
4. Added heat to the skin layer simply goes away and doesnt matter.
-Highly misleading. It goes SOMEWHERE. Some of it warms the near surface water by conduction, which slows cooling of the ocean. Some of it goes into extra evaporation into the lower troposphere which warms and then reduces subsequent heat loss from the surface. Added water vapor also enhances the GHE. Any extra radiation from the surface is absorbed in the atmosphere, which, AGAIN, warms, and AGAIN, reduces heat loss from the surface.
This whole ‘GHE cannot warm the ocean’ meme is completely illogical.
The July grid will be available in a few days.
Antarctica is a strange continent wrt lower troposphere temperatures.
Because in June, both the lowest and the highest anomalies in the whole LT grid (9,504 2.5 degree cells) were found there:
-71.25 -111.25 -2.07 (C)
-78.75 +58.75 +5.06
https://www.nsstc.uah.edu/climate/2022/June2022/202206_Map.png
or, for those who prefer to equally look at cell values independently of their latitude (we all know: Greenland isn’t as big as Africa, thanks)
https://drive.google.com/file/d/1vAefb_IW6jNKuGKN6clWzS1DlERIHU6-/view
Yes, the troposphere above the Arctic doesn’t look warm, and the surface won’t be better when we get newest station data.
*
No wonder that the Arctic sea ice extent currently is above all recent years:
https://drive.google.com/file/d/1QBlh325tHF-4NRlWsHf_6sgskO_ipyse/view
*
But we shouldn’t overlook that at the other Pole, the Antarctic sea ice extent conversely is below all recent years:
https://drive.google.com/file/d/1PdqOctb7zaMgvdMdX2sId1g_o7U13mM-/view
*
Strange days.
So known distortions at the poles is the best that Blinny can do. No surprise there. Distortion is what he is all about. Not maths or facts.
In a few days the correct data will appear when Roy posts it here. Until then this is last month at both poles.
North
https://climatedatablog.files.wordpress.com/2022/07/uah-nopol.jpeg
South
https://climatedatablog.files.wordpress.com/2022/07/uah-sopol.jpeg
And if you want RSS version
North
https://climatedatablog.files.wordpress.com/2022/08/rss-northern-polar.jpeg
South
https://climatedatablog.files.wordpress.com/2022/08/rss-southern-polar.jpeg
As usual: lies, lies and lies from Linsley Hood:
” So known distortions at the poles is the best that Blinny can do. ”
*
I posted above UAH’s anomaly grid for June:
https://www.nsstc.uah.edu/climate/2022/June2022/202206_Map.png
and its verifiably corresponding latitude/longitude array:
https://drive.google.com/file/d/1vAefb_IW6jNKuGKN6clWzS1DlERIHU6-/view
which I generated out of UAH’s original 2.5 degree grid:
https://www.nsstc.uah.edu/data/msu/v6.0/tlt/tltmonamg.2022_6.0
*
And what does the stalking liar and trickster?
He simply posts links to absolutely trivial processing of UAH’s monthly data, instead of technically contradicting me with data generated out of the original 2.5 degree grid, in order to prove me wrong.
Dumb, stubborn, opinionated blah blah instead of knowledgeable, creditable results.
*
Why were you, Linsley Hood, still not able to accurately process UAH grid data, as I do, as Mark B does, as MrZ does?
The answer: you are an incompetent boaster who polemically discredits below the belt, instead of providing for fair, technical contradiction.
Like all these lunar spin deniers you all name ‘idiots’, though you behave exactly as they do.
A square lat/long grid has considerable distortion at the poles.
https://en.wikipedia.org/wiki/Mercator_projection#/media/File:Mercator_with_Tissot's_Indicatrices_of_Distortion.svg
Blinny thinks that the above is all the same size circles! That is why Mercator projections (or similar square lat/long grids) should NOT be used for area comparisons.
Mollewide (which Roy uses) speaks for itself. And yes, temperature is a global distribution.
“Mollweide maps are especially used for global maps where its equal-area property helps to display global distributions”
“This projection is used appropriately where accurate areas are required”
“He simply posts links to absolutely trivial processing of UAHs monthly data”
I’m sure that Vaughan Pratt will consider the use of his CTRMs as ‘trivial’ /sarc.
Not Vaughan Pratt’s technical skill and intelligent work is trivial, Linsley Hood.
No wonder that this man got his PhD from Donald Knuth, and later on was a professor for Computing Science at Stanford U.
*
Your simple-minded use of Pratt’s work is absolutely trivial in comparison with an evaluation of UAH’s grid data – exactly what you were unable to provide since far over one year.
You are an absolute failure in comparison to Emeritus Pratt.
After the discussions I had with VP, I use his 12 CTRMs as a good, indeed excellent, LP filter. They show what they show.
The fact is that RSS and UAH only differ significantly between 2000 and 2008, with RSS having about 10 times the rate of change as UAH.
As the global series is itself a summary of the grid you so honor, how can the grid show any different?
I have that data on the UAH grid, do you wish me to do a series that shows where on Earth RSS and UAH differ over that period? That would require a gridded version of RSS and I do not think they publish that. I’m sure you will tell me if I am wrong.
Linsley Hood can post as much crackpottery as he wants. Does not matter much.
*
A correct comparison in the LT of UAH 6.0 to RSS 4.0 for the Arctic regions (above 60N) looks like this:
https://drive.google.com/file/d/1pXzAIBnCDfAZ9u-rN9A-bO3qx5P5QM5P/view
RSS 4.0’s anomaly displacement for the mean of 1991-2020 in the Arctic is 0.846 K (what anyone able to download the RSS time series easily can verify).
Blinny is desperate now. Calls the use of 12 month CTRMs ‘crackpottery’.
North Polar
https://climatedatablog.files.wordpress.com/2022/08/rss-northern-polar.jpeg
https://climatedatablog.files.wordpress.com/2022/07/uah-nopol.jpeg
South Polar
https://climatedatablog.files.wordpress.com/2022/08/rss-southern-polar.jpeg
https://climatedatablog.files.wordpress.com/2022/07/uah-sopol.jpeg
All the ‘error’ between RSS and UAH occurs during the period 2000 to 2008. Outside of that they agree quite well.
” Blinny is desperate now. Calls the use of 12 month CTRMs ‘crackpottery’. ”
” All the error between RSS and UAH occurs during the period 2000 to 2008. Outside of that they agree quite well. ”
Don’t try to manipulate us, Linsley Hood.
Not your use of CTRMs is crackpottery: your endlessly repeated nonsensical comparisons are the crackpottery par excellence.
You can compare anomaly data generated wrt two different reference periods as long as you want, and draw wrong conclusions out of that as long as you want.
You won’t convince any really experienced person.
*
Here is a comparison of CTRM to original Savitzky-Golay smoothing, performed on the anomaly data of the GHCN daily station
USW00024233 47.4444 -122.3139 112.8 WA SEATTLE TACOMA INTL AP
Linear estimate for the station’s data during 1948-2022, in C / decade: 0.25 +- 0.02
1. CTRM 12/10/8 vs. 12 month S-G
https://drive.google.com/file/d/1SNOtViZ0JCvpJN6V7MEn3_XKOtSEff1m/view
Linear estimates for the two 12 month smoothings: 0.25 +- 0.007
That’s the reason why you see only the CTRM’s green trend line, as it is above the data’s and the S-G’s lines.
2. CTRM 60/50/39 vs. 60 month S-G
https://drive.google.com/file/d/1RNnlYQ_miHixTgPvbdm2UJQ86uGmIagx/view
Linear estimates for the two 60 month smoothings: 0.24 +- 0.007
*
Come back to us when you finally will become able to process such station data in anomaly form.
Then you will have learned what anomalies really are.
Until then, you keep deliberately yourself an ignorant and opinionated person, totally fixated on artifacts.
“Dont try to manipulate us”
No manipulation, just the facts. I know you can’t live with that of course.
The CTRMs are as proposed by Vaughan Pratt. The S-G multi-pass use is as proposed by Nate Drake PhD.
Do I see you trying to refute them? Nope. Just a claim that my use of them is ‘wrong’ somehow.
So do tell me how Anomaly1 + Reference1 = Absolute = Anomaly2 + Reference2 differs from what I said.
RLH, your comparison of the UAH and RSS SoPol data is bogus. The UAH LT data if for the area between 60S and 82.5S, whereas RSS TLT data covers only 60S to 70S, which is mostly ocean. Please do try to pay attention to the facts, instead of blasting out your meaningless graphs.
The comparison stands even though the area covered is slightly different. That is true for the global series too.
Meaningless in the way that they do not show what you want? They are just a graphical representation of the various data and their differences.
Blinny still uses a single pass S-G despite being told that it leaks way too much high frequencies. Using it in a 5 pass, multi-pass methodology does not alter the low pass frequency corner, only reduces the high frequency passthrough. It is like the difference between a 1st order and a 5th order Butterworth.
https://en.wikipedia.org/wiki/Butterworth_filter#/media/File:Buttergr.jpg
A is single pass, E is 5 pass, multi-pass.
Apologies, C, D and E are for pairs, not single stages, so a 5 pass lies somewhere between C and D.
https://www.changpuak.ch/electronics/downloads/On_the_Theory_of_Filter_Amplifiers.pdf
RLH says: . . . Using it in a 5 pass, multi-pass methodology does not alter the low pass frequency corner, only reduces the high frequency passthrough. . .
No
So prove me and Nate wrong then.
Filters can be stacked end to end, both in the analogue and digital domains. I just do the digital one.
To improve your comprehension. the corner frequency is where the lines cross in
https://en.wikipedia.org/wiki/Butterworth_filter#/media/File:Buttergr.jpg
The corner frequency of a filter is defined by some level of attenuation (typically 3 dB). Each stage of a cascade will attenuate its input signal by that amount. Thus, for example, the 0.6 dB frequency of a single stage filter will become the 3 dB point of cascade of 5 such filters.
Filter theory is a niche domain, so I wouldn’t expect proficiency from the average schmuck, but you seem completely unaware how superficial is your apparent understanding of filter theory. The above is really basic stuff.
I understand filters both in the analogue and digital domain quite well thank you.
Do you dispute what cascading filters does in both domains?
What would you c all the crossing point in
https://en.wikipedia.org/wiki/Butterworth_filter#/media/File:Buttergr.jpg
I call it the corner freqency as it does not change with cascades.
P.S. Notice that if the left hand index is in dB and between 1 and 0, then the crossing point is at 3 squares or -3bB.
The figure from the wikipedia article on Butterworth filters is showing a fixed cutoff frequency with filters of progressively higher order. It is not showing the transfer function of successively more stages of the same filter.
I’m not disputing that lower order filters can be cascaded to achieve faster roll off, I’m simply pointing out that a cascade of two 2nd order filters with a 3 dB point at frequency F1 now has a 6 dB attention at F1 and a 3 dB point somewhere other than F1.
I suppose 30% is not actually -3dB but the point is that the corner frequency that I use is the point at which the pass through value does not change, i.e. the cross over point in the graph.
“It is not showing the transfer function of successively more stages of the same filter”
You get a higher order by cascading multiple lower order stages. See the 1930s paper.
https://www.changpuak.ch/electronics/downloads/On_the_Theory_of_Filter_Amplifiers.pdf
Linsley Hood
You don’t know what you are talking about.
Time series have few in common with most data needing accurate removal of noise.
High frequencies are not basically noise in time series. They are integral part of what is measured.
Instead of playing the great teacher, look at how perfectly CTRM 60/50/39 and single pass 60 month S-G fit:
https://drive.google.com/file/d/1RNnlYQ_miHixTgPvbdm2UJQ86uGmIagx/view
What matters here, Linsley Hood, is to perform smoothing such that the kernel information keeps preserved.
And that you see when observing how near the smoothing results keep to the original data.
Stop teaching, stalking, lying: start real work instead.
“You don’t know what you are talking about”
But Vaughan Pratt and Nate Drake do and I am just using what they proposed.
P.S. And its 60 + 50 + 32 (60 months/years) for a CTRM from VP and you need to compare it to a 5 pass, multi-pass S-G as Nate said.
My apologies, it is 39 so you are correct in that.
No, it’s 60/50/39.
Oh I’m correct in much, much more than you think, beginning with my USCRN anomaly-based processing
https://drive.google.com/file/d/15gED_1O6F5g5vvCulg71D3APZw9Nl9Ky/view
which you woefully discredited with your arrogant hints on subhourly data but were until now absolutely unable to technically contradict.
You are such a loser, Linsley Hood.
So do you think that USCRN data needs cosine weighting or is the distribution of the stations enough spread out already? Or are you going through 2 steps, once to get to latitude grids and then cosine weighting to get back to the ‘correct’ density?
Or are you just going to do the unequal area square lat/lon weighting like you do with UAH?
P.S. As we are only concerned with anomaly mean, middle and median, why not just plot those alone? This will allow them to cover the majority of the chart vertically and thus see their real true differences.
P.P.S As we already know that these 3 values are latitude dependent, perhaps breaking the plot into at least 3 or more latitude bands would help in the clarification.
RLH needs to be reminded that there’s almost no difference between his CTRM filter and a cosine filter (download the PDF). The difference between the two in my PDF is the result of a slight offset in the dating of the two series.
CTRMs are as proposed by Vaughan Pratt, are you suggesting that he is wrong? They are also nearly identical to a Gaussian low pass. Does that negate them. No.
https://judithcurry.com/2013/11/22/data-corruption-by-running-mean-smoothers/
If you want the effectiveness of the various cascades that VP calculated then
“2: 1.3937 Leakage 2.5% or -31.9 dB
3: 1.2067, 1.5478 Leakage 0.31% or -50.1 dB
4: 1.1252, 1.3440, 1.6275 Leakage 0.039% or -68.3 dB
5: 1.0832, 1.2343, 1.4352, 1.6757 Leakage 0.0047% or -86.5 dB”
RLH ignores the fact that theres almost no difference between his CTRM filter and a cosine filter. The cosine filter is a single pass digital smoother which is easy to implement. I see no advantage to your CTRM filter for removing high frequency variation. In any case, much of the short period variation can be taken to be noise. For climate data, the goal is to minimize the noise for further analysis.
BTW, tossing out your graphs without analysis is a waste of time.
There is almost no difference between CTRMs and Gaussian either. Either is better than a SRM (12 or 13 month in length).
Roy only produces graphs for the global set with a 13 month SRM.
https://docs.generic-mapping-tools.org/6.1/_images/GMT_App_J_2.png
Boxcar (SRM), Gaussian and Cosine compared. CTRMs are near Gaussian in response.
RLH, Your CTRM and my 25 month cosine filter both suffer the same problem, IMHO. Some of the spikes in the temperature records are from impulse like sources, such as volcanic eruptions. Our filters smooth all data and, as the result, the curves move half the energy of any impulse into dates preceding the impulse in the output series. This result will confound efforts to determine whether there are cyclic (or quasi cyclic) influences in the data, such as the ENSO or sunspot cycles.
Note that there’s other research in which attempts to remove these influences have shown an underlying warming trend in the satellite data. I think you need to think hard about what you want to achieve, especially as you’ve been doing this for a number of years with no published results.
You are wrong. No average, be that SRM, Cosine or CRTM, can move anything to outside the window its covers.
All movements, whether from impulse or natural cycles (or even CO2), still need to be accounted for in the yearly (and longer) cycles.
RLH, Sure, there is no output from the smoothers beyond their “range”, which you recognize when you extend their “range” when you add the S-G filter at the end. That doesn’t change the fact that each point’s effect within the filter is to spread the “energy” in both directions in time. That’s because the area under the smoothed curve for a step input is the same as the area under the step input.
The result is that significant short term variations appear as longer term bumps, which can fool your highly accurate eyeball into perceiving something which isn’t really there as you compare different data series, such as ENSO signals with sat temperatures.
The S-G filter suffers from well known ‘end effects’, which is why I say that it is a predictor not a projection, see:-
https://en.wikipedia.org/wiki/Savitzky%E2%80%93Golay_filter#/media/File:Lissage_sg3_anim.gif
and note the fact the end of the red line whips around like a caterpillar searching for a new leaf. (This is 3rd order curve as indicted by the yellow line but a 2nd order is similar). The position of the circles (the half way point in the window) does not alter at all.
Now you can suggest that the future data points are not a simple continuation of the trends up to that point and that is a good argument but there is little reason to say that they are not either.
So all in all I consider the S-G to be a good predictor with the caveat that at any inflexion points it is likely to be not very reliable.
….projection not a prediction….
To improve your comprehension. the corner frequency is where the lines cross in
https://en.wikipedia.org/wiki/Butterworth_filter#/media/File:Buttergr.jpg
To make it clearer the left hand axis is in linear steps from 1.0 to 0.0. To make this in log (dB) they would require to be
1.0 = -0.0 dB
0.9 = -0.458 dB
0.8 = -0.969 dB
0.7 = -1.55 dB This is the balance point above.
0.6 = -2.22 dB
0.5 = -3.01 dB
0.4 = -3.98 dB
0.3 = -5.23 dB
0.2 = -6.99 dB
0.1 = -10.0 dB
0.0 = Infinity dB.
The -3dB line is the one often quoted in dB terms.
One elephant in the room stands out:
there is no need for net zero to lower atmospheric co2 levels.
This model is flawed because fails to recognise the Equivalence Principle and assumes anthropognic sources are the reason for CO2 increase. Given only 4% of the sources are man made and the residence time is short (4 years according to the IPCC Carbon Model), only 4% of the CO2 in the atmosphere can be AGW, or about 18ppm. Therefore the bulk of the increase from 360ppm to 420ppm (less humans 4%) must be from natural sources.
This is explained by Dr Ed Berry in this paper
https://edberry.com/blog/climate/climate-co2-temp/preprint-a-fatal-flaw-in-global-warming-science/
No the error with Berry is that he does nor consider net CO2 flow. E.g. my two guinea pigs have a huge annual CO2 turnover, yet on an annual basis they are net CO2 sinks.
The Berry model is flawed because fails to recognise the long established constraints on ocean uptake of carbon. In general, he disregards most of what has been learned about the carbon cycle over many decades.
Great! Based on the model of constant 2% excess CO2 removal, what is the mean lifetime of excess atmospheric CO2? Surely about 50 years. How does this compare with IPCC estimates, and how much lower is the “warming potential” of CO2 (extrapolated to 2100) if their case is replaced by your model?
speak for you.
comprare patente di Guida
The surface of a sphere hit by (parallel) solar radiation is
2πR²
But to obtain the total solar radiation hitting that hemisphere, you have to weight the radiation with the square of the cosine of the radiation’s angle of incidence on the surface.
Integrating cos²(α)dα from 0 to π/2 gives 0.5.
good
Indeed
This is a great blog. Very informative. I love and appreciate the use of simple language to explain complex and key concepts in this field. To students who may need pay for assignment to be done I recommend My Homework Writers. They serve students all over the globe, are professional, and deliver jobs within the stipulated time frame.
Flynnson
Vous êtes vraiment le pire crétin au sein de ce blog, un vrai cancre, et un onaniste en plus.
Vous n'êtes pas capable de vous exprimer ni dans ma langue maternelle, le français, ni dans ma langue du quotidien, l'allemand; mais vous avez néanmoins le toupet de me reprocher une minuscule faute lorsque je m'exprime en anglais!
Casse-toi, pauvre con, et va éjecter to sperme ailleurs, par exemple sur Truth Social. Trump appréciera sans nul doute le degré de ta stupidité.