
 Home/Blog
Key Points
- Contrary to claims that drought is causing Lake Mead water levels to fall, the Colorado River natural flows into Lake Mead show no long-term trend since 1930.
- Decadal time scale variations in river flow do occur, though, related to the Pacific Decadal Oscillation (PDO).
- Since about 2000, use of Lake Mead water has exceeded river inflow, causing water levels to drop. The negative phase of the PDO since that time has exacerbated the problem.
Natural Water Flows into Lake Mead: No Long-Term Trend
Record low water levels in Lake Mead are widely blamed on drought, although what “drought” means is seldom specified. The public perception is that lower precipitation amounts have reduced water supply to Lake Mead (which comes from the Colorado River), usually attributed to human-caused climate change, and that this is why water levels are falling.
But data from the U.S. Bureau of Reclamation (USBR) show that there has been no long-term trend in natural Colorado River flow into Lake Mead:
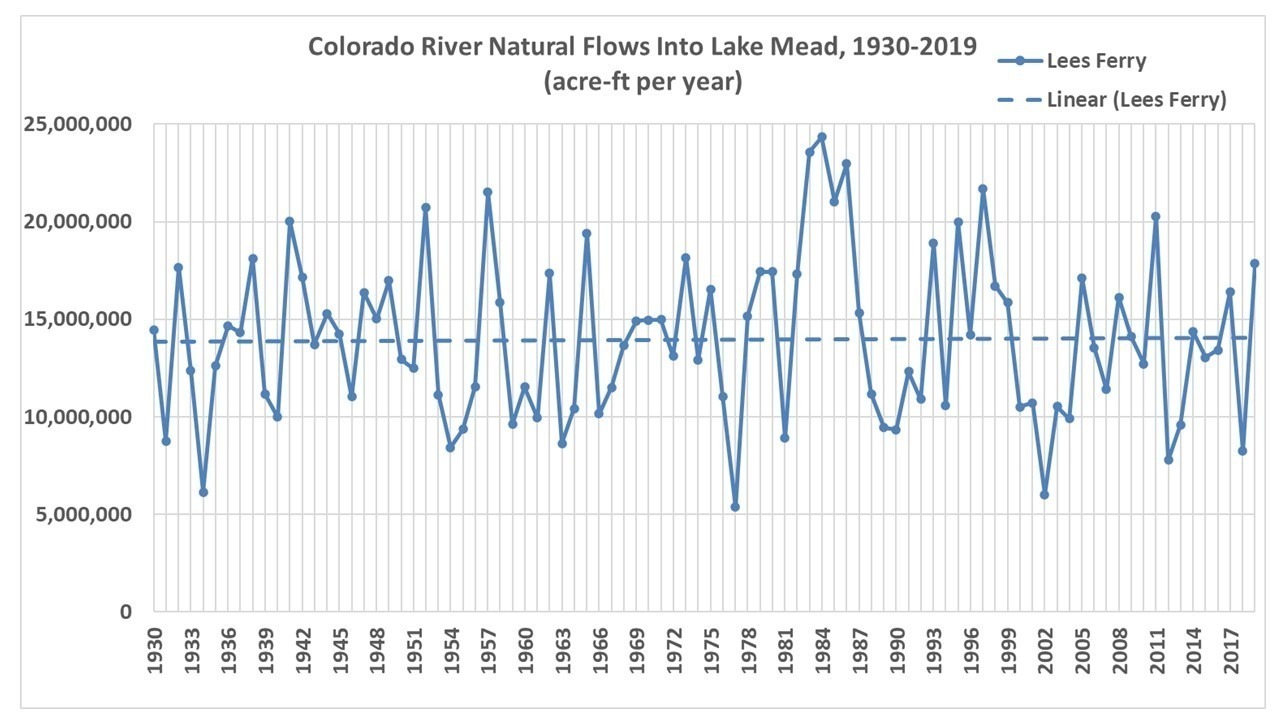
Fig. 1. Yearly “natural” water flows into Lake Mead, corrected for local human-induced changes in water flow upstream. Details of those corrections are described here. Data source here.
The flows in Fig. 1 have been slightly adjusted for local human-caused changes to the flows upstream, and provide our best answer to the question of whether long-term global climate change is responsible for a decrease of river water flow into Lake Mead.
The answer is “no”.
Does Climate Change Theory Even Predict Reduced Precipitation? No
The next question is, does climate change even predict future reductions of precipitation over the Colorado River watershed? The following plot shows an average of 183 climate model simulations of average yearly precipitation in an area approximating the Colorado River watershed. The models suggest a slight increase in total precipitation with warming.
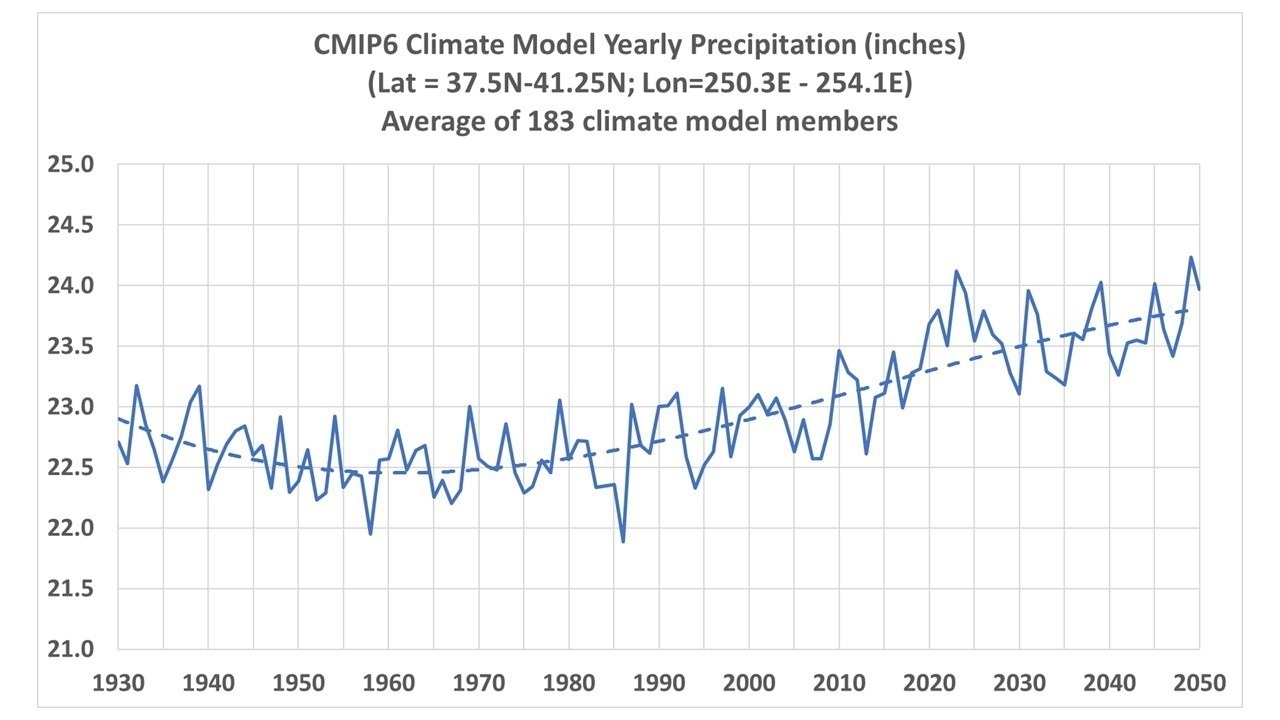
Fig. 2. CMIP6 model average yearly precipitation 1930-2050 over an area approximating the upper Colorado River watershed. Data source here.
Most of the water entering Lake Mead is from snowmelt in the mountains; little of the water falling on lower elevations tends to be used by local vegetation with little runoff reaching the Colorado River. Fig. 3 shows there has been no long-term trend in the snowpack measurements in the upper Colorado River watershed.
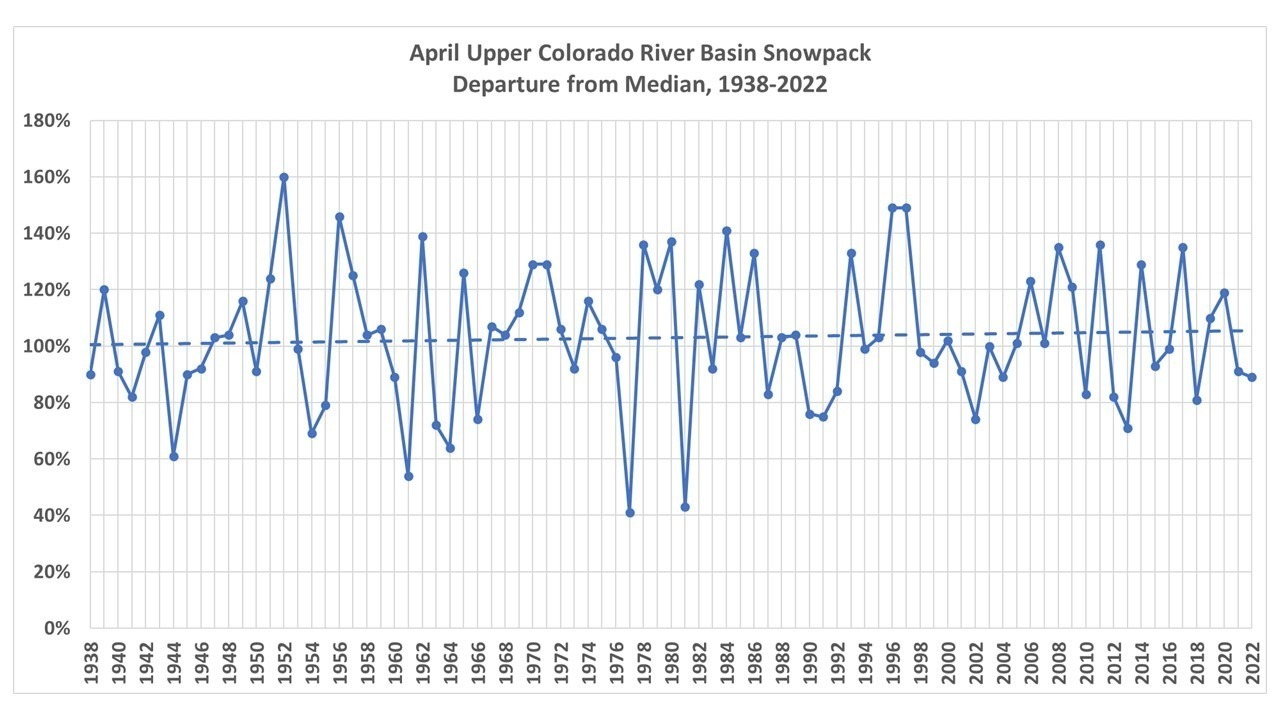
Fig. 3. April snowpack measurements in the upper Colorado River watershed, 1938-2022.
So, not only has there been no observed long-term reduction in water flow into Lake Mead, or reduction in the watershed snowpack, climate change theory doesn’t even support such a change up to the current time (or even to 2050).
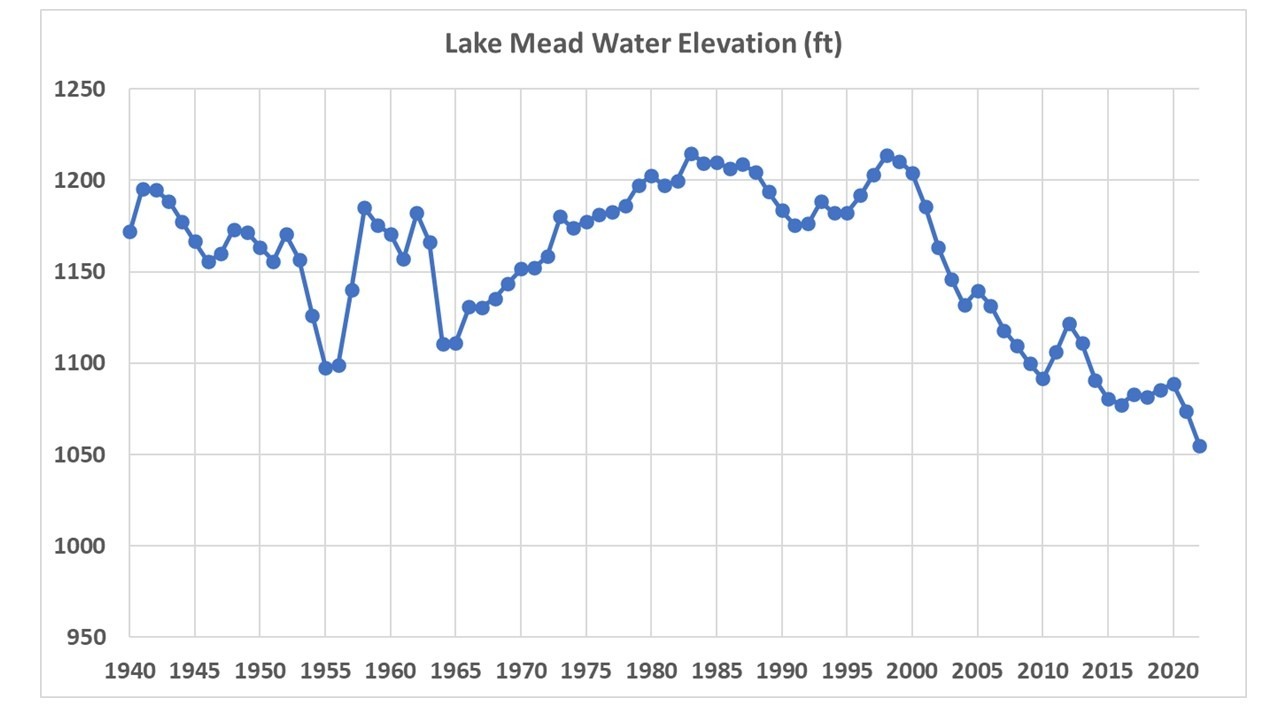
So, Why are Lake Mead Water Levels Falling?
What has changed since Hoover Dam was constructed in the 1930s is the amount of water being removed from Lake Mead. Since about 2000, that water use has exceeded the water input into the lake. This is the most recent available demonstration of that fact, published in 2012:
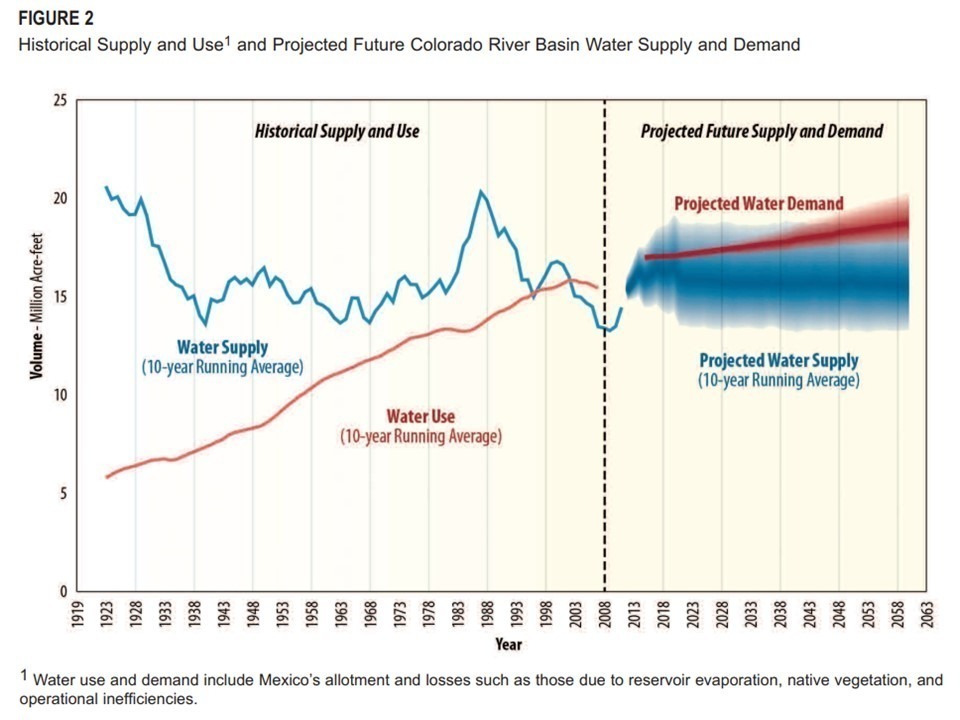
Fig. 4. The Colorado River basin water supply exceeded demand up until the year 2000 or so, and since then Lake Mead water levels have fallen due to overuse.
As long as water use exceeds supply, Lake Mead water levels will continue to fall. (This is somewhat dependent upon the regulated releases from Lake Powell, upstream. There is a “Fill Mead First” initiative that would draw down Lake Powell in an attempt to raise Lake Mead, based upon calculations that net natural water losses from combined evaporation and bank seepage from Mead and Powell would be reduced.)
The Role of the Pacific Decadal Oscillation (PDO) in the Current Problem
While the major problem with Lake Mead is overuse, there are multi-decadal fluctuations in Colorado River flows which have made matters worse since approximately 2000. If we take the river flow data in Fig. 1 and compute the accumulated departures from the long-term average flow (because this is how a reservoir like Lake Mead responds), we find that there have been periods of lesser and greater flows.
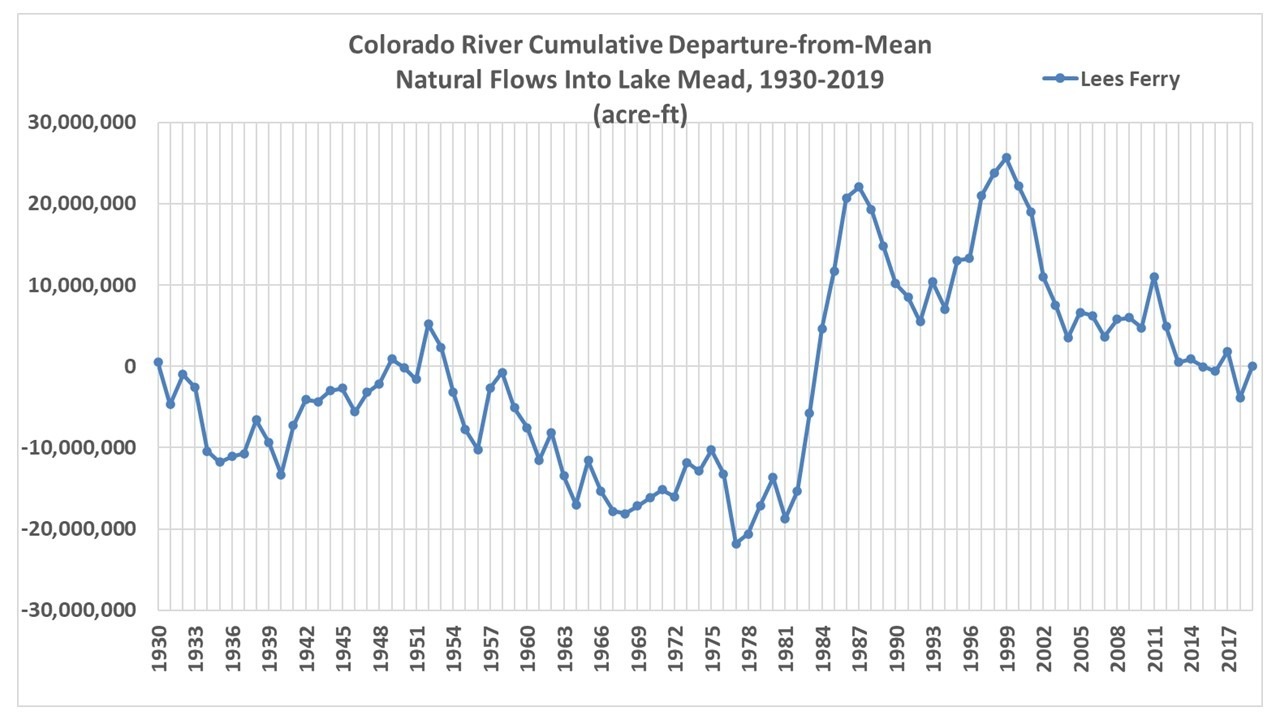
Fig. 5. As in Fig. 1, except time-accumulated departures-from-average Colorado River flows into Lake Mead.
Before the 1980s, there was somewhat reduced river flow into Lake Mead, but it made little difference because water use (Fig. 4) was still low.
Then from the 1982-83 super El Nino year to approximately 2000 there were above average flows, so Lake Mead could handle the increasing water usage. In fact, the lake reached near full-pool status.
But as usage peaked around 2000, river input to the lake was reduced once again. This put Lake Mead into an unsustainable state where more water was being extracted than the Colorado River could replenish it.
It has been long known (e.g. here) that precipitation in this region is affected by El Nino (more precip) and La Nina (less precip). Also, the Pacific Decadal Oscillation (PDO), which is basically a low-frequency manifestation of El Nino and La Nina activity is related to precipitation in this area.
I computed the cumulative average departures from the long-term mean of both the PDO index and the MEI (Multivariate ENSO Index). The PDO is somewhat higher correlated (r=0.52) with the cumulative river flow data in Fig. 5. As Fig. 6 shows, positive PDO periods are generally associated with higher stream flows, and negative PDO with lower stream flows. Most notably, the period since 2000 has seen more negative PDO activity, which is worsening the problem with Lake Mead not getting enough water. Of course, this will eventually reverse when the PDO flips back into its positive phase.
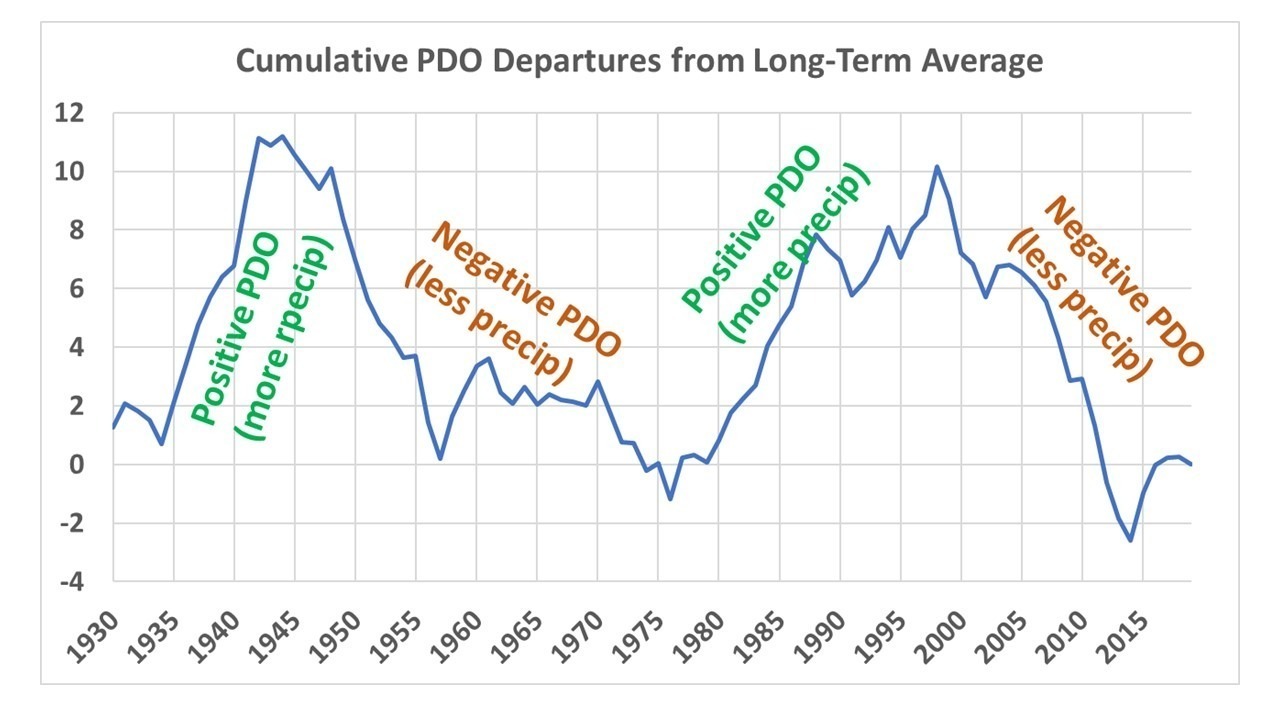
Fig. 6. Cumulative departures of the Pacific Decadal Oscillation index from its long term mean, which is r=0.52 correlated to cumulative streamflow into Lake Mead from the Colorado River (Fig. 5.)
Conclusions
The popular narrative that drought due to climate change is causing Lake Mead to have less water available to it is incorrect. Since 1930, there has been no long-term change in the Colorado River flow upstream of what is now Lake Mead.
The latest climate models do not even predict a reduction in precipitation in the upper Colorado River watershed.
Multi-decadal changes in river flow do occur, though, and are related to the Pacific Decadal Oscillation, a natural fluctuation in weather patterns over the northeast Pacific. Recent record-low water levels in Lake Mead are primarily due to record high water demand from the lake, since approximately 2000. The problem is being made somewhat worse by the negative phase of the PDO, also since approximately 2000.


Roy – also of note is How fast Lake Mead filled to capacity . .
https://www.nps.gov/lake/learn/nature/images/average-elevation.jpg?maxwidth=1200&maxheight=1200&autorotate=false
. . during a period of exceptional drought and heat waves.
Also of note:
Colorado River Basin drought 1901-2015
https://journals.ametsoc.org/view/journals/eint/24/2/eiD200001.xml
That’s Fig 3, from:
https://journals.ametsoc.org/view/journals/eint/24/2/eiD200001.xml
Great piece, Roy. LAT’s brings up the ACC fear-mongering re: Lake Powell and Mead most every week in their paper. This will come in very handy.
So in summary, the ever increasing drawdown is sustainable during natural peak wet phases of PDO, but not during other dry to normal phases. What I find interesting is that the climate models predict opposite of what the mainstream climate catastrophe narrative claims. The models predict increases to precipitation for the water shed. If all this is true then it should be a illegal action by the ones spreading the narrative because the output of climate alarmist impact other aspects of the economy. It isn’t fair, there have to be consequences for lies. Personally I don’t buy the models but if we must accept then at least be consistent
https://www.nature.com/articles/s41558-022-01290-z
“While there have been single-year breaks in these anomalous conditions, aridity has dominated the 2000s, as evidenced by declines in two of North Americas largest reservoirs, Lakes Mead and Powell, both on the Colorado River. In summer 2021, these reservoirs reached their lowest levels on record, triggering unprecedented restrictions on Colorado River usage2, in part because the 2-yr naturalized flow out of Colorado Rivers upper basin in water-years 20202021 was likely the lowest since at least 1906.”
“Using the 29 CMIP6 models with adequate data, the multimodel mean ACC trends account for 42% of the SWNA soil moisture anomaly in 20002021 and 19% in 2021. The larger contribution of ACC to the 22-yr anomaly arises because background drying from ACC generally influences multidecade mean conditions more than higher-frequency anomalies.”
Models indicate Western droughts are exacerbated by ACC (their term for AGW).
It should be noted that although temperatures have risen in the 2000s, the precipitation has not fallen.
Where?
The entire Southwest is where the current drought is located.
Drought indexes (which only apply to land surfaces in any case) are disproportionately weighted for higher temperatures.
disproportionately weighted ”
Who sez?
And why would that matter?
“which only apply to land surfaces”
Indeed so. And highly relevant to the topic being discssued.
70% of oceans with higher temperatures should lead to more water in the atmosphere, not less.
Again, you erroneously assume that climate change should be uniform.
It is not.
For example the global circulation may be amplified in a warmer world. The global circulation is responsible for the high pressure latitude zones that produce most of the world’s deserts.
Desertification may be enhanced at the margins of such regions.
“Climate models indicate that large regional
climate variations will accompany
global warming. Such shifting of climatic
patterns has great practical significance,
because the precipitation patterns determine
the locations of deserts, fertile areas,
and marginal lands. A major regional
change in the doubled CO2 experiment
with our three-dimensional model (6, 8)
was the creation of hot, dry conditions in
much of the western two-thirds of the
United States and Canada and in large
parts of central Asia. The hot, dry summer
of 1980 may be typical of the United
States in the next century if the model
results are correct. However, the model
shows that many other places, especially
coastal areas, are wetter with doubled
CO2.”
From Hansen et al, Science, 1981.
https://www.ncei.noaa.gov/cag/regional/time-series/205/pcp/all/7/1895-2022
Precipitation has not changed that much in this area since 1895.
Or if you prefer annual.
https://www.ncei.noaa.gov/cag/regional/time-series/205/pcp/ann/7/1895-2022
Western Prcip
https://www.ncei.noaa.gov/cag/regional/time-series/120/pcp/36/7/1895-2022?base_prd=true&begbaseyear=1901&endbaseyear=2000&trend=true&trend_base=10&begtrendyear=1980&endtrendyear=2022
And Drought Severity
https://www.ncei.noaa.gov/cag/regional/time-series/120/pdsi/all/7/1895-2022?base_prd=true&begbaseyear=1901&endbaseyear=2000&trend=true&trend_base=10&begtrendyear=1980&endtrendyear=2022
And trends since 1980
https://www.ncei.noaa.gov/cag/regional/time-series/205/pcp/all/7/1895-2022?trend=true&trend_base=10&begtrendyear=1895&endtrendyear=2022
https://www.ncei.noaa.gov/cag/regional/time-series/205/pcp/12/12/1895-2022?trend=true&trend_base=10&begtrendyear=1895&endtrendyear=2022
Upper basin precipitation has not changed that much in this area since 1895, nor have trends been that significant (-0.02 per decade/0.16/century).
So we have precipitation/snowpack/stream rate (according to Roy) all being similar but man’s usage continuing to rise at a steady rate and yet it is nature that is the problem? Sure.
“So we have precipitation/snowpack/stream rate (according to Roy) all being similar but mans usage continuing to rise at a steady rate and yet it is nature that is the problem?”
As noted, drought also affects evaporation, and water demand for agriculture and people.
“stream rate” is at a low point, lower than the century average.
No one is denying that this is a man-made problem, but you guys are denying the other variable, drought, is also at work here.
“No one is denying that this is a man-made problem, but you guys are denying the other variable, drought, is also at work here”
No ‘we’ are not. It is you who are suggesting that the over usage is not a factor.
P{.S. Water demand for agriculture and people is the main problem.
https://www.ncei.noaa.gov/cag/regional/time-series/205/pcp/all/7/1895-2022?trend=true&trend_base=10&begtrendyear=1980&endtrendyear=2022
Trend since 1980, when GW became significant, is of interest.
“It is you who are suggesting that the over usage is not a factor.”
BS. Quote me saying that.
Re: Natural inflows are recently low.
https://www.usbr.gov/lc/region/g4000/NaturalFlow/provisional.html
See first Excel file. Plot it if you like. Clear downward trend.
Mean 1906-1999 is 15.2 M
Mean 2000-2021 is 12.2 M
DSee Fig 1 above in op for inflows.
It is you who are suggesting that the over usage is not the important factor.
“Trend since 1980”
Cherry picking or what?
Trend since 1895 is flat.
“Trend since 1980
Cherry picking or what?”
Trend since 1895 is flat.”
Hansen, Science, 1981, predicted that, going FORWARD, the AGW signal would exceed natural variation for the first time.
And it did.
The point is AGW was not predicted to be linear since 1895.
So why do you want to fit a linear trend back to 1895?
If your goal is to dilute the trend with 85 years of flat plus noise, then sure, and hopefully you can mislead people.
And lets face it, RLH, that is always your goal.
“It is you who are suggesting that the over usage is not the important factor.”
So you cant quote me.
So,
Mean 1906-1999 is 15.2 M
Mean 2000-2021 is 12.2 M
This drop in natural inflow just doesnt matter?
“The point is AGW was not predicted to be linear since 1895”
Apparently not. It only effects non-peak temperatures without saying how that magic is achieved.
“So why do you want to fit a linear trend back to 1895?”
Because that is exactly what you want (and do) to do with global temperature.
The entire Southwest is where the current drought is located.
I am currently growing further $25k or extra month-to-month from domestic through doing extraordinarily sincere and clean task online from domestic. I actually have obtained specifically $31530 ultimate month from this domestic task.~t150~ be a district of currently this task and start making more money online through observe coaching at the given website.. http://Www.NetJob1.com
McCabe et al studied the drought patterns of the lower 48 during the last century and concluded that more than half of the drought patterns could be explained by the phases (cool or warm) of the PDO and the AMO (published in PNAS in 2004).
Judith Curry, in a 2011 presentation at a NOAA workshop in Boulder, Colorado, presented the McCabe research, noted that the then (and now) cool PDO and warm AMO was the same situation as in 1946 – 1964 when the Southwestern US and the mountainous west was in drought, and predicted continued drought in those regions through about 2025.
This is not to argue that increasing consumption of Lake Mead water is not important, but to suggest there is another factor, AMO, in the equation.
Is AMO in equation regarding hurricanes?
https://www.nhc.noaa.gov/
We got two with 40% chance of forming which more than it has been.
Solar weather:
https://www.spaceweather.com/
Solar wind
speed: 404.9 km/sec
density: 8.91 protons/cm3
Sunspot number: 88
Thermosphere Climate Index
today: 13.12×10^10 W Neutral
Oulu Neutron Counts
Percentages of the Space Age average:
today: +1.3% Elevated
It seems to be continuing to have more activity in southern
part of sun
Dr, Roger Pielke, Sr. wrote a blog piece about Dr. Curry’s presentation, which includes links to Curry’s slides and to the McCabe research.
https://pielkeclimatesci.wordpress.com/2012/06/27/perspective-on-the-hot-and-dry-continental-usa-for-2012-based-on-the-research-of-judy-curry-and-of-mccabe-et-al-2012/
Don B.
https://www.ncei.noaa.gov/access/monitoring/climate-at-a-glance/regional/time-series/109/pmdi/all/8/1895-2022?base_prd=true&begbaseyear=1901&endbaseyear=2000
This clearly shows that the drought severity in the West in the last 20 years is at its worst in the modern record. This is in part because of the drying effect of recent warmer temperatures.
Drought indexes only apply to land surfaces which in turn only comprise some 30% of the world’s surface.
“Precipitation is projected to increase by 2.1% in the upper basin while declining by 1.6% in the lower basin by
2050”
“Drought indexes only apply to land surfaces”
red herring. Land surfaces are what this discussion is all about!
I wouldn’t believe anything put out by the NOAA. They adjust records.
Of course NASA adjust the records.
For example, pre-WW2 sea temperatures were measured in a canvas bucket on deck. Evaporation lowered the temperature.As a result the long term rate of warming was overestimated.
Adjusted sea temperatures from the period are higher, so the ddjusted rate of warming is lower than the raw rate.
Now why would “They” adjust the data to reduce the rate of warming?
https://judithcurry.com/2015/02/09/berkeley-earth-raw-versus-adjusted-temperature-data/
“pre-WW2 sea temperatures were measured in a canvas bucket on deck”
and our knowledge of the southern oceans was very, very sparse.
Only with the advent of satellites was that improved.
Which is only 30% of the globe’s surface area. Strange how higher temperatures thus leading to more evaporation is not more talked about in the context of oceans.
Hasn’t the average humidity of the atmosphere decreased?
Because of the increase in temperature absolute humidity, the maximum amount of water vapour the atmosphere can carry has increased.
Relative humidity, the % of that maximum you observe, has stayed fairly comstant.
This the actual water content has increased in proportion to the increase in absolute humidity.
Heard of the humidity paradox?
Nope. Tell me more.
Would this be it?
nasa.gov/vision/earth/lookingatearth/warmer_humidity.html
“Their work verified water vapor is increasing in the atmosphere as the surface warms. They found the increases in water vapor were not as high as many climate-forecasting computer models have assumed. “Our study confirms the existence of a positive water vapor feedback in the atmosphere, but it may be weaker than we expected,” Minschwaner said. “
Plug ‘humidity paradox’ into google.
RLH
I did look it up. The paradox is that although the air can potentially hold more water it does not have to. Most water vapor comes from ocean evaporation. The ocean is warming much slower than land. As the moist air moves over the warmer air the relative humidity goes down since the air can hold more but only has so much water vapor.
The paradox is that humidity is NOT rising as fast as the air temperature is.
The models are set to believe otherwise. Who knew?
“Who knew?”
Not the modelers.
” that humidity is NOT rising as fast ”
Its not expected to rise. It was expected to stay ~ constant.
“Held and Soden (2000) presented theoretical arguments and evidence from modeling in support of a constant RH. At the time of their review, observations were insufficient to test this hypothesis”
https://agupubs.onlinelibrary.wiley.com/doi/full/10.1029/2021GL092462
You have to distinguish between relative humidity and absolute humidity.
http://www.differencebetween.net/science/nature/difference-between-absolute-and-relative-humidity/
“Unlike relative humidity which is dependent on the temperature of the air, absolute humidity is totally independent of the temperature. So, if the temperature warms, relative humidity goes down and vice-versa”
Also humidity (like the boundary layers) over the oceans and humidity over the land differs quite a lot and there are approx. 70% of oceans to 30% of land on this globe.
“Observations of humidity across the world indicate that the specific humidity or the amount of water vapour has increased. Yet, at the same time, the relative humidity or saturation over many regions has declined.”
We have the technology to solve water shortages. Just build desalination plants next to new nukes. Solve two problems at once.
There are now about 21,000 desalination plants in operation around the globe. The biggest ones are in the United Arab Emirates, Saudi Arabia and Israel. The world’s largest desalination plant is located in Saudi Arabia (Ras Al-Khair Power and Desalination Plant) with a capacity of 1,401,000 cubic meters per day.
We have the technology. We just need some adults in leadership positions.
And LOTS of money!
An important issue seem to me, does it give you tap water which as good as bottle water?
gbaikie, did you mean: An important issue seem[s] to me, does it give you tap water which [is] as good as bottle[d] water?
If that’s close to what you meant, you should know that most bottled water is nothing more than tap water.
My experience is that tap water can vary a lot in terms of how it tastes and smells. I have had tap water taste better than bottled water, but normally it isn’t.
And it seems desalinated water could be worse than any tap water I have tasted. I don’t think ever tasted desalinated water, though it’s
possible I have.
I mean people can have soft water and hard water, would desalinated water be hard, soft, or neither?
I would say all bottled I drink is neither.
Well I looked around and some say desalinated needs to have minerals
and it’s soft water.
It’s muddle, but have this quote:
“There are already some minerals being added to desalinated water. The desalination plants add calcium before the water is distributed to the national water carriers, because desalinated water is slightly acidic and corrosive to water pipes over time. Calcium helps combat the acidity, and is relatively inexpensive to add. Calcium, as a mineral, is also beneficial to humans and plants.”
https://www.timesofisrael.com/deficiencies-in-desalinated-water-could-lead-to-increase-in-heart-attack-deaths/
I don’t know if it’s true, some people say tap water is better to make coffee with. And I always make coffee from tap water. So I drink plenty of tap water.
gbaikie … go to Quality Foods at Merecroft. You can buy a jug of water that has been passed through a reverse osmosis filter.
That water would taste the same as water processed at a desalination plant.
NASA’s asteroid-deflecting test mission is just 1 month away from impact
By Stefanie Waldek published 2 days ago
https://www.space.com/nasa-dart-mission-asteroid-impact-one-month-away
Linked: https://instapundit.com/
“Although Dimorphos is not on a collision course with Earth, the mission is a test to see if “kinetic impact technology” would work to deflect any potential Earth-bound asteroids. ”
…
“Didymos is the larger asteroid at 2,500 feet (780 meters) in diameter, while Dimorphos is the smaller “moonlet” asteroid at 525 feet (160 m) in diameter. For comparison, the asteroid that powerfully exploded over Chelyabinsk, Russia, in 2013 was 60 feet (18 m) in diameter.
The choice of targeting a binary system was intentional. Because the two asteroids revolve around one another and they both can be observed by Earth-based telescopes we’ll quickly be able to see if the DART spacecraft’s impact shifted Dimorphos’ orbit.”
The Science of Snowfall and Climate Snowjobs
https://wattsupwiththat.com/2022/08/27/the-science-of-snowfall-and-climate-snowjobs/
All kinds of stuff about snow.
Anyhow, I would say we living in Ice Age.
Claiming no snow, means you are unaware that
we are living in an Ice Age.
And you probably failed on many other subjects in
elementary school.
Autumn is approaching in the northern hemisphere. For many in Europe, it could be very cold.
http://ocean.dmi.dk/arctic/plots/meanTarchive/meanT_2022.png
I find the human nature aspect of this story interesting. If there were no PDO, and otherwise less year-to-year variation in the inflows, then everyone would be focusing on the “Water Use” (red curve) in Fig 4. But complicate the picture with some variability in inflow, and that instead becomes the major focus. Independent of whether you are a “true-believer” or a “denier”, if a response is required, which curve in Fig 4 seems like a more realistic target, the red curve or the blue curve? Shades of “Everyone talks about the weather, but nobody ever does anything about it”.
Throw in the PDO, and another interesting aspect of human nature arises, the boiling-frog behavior. The PDO (apparently) hides the problem for a while, then amplifies the problem for a while. During the periods of amplification, humans are more likely to be motivated to take some drastic action – the suggested nuclear-powered desalination plants, for example. It’s probably then easier to justify the ROI of such big actions, based on assuming the current trajectory of the problem will continue. It’s well known that humans have a much harder time planning for longer time scales.
Since I’m all for maximum freedom, I’m with Dr. Spencer on the solution – let the price rise to the point that water usage drops to a sustainable level. In the town I live, water is on the spendy side $5 per kgal, due to local quirks in geography. Homeowners take one of three approaches: use drought-resistant grass and let it go brown in the dry season, landscape with rocks, or let the native vegetation take over. There is no law against having a year-round green lawn, but you don’t see any; the soil is very sandy, so a green lawn would mean a very big water bill. If certain agricultural uses are deemed to be important enough, they can be subsidized with a lower rate; maintaining some usage minimum rate is still important, though, to encourage best use and innovation.
Milton comments: “During the periods of amplification, humans are more likely to be motivated to take some drastic action — the suggested nuclear-powered desalination plants, for example.”
That’s exactly what is being attempted with this AGW nonsense, Milton. Scare everyone to “drastic action” even though nothing is happening that is not manageable. Needed nukes and desalination plants are NOT “drastic action”. They will be sought after to support a growing population.
New nuclear plants and desalination plants spur local economies. High paying jobs promote better standards of living. The more nuclear plants, the better, especially if you believe CO2 can “warm the planet”. It’s called a “win-win”.
Poland is beginning to run out of gas. Fertilizer production is being halted, by the way, CO2 needed for cooling food products will start to run out. This is only a harbinger of Europe’s energy troubles. It is likely that frost will kill more people in Ukraine than war.
There is also a shortage of coal in Poland. People stand in lines for days to buy inferior quality coal, which is not suitable for good stoves (it is heavily sulfated). If the EU does not suspend emission fees, many Polish pensioners will not be able to afford their energy payments.
Clint R
Your idea may be rational but it does not seem possible in California. They are trying to shut down their last Nuclear Power Plant even as demand, at times, exceeds supply. Not sure what can be done to help California.
https://www.cnbc.com/2021/10/02/why-is-california-closing-diablo-canyon-nuclear-plant.html
Dang Norman, there’s not one insult or false accusation there! And, there’s no mention of your childish “bot” nonsense.
You even touched on some reality.
Are you finally over your year-long meltdown?
Palmowski
Don’t forget to show us this graph when we reach day 365!
http://ocean.dmi.dk/arctic/plots/meanTarchive/meanT_2020.png
I predict a cold autumn in Europe.
https://i.ibb.co/wyrKjTN/r00-Northern-Hemisphere-ts-4km.png
NOAA’s prediction is as amazing as yours, but manifestly goes in the inverse direction:
https://www.cpc.ncep.noaa.gov/products/CFSv2/htmls/euT2me3Mon.html
If they would show what you Cooling lover hope all the time, we would see a lot more of blue in NOAA’s pictures, wouldn’t we?
You’d better get your sheepskin ready for winter, because you may run out of energy.
https://earth.nullschool.net/#2022/09/01/0400Z/wind/surface/level/overlay=temp/orthographic=-336.75,48.62,1125/loc=9.807,51.924
What the heck does your as usual supershort term picture have to do with a forecast for the next 6 months?
Your forecast for autumn is weak. What temperature do you want to have in your apartment ? Is 17 C sufficient for you ?
Like this you mean?
https://psl.noaa.gov/enso/mei/img/meiv2.timeseries.png
https://climatedatablog.files.wordpress.com/2022/08/meiv2-2.jpeg
What the heck does that MEI index have to do with Europe’s winter temperatures?
Some amazing pseudotheory to offer, Linsley Hood?
Are you saying that El Nino/La Nina does not affect weather patterns world wide?
Are you saying?
Are you saying?
Are you saying?
Are you saying?
Are you saying?
Are you saying?
Are you saying?
Are you saying?
Are you saying?
Are you saying?
How is it possible to ask such a dumb question, instead of replying with a bit of brain to what was asked originally?
What the heck does that MEI index have to do with Europes winter temperatures?
Some amazing pseudotheory to offer, Linsley Hood?
El Nino/La Nina affects weather patterns world wide.
“A La Nina is characterised by persistent anomalously cool ocean temperatures within the central and eastern tropical Pacific. These cause changes in an atmospheric circulation system known as the Walker Cell, which then have knock-on effects on weather patterns as far afield as Europe.
While the effects here are relatively small compared to North America for example, they can still be significant, especially during strong La Nina events such as we saw last spring.”
As usual Blinny says nothing. Other than try to make Excel produce some graphs.
Look at the winter instead, Palmowski.
AMAZING..!!! I REALLY LIKE THIS WEBSITE SO MUCH ITS ABSOLUTELY EXCELLENT TO ME IN RECENT TIMES I AM SIMPLY WAITING FOR YOUR NEXT BLOG Bape Hoodie https://www.theusasuits.com/category/bape-hoodie/
Idiot.
𝓛𝓮𝓽𝓽𝓮𝓻𝓼 𝓐𝓷𝓭 𝓖𝓵𝓲𝓽𝓽𝓮𝓻𝓼 ✨
𝒄𝒖𝒔𝒕𝒐𝒎𝒊𝒛𝒆𝒅 𝒓𝒆𝒔𝒊𝒏 𝒏𝒂𝒎𝒆 𝒔𝒕𝒂𝒏𝒅𝒆𝒆 𝒉𝒂𝒏𝒅 𝒎𝒂𝒅𝒆 𝒘𝒊𝒕𝒉 𝒍𝒐𝒗𝒆💕
⚡✨𝒍𝒊𝒈𝒉𝒕𝒊𝒏𝒈 𝒖𝒑 𝒚𝒐𝒖𝒓 𝒏𝒂𝒎𝒆 ✨⚡
𝒌𝒂𝒓𝒂𝒄𝒉𝒊 𝒃𝒂𝒔𝒆𝒅
𝑫𝑴 𝒕𝒐 𝒐𝒓𝒅𝒆𝒓/𝒊𝒏𝒒𝒖𝒊𝒓𝒚
ᴊᴀᴢᴢ ᴄᴀꜱʜ/ ᴇᴀꜱʏᴘᴀɪꜱᴀ /ᴄᴏᴅ ᴀᴠᴀɪʟᴀʙʟᴇ
https://www.instagram.com/letters.n.glitters/
Simple & easy:
https://www.drroyspencer.com/2022/01/uah-global-temperature-update-for-december-2021-0-21-deg-c/#comment-1356906
A super typhoon will hit Okinawa.
Nate your comments are as usual not helpful. Your ignorance of Colorado River water policy appears to be completely absent.
The Colorado River water is over allocated.
One can measure inflows into a reservoir and mandated outflows and determine why a reservoir is dropping in level.
But one must consider all factors that affect the inflow into each reservoir.
Upper basin (above the Lake Powell dam) allocation use has increased several hundred thousand acre feet per year since 2000 was increasing since 1980 to 2000 at a similar rate. Wyoming and Colorado have been diverting increasing amounts of water over those times and have major plans to further increase that usage and have major projects in development to due just that. Throw in portions of Utah and New Mexico as well.
On top of those managed diversions there is a huge unknown associated with unmanaged diversions such as pumping water out of water tables and management of natural water table replenishment.
Those are certainly on the increase as well in step with growing populations.
While we do know that negative PDO conditions are correlated with drought in California and very likely the entire southwest lesser water supplies can be expected from both that and human water use.
Since we really have little idea of what causes these natural climate variations seemingly connected to water and wind current changes along with a recovery from the LIA we have no way of estimating the role of anthropogenic climate change and its effects.
But what is the case is Colorado River water usage is over allocated and that isn’t any secret. Increasing water usage in the Colorado River basins have been defacto since the beginning of the 20th Century and politics has greatly affected water availability. Thus it is not at all surprising the reservoirs would reflect that wide and sudden variation. A wide and sudden variation that can only very partially be explained by a changing climate which itself needs to be divvied up among various causes.
OK Bill,
Ground water is worthwhile point. The rest, not so much.
“defacto since the beginning of the 20th Century and politics has greatly affected water availability. Thus it is not at all surprising the reservoirs would reflect that wide and sudden variation.”
A century ago is hardly sudden.
Precipitation has not changed in a century.
So drought conditions throughout the Southwest, since 2000, don’t matter and can be safely ignored?
Only since 2000! Who was it that accused me of short termism?
“The contiguous U.S. average annual precipitation was 30.28 inches, which is 0.34 inches above the long-term average, ranking in the middle third of the historical record.”
Issued 12 January 2021:
There is paleo data available showing that drought is a regular occurrence. Drought conditions in the SW since 2000 are not different from droughts before 2000 and are not an indicator that climate is changing. Ignore it or not; there is nothing you can do about it except to adapt.
In the overall West, rainfall has dropped.
https://www.drroyspencer.com/2022/08/lake-mead-low-water-levels-part-2-colorado-river-inflow-variations-and-trend/#comment-1357975
https://www.drroyspencer.com/2022/08/lake-mead-low-water-levels-part-2-colorado-river-inflow-variations-and-trend/#comment-1357979
Yep, since 2000 is what this discussion is all about. You seem to have lost the thread.
Nate says:
Ground water is worthwhile point. The rest, not so much.
”defacto since the beginning of the 20th Century and politics has greatly affected water availability. Thus it is not at all surprising the reservoirs would reflect that wide and sudden variation.”
A century ago is hardly sudden.
———————
A century ago we were experiencing a large cool dip in global temperatures. Drought is well associated with cooler conditions. By your own statements about evaporation above you know that to be true. What goes up must come down.
Where you went wrong is evaporation isn’t increasing as you claim. Its decreasing. Its decreasing because the amount of water surface area is decreasing. The water agencies are reporting that. Very slightly warmer weather might mitigate that some but over all it is believed that less water is being lost to evaporation. Loss of water due to percolation goes up as water tables are lowered.
Anybody who spends even a little attention to water politics in California understands what the problem is and has understood it for generations. Nothing new going on here. The movie ‘Chinatown’ had water politics at the center of the plot in the early 20th Century. Politics still sets the tone. California in terms of sales value is the leading agricultural state. Far far far more politically acceptable to blame California’s water problems on anything but the real cause.
Its more than just percolation Nate. Take the Grand Ditch in Colorado finished in 1936 that diverts water from the Colorado River watershed to the Missippi River watershed primarily because Denver is in the Mississippi River watershed.
the point here is none of your arguments hold water. Precipitation is within normal ranges of variation for the region over the past 130 years for which data is available.
Evaporation is not increasing its decreasing because water surface area is decreasing.
Inflows into Lake Powell have varied but the reason they are historically low is Lake Powell is a young lake and was not there when natural multi-decadal climate change would have last effected it in the early 20th Century.
Inflows into the Colorado River have been steady because of water politics. Yet the lake is down. That was the point of Roys Article which dependedly you jumped on instantly because it doesn’t fit your false narrative of climate change. And here you have have fallen flat on your face on every argument you have raised.
Ok Bill, you’ve had your usual fun stalking me, confusing your opinions for facts, and tossing the usual toxic melange of nonsense, politics, and ad-hom grenades.
Now kindly go and find someone else to stalk and troll.
Sure Nate as soon as you stop lying and making up your own science.
Curious about average temps in the region surrounding Lake Mead:
Arizona
https://tinyurl.com/ykyuman7
Nevada
https://tinyurl.com/4u8pesst
Looks like the states surrounding the Lake have gotten warmer.
Doesn’t mean they’ve gotten drier, as different places have different weather effects when the temp rises – which can also mean increased rainfall, longer breaks between downpours or shorter, reduced or (more likely) increased capacity of land to absorb/retain water (faster drying in warmer temps).
The majority of the lake’s water comes from Colorado, Wyoming, and Utah. Let’s look at average temps over time.
https://tinyurl.com/phw4uvsc
https://tinyurl.com/bdemj8ab
https://tinyurl.com/4a89efbv
All warmer since 1900.
Responding to a comment on how do we know there has been climate change in the region. Average temps seemed like a fair indicator.
Click on the links and you can select certain months, seasons, states and other parameters including precipitation, heating degree days, and various drought indices.
“Average temps seemed like a fair indicator.”
So does precipitation which has not changed at all/worth a damn.
Yes, I’m not sure rainfall strongly competes with average temps to get a sense of general climate change.
Did you also check the drought severity indices, which seem to be pertinent to the thrust of Roy’s article?
Drought severity indices are heavily biased towards higher temperatures so what you are seeing is that increase reflected in the figures.
Rainfall is what fills rivers/dams/lakes.
As I said, I was looking for evidence of climate change in the regions. Figuring out whether that has an impact on dam levels and water availability would require a lot more work. There are many factors to account for.
Rainfall in West Climate Region
https://www.ncei.noaa.gov/cag/regional/time-series/109/pcp/12/7/1895-2022?base_prd=true&begbaseyear=1895&endbaseyear=1999
20th century Mean
Mean 1895-1999 17.41 inches/year
https://www.ncei.noaa.gov/cag/regional/time-series/109/pcp/12/7/1895-2022?base_prd=true&begbaseyear=2000&endbaseyear=2022
Mean 2000-2022 15.83 inches/year
Is a 9% drop for 22 y ‘worth a damn’?
Then add extra warmth.
But as you have admitted, the century long precipitation figures show little difference.
You use those sort of long term trends for temperature continuously. Why is it not suitable for precipitation?
Meiv2 shows that La Nina are becoming more frequent and deeper. Will that not affect the USA rainfall?
https://climatedatablog.files.wordpress.com/2022/08/meiv2-2.jpeg
“You use those sort of long term trends for temperature continuously. Why is it not suitable for precipitation?”
We also use shorter mutli-decadal trends to see if anything has changed more recently. According to the science, anthropogenic influence is limited to negligible in the first half of the 20th century, when CO2 increase rises slowly compared to the following decades, where it rises 4 times faster.
1900 – 1960: 296 to 317 ppm = 0.35 ppm/yr (21 ppm over 60 years)
1960 – 2020: 317 to 414 ppm = 1.62 ppm/yr (97 ppm over 60 years)
The CO2 rise has accelerated throughout. From 2000 to 2020 the rate is 2.2 ppm/yr. As long as time-periods selected are not so short that noise swamps any signal, there’s no reason not to examine various multi-decadal periods.
Your presumption is that the rise in CO2 causes increased temperatures (but no increase in precipitation).
But only temperatures that are not El Nino apparently.
https://climatedatablog.files.wordpress.com/2022/08/meiv2-2.jpeg
Let it go RLH. That argument was over last month and not relevant.
Why? You have not explained how ‘peak’ temperatures are not affected but everything else is.
It has been explained, repeatedly. You simply ignore what others post.
It does appear we have or are entering into a new multi-decadal regime that has a large effect on the southwest portion of the country in terms of precipitation.
But if you look at 20 year precipitation patterns. 1920-39 was dryer than the generation 2000-1999. With 16.2″ vs 16.4″ respectively. So the current dry spell really can’t be considered anything unnatural or unexpected.
The difference then was earlier in the century there was an identified need to store water for year round use and actual total use was far smaller.
The fact that that water is currently not satisfying demand is quite simply related to population and agriculture and increasing demands for water. Absolutely zero evidence of anything else.
Now that certainly doesn’t amount to a claim nothing else might have a factor in it all. Just from a science perspective nothing else exists.
“But as you have admitted, the century long precipitation figures show little difference.”
Gibberish.
So, you think a 9% drop in precipitation for 22 y is not worth a damn to reservoirs in a region with extra warmth?
“Meiv2 shows”
Your recurring obsession has nothing to do with this topic.
So the trend for more La Nina recently does not affect climate going forward. Why is that?
And the rise in human (and agricultural) uses in the same time period is what? Nothing?
Nate says:
So, you think a 9% drop in precipitation for 22 y is not worth a damn to reservoirs in a region with extra warmth?
————-
Nate a 9% drop in precipitation for 22 years isn’t even the record drop in a measly 127 year record! The last time there was such a drought larger than this drought was 1915 to 1936 where an average annual precipitation was 15.59 inches over a 22 year period.
A lot of global warming was occurring at the same time then also. Can we conclude that the Colorado River watershed is likely the Canary in the coalmine for natural climate change? Seems to me that is the implication.
Yep, periods of low rainfall, similar to the present one, are a recurring theme in the West.
But as quantified by the Palmer Drought indices, recent warming turns the same level of precipitation into more severe Drought.
https://www.ncei.noaa.gov/cag/regional/time-series/109/pdsi/1/7/1895-2022?base_prd=true&begbaseyear=2000&endbaseyear=2022
The reason is clear: warmer temperatures lead to more drying of soil and vegetation, and more evaporation from bodies of water.
The Drought indices are also a better predictor of forest fire risk.
Same chart, with all months
https://www.ncei.noaa.gov/cag/regional/time-series/109/pdsi/all/7/1895-2022?base_prd=true&begbaseyear=2000&endbaseyear=2022
LMAO! Nate,
The Palmer Severity Index includes estimates of impacts on agriculture, the population (residents), and industry.
As we have been trying to tell you that official indices of drought is a moving target that becomes more severe the more you have agriculture, the larger the population, and as industry that uses water increases. The Palmer Drought Severity Index isn’t a climate index. It is an index of impacts on consumers of water.
Roy’s article explains that fact. ‘Drought’ isn’t a climate measure. But instead it is combination of precipitation, runoff, storage, and needs/useage.
So Roy was just pointing out that ‘drought’ is only loosely related to climate and to make his point he broke it down to lake inputs and lake levels to show the problem is NOT the input.
That prompted some ignorant boob to start challenging Roy’s findings.
LMAO! What was his argument? He claimed it was due to the input to Lake Powell!!! ROTFLMAO! You need to explain why you think that amounts to anything.
Roy showed that Lake Mead has had a quite steady input mandated by policy.
What has affected Lake Mead levels is increased output.
More demand, more agriculture, more population, more industry, Mexico taking down its storage, and releases related due to lawsuits regarding the environmental impacts of the long term reduction of water reaching the Sea of Cortes.
I mentioned the great movie ‘Chinatown’ because there the politicians were playing the same game. In Chinatown they wanted more water to develop the San Fernando Valley!!! Today they want to get rid of automobiles that use fossil fuels.
I also pointed out that from the ‘environment/climate’ perspective there is a real lack of water in the entire Colorado water system, but that climatically speaking it isn’t remarkable or different than what the region has experienced in the past. Climate changes. It has always changed and will continue to change long after we are gone.
“challenging Roys findings.”
Speaking of LMAO, apparently your Daddies cannot be challenged!
Meanwhile, unlike you, Roy fully expects that scientific analysis and conclusions he posts on his blog should be challenged.
As he noted in an earlier post last month:
“In the meantime, I will be inviting the researchers who live and breathe this stuff to poke holes in my analysis.”
What a croc, Bill. Where do you get these notions?
“challenging Roys findings.”
Speaking of LMAO, apparently your Daddies cannot be challenged!
Meanwhile, unlike you, Roy fully expects that scientific analysis and conclusions he posts on his blog will be challenged.
As he noted in an earlier post last month:
“In the meantime, I will be inviting the researchers who live and breathe this stuff to poke holes in my analysis.”
“As we have been trying to tell you that official indices of drought is a moving target that becomes more severe the more you have agriculture, the larger the population, and as industry that uses water increases.”
Unfortunately Bill, we have all learned that your many posts like this have zero credibility.
No matter what data or facts are shown to you, you invent some new nonsensical BS excuse.
“The Palmer drought index, sometimes called the Palmer drought severity index (PDSI), is a regional drought index commonly used for monitoring drought events and studying areal extent and severity of drought episodes.”
“The Palmer index is widely used operationally, with Palmer maps published weekly by the United States Government’s National Oceanic and Atmospheric Administration. It also has been used by climatologists to standardize global long-term drought analysis. Global Palmer data sets have been developed based on instrumental records beginning in the 19th century.[5] In addition, dendrochronology has been used to generate estimated Palmer index values for North America for the past 2000 years, allowing analysis of long term drought trends.[6] It has also been used as a means of explaining the Late Bronze Age collapse.”
Nate the Palmer Drought Severity Index has several weaknesses. It is used because it is the most useful available for alerting policy makers for necessary action.
But the PDSI isn’t comparible from region to region.
For many of the exact same reasons, its also not comparible within a region that has undergone large hydrological changes such as the southwest. Lower water tables, massive increases in reservoir surface area creates huge changes for some of the variables in the index and thus while the PDSI is useful for recent change (and would be far more accurate if the historical comparison was to a more recent period where total agriculture, total population, and water storage facilities had not undergone orders of magnitude of change.
Shocking, yet more backsliding from unsubstantiated Bill assertions.
You cannot document any real problem with the PDSI. It is simply measuring the meteorological drought conditions.
The index clearly shows the current period is one of deeper drought conditions than any other time in the record.
Nothing you asserted there supports your silly dismissal of the data “LMAO! Nate”, nor that the current unprecedented drought conditions can be ignored.
Its well documented Nate. Any credible scientist recognizes this there is no scientist denying it. The PDSI was developed in Kansas a region without the complexities and changes the southwest has undergone.
It is explicitly stated its not comparible across regions. That makes it not compariable across regions with vast hydrological changes. How is soil moisture measured in the southwest, a region where the only place it existed 100 years ago was in the riparian bufferzone. Agriculture didn’t even hardly exist. It has always been accomplished via impounded water.
Nearly all those bufferzones are now under 100’s of feet of reservoir water. Water flow is strictly controlled throughout the basin. When is the last time you heard about a Colorado River flood, something that was an annual occurrence a century ago during late spring months.
I lived in areas where farms exist without any irrigation other than mother nature. In this zone unless you plant right along the river bank within probably a 100 feet, your agriculture is dependent upon impounded water. How can you possibly compare 100 years ago?
Evaporations? Gee that went through the roof when the impounded the reservoirs. A slim little river is going to give you a fraction of the evaporation. Evaporation and percolation water losses are the biggest concerns regarding water loss during a drought. Not even compariable at all to 1895 when most of the dams on feeder creeks were beaver dams.
You completely blew it when you claimed evaporation was up due to a warmer climate when the actual case is evaporation is down both due to water surfaces diminishing since the middle of the century due to water levels going down due to precipitation. . . .and pan evaporation is also down due to less sun light reaching the surface. Percolation is up due to lower water tables due mostly to new agriculture and isn’t comparible over a 100 year period of time pre development.
Sorry but you are going to have to come up with some specific arguments to convince me that drought in the southwest has anything at all to do with anything but changes in precipitation. . . .and we know for a fact that is within the normal range over the last 100 years.
Those are temperatures.
If you prefer we can use the raw temperature day and the faster warming rate they show.
Much of the pre-WW2 raw data underestimated the actual temperatures.
http://cdn.arstechnica.net/wp-content/uploads/2016/01/noaa_world_rawadj_annual.png
Of course it did EM!
They were trying to eliminate the 1911 to 1944 climate change that climate models couldn’t reproduce!
Circular science is the order of the day. There was a need to put a leash on science that anoints the words from above. Instead of a science Czar or Pope, its accomplished with billions$ pumped into institutions so it can be done via a disciplined ”College of Cardinals”.
Actually we were better off having science done by private enterprise as private enterprise pays a huge price when found out. Not so with the untouchables where there is no cost for lies unless they are politically incorrect lies.
Silly Billy.
EM is against accountability. . . .at least he is when it favors his point of view.
Exxon employed scientists to study global warming. They told their bosses what the needed to know.
The bosses didn’t like what they heard so they paid other scientists to tell them what they wanted to hear.
The problem with company scientists is that ultimately the man who pays the piper calls the tune.
Think of all the scientists funded via front organisations like the Heartland Instute.
You know them, the scientists paid to tell you that leaded petrol is safe, that tobacco is good for you and that climate change is not a problem. Who are they accountable to?
Ent, how much were you paid to claim passenger jets fly backwards?
Or are you just a braindead cult idiot for free, while posing as an anonymous troll?
Entropic man says:
Exxon employed scientists to study global warming. They told their bosses what the needed to know.
The bosses didnt like what they heard so they paid other scientists to tell them what they wanted to hear.
The problem with company scientists is that ultimately the man who pays the piper calls the tune.
Think of all the scientists funded via front organisations like the Heartland Instute.
You know them, the scientists paid to tell you that leaded petrol is safe, that tobacco is good for you and that climate change is not a problem. Who are they accountable to?
——————
I didn’t say they were perfect EM. They just don’t all belong to the same corrupt organization so alternative information is certainly always available.
Further you apparently don’t understand the role of science. Science can’t prove ‘no harm’ so one should be suspect immediately of any scientist that made any such claim: ”that leaded petrol is safe, that tobacco is good for you and that climate change is not a problem”. The role of science (and auditors) is to inspect the evidence and determine if there is harm.
So far that hasn’t been done for climate change and for leaded gasoline and tobacco harm can arise from excessive use. Fact is you can excessively drink water to your detriment also and it isn’t that hard to do. Actually all you have to do is listen to doctors that tell you to drink a minimum of 8 glasses a day and follow their advice to a ‘T’. Certainly your mileage will change from individual to individual but so does ones tolerance to other substances. As to water one has to consider how much water one is actually losing. Are you working hard in hot weather and sweating like crazy? In that case 8 might not be enough. If you aren’t working hard, aren’t hot, and not sweating its quite likely that 8 glasses of water will do nothing but drain your body of salts and other electrolytes and harm your health that way.
Bottom line is you should drink water when your body tells you too and not what some doctor tells you too without having a darned good additional reason why.
Research that countered the ‘science’ paid for by tobacco companies was undertaken under government and non-profit auspices.
The tobacco industry never corrected course, they were made to comply with the science by governments.
The tired old meme that the market prevents corporate corruption is as hollow as always. On the contrary, government regulation is the primary safeguard.
None of it is perfect, of course.
barry says:
Research that countered the science paid for by tobacco companies was undertaken under government and non-profit auspices.
The tobacco industry never corrected course, they were made to comply with the science by governments.
————————-
I suppose you actually believe what you wrote there. Its wrong and its wrong for the same reason that people continued to smoke after 1953 when the science came out that smoking was bad for you. Namely folks want to believe what they want to believe.
And of course that research you speak of didn’t counter any science coming from the tobacco companies. They hadn’t done any science.
Now the tobacco companies did continue to use marketing to sell their products and they sought out scientists with different points of view as to the causes of cancer. Perhaps maybe there was even a case of subsequent taint regarding those other opinions. But I am not aware of any wide spread abuse such as that.
And yes you are correct that both government labs and private, public, and quasi-public corporations did the science that established the dangers of smoking. Note many were private.
But you should know I have frequently stated my position on this matter as to conflicts of interest.
When money is involved there is a lack of independence unless that money is coming from you to a professional provider who owes you a legal duty. Your lawyer, your accountant, your engineer, your doctor, your plumber etc. pretty much without exception owes you a duty. A duty if violated you can sue them for damages and more.
Institutions receiving billions from governments are not independent any more than a tobacco company. Their money might come from you directly or indirectly but they don’t owe you squat as to a duty. If you think thats not true then you must have just fallen off the turnip truck.
And the problem isn’t that the institution or corporation has billions. Its the process of allocating the money thats at issue.
The money needs allocating in an independent manner. Instead over the past 3/4’s of century ‘expert’ committees made up of employees of the very institutions that are going to get the money makes the determinations of who gets what. So if you don’t toe the line you will be out to lunch.
And I am not speaking of any grand conspiracy here. Its nothing different in scale or shape from individual tobacco companies running their own advertising campaigns.
Too much is made of fake science. Science is manipulable because of its inherent uncertainty regarding any science built on statistics. And by manipulable I mean that its not pure science but opinion masquerading as science. Auditors are trained to detect that. We all have statistical training. We know how statistics can be abused to favor what one wants to favor.
Sure if you have uniform widgets, statistics does a great job. When it doesn’t then that opens the door for opinion.
And today most science is based on statistics and it is chock full of opinion and often far far less science.
And you seem to want to make a big deal about tobacco companies being forced to comply with science. Doesn’t seem that way to me.
Seems what we did was pass a lot of laws making smoking illegal depending upon where you are. Oh yes we required warning labels on packs of cigarettes. But the labels really didn’t do hardly anything.
—————————–
—————————–
—————————–
—————————–
barry says:
The tired old meme that the market prevents corporate corruption is as hollow as always. On the contrary, government regulation is the primary safeguard.
None of it is perfect, of course.
———————-
Indeed so.
I have spent the last 25 years writing regulations and promoting them. And 15 years before that aiding in compliance of regulations via private auditor reports, which is a significant objective of private audits.
there is nothing harder to write than a good regulation. All regulations have unintended consequences. Many regulations are unnecessary and even more are completely ineffective. But they all have unintended consequences.
Of course ones opinion about that might vary some. A lot has to do whether what you are enthused about the exercise of power and/or are a proselytizer or if your primary objective is to promote good at the least cost.
Regarding the market. You are quite wrong. Cigarettes are not illegal thus just about everybody who quit did for a reason other than regulation. the vape market (the most successful), the nicotine patch market and other aids did more than any regulation did.
IMO, regulation is only necessary to protect others and of course children. And it seems to me most of that regulation went well overboard. Its gotten pretty ridiculous. The market does fine in regulating most things that alternatives exist for. Its biggest success story is being written right now. And I am talking about ‘certified’ goods. the market here enables a bare minimum of regulation. the regulation is still difficult as the biggest risk of regulation is conglomeration and conglomeration threatens competition. You like regulation? You think its the primary answer? Well then you are right in bed with the largest of corporations if you do. the bigger the corporations get the more stifling and less effective the regulations become and everything moves a whole lot slower and costs a lot more. But hey man some people get rich off that!!!
“I suppose you actually believe what you wrote there. Its wrong and its wrong for the same reason that people continued to smoke after 1953 when the science came out that smoking was bad for you. Namely folks want to believe what they want to believe.”
That’s a completely different argument to the one I replied to.
“And of course that research you speak of didnt counter any science coming from the tobacco companies. They hadn’t done any science.”
You may not have noticed I put tobacco company ‘science’ in quotes.
You implied the corporate world does better than governments at protecting the public from corporation. The clear counter-example of the tobacco industry is typical.
Whether or not people heed medical advice is quite beside the point you made that I replied to. This:
“Actually we were better off having science done by private enterprise as private enterprise pays a huge price when found out.”
Companies generally only act when it is in their financial interests. That is the absolute core value of private enterprise. That’s why we have government regulations.
If people ‘believe what they want to believe’, where is the ‘pressure’ for companies to do the right thing?
“When money is involved there is a lack of independence unless that money is coming from you to a professional provider who owes you a legal duty.”
That legal duty is enforced by government.
“Oh yes we required warning labels on packs of cigarettes. But the labels really didn’t do hardly anything.”
Australia’s aggressive strategy saw a significant reduction in the number of per capita smokers. While smoking was in decline throughout the 20th century, there was a steeper drop-off from the late 1980s, coinciding with increasingly dire warnings on packets, higher taxes–>prices, and government regs about where to smoke.
https://www.tobaccoinaustralia.org.au/chapter-1-prevalence/1-3-prevalence-of-smoking-adults
https://www.tobaccoinaustralia.org.au/chapter-12-tobacco-products/attachment-12-1-health-warnings/12a-1-history-health-warnings
Particularly interesting is the reversal of a trend in more women smoking, which reversed in the 1980s.
The increasing regulations were, of course, met every step of the way by strenuous opposition from the tobacco industry.
Perhaps the biggest change to come from government regs is social attitudes towards smoking. I can tell you from experience. I smoked for 27 years.
” They were trying to eliminate the 1911 to 1944 climate change that climate models couldnt reproduce! ”
Where is the proof for that claim?
Who is ‘They’ ?
Sounds like the typical paranoid, pseudoskeptic message.
Bindidon says:
” They were trying to eliminate the 1911 to 1944 climate change that climate models couldnt reproduce! ”
Where is the proof for that claim?
Who is They ?
————————
Bindidon you can play the guy that just fell off the turnip truck if you want. Fine by me.
‘they’ ARE the folks who had control of the money, funded the work, and found it a pressing need to go back and tell weather station managers from a 100 years ago they were stupid.
And when did they do it? When skeptics were pointing out the models could not replicate the 1911 to 1944 rise in temperatures?
And when did the weather station managers stop being stupid? 1944? LMAO! My how convenient!
Looks to me to be a good topic to have a Congressional Investigation around on the integrity of public servants.
barry says:
”You implied the corporate world does better than governments at protecting the public from corporation. The clear counter-example of the tobacco industry is typical.”
————————–
Uh actually yes!
But you have to take that with a grain of salt. You acknowledge that not-for-profits (technically mostly private universities) had a role in bringing science forward on the matter. Harvard University is a private corporation.
Even most public institutions like UCLA are quasi-private a lot like the post office is quasi-private. they have a large amount of independence and their funding is mostly derived from non-government sources.
What I object to is the expansion of government control over our education system via a large plethora of mechanisms. Your example of tobacco science is really the example of how it should work as there was no huge government involvement in it prior to when the science truly became mature. Most of the research was non-government mandated either directly or indirectly.
Of course when I say the corporate model is better I don’t mean that we should depend on each corporation doing all the science with regards to its own impacts on public health.
I am saying that anytime you have central control at any level on any topic the door swings wide open for corruption. What matters is power! With power comes corruption. The IPCC by its shear scale is one of the most corrupt organizations on the planet.
When I mention a corporate model its a decentralized model.
The proper and best science model is decentralized and protected from the influence of power from any powerful entity. Its a model of a ”free market of ideas” and not bought off by centralized power.
Sure there is individual corruption but unless you are some kind of believer in grand conspiracies decentralized power by definition is a lack of corruption because power and corruption goes hand in hand.
So what do you want? You want a system by where taxes are low, thus power is low. Where funds from taxes go primarily toward warding off threats arising from powers outside of the jurisdiction of government. . . .such as national disaster and combined disaster response.
You want to emphasize education? Well rather than collecting taxes and divvying them up via non-independent commissions, committees, blue ribbon task forces, or international panels.
Give tax exemptions for college education. Funds from the government is best managed by an independent civil service rather than the self serving panels and commissions mentioned above.
We have to be careful as Eisenhower warned. The lesson of the MIC was well learned by others who seek power. And it seems much less so by the general population.
Like the 1953 science on smoking that was sufficient to have educated those who paid attention, that didn’t arise from anything even remotely like the IPCC model the general population didn’t pay a lot of attention to it. And that includes both me and you.
So what do we want to do about that? Send out a bunch of thugs to rip the cigarettes out of our mouths? Create monumental government industrial and institutional complexes? As Forrest Gump’s mother said: Stupid is what stupid does.
Your example of smoking science arose from a far better institutional model than what we have today.
You are actually dissatisfied with the smoking science model probably because you chose to ignore it. So why use it as support for a stupid model?
Bill,
British research of the tobacco industry was done under the auspices of the NIH. I guess government grants didn’t corrupt the research?
The point is – the tobacco companies fought the science. Private enterprise actively worked against the health of their customers. No surprise – the science went against their marketing.
We’ve seen what happens without regulations. The profit motive is like water – it seeps into any crack available. This isn’t socialist ideology, it’s the nature of the beast. I’ve worked in the corporate sector. This is not controversial, it’s the bread and butter of a competitive market.
Corruption is not some sole province of government, it is across all society. Best you can do is put mechanisms in place to reduce it. This includes oversight and competition. For the market, oversight is done by government and consumers, and the competition is other players and consumer choices. For government it is independent watchdogs and elections.
A mixed economy seems like the best answer currently, a balance of capitalism and government regulation.
“The IPCC by its shear scale is one of the most corrupt organizations on the planet.”
1) How large is the IPCC?
2) What is its structure?
3) How does this lead to it being “one of the most corrupt organizations on the planet?”
No idea what you mean by being dissatisfied by the “tobacco science model.” My point was that you cannot trust private enterprise to provide honest health and safety (and quality) assessments of their products, and that we need more oversight than consumer choices. The history on that is quite clear.
I’d also like to see some link or something for the claim about model deficits for early 20th century. Where does this come from?
“The proper and best science model is decentralized and protected from the influence of power from any powerful entity. Its a model of a ‘free market of ideas’ and not bought off by centralized power.”
That is certainly how most science is accomplished these days.
It is mistake to to portray the IPCC as the director or funder of science. It isn’t.
All the science in the IPCC reports is carried out by multiple independent researchers, who are often competitors.
barry says:
”British research of the tobacco industry was done under the auspices of the NIH. I guess government grants didnt corrupt the research?
The point is the tobacco companies fought the science. Private enterprise actively worked against the health of their customers. No surprise the science went against their marketing.”
————————–
Of course they did. Good science arises out of a healthy debate among experts.
The fact there was a debate should be sufficient warning to users. So I suppose you blame your own addiction on the tobacco companies and favored their arguments over those that arose from neutral sources. Right?
——————————-
——————————-
——————————-
——————————-
——————————-
——————————-
barry says:
”Weve seen what happens without regulations.”
————————-
Erecting strawmen doesn’t help your argument. I clearly said some regulation was necessary and that I am involved in creating hopefully smart regulation.
——————————-
——————————-
——————————-
——————————-
——————————-
——————————-
barry says:
Corruption is not some sole province of government, it is across all society. Best you can do is put mechanisms in place to reduce it. This includes oversight and competition. For the market, oversight is done by government and consumers, and the competition is other players and consumer choices. For government it is independent watchdogs and elections.
———————–
You think there is disagreement on that? Did we elect Dr. Fauci? Nope! Should persons paid by corporations be the ones deciding what science gets done? Nope! But thats what we have got!!! And as you point out correctly corruption rules from every perspective. Thus you need processes whereby if Congress delegates its authority it is only to persons who are independent regarding the decisions they make. As you do agree that is a huge problem.
——————————-
——————————-
——————————-
——————————-
——————————-
——————————-
barry says:
”How does this lead to it being one of the most corrupt organizations on the planet?”
———————-
An independent review was made of the IPCC by an expert and neutral group. They wrote them up on several problems. However, the IPCC rejected the recommendations that Head Authors be independent. There you have it! The most primary control of corruption openly and transparently rejected! Thats some kutzpah!
——————————-
——————————-
——————————-
——————————-
——————————-
——————————-
barry says:
No idea what you mean by being dissatisfied by the ”tobacco science model.”
My point was that you cannot trust private enterprise to provide honest health and safety (and quality) assessments of their products, and that we need more oversight than consumer choices. The history on that is quite clear.
———————–
Yet you condone putting private enterprise people on panels that provide public reports and dole out public dollars for research?
You think you are not aware of it, yet you are, and haven’t connected the dots yet.
What we have today is decidedly not what we had a half century ago.
barry says:
”Id also like to see some link or something for the claim about model deficits for early 20th century. Where does this come from?”
Your questions seems to be out of place in this subthread. But if you are referring to the inability of the models to reproduce the early 20th century warming. . . .that is very well known. There was a significant warming event that occurred from 1911 to 1944. However, since the main guy that funds climate science, Kevin Trenberth, declared the instruments must be wrong subsequently was answered by funding requests for reviewing the station manager entries which resulted in some but not all of the temperature bump. Made to order science. . . .why wouldn’t you expect that when the main funder guy declared it must be true before the work was even started. LMAO!
“An independent review was made of the IPCC by an expert and neutral group. They wrote them up on several problems.”
Yep the IAC report.
https://www.google.com/url?sa=t&source=web&rct=j&url=https://archive.ipcc.ch/pdf/IAC_report/IAC%2520Report.pdf&ved=2ahUKEwjZ6LiXtPf5AhXCFmIAHazfA8wQFnoECCIQAQ&usg=AOvVaw2j6rqjH3XmvEi-t79bHahs
They did not seem to agree with your assessment that the IPCC ” is one of the most corrupt organizations on the planet.”
On the contrary, they simply suggested improvements.
They were being polite Nate.
The finding was promoting ones own work rather than what the mission of the IPCC was.
For a CPA that would be a career ending violation.
But thats just where the corruption starts. Political editing of the final documents is even worse. The summary for policy makers is edited by policy makers to provide false scientific cover for policy makers to select outcomes.
this
Average number of sunspots very stable.
https://i.ibb.co/0fbJNBR/EISNcurrent-1.png
European Commission President Ursula von der Leyen on Tuesday rejected the Polish government’s demand for a temporary suspension of the EU Emissions Trading System (EU ETS). Such a move would have helped stop energy price hikes. – We need the ETS to reduce carbon emissions, von der Leyen announced in Copenhagen.
Ursula von der Leyen said that it is “CO2 that causes climate change. – We know how catastrophic the impact of climate change is. We only need to look at this summer’s drought,” the European Commission president reasoned.
“…the European Commission president reasoned”
Unfortunately, there is NO “reasoning”. EVERYTHING they see is “proof” that “carbon emissions” are causing climate change. Drought, flooding, cold waves, hot waves, clouds, clear skies, fall, winter, spring, summer — all due to “carbon emissions”!
That’s what “braindead” looks like.
Oh, but Clint~! You left out forest fires. Let’s not forget that~! 🙂
Clint R
Did you take a rational pill? Your posts are actually sounding valid. Your point is my major complaint with Climate reporting. Every extreme weather event is tied to climate change (a noted rise of global temperature the last 100 years) but no science explanations are given. Europe had a drought why is that climate change and not some annual variation in precipitation? Cliff Mass does the science and has the knowledge to do so and he finds no justification to continually link weather extremes to “climate change” what is lacking is any attempt to find underlying mechanisms that would demonstrate climate change. The currentethod relies on waiting for some extreme event and then running millions of simulations on super computers and finding a statistical probability that a given event was climate change. Not the best scientific process. Like randomly throwing darts at a board and seeing if they land in the climate change spot.
Norman,
I believe your comments are spot on. The extreme weather events of the last couple of years and “global warming” are an association, not cause-and-effect. They have never proven cause and effect nor are they likely too.
Sadly, the American public does not understand the difference between “climate” and “weather” and our wonderful news media is getting them even more confused on the issue.
Who knows when the ongoing La Nina and climate “anomalies” will end?
https://www.tropicaltidbits.com/analysis/ocean/nino4.png
We have at least two great La Nina forecast specialists on this blog.
Ask them!
Well that doesn’t include you.
I never claimed that, Linsley Hood.
You permanently do your very best to appear as a La Nina specialist.
http://www.drroyspencer.com/2021/07/uah-global-temperature-update-for-june-2021-0-01-deg-c/#comment-747886
This is why you need to save the posts from this lying piece of scum
5 month ago according to ENSO megaspecialist Bindidong
Thank you for your research.
Quite honestly it’s about time that somebody published the true story of what is happening.in the West. Most articlesabout this subject are telling the story of the megadrought and not the facts of overuse. The story that is unfolding in front of us is a true representation of how our society and our culture blame something other than themselves. We won’t become successful if we keep pointing the finger. Bottom line, there too many straws in the Big Gulp.
For the people like us your blogs helps to get ideal information and knowledge. Thanks for providing such blogs. https://www.usajacket.com/category/movie-merchandise/halloween-kills-outfit/
Dear Professor Roy,
Thank you so much for these most interesting posts on Lake Mead. What you are telling us here is what Id already suspected: Since the population of the West has simply exploded, the demand for water is outstripping the carrying capacity of the watersheds in the West. It’s just that simple; is it not? These watersheds can provide sufficient water for the population during wet years, but we simply cannot count on a wet year every year, nor should we.
What about the 20-year drought since the year 2000 that, according to some “scientists”, is “the worst in 1,200 years”? How did “scientists” manage to come up with that figure?
Sometimes I wonder if there even is a 20-year drought. It all depends on how you look at it. Looking at 20-year averages for Arizona, yes, I can see that precipitation over the last 20 years has been below normal at least in Arizona. But not every year during that time frame had below normal precipitation. Some years were above average.
Furthermore, the year 2020 in Arizona was the driest in the States history. That’s not exactly unprecedented since records only go back to the mid 1890s. There were actually a couple of years in the 1950s that were almost as dry.
If we were to treat 2020 as somewhat of an anomaly, average precipitation since the year 2K is even closer to normal. So, is there really a 20-year drought? Maybe. It all depends on how we look at the figures.
I am a strong believer in the old statistical law of “reversion to the mean”. After a series of dry years there will probably a series of wet years. Actually, it would only take a couple of wet years to boost the 20- or 25-year average back to above normal.
When the wet years come with their accompanying heavy snowfall and flooding, I predict that the news media will point their fingers directly at “climate change”. Right.
As one reader wrote in to a Tucson daily, when it doesn’t rain, that’s due to climate change. But then when it does rain, that’s due to climate change as well.
Regards,
Fred M. Cain,
Topeka, IN
Check out the bizarre title of this paper showing a large increase in water stored on land. Something is wrong in climate science.
Talk about burying the lede!
More water is being stored on land. “Land water storage trends, summed over all basins, are positive for GRACE (∼7182 km3/y) but negative for models (−450 to −12 km3/y), contributing opposing trends to global mean sea level change.”
https://www.pnas.org/doi/full/10.1073/pnas.1704665115
speak for you.
comprare patente di Guida