
 Home/Blog
The Version 6.0 global average lower tropospheric temperature (LT) anomaly for July, 2022 was +0.36 deg. C, up from the June, 2022 value of +0.06 deg. C.
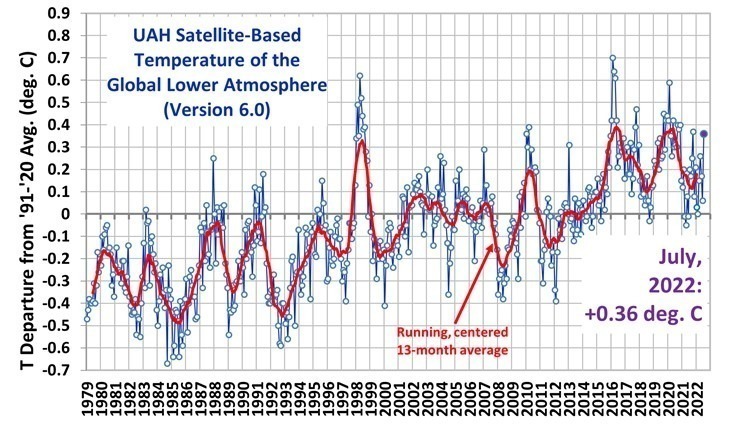
The linear warming trend since January, 1979 still stands at +0.13 C/decade (+0.11 C/decade over the global-averaged oceans, and +0.18 C/decade over global-averaged land).
Various regional LT departures from the 30-year (1991-2020) average for the last 19 months are:
YEAR MO GLOBE NHEM. SHEM. TROPIC USA48 ARCTIC AUST
2021 01  0.12  0.34 -0.09 -0.08  0.36  0.50 -0.52
2021 02  0.20  0.32  0.08 -0.14 -0.66  0.07 -0.27
2021 03 -0.01  0.13 -0.14 -0.29  0.59 -0.78 -0.79
2021 04 -0.05  0.05 -0.15 -0.28 -0.02  0.02  0.29
2021 05  0.08  0.14  0.03  0.06 -0.41 -0.04  0.02
2021 06 -0.01  0.30 -0.32 -0.14  1.44  0.63 -0.76
2021 07  0.20  0.33  0.07  0.13  0.58  0.43  0.80
2021 08  0.17  0.26  0.08  0.07  0.32  0.83 -0.02
2021 09  0.25  0.18  0.33  0.09  0.67  0.02  0.37
2021 10  0.37  0.46  0.27  0.33  0.84  0.63  0.06
2021 11  0.08  0.11  0.06  0.14  0.50 -0.43 -0.29
2021 12  0.21  0.27  0.15  0.03  1.63  0.01 -0.06
2022 01  0.03  0.06  0.00 -0.24 -0.13  0.68  0.09
2022 02 -0.00  0.01 -0.02 -0.24 -0.05 -0.31 -0.50
2022 03  0.15  0.27  0.02 -0.08  0.22  0.74  0.02
2022 04  0.26  0.35  0.18 -0.04 -0.26  0.45  0.60
2022 05  0.17  0.24  0.10  0.01  0.59  0.23  0.19
2022 06  0.06  0.07  0.04 -0.36  0.46  0.33  0.11
2022 07  0.36  0.37  0.35  0.13  0.70  0.55  0.65
The full UAH Global Temperature Report, along with the LT global gridpoint anomaly image for July, 2022 should be available within the next several days here.
The global and regional monthly anomalies for the various atmospheric layers we monitor should be available in the next few days at the following locations:
Lower Troposphere: http://vortex.nsstc.uah.edu/data/msu/v6.0/tlt/uahncdc_lt_6.0.txt
Mid-Troposphere: http://vortex.nsstc.uah.edu/data/msu/v6.0/tmt/uahncdc_mt_6.0.txt
Tropopause: http://vortex.nsstc.uah.edu/data/msu/v6.0/ttp/uahncdc_tp_6.0.txt
Lower Stratosphere: http://vortex.nsstc.uah.edu/data/msu/v6.0/tls/uahncdc_ls_6.0.txt


Thermodynamix – not to be mistaken with Aerodynamix
https://youtu.be/FP0VjeRap04
great
Tim and others: If one electric bar radiator at a certain distance warms your cheek to 315K then 16 such radiators will not cook you at 630K – I’d stake my life on it.
You CANNOT add solar and atmospheric radiative fluxes and use the sum (less non-radiative cooling flux) in Stefan-Boltzmann calculations to quantify Earth’s surface temperature as climatologists do in their computer models.
The solar flux to the Venus surface is less than 20w/m^2. The flux from the troposphere of Venus cannot and does not cause the surface temperature to rise about 5 degrees over the course of 4 months on the sunlit side as it would have to be well over 16,500 w/m^2 – non-radiative “heat creep” is what does that.
https://www.researchgate.net/publication/318008633_Planetary_Core_and_Surface_Temperatures
“Wien’s displacement law states that the black-body radiation curve for different temperatures will peak at different wavelengths that are inversely proportional to the temperature. The shift of that peak is a direct consequence of the Planck radiation law, which describes the spectral brightness of black-body radiation as a function of wavelength at any given temperature. However, it had been discovered by Wilhelm Wien several years before Max Planck developed that more general equation, and describes the entire shift of the spectrum of black-body radiation toward shorter wavelengths as temperature increases.” *
So, adding the Planck functions of 16 identical radiators does NOT shift the peak and does not produce a Planck function the same as a single source yielding 16 times the flux which, by S-B, would produce double the K temperature because 2^4 = 16.
* https://en.wikipedia.org/wiki/Wien%27s_displacement_law
I am not sure where you’re getting your information, but good topic.
I needs to spend some time learning more or understanding more.
Thanks for fantastic info I was looking for this information for
my mission.
speak for you.
comprare patente di Guida
hello , i really liked your article , i just have one simple qustion , can u you pleas tell me can i pay by paypal in amazon website ?, thanks again for this detailed article
Now Roy has updated the full data for this month
Global
https://climatedatablog.files.wordpress.com/2022/10/uah-global.jpeg
Tropics
https://climatedatablog.files.wordpress.com/2022/10/uah-tropics.jpeg
Northern Hemisphere
https://climatedatablog.files.wordpress.com/2022/10/uah-nh.jpeg
Northern ExTropics
https://climatedatablog.files.wordpress.com/2022/10/uah-noext.jpeg
Northern Polar
https://climatedatablog.files.wordpress.com/2022/10/uah-nopol.jpeg
Southern Hemisphere
https://climatedatablog.files.wordpress.com/2022/10/uah-sh.jpeg
Southern ExTropics
https://climatedatablog.files.wordpress.com/2022/10/uah-soext.jpeg
Southern Polar
https://climatedatablog.files.wordpress.com/2022/10/uah-sopol.jpeg
Long term
https://climatedatablog.files.wordpress.com/2022/10/uah-long-term.jpeg
Residuals
https://climatedatablog.files.wordpress.com/2022/10/uah-residuals.jpeg
Month on Month
https://climatedatablog.files.wordpress.com/2022/10/uah-month-on-month.jpeg
LT
https://climatedatablog.files.wordpress.com/2022/10/uah_lt.jpg
MT
https://climatedatablog.files.wordpress.com/2022/10/uah_mt.jpg
TP
https://climatedatablog.files.wordpress.com/2022/10/uah_tp.jpg
LS
https://climatedatablog.files.wordpress.com/2022/10/uah_ls.jpg