
 Home/Blog
The Version 6 global average lower tropospheric temperature (LT) anomaly for June, 2024 was +0.80 deg. C departure from the 1991-2020 mean, down from the May, 2024 anomaly of +0.90 deg. C.
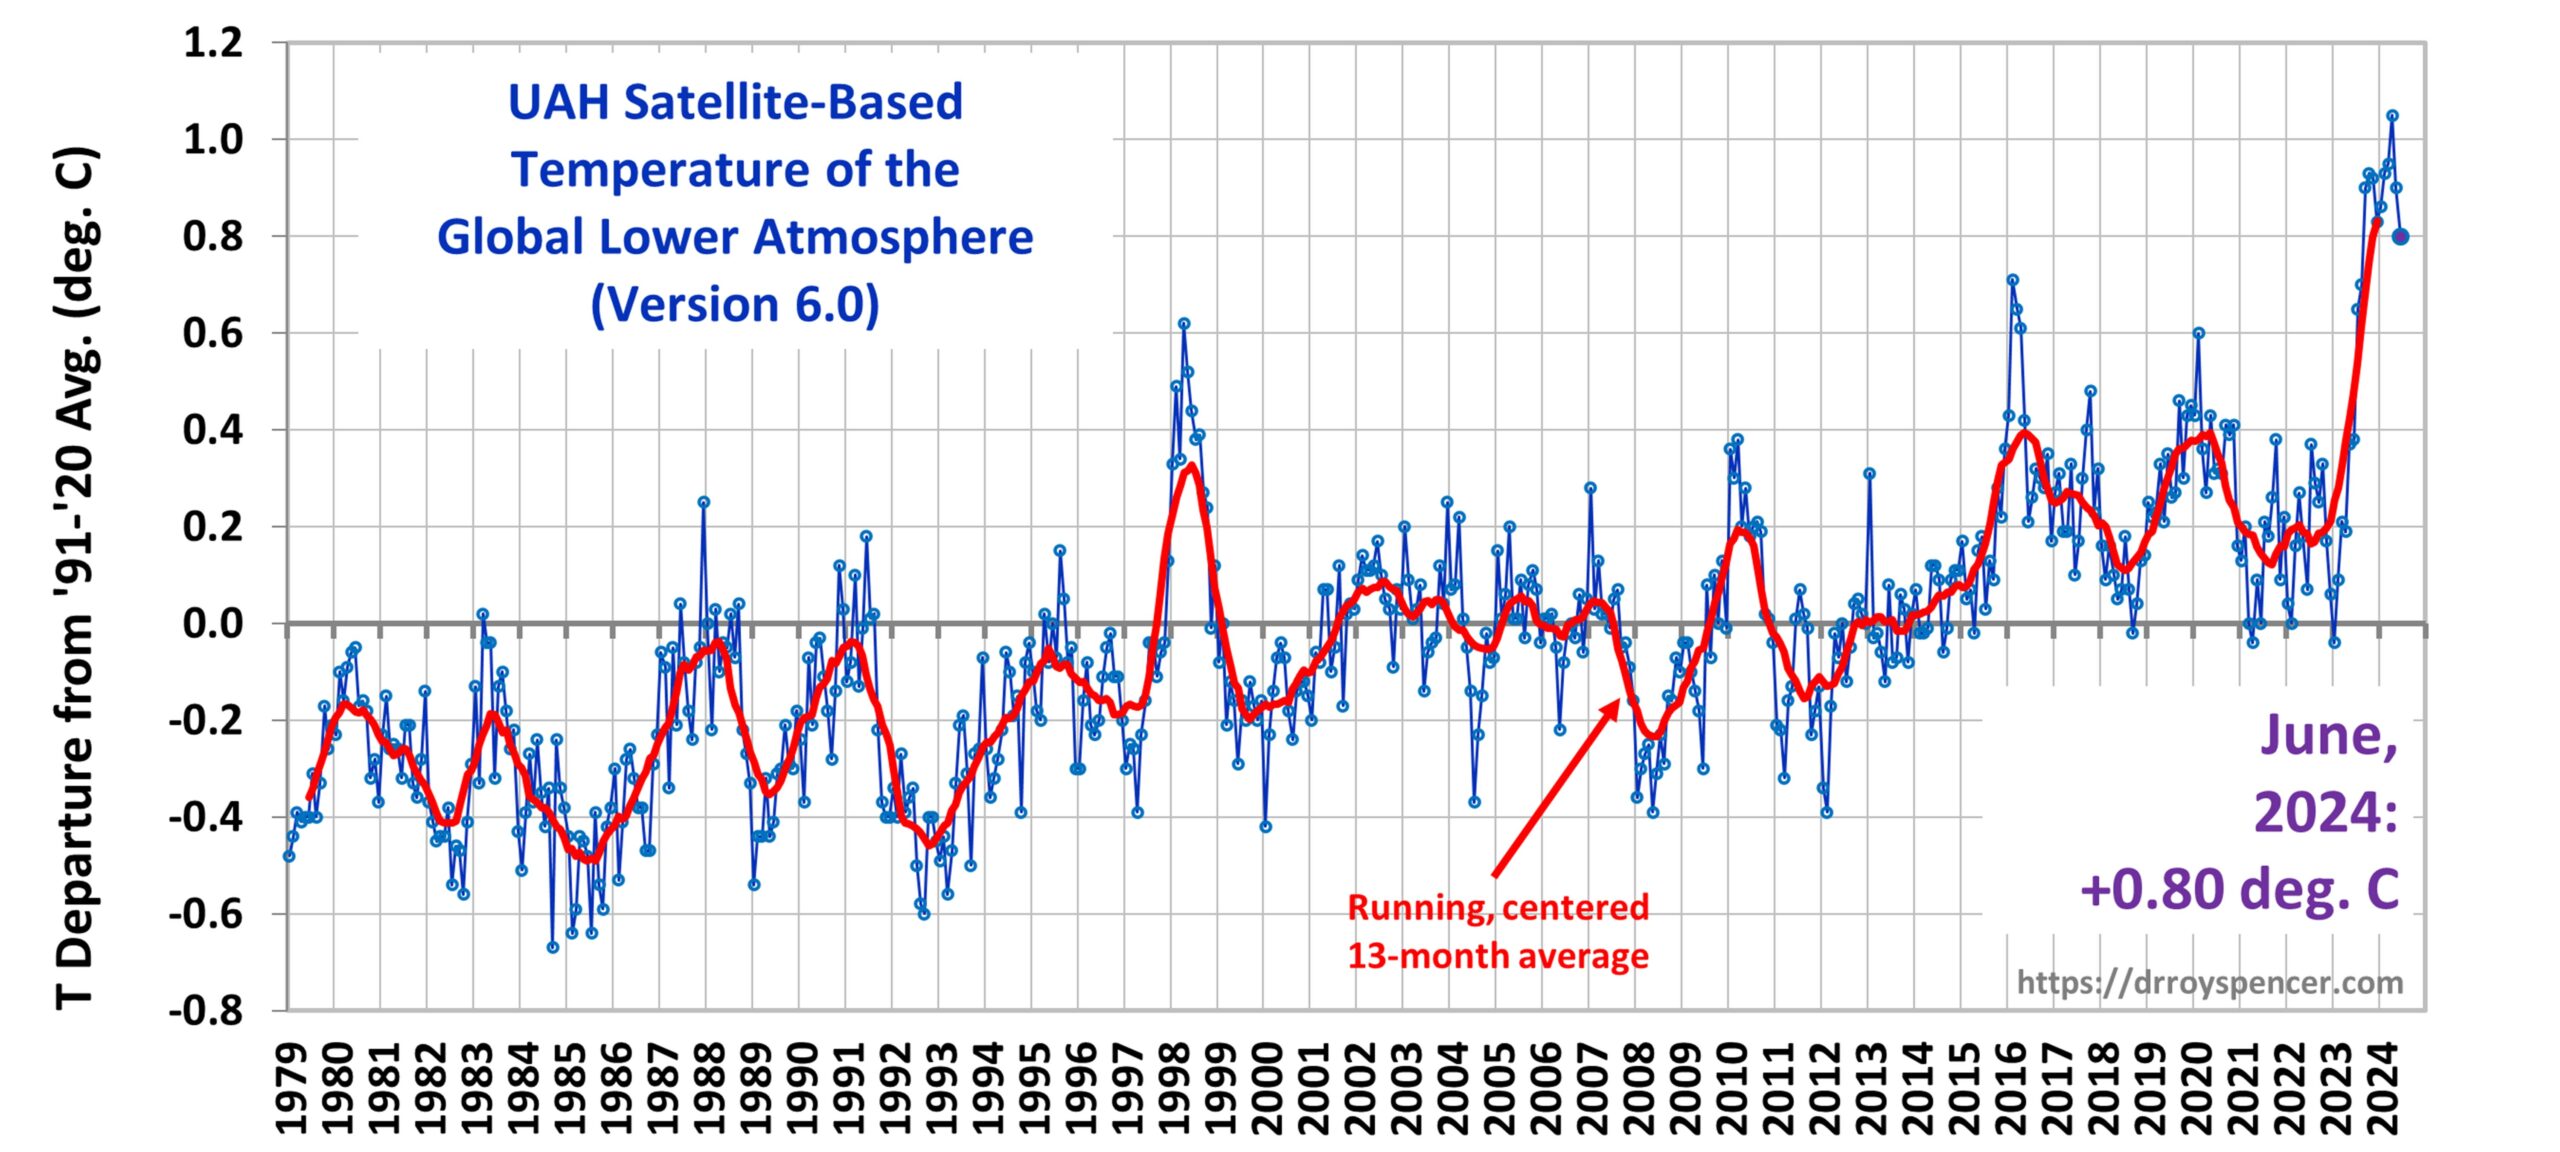
The linear warming trend since January, 1979 remains at +0.15 C/decade (+0.13 C/decade over the global-averaged oceans, and +0.20 C/decade over global-averaged land).
The following table lists various regional LT departures from the 30-year (1991-2020) average for the last 18 months (record highs are in red):
| YEAR | MO | GLOBE | NHEM. | SHEM. | TROPIC | USA48 | ARCTIC | AUST |
| 2023 | Jan | -0.04 | +0.05 | -0.13 | -0.38 | +0.12 | -0.12 | -0.50 |
| 2023 | Feb | +0.09 | +0.17 | +0.00 | -0.10 | +0.68 | -0.24 | -0.11 |
| 2023 | Mar | +0.20 | +0.24 | +0.17 | -0.13 | -1.43 | +0.17 | +0.40 |
| 2023 | Apr | +0.18 | +0.11 | +0.26 | -0.03 | -0.37 | +0.53 | +0.21 |
| 2023 | May | +0.37 | +0.30 | +0.44 | +0.40 | +0.57 | +0.66 | -0.09 |
| 2023 | June | +0.38 | +0.47 | +0.29 | +0.55 | -0.35 | +0.45 | +0.07 |
| 2023 | July | +0.64 | +0.73 | +0.56 | +0.88 | +0.53 | +0.91 | +1.44 |
| 2023 | Aug | +0.70 | +0.88 | +0.51 | +0.86 | +0.94 | +1.54 | +1.25 |
| 2023 | Sep | +0.90 | +0.94 | +0.86 | +0.93 | +0.40 | +1.13 | +1.17 |
| 2023 | Oct | +0.93 | +1.02 | +0.83 | +1.00 | +0.99 | +0.92 | +0.63 |
| 2023 | Nov | +0.91 | +1.01 | +0.82 | +1.03 | +0.65 | +1.16 | +0.42 |
| 2023 | Dec | +0.83 | +0.93 | +0.73 | +1.08 | +1.26 | +0.26 | +0.85 |
| 2024 | Jan | +0.86 | +1.06 | +0.66 | +1.27 | -0.05 | +0.40 | +1.18 |
| 2024 | Feb | +0.93 | +1.03 | +0.83 | +1.24 | +1.36 | +0.88 | +1.07 |
| 2024 | Mar | +0.95 | +1.02 | +0.88 | +1.35 | +0.23 | +1.10 | +1.29 |
| 2024 | Apr | +1.05 | +1.25 | +0.85 | +1.26 | +1.02 | +0.98 | +0.48 |
| 2024 | May | +0.90 | +0.98 | +0.83 | +1.31 | +0.38 | +0.38 | +0.45 |
| 2024 | June | +0.80 | +0.96 | +0.64 | +0.93 | +1.65 | +0.79 | +0.87 |
The full UAH Global Temperature Report, along with the LT global gridpoint anomaly image for June, 2024, and a more detailed analysis by John Christy, should be available within the next several days here.
The monthly anomalies for various regions for the four deep layers we monitor from satellites will be available in the next several days:
Lower Troposphere:
http://vortex.nsstc.uah.edu/data/msu/v6.0/tlt/uahncdc_lt_6.0.txt
Mid-Troposphere:
http://vortex.nsstc.uah.edu/data/msu/v6.0/tmt/uahncdc_mt_6.0.txt
Tropopause:
http://vortex.nsstc.uah.edu/data/msu/v6.0/ttp/uahncdc_tp_6.0.txt
Lower Stratosphere:
http://vortex.nsstc.uah.edu/data/msu/v6.0/tls/uahncdc_ls_6.0.txt


At 0.8C, still a record for June, by a long way, completing a full year of record breaking. Next was 0.44C is 1998.
Your own site has only +0.56 with one day to go.
Climate Reanalyser has +0.69 with five days to go (adjusted to UAH baseline).
I think CR is probably closest to reality.
HTE has been amazing.
Why am I not surprised?
The rollercoaster is going down Nick
Hans Erren
” The rollercoaster is going down… ”
You remind me of one of the biggest “specialists” of this blog, who three years ago claimed that the fact that UAH 6.0 LT in that year showed 10 months in a row lower anomalies than in the same months of the previous year was a clear sign of cooling.:–)
*
I tried to explain to him that when you store the UAH time series in a SQL database and select all previous years showing the same behavior, you obtain this:
1981
1982
1989
1992
1999
2011
*
Wacht alstublieft, meneer Erren. De achtbaanrit komt misschien sneller weer omhoog dan we denken.
Bindidon Don’t put all your hopes on a transient spike, as people did in 1998
Strange, but I remember this blog for years being full of deniers using the 1998 “spike” to confabulate spurious hopes of a “cooling trend”. Right up until about 2016, in fact.
Hans may be a big fan of the Moncton Paws.
Speaking of whom, where is our viscous Viscount?
Elliott Bignell says:
”Strange, but I remember this blog for years being full of deniers using the 1998 spike to confabulate spurious hopes of a ”cooling trend”. Right up until about 2016, in fact.
—————–
Wasn’t to be because nobody is looking at the right parameters. CO2 may be one but its not likely the largest one. there is too much natural variation in the instrument and ice core records for the pause to continue beyond 20 years and not show up as a cooling anomaly which requires 30 years.
the stage is now set for that to occur as the last time we were in this stage was 1940. I am not predicting that because obviously we still need to understand how much warming might be accruing from CO2 emissions, the unmeasured UHI, and human disruption of natural environments for agriculture and wood resources, not to speak of the poorly understood fluctuations of the solar dynamo.
As Dr. Syun Akasofu said if you want to attribute warming to humans you first have to learn how nature changes the climate. Milankovitch’s work identified many pulses of 20years, 100-400 years, and a large 2500 year pulse that amounted to about 35% the 100,000 year pulse.
Hunter boy
” Milankovitch’s work identified many pulses of 20years, 100-400 years, and a large 2500 year pulse that amounted to about 35% the 100,000 year pulse… ”
Your source please?
https://ebme.marine.rutgers.edu/HistoryEarthSystems/HistEarthSystems_Fall2008/Week12a/Berger_Reviews_Geophysics_1988.pdf
Elliott Bignell says:
”Strange, but I remember this blog for years being full of deniers using the 1998 spike to confabulate spurious hopes of a cooling trend. Right up until about 2016, in fact.”
Hopes? There was a cooling trend from 1998 thru 2015, the same length of time as Ben Santer’s fingerprint of anthropogenic global warming paper thus it counts as a climate cooling trend per mainstream science media.
Prior to that there was a cooling trend that lasted from 1930 to 1976 or 47 years. Since then through 2023 46 years of warming.
that of course requires drawing a trendline line through the 1998 to 2015 climate cooling period in the middle of that trend. So what is needed is an examination of what causes these trend changes.
You guys would argue that an order magnitude more CO2 emissions is the cause but it leaves a lot of natural variation unexplained.
“Hopes? There was a cooling trend from 1998 thru 2015”
FALSE!
A flat trend in UAH and rising (slower) trends in RSS and GISS.
https://www.woodfortrees.org/plot/gistemp/mean:12/from:1998/to:2016/trend/plot/rss/mean:12/from:1998/to:2016/trend/plot/uah6/mean:12/from:1998/to:2016/trend
FYI. An end at 2016 means ‘thru 2015’.
Nate had to manipulate the parameters otherwise he wouldn’t have posted anything. Here it is straight up showing a cooling trend.
https://www.woodfortrees.org/plot/uah6/from:1998/to:2016/trend
Its the same data. What ‘manupulation’?
If you zoom WAY in the 0.009 C drop in T of the fit line over 17 y, looks like a cooling trend to the ignorant masses.
And the warming of RSS over the same period shows the uncertainty is much larger.
Let’s show the honest presentation.
https://www.woodfortrees.org/plot/uah6/from:1998/to:2016/trend/plot/uah6/from:1998/to:2016
Sorry that your effort to find cooling has failed.
Your manipulation changed the cooling trend of -.014 (not -.009) to a warming trend of +.013.
Yes its small but it shows that climate length natural phenomena clearly exists of sufficient force to overcome claimed warming from CO2.
And if we actually monitored the solar constant in a fully calibrated manner over time we would be likely, per the works of Milankovitch and others, find much of the recent warming is merely part of a solar cycle that rolled out over the past 80 years especially if you multiplied by a reasonable water vapor driven M&W lapse rate variation and ice melt feedback cycle.
IMO, the ice core records validate the short term Milankovitch cycles (2500 years and less) he managed to document from planetary movements without access to modern climate records.
https://ebme.marine.rutgers.edu/HistoryEarthSystems/HistEarthSystems_Fall2008/Week12a/Berger_Reviews_Geophysics_1988.pdf
So far I have mapped out a major confluence of planetary forcing that can explain the 1940’s bump and an equal or larger one ending perhaps in 2024-2026. At a minimum it represents a large chunk of the recent warming.
One has to wonder about the silence of Bindidon. After asking for my source 5 days ago he has made no comment. One has to wonder if he read it or he was already familiar with it.
Hunter guy insists on repeating the bogus claims promoted by Monckton and others. Start with the relatively warm year of 1998 and there’s a slight cooling trend. But start with 1999 instead, the result is a warming trend:
https://www.woodfortrees.org/plot/uah6/from:1999/to:2016/trend/plot/uah6/from:1999/to:2016
Fun with data, indeed! Maybe that’s why climate is usually considered over a period of at least 30 years.
“Your manipulation changed the cooling trend of -.014 (not -.009) to a warming trend of +.013.”
Nope. No manipulation. Same exact data as yours!
No change in trend, it is -0.009 degrees in 18 years, which is -0.005 degrees/decade, which is zilch.
You dont seem to know how to read a basic graph.
“Milankovitchs work identified many pulses of 20years, 100-400 years, and a large 2500 year pulse that amounted to about 35% the 100,000 year pulse
Nothing in your paper agrees with that. You mustve imagined it.
In fact it clearly states that the Milankovitch cycles predict
“a long term cooling trend which began 6000 y ago will continue for the next 5000 y.”
E. Swanson says:
Hunter guy insists on repeating the bogus claims promoted by Monckton and others. Start with the relatively warm year of 1998 and theres a slight cooling trend. But start with 1999 instead, the result is a warming trend:
Fun with data, indeed! Maybe thats why climate is usually considered over a period of at least 30 years.
————–
Fine Swanson you live in the world of shifting goal posts that scientists dig up and replant each time their statements are proven wrong, which is a lot in climate.
Nate says:
”Nope. No manipulation. Same exact data as yours!
No change in trend, it is -0.009 degrees in 18 years, which is -0.005 degrees/decade, which is zilch.
You dont seem to know how to read a basic graph.”
Nope! Your mean samples = 12 parameter eliminates raw data.
And as far as zilch is concerned that was what I was trying to achieve to show that anthropogenic climate change can be overridden by natural change. Looking at ice core data it appears that is done regularly perhaps roughly once every 800 years. . .or in alternatively to overriding, actually create 800 years of warming that you are taking to be anthropogenic warming should it be shown that CO2 is only a paper tiger as a climate influence.
You leftists want everybody to hyperventilate about the weather. It’s just another hot Summer. It was cold last Winter. Natural variation. No more, no less.
Before:
” There was a cooling trend from 1998 thru 2015″
Now, after looking at actual data:
‘And as far as zilch is concerned that was what I was trying to achieve”
The usual silliness.
Nate says:
” ”Milankovitchs work identified many pulses of 20years, 100-400 years, and a large 2500 year pulse that amounted to about 35% the 100,000 year pulse”
Nothing in your paper agrees with that. You mustve imagined it.
In fact it clearly states that the Milankovitch cycles predict
”a long term cooling trend which began 6000 y ago will continue for the next 5000 y.” ”
Its actually really good you brought that up at this point in time.
As the conversation was revolving around disturbances ”Shorter term cooling cycles in the instrument record within a long term warming trend” you have tripped yourself up.
Likewise the Milankovitch paper which was prepared to support the Milankovitch 100,000; 41,000; and 21,000 year cycles of axial tilt and changes in eccentricity maxima minus minima.
they only pay far less attention to shorter term orbital cycles documented in the orbital perturbation section of Figure 2.
Using a ruler and the logarithmic scale the 2,500 year variation comes up to as much as 35% of the 100,000 year insolation variation from eccentricity variation (insolation isn’t affected by axial tilt or axial precession).
So examining Figure 2 you have a bump at 2,500 year periodicity of 341 times 13% times 35%=15.5 watts. This would be Milankovitch’s approximate estimate of short term variation occurring over 1 to 3 centuries during the last 400,000 years and would result in approximately 3C variation. Boy isn’t that a coincidence?
And furthermore, there is nothing in this paper to refute that. The model can be correct and its estimated 44w/m2 from the peak of the 100,000 year anomaly to the bottom of the anomaly would represent the maximum rate of change in global temperatures over the past 400,000 years.
That would put the depth of the glacial below the top of the interglacial at about 9k difference in mean surface temperature from insolation variation due to orbital perturbations.
Take a gander at this graph. Figure 5 at
https://www.bas.ac.uk/data/our-data/publication/ice-cores-and-climate-change/
It shows a climate cycle of 10-15C in greenland ice cores and 2-3C occurring simultaneously in the Antarctic during the last glacial period that are spaced ~3,250 years apart.
Finally you have this in the paper supporting that the 100,000 year cycle doesn’t progress smoothly and does significantly deviate from that alleged gradual path suddenly.
”Provided that monthly insolation (i.e., a detailed seasonal cycle) is considered for the different latitudes, their long-term deviations can be as large as 13% of the long-term average and sometimes considerable changes between extreme values can occur in less than 10,000 years.”
So absolutely not am I imagining any of this. All you have to do is read past the abstract.
Hunter guy, Did you actually read the commentary about your referenced graph from the BAS? Here it is:
They think that those cycles only pertain to glacial conditions. So, there’s no Milankovitch there.
The problem Swanson is they are in the Holocene ice cores as well both in Greenland and Antarctica. One can only develop theories like that if all you look at are glacial ice core records.
Hunter guy wrote:
Oh? Remember that the Holocene period is defined as beginning at 11,650 cal years BP (2000). That’s AFTER the end of the Younger Dryas period, which saw the last big excursion in temperatures recorded in the ice core data. The only other such event was the 8,200 year BP event, which was a short lived cooling followed by a rapid return to warmer temperatures.
Bill, you are imagining things that are not in the paper at all.
In the discussion on p 625 of the variability in figure 2, they make clear that only the peaks longer than 2500 years are Milankovitch related, ie astronomically driven.
Your pure speculation that Milankovitch is driving shorter period stuff is unsupported by this paper.
“Take a gander at this graph. Figure 5 at”
You are looking at variations of unknown origin, and speculating as to their origin.
That aint science.
Nothing in that graph indicates the CAUSE of these variations must be due to Milankovitch.
E. Swanson says:
”The only other such event was the 8,200 year BP event, which was a short lived cooling followed by a rapid return to warmer temperatures.”
Yeah well that one should be good enough for you. Pick up any detailed ice core record covering the Holocene and you will find numerous 1.5c to 3.5c excursions of temperatures.
Nate says:
Bill, you are imagining things that are not in the paper at all.
In the discussion on p 625 of the variability in figure 2, they make clear that only the peaks longer than 2500 years are Milankovitch related, ie astronomically driven.
—————-
You are selectively reading.
First, this record is a study of Milankovitch’s work and only encompasses astronomical theories and astronomical frequencies, and recent use of models. (2nd paragraph of introduction)
Second, Figure 2 labels the 10yr and more spikes as orbital variations.
Third, the description of Figure 2 says the base of these variations (the shaded area at the bottom) is a ”background level of variability, deriving from internal stochastic mechanisms and corresponding to a low degree of predictability, appears to increase in amplitude toward the longer time scales and to be overlaid by band-limited variability, due to external forcing processes and corresponding to a high degree of predictability (adapted from Mitchell [1976]).
(that completely destroys your take Nate)
Fourth, the highly predictable external caused spike amplitudes that overlay that low level of predictability due to internal stochastic mechanisms have logarthmic scales on both the x axis (relative temperature variance) and the y axis (relative frequency in years) yield starting with a maximum .34C monthly variance (max shown in UAH6) yields a maximum internal variation for times greater than 80 years of 1.15C, spikes in the range of 100 to 400 years of 1.45c, spikes of a 2500 year frequency of 3C, and a maximum glacial to interglacial mean global temperature of 10C.
Ice core records which weren’t available at the time of this paper appear to do nothing but fortify this that external variation is more than adequate to explain the warming we have seen.
xxxxxxxxxxxxxxxxxxxxxxxxxxxx
Nate says:
” ”Take a gander at this graph. Figure 5 at”
You are looking at variations of unknown origin, and speculating as to their origin.
That aint science.
Nothing in that graph indicates the CAUSE of these variations must be due to Milankovitch.”
Where did I say they ”must” be due to Milankovitch? I am saying they according to Milankovitch could be primarily due to Milankovitch theory. You obviously have absolutely nothing to reject that theory.
Obviously more work has to be done as opposed to relying on completely unestablished 3rd grader radiation models and claims that CO2 can change the dry lapse rate. See the comments above.
I think its important to note that Milankovitch may have been including solar internal variation in the internal stochastic mechanisms thus the recovery of the sun after the maunder minimum to the modern solar grand maximum from 1938 to 2010 and its feedbacks could well explain all the warming through 2020. Add an El Nino, and the convergence of the planets in the last half of 2023 through 2024 and you have the current warming blip perhaps aided some by Hunga Tunga (still waiting on quantified data of the effect on the recent depletion of ozone)
Hunter guy misses the facts of ice core data. The delta18O measurements represent both the WV source temperatures and that of the location at which the snow is deposited. There’s also seasonal variations with snow fall, for example, in colder years, winter snow fall may be small while more summer summer snow fall would add warmer fractions. The 8200 event was likely to be the last gasp of several large flooding events, which wouldn’t be repeated without warmer conditions. Then too, the region experiences Arctic Amplification, which would result in wider temperature swings compared to global averages, just as happens today.
Hunter still needs to do more homework before he hits the big time with his analysis. Have you read Alley’s book yet?
E. Swanson says:
”Hunter guy misses the facts of ice core data. The delta18O measurements represent both the WV source temperatures and that of the location at which the snow is deposited. Theres also seasonal variations with snow fall, for example, in colder years, winter snow fall may be small while more summer summer snow fall would add warmer fractions. The 8200 event was likely to be the last gasp of several large flooding events, which wouldnt be repeated without warmer conditions. Then too, the region experiences Arctic Amplification, which would result in wider temperature swings compared to global averages, just as happens today.”
So what are you claiming here? According the EPA: ”Since 1901, global precipitation has increased at an average rate of 0.03 inches per decade, while precipitation in the contiguous 48 states has increased at a rate of 0.18 inches per decade.” Its also been getting warmer, not colder.
Hunter guy wrote:
“Hunter guy misses the facts of ice core data.”
In non-polar regions there is more GHE effect at night than in the daytime thus these regions often experience higher mean daily temperature with nighttime temperature increasing twice as much as daytime temperature from a combination of more sunlight due to orbital variation and solar changes. . .and who knows CO2 emissions also.
But summer and winter on the ice sheets is different. Summer is all sunlight and winter is all darkness.
Summers in the Arctic have gotten cooler and winters warmer.
We went through this before when you were criticizing UAH data gathering claiming they underestimated the hot summers. Probably because you read this somewhere and you can’t reject it.
Yet DMI arctic temperature monitoring shows the arctic getting cooler in the summer and a lot warmer in the winter, just the opposite of what you just claimed.
So does this explain Antarctic deamplification? Seems so. While Arctic amplification is simply more water surfaces and less ice surfaces in the winter with the ice getting colder far faster than the water. . .because. . .wait for it. . .water convects and ice does not and as we know thats why oceans heat and cool much slower.
And worse here you and I are arguing the same point again.
So if anything Swanson perhaps those graphs under estimate the orbital variation excursions as water vapor plays its game out.
Hunter guy, you’ve managed to miss-state my perspective on recent Arctic changes. I don’t deny that the satellite data shows less warming during Summer than Winter, in fact I specifically pointed that out in my AGU poster paper in 2017. My point at the time was that the MSU/AMSU data understates the rate of warming during the summer months because the declining trend in sea-ice introduces a negative trend in the satellite data. That’s because open water and melt ponds appear cooler than sea-ice in the MSU 2 and AMSU 5 measurements. This is still true in the latest UAH data.
Your analysis of Arctic Amplification ignores the effects of declining snow and ice cover on albedo, which declines with a reduction of either. And, I’ve said nothing regarding the Antarctic, except that I agree with RSS’s approach, which is, to delete data poleward of 70S.
Obviously, your post is just another redirection to move away from discussing ice core data.
E. Swanson says:
My point at the time was that the MSU/AMSU data understates the rate of warming during the summer months because the declining trend in sea-ice introduces a negative trend in the satellite data.
Thats because open water and melt ponds appear cooler than sea-ice in the MSU 2 and AMSU 5 measurements. This is still true in the latest UAH data.
———————
And I pointed out to you, and you don’t seem to have absorbed my response, that the trends in the european combined climate monitoring systems reanalysis shows that there is a negative trend in summer temperatures in the Arctic. https://ocean.dmi.dk/arctic/meant80n_anomaly.php
Whereas separating out june, july, and august in the UAH data they have a positive trend. +.057C/decade. And the reason is the arctic has descending air sourced from lower latitudes via the large convection loops and that’s what UAH looks at in the lower troposphere rather than the actual surface, ice, melt ponds, and open water.
Anyway you look at it UAH summers aren’t too cold in the UAH dataset as you claimed. In fact if anything the opposite is true depending upon how much credence you want to allow the non-representative surface records.
And you are the one who brought up a summer warming trend bias in the ice core data that is simply the opposite of what you claimed there also.
this is the problem with all the thought experiments folks around here pop up with that they run with and even write papers on that get elevated by the yellow mainstream media with the help of agitating activists to what the public sees as mainstream science and this process goes on in political fora like the IPCC as well while the calmer voices get ignored by nations in the nation edited summary to policy makers and the mainstream media. Add to that pressure to add statements in abstracts to influence all the abstract only readers creates a process exactly like itemized by Dr. Michael Crichton in his novel ”State of Fear”.
Its exactly the same propaganda as the fear mongering propaganda that comes out of the military industrial complex set up to fleece the public. Thank goodness we have politicians like Dr. Rand Paul to call it out.
Hunter guy wrote:
And, I pointed out to you that I also found a negative trend in Summer vs. Winter data, which I presented in a paper back in 2017. That was from an analysis of RSS data for North Polar Ocean. What I found back then was a strong negative trend in that data, particularly for the melt season, May thru August.
BTW, as noted in your reference:
Then, what is it? It’s the result of applying a model to the actual data. Which data, you ask? In the data information sheet, they write:
Not a “thought experiment, but a mixture of different data sets dumped into their weather model.
You then jump on what you think I referred to regarding ice cores. I was just pointing out what Alley mentioned about the seasonal differences of snow fall, where very cold years have mostly Summer snow, while warmer Winters might see more snow fall then and less during the Summer. This can confuse the interpretation of readings of temperature based on the yearly snow fall. All of that has nothing to do with the current temperature situation regarding the Arctic.
The rest of your anti-science rant is ignored.
well since we agree on all that why do think so many argue that ice core data is more variable than the rest of the globe?
it makes sense that with higher albedos the temperatures and steeper angles of that insolation icy areas would be less temperature sensitive to changes in insolation than surfaces with low albedo and higher angles. . . and the data you found confirming that in 2017 agrees with our assessment.
was that data from rss if they were covering 80+ in 2017? if not where did you find it?
E. Swanson says:
”Alley mentioned about the seasonal differences of snow fall, where very cold years have mostly Summer snow, while warmer Winters might see more snow fall then and less during the Summer. ”
Since you didn’t seem to sure on this statement I looked up Google AI and they say currently during these warmer winters: ” The wettest time of year in the Arctic is July through September, when more than half of the annual precipitation falls.”
Thats over 50% of the precipitation in 3 months. But since it varies somewhat from year to year Alley might be right that a few years over a few hundred might see more precipitation over the winter 3 months.
Hunter guy wrote:
No, Hunter, it’s not about “changes in insolation”, but changes in surface albedo and what happens to the incoming SW. Open water absorbs more sunlight than ice or snow, warming the area, though the albedo is somewhat greater compared to that at lower latitudes, given the effects of high zenith angles.
Note that the data I usesd was from the RSS web site and they define “North Polar” as 60N to 82.5N, as you should know by now.
Your Google AI based reply has nothing to do with weather over Greenland. Just another example of your ignorance, which could be cured by doing some real homework. Provided, of course, you really cared.
E. Swanson says:
”No, Hunter, its not about changes in insolation, but changes in surface albedo and what happens to the incoming SW. Open water absorbs more sunlight than ice or snow, warming the area, though the albedo is somewhat greater compared to that at lower latitudes, given the effects of high zenith angles.”
————————————
So you claim that changes in insolation are too small? What is your data source and how was it calibrated?
And of course high zenith angles also occur twice a day at the equator and vary over the seasons and so does the texture of the ocean, the texture of the ice, the amount of water vapor, etc. Not to speak of changes in albedo for every element on earth, including water pollution, air pollution, ice pollution, snow pollution etc.
At least we have the technology to pin down insolation and you need that to correctly calculate any effects of albedo.
xxxxxxxxxxxxxxxxxxxxxxxxxxxxxxx
E. Swanson says:
Note that the data I usesd was from the RSS web site and they define North Polar as 60N to 82.5N, as you should know by now.
Your Google AI based reply has nothing to do with weather over Greenland. Just another example of your ignorance, which could be cured by doing some real homework. Provided, of course, you really cared.
——————————-
Seemed at least specific for the Arctic mean which includes Greenland. Thought it might help since you didn’t seem to have anything else. No need to get testy. You could have simply answered the question I posed. Which was: ”well since we agree on all that why do think so many argue that ice core data is more variable than the rest of the globe?”
Obviously a clear answer would come from some source of managed observations over extended periods of time at an appropriate site. Don’t you think? I mean they called that science in my science classes.
background level of variability, deriving from internal stochastic mechanisms and corresponding to a low degree of predictability, appears to increase in amplitude toward the longer time scales”
Yep internal variability, ie NOTHING to do with planetary positions which is EXTERNAL.
“Where did I say they must be due to Milankovitch? I am saying they according to Milankovitch could be primarily due to Milankovitch theory. You obviously have absolutely nothing to reject that theory.”
Yes I do. It makes no sense!
Milankovitch is only about Earth’s orbital variation, which are well known to be long term, after many many planetary nudges.
Whereas you erroneously think the planetary positions have an almost immediate effect on Earth, but offer no numerics or legit sources to back that up.
That aint science. To imagine the planetary positions have unexplained effects on Earth is very much like Astrology.
Hunter guy continues his run around the bush to avoid reality, writing:
Sounds great, except when one refers to the ice core data. That data involves conditions before about ~1850, AIUI. And, where are such sites in today’s Arctic, except land stations around the edges of the Arctic Ocean, which leaves out what happens on the sea-ice?
Riddle me this, (as Willard might say), if the melt season ocean temperatures above the Arctic Ocean are cooling, as the MSU/AMSU suggests, why has the sea-ice extent and area measurements show decline, with more thin first year ice instead of multi-year ice?
E. Swanson says:
”Riddle me this, (as Willard might say), if the melt season ocean temperatures above the Arctic Ocean are cooling, as the MSU/AMSU suggests, why has the sea-ice extent and area measurements show decline, with more thin first year ice instead of multi-year ice?”
Quite a few reasons.
1) Lower troposphere air warmer than surface? Wonder if there are any good trend information from radiosondes.
2) Surface cooling comes from ERA5 and RSS. Maybe they are both modeled wrong or modeled more to surface temperatures as we can expect that upper air temps would be higher due to subsiding warm air to feed the polar vortex from the tropics via the Brewer Dobson circulation.
3) Melting surface ice extracts heat from the air thus less melt from air temperatures via both conduction and radiation at the surface.
4) Primary melt increase due to warmer SSTs moving from tropics. Heat transfer to water per degree is many times that of that to air so even though the oceans are warming more slowly they are going to still melt ice a lot faster.
We should note that ERA5 has the cooling ended in the Arctic in recent years and recognizes Arctic summer temperatures have recovered to the 0 line. Seems inline with rates of ice melt.
Hunter guy posts lots of speculation, but no supporting facts. And, please note that the RSS TLT ocean data I used is from about the same pressure height as the UAH LT.
So, here’s some sea-ice data for you to chew on.
Posted too soon. Trying again for sea-ice monthly trends.
May, June, July, August, September
How does these data square with your “80+” data?
E. Swanson says:
”Hunter guy posts lots of speculation, but no supporting facts.”
———————-
You asked for my opinion. I labeled one answer as speculation about temperatures of arctic low troposphere versus surface temperatures and asked if you have a good source for Arctic radiosonde data.
I suspect you probably don’t need me to provide you proof that the melting of water absorbs 80calories a gram (enough to heat a gram of water from 5c to 85c) without warming up at all.
Nor do I suspect you need me to provide you proof of the existence of the Dobson Circulation.
Nor do I suspect you need me to prove to you water conducts heat many times better than common air.
Beyond that I have no idea what you were expecting.
E. Swanson says:
”And, please note that the RSS TLT ocean data I used is from about the same pressure height as the UAH LT.”
————————-
Which version? And are all the versions the same?
So, heres some sea-ice data for you to chew on.
E. Swanson says:
”How does these data square with your 80+ data?”
———————
Seems fine to me. That Arctic has been warming with enough winter warming to overwhelm summers as summer extent melt rate is very much tied to how thick of a layer of ice is frozen in the winter.
And note the trends in temperatures provided by ERA5 for the other seasons.
https://ocean.dmi.dk/arctic/meant80n_anomaly.php
Hunter guy, it’s well known that the surface air temperature over the sea-ice is constrained by the melting point of the ice below, as the DMI ERA40 yearly model results exhibit. But, the upper air tends to be warmer because of temperature inversion, so why would the RSS data I looked at exhibit a negative trend, particularly for June, July and August? An increase in the strength of the Brewer-Dobson circulation in the Stratosphere might be a factor, but then, one must then explain the reason for the increase in strength of that circulation. Winter warming does not explain a summer cooling trend.
BTW, one can’t compare previous UAH and RSS satellite data with the latest versions unless one saved the old data for the previous versions.
you said you compared it in 2017. have you also done it recently?
Not exactly, I’ve looked at a few points. And, lately, the NOAA STAR data server has been down, according to their web Master yesterday.
Nate says:
”Milankovitch is only about Earths orbital variation, which are well known to be long term, after many many planetary nudges.
Whereas you erroneously think the planetary positions have an almost immediate effect on Earth, but offer no numerics or legit sources to back that up.
That aint science. To imagine the planetary positions have unexplained effects on Earth is very much like Astrology.”
gravity is a real force with real effects. gravity is not derived from astrology. quite the opposite astrology is derived from the rotation of the earth sun in which gravity plays a physical role.
as is true out of sociology there is a belief that pagan religions derived from the physical reality of the earth rotating around the sun with the planets and other celestial objects creating climate changes from the motions induced by those objects.
in modern science it is upheld as the cause of the ice ages and the glacial/interglatial periods of ice ages and also accounts for natural climate change on shorter term scales. of course the pagan religions quickly introduced myths to go along with those natural physical cycles making Gods of the Sun, moon, and planets as having a mind of their own, like you are doing at this very moment.
Science has to show cause and effect. Specifically and quantitatively.
When can we expect that?
Be patient Nate. Rome was not built in a day.
Hunter guy, I ran the latest numbers from RSS and the results for monthly trends looked about like those I presented in my AGU paper. Except that for the paper, I had started by subtracting the average of the entire data set so that I could combine similar data from UAH and NOAA STAR on the same graph. As a result of this, when I looked back at my paper, I incorrectly thought that there was a melt season cooling trend in the RSS curves for the North Polar region.
The latest results show that there is warming for all months, but that for the summer melt season is less than that for the other months of the year. The calculated trends over the entire data set for RSS Land and Sea was 0.47, Land was 0.46 and Ocean was 0.49.
Swanson says:
The calculated trends over the entire data set for RSS Land and Sea was 0.47, Land was 0.46 and Ocean was 0.49.
———————
So what was the calculated trend for summer?
.47? What is the base of that trend? 1979 to present? 2017? what?
Hunter guy asked some questions:
Did you ever try to answer your own questions? You might begin by going to the RSS web page, which gives the same trend value for their North Polar data:
https://images.remss.com/msu/msu_time_series.html
Thank goods that you have resolved your confusion over whether RSS has a cooling or warming summer trend.
Now perhaps you can restate the logic behind your original claim that the over representation of summer precipitation in Greenlands ancient ice serves to exaggerate the climate change trends over a few hundred years seen in the detailed ice core analysis.
Hunter guy, The fact remains that the RSS and UAH data have less warming during the summer melt than during the winter freeze season.
As for Greenland ice cores, now, most of the snowfall is during winter, the cold season, but during colder Ice Age periods, the snow fall may be during the relatively warm summer season. Read Alley’s book.
BTW, if you are seriously interested, the NOAA STAR data is available again. Here’s a link to the TLT data, from which you can calculate your own anomalies for your choice of base period.
E. Swanson says:
”Hunter guy, The fact remains that the RSS and UAH data have less warming during the summer melt than during the winter freeze season.
As for Greenland ice cores, now, most of the snowfall is during winter, the cold season, but during colder Ice Age periods, the snow fall may be during the relatively warm summer season. Read Alleys book.
BTW, if you are seriously interested, the NOAA STAR data is available again. Heres a link to the TLT data, from which you can calculate your own anomalies for your choice of base period.”
Interesting. The problem as I see it is all the long term weather stations in Greenland are coastal stations mostly below 70degN that don’t get a good dose of that 6 months of darkness.
And RSS trends skyrocket for the south polar where as you say they limit their reporting to north of 70S that encompasses the lionshare of Antartica sea ice and shorelines but not the continent.
We see the same issue in West Antarctica where its warming in the Western Antarctia peninsula but not hardly warming at all or cooling in the center of the continent.
I recognize that in the 60-70 coastal zones of Greenland and Coastal Antarctica (where RSS limits its area of operations to)
you get winter summer patterns like the northern US48.
And thanks for the link.
Hunter guy wrote:
Please note that RSS masks out the area of Greenland from their TLT and perhaps their other series. They also mask out other areas of high elevations, such as the Himalayas, the Andes and perhaps parts of Alaska(?). Given that they are working with 2.5×2.5 degree boxes, it’s difficult to say how much coastal area is included or excluded without knowing the mask used. I doubt that temperatures poleward of 60N regularly experience temperatures of 90F and above as we see in the Lower 48.
BTW, i extracted some NOAA STAR TLT data for 60N to 82.5, 70N and 77N. The closer to the pole, the greater the trends for Winter. No evidence of cooling during the summer melt season months, but they don’t break out land and ocean data.
E. Swanson says:
”I doubt that temperatures poleward of 60N regularly experience temperatures of 90F and above as we see in the Lower 48.”
When I said winter/summer patterns I meant patterns of precipitation which is what we were talking about. North Dakota also gets most of its snow in winter and hardly any in summer.
The issue is precisely that above the arctic circle you get 6 months of darkness and temperatures in the winter drop way below freezing causing very low moisture in the atmosphere any distance from a body of non-frozen water. There is plenty of science to show this is the case.
E. Swanson says:
BTW, i extracted some NOAA STAR TLT data for 60N to 82.5, 70N and 77N. The closer to the pole, the greater the trends for Winter. No evidence of cooling during the summer melt season months, but they dont break out land and ocean data.
————–
Yes indeed, but you should note that NOAA STAR TLT trend for the entire database is cooler than UAH at .139c/decade with UAH at .153/decade. https://www.star.nesdis.noaa.gov/smcd/emb/mscat/
So since UAH has a slight warming trend for summer in the south polar system for reasons previously stated I would expect STAR to be flat or slight also.
It is only the ERA5 data which used models to smooth surface reports from buoys and ships on the water, and buoys dropped on the ice, and other land sources that records some cooling. That cooling has subsided recently due to the ice pack melting slower. But that might pickup again from recent natural changes in climate.
Also I would expect that the extraction of heat going into latent heat from ice melt is only noticeable at or very near the surface.
Hunter guy wrote:
No, Hunter only the North Pole experiences 6 months without sunlight. The circle of darkness expands to the Arctic Circle only t the Equinox. But, of course, the North Polar region does experience very cold temperatures during Winter.
The BOAA STAR TLT trends I found were:
60N to 82.5N = 0.312
70N to 82.5N = 0.373
77.5 to 82.5 = 0.432
The largest trend values were for January and February in the 77.5 to 82.5 data at ~0.69 k/decade. That result was like that from the DMI model results for Winter. The DMI model shows a slight cooling trend for the Spring months, which also appears similar to March in the NOAA STAR results. The three other seasons in the DMI plots do not show a cooling at the end.
E. Swanson says:
The largest trend values were for January and February in the 77.5 to 82.5 data at ~0.69 k/decade. That result was like that from the DMI model results for Winter. The DMI model shows a slight cooling trend for the Spring months, which also appears similar to March in the NOAA STAR results. The three other seasons in the DMI plots do not show a cooling at the end.
—————————-
Thanks for admitting to the Arctic summer cooling. (”do not show cooling at the end”) I already mentioned that it had flattened out recently with the reduction in ice meltback over the past decade despite increasing CO2.
But as they say a picture is worth a thousand words. So here are several thousand words.
https://ocean.dmi.dk/arctic/meant80n_anomaly.php
https://ocean.dmi.dk/arctic/meant80n.uk.php
Hunter guy quoted me incorrectly:
If you could read, you might do better in life. I pointed to a slight dip at the end of the SPRING graph, not SUMMER. As I previously noted, the surface air temperature over the high Arctic is constrained by the presence of lots of sea-ice, no big surprise then that the DMI high latitude data shows little warming during Summer.
Higher in the atmosphere, all three satellite data sets show a warming trend during the summer months. That’s he result of the temperature inversion over the cold sea-ice and ocean water. The data from the three groups do exhibit a reduced warming “spike” for July, a month with the Sun relatively high in the sky, perhaps the result of melt ponds on the surface of the sea-ice.
E. Swanson says:
Hunter guy quoted me incorrectly:
Thanks for admitting to the Arctic summer cooling. (do not show cooling at the end)
If you could read, you might do better in life. I pointed to a slight dip at the end of the SPRING graph, not SUMMER. As I previously noted, the surface air temperature over the high Arctic is constrained by the presence of lots of sea-ice, no big surprise then that the DMI high latitude data shows little warming during Summer.
——————
the only quote i made was: ”do not show cooling at the end”
so the entire argument you are making is built on a lie.
observe the dmi experts graphing what you are denying in the links i gave you just above and yet you base your entire argument on satellite data that that is supposed to have a higher trend than the surface and doesn’t measure the surface as dmi does. if you want to deny dmi results i can in only part sympathize with your reasoning. the older pre-1990’s data is sparse and have larger potential error. but its the best representation of arctic ”surface” temperatures since we started to intelligently plan where to drop buoys we remained in communication with.
swanson says:
”Higher in the atmosphere, all three satellite data sets show a warming trend during the summer months. Thats he result of the temperature inversion over the cold sea-ice and ocean water. The data from the three groups do exhibit a reduced warming spike for July, a month with the Sun relatively high in the sky, perhaps the result of melt ponds on the surface of the sea-ice.”
and why would relatively warm water show a reduced warming spike when its present in satellite data measuring something else?
Hunter guy, your quote left out the context, which was:
“The three other seasons” include Fall, Winter and Spring.
Don’t forget that the DMI stuff is NOT DATA, according to their write up.
You also asked:
The MSU/AMSU instruments “see” open water, such as polynias, leads and melt ponds on the top of sea-ice as colder than se-ice without ponds, etc. As a result, the decline in sea-ice area over the years and an increase in ponding would result in a negative trend added to the data.
E. Swanson says:
Hunter guy, your quote left out the context, which was:
The three other seasons in the DMI plots do not show a cooling at the end.
The three other seasons include Fall, Winter and Spring.
Dont forget that the DMI stuff is NOT DATA, according to their write up.
————————–
Wrong its as much data as any temperature record showing a regional or larger mean. So if you want to make that argument all you can say is there is no ”data” whatsoever to support any point of view.
E. Swanson says:
You also asked:
why would relatively warm water show a reduced warming spike when its present in satellite data measuring something else?
The MSU/AMSU instruments see open water, such as polynias, leads and melt ponds on the top of sea-ice as colder than se-ice without ponds, etc. As a result, the decline in sea-ice area over the years and an increase in ponding would result in a negative trend added to the data.
———————
You neglected any explanation of why that ”seeing” results in the results you are claiming. Why would these unfrozen ponds be seen as colder and not eligible to be considered to be part of the surface mean temperature? Are you trying to levitate the ponds into the atmosphere?
Keep in mind that your argument here holds no pond water. If the surface is colder thats what I am saying DMI found. And you are trying desperately to find something wrong with DMI.
If the satellites include this colder ”seeing” its still only part of what they show in total as a warming atmosphere.
Either case the surface may indeed be in a cooling trend as verified by DMI .
and your argument is too disjointed to amount to anything more than babble. This seems like a totally undocumented or quantified argument for why UAH and NOAA Star are cooler than RSS. A better argument seems to be that the for-profit RSS ignores satellite drift that the non-profit UAH and NOAA star apparently do not ignore.
Near as I can tell RSS started the drift issue then abandoned it. I have never seen a rational explanation for why.
If I am wrong about that please be my guest and educate me.
Hunter guy, there’s no “cooling trend” in the DMI summer product, it just appears that it’s flat lined.
It’s well known that the MSU/AMSU instruments measure lower temperatures over water than over land, which is the result of the differences in surface emissivity. Point of fact, the microwave instruments which measure sea-ice concentration also respond differently for water vs sea-ice, that’s how they determine their products.
All the early satellites before AQUA lacked station keeping, so the data from must be adjusted to compensate. That story has been repeated many times since S&C first published their work. Here is a list of references for you to read:
https://www.remss.com/missions/amsu/
E. Swanson says:
”Hunter guy, theres no cooling trend in the DMI summer product, it just appears that its flat lined.”
——
Thats what I said Swanson it was cooling from 1990 to 2015 and then it flat lined. But its still a cooling trend from 1990 and the data before that date was pretty flatlined also. So the cooling corresponds to increased ice loss and it has nothing to do with IR detection equipment.
xxxxxxxxxxxxxxxxxxxxxxx
E. Swanson says:
”Its well known that the MSU/AMSU instruments measure lower temperatures over water than over land, which is the result of the differences in surface emissivity. Point of fact, the microwave instruments which measure sea-ice concentration also respond differently for water vs sea-ice, thats how they determine their products.”
—————
Well known by who and whu? Scientists, wannabe scientists. Scientists don’t go by statements like that.
xxxxxxxxxxxxxxxxxxxxxxx
E. Swanson says:
All the early satellites before AQUA lacked station keeping, so the data from must be adjusted to compensate. That story has been repeated many times since S&C first published their work. Here is a list of references for you to read:
https://www.remss.com/missions/amsu/
————
There is nothing there about ice vs water Swanson. Why are you trying to change the topic?
Hunter guy wrote:
My highly trained eyeball graphic reader says that the DMI summer curve drops below flat line at about 2002 and returns after 2014. And, you show your ignorance again, the instruments used to measure sea-ice concentration are based on microwave emissions, not the IR ones, which can’t “see” thru clouds.
Your ignorance of the various satellite instruments is your problem, not mine (SEE ABOVE).
You are lying to yourself Swanson.
1) DMI shows a cooling trend for the Arctic over a period of time consistent with a 30 year definition of a climate change that allows for the 1910 to 1944 natural warming trend (and is not creatable with carbon based modeling) that was followed by a cooling trend that lasted until about 1980. That in turn was followed by a warming trend that has lasted to the present.
Thus since these oscillations can be seen as either ocean oscillations or as planetary motion, these events are all natural.
The question is how much may be unnatural. A delay in impacts in the arctic is perfectly understandable as it was necessary to first melt back thick ice before getting into a growing regime of annual ice in the early 1990’s. Since this can be explained at least in part by planetary motion in our solar system the ocean regimes we have seen are also delayed SST wise by what is accepted to be around 10 years.
2) you are also talking about differences between UAH and RSS that measures the atmosphere some good distance above the surface and may well have some element of surface radiation as well. But what that means is it tells us is
a) nothing about the surface temperatures. And it won’t until folks start agreeing they figured it out. Currently RSS is carrying the minority opinion banner.
b) DMI OTOH does tell us something about surface temperatures in the Arctic that isn’t told to us by the non-representative surface station network.
And that is because in 1979 a program was begun to start actually ‘intelligently” locate surface instruments around the Arctic. . .that at a minimum show us that AGW is overridden during arctic summers.
I realize you have nothing but satellites from the perspective of a half-assed science argument to go with here. But I am not seeing a logical argument flow out of anything you are saying. If you want to specifically address why you think the satellite data says that these melt ponds are colder than the adjacent ice that would be a good start. I just note that I haven’t seen any information from the Arctic buoy deployment on ice with melt ponds is making any kind of statement beyond the surface is cooling over all. So if you want to pursue that UAH is cooler because of cooling surface pollution that’s fine but what difference I see is RSS has intentionally overweighted the melt ponds by restricting its range to those areas more so than UAH which suggests to me its most likely RSS is too warm as typically water is warmer than ice.
And then looking to arctic summers overriding AGW sort of says something else about whether CO2 can actually warm warmer surfaces or if its saturated. I am not concluding either way but it makes me lean that way. So if you can actually mount a decent and cogent argument I can certainly be swayed.
Hunter posts another example of rambling word salad, ending with:
Hunter’s conclusion that one model effort from DMI which appears to show little warming in 1 out of 4 seasons “sort of…overrides” decades of research and data gathering regarding the GHE on a global basis. He completely ignores the effects of temperature inversions between the Arctic summer surface boundary layer and the atmosphere above. He then throws in the Slayer red herring about CO2 being “saturated”, which has been repeatedly debunked.
If you really want to learn, read a text book or take a college level course.
swanson does nothing whatsoever to defend either of claims he made that i just itemized but instead now stands in complete denial of the longer than 30 year cooling trend in the summer season of the arctic and refuses to offer any kind of a logical argument as to why he sits in denial.
Hunter guy fails to understand the facts of meteorology, such as the existence of frequent temperature inversions over the Arctic, which limit the summer surface air temperatures.
Maybe these reports I found with some searching the ‘Net will help with his enlightenment.
https://agupubs.onlinelibrary.wiley.com/doi/full/10.1029/2019JD032136
https://agupubs.onlinelibrary.wiley.com/doi/full/10.1002/2017JD027234
https://rmets.onlinelibrary.wiley.com/doi/full/10.1002/qj.3123
https://rmets.onlinelibrary.wiley.com/doi/10.1002/(SICI)1097-0088(199611)16:11%3C1297::AID-JOC86%3E3.0.CO;2-T
https://rmets.onlinelibrary.wiley.com/doi/abs/10.1002/qj.380
https://rmets.onlinelibrary.wiley.com/doi/abs/10.1002/joc.3370100509
Hmmm, Swanson changes the topic again from melt ponds to the inversions common in the arctic year round as a result of the great convective loops.
So Swanson do you consider this natural, or are you arguing that its massive negative feedback?
No, Hunter guy, I was responding to your claims that minimal Summer warming seen in DMI’s 80N+ model represented some sort of proof that there isn’t any global warming. Of course, you still haven’t provided evidence of a “30 year cooling trend in the summer season of the arctic” from the DMI data set.
Unfortunately, the first report listed was based on a cruse which didn’t make it past 80N, which was your point of reference.
The second report notes:
I grabbed those report links to allow me to up-date my limited understanding of the scientific issues and the first two supported my thinking about the existence of surface boundary layers over the Arctic Ocean. I can only hope that you also took the time to read and learn.
The possible effects of melt ponds on the MSU/AMSU data is a separate issue. I think I can see it in the data, but that’s no “proof” it occurs.
E. Swanson says:
”No, Hunter guy, I was responding to your claims that minimal Summer warming seen in DMIs 80N+ model represented some sort of proof that there isnt any global warming.”
Swanson instantly goes into the strawman building industry and claims I claimed that the fact that natural warming overwhelmed the effects of his theory of CO2 being responsible for global warming means I am trying to prove there is no global warming. Pitiful!!!
xxxxxxxxxxxxxxxxxxxx
E. Swanson says:
”Of course, you still havent provided evidence of a 30 year cooling trend in the summer season of the arctic from the DMI data set.”
Sure I did I gave you a graph of that has a line for summer Arctic anomalies that shows a negative trend from about 1990 to the present. Unless you can’t read such a graph then maybe I didn’t give anything adequate for you to comprehend. Again pitiful!!!
xxxxxxxxxxxxxxxxxxxx
E. Swanson says: ”I grabbed those report links to allow me to up-date my limited understanding of the scientific issues and the first two supported my thinking about the existence of surface boundary layers over the Arctic Ocean.”
—————–
Yes indeed Swanson. Meteorology 101 cover the topic.
xxxxxxxxxxxxxxxxxxxx
E. Swanson says:
”The possible effects of melt ponds on the MSU/AMSU data is a separate issue. I think I can see it in the data, but thats no ”proof” it occurs.”
————–
Actually that was my point. Melt ponds have been occurring in the Arctic as far as I know even during the glacial periods.
This whole thread has been about how ice cores show natural warming occurring as show here: https://www.bas.ac.uk/data/our-data/publication/ice-cores-and-climate-change/
And your response was: ”Hunter guy misses the facts of ice core data.”
And now 21 posts later, after switching goalposts around, you admit that you are just starting to learn about the topic. Sheeesh!
Previously, I pointed to what Hunter guy wrote:
You thus compared model results for 80N+ between 1958 and 2024 With global data with no obvious connection. You then jumped to a different period, cherry picking 1910 as a start date, just before the 1912 volcanic eruption at Katmi, the largest eruption in the 20th Century. I see no reason to accept that of proof of your 30 year cycle, though there are some possible candidates, such as The Hale Sunspot Cycle at ~23 years.
Hunter claimed the DMI data had a dip between in 1990 to present when I previously suggested only a slight dip starting in 2002 and returns after 2014. Let the unbiased reader make up their own mind.
Hunter continues, ending with a return to cycles of abrupt change in the data from ice cores, the ~2,500 year timing for which would likely apply only to full glacial conditions. He has yet to provide a physics based explanation for those abrupt temperature jumps, ignoring what was written in the BAS discussion of those excursions.
E. Swanson says:
”You thus compared model results for 80N+ between 1958 and 2024 With global data with no obvious connection. You then jumped to a different period, cherry picking 1910 as a start date,”
——————-
You are confused. Instrument records show the climate warming strongly between 1910-1944 at about the same rate as the modern warming between between 1980-2023.
And climate science includes the warming during that era (industrial age) as attributable to CO2 even though climate models can’t reproduce the earlier warming.
+++++++++++++++
E. Swanson says:
”just before the 1912 volcanic eruption at Katmi, the largest eruption in the 20th Century.”
——————
You are just throwing darts at the wall Swanson. Volcanoes are supposed to cool for a couple of years. Global mean temperature anomaly post Katmai eruption in June 1912 were per HC5 were
1910= -0.531
1911= -0.539
1912= -0.476
1913= -0.467
1914= -0.262
1915= -0.192
So how do you figure Katmai lowered the warming trend from 1910-1944? The only cooling that occurs in that series occurs before the eruption.
+++++++++++++++++
E. Swanson says:
”I see no reason to accept that of proof of your 30 year cycle, though there are some possible candidates, such as The Hale Sunspot Cycle at ~23 years.”
———————
Thanks for that tip! I wasn’t aware of that cycle. I will have to look it up. Its obvious that climate change has to be a combination of many factors as outlined in the work by von der Heydt, et al, 2021 those include multiple internal and multiple external means of changing the total energy the earth receives during a year. The problem is this isn’t research its just a review of some research that hasn’t dug in a lot into Milankovitch. Whether intentional or not its being slow walked. And how that happens is something I am very familiar with and so is Judith Curry.
++++++++++++++++++++
E. Swanson says:
”Hunter claimed the DMI data had a dip between in 1990 to present when I previously suggested only a slight dip starting in 2002 and returns after 2014. Let the unbiased reader make up their own mind.”
————————-
Mark Serreze, Director over at the National Snow and Ice Data Center already suggested it was due to rapid ice melt sucking up latent heat as I have been saying. Matches perfectly the years of maximum sea ice loss. He said that like 15 years ago to explain the drop in mean summer temperature before it returned to flatline after summer melt slowed.
Let your unbiased readers chew on that too.
+++++++++++++++++++
E. Swanson says:
”Hunter continues, ending with a return to cycles of abrupt change in the data from ice cores, the ~2,500 year timing for which would likely apply only to full glacial conditions. He has yet to provide a physics based explanation for those abrupt temperature jumps, ignoring what was written in the BAS discussion of those excursions.”
——————-
No I don’t have a full explanation yet.
But I have found out that mainstream press at a minimum has been misinforming the public about unfounded limitations of the Milankovitch theory. I am not seeing the same misinformation from respected journals or papers on the topic. It all seems to get spread from blogs where the misinformed post.
Further its some Milankovitch theory paper that suggested a 2,500yr orbital variation. The one in the graphic I posted from the British expedition is closer to 3,500 years.
Here is the 2500 year one.
Figure 2 of the following article.https://ebme.marine.rutgers.edu/HistoryEarthSystems/HistEarthSystems_Fall2008/Week12a/Berger_Reviews_Geophysics_1988.pdf
Hunter guy wrote:
As you note, those data were NOT for the Arctic region (aka, 80N+).
Hunter continued:
Got a reference by chance?
Sorry about that, bad math on my end. Berger wrote back in the 80’s about different “cycles”. His Figure 2 with the 2,500 year blip was taken from a paper dated 1976.
Hmmm, seems like we either have a lot of agreement or you don’t have any science to continue to advance the various arguments you have brought up during this thread.
And no I don’t have link to Mark’s comment he made on a blog 12 to 15 years ago when he made it. I doubt he wrote a paper on it and was just expressing his learned opinion as a lot of us do. But physics does tell us that melting ice does cool the immediate surroundings being warmed by the sun and the immediate surrounding air simply doesn’t convect so its going to be colder than what the satellites measure at altitude.
Yes, I think we agree that the surface boundary layer over the Arctic Ocean exhibits frequent temperature inversions, with the result that there’s little evidence for AGW in data such as the DMI “80+” stuff.
I’ve some more work to do with the UAH LT to extract some higher latitude data, which I can add to the 60N to 82.5 data they provide. Unfortunately, I can’t separate land and ocean from that data, but today was a rainy day, so I got to practice my programming skills anyway.
Good luck with your project. Just keep in mind that its a lot harder to change the temperature of the ocean surface than it is land. Land with ice would be harder than land to warm than land without ice because of latent heat take up. But I think the ocean is much worse as wave and swell action, and tide changes mix the heat down pretty routinely several meters below the surface. So in effect you have to measure total heat content change to properly compare the two.
After much thrashing thru the maze of data, I decided to submit a paper for the 2024 AGU Fall Meeting. It’s still in the works and the results won’t be available until it’s presented at the conference (if I live that long).
.8 minus .44 = .36
.36 divided by 26 years times 10 years = .138C/decade. . .and 1998 followed Pinatubo in 1992 which sent tons of SO2 molecules into the stratosphere. Seems somewhat inline with what the background warming has been with an El Nino, a solar maximum in the making, and more.
Called it!
Your ability to predict UAH TLT anomalies is impressive. I’d love to know what your method is.
Ouija.
It’s some more of that “Russian collusion” — Arkady Ivanovich….
Another monthly record. Warmest June by 0.36C. Here are the top ten warmest Junes.
Year Anomaly
1 2024 0.80
2 1998 0.44
3 2023 0.38
4 2019 0.35
5 2020 0.31
6 2016 0.21
7 1991 0.18
8 2010 0.18
9 2015 0.18
10 2002 0.17
And as Stokes says, this means there have now been 12 consecutive monthly records.
It’s also a record June for the USA, beating 2021 by 0.2C.
Looks almost certain that 2024 will be a record year. Anomalies will have to average about 0.1 for the rest of the year for that not to be the case. If it is a record this would be the first time in UAH history that there have been back to back records.
My own very simple regression model predicts 0.79 +/- 0.14C. Which would mean beating the record set last year, by over a quarter of a degree.
Bellman,
How hot will August be? Will more people die in New York from heat than 1896?
“The 1896 eastern North America heat wave was a 10-day heat wave in New York City, Boston, Newark and Chicago that killed about 1,500 people in August 1896.”
Not to worry, a recent paper co-authored by Andrew Dessler says “We estimate there are an average of 4,819 heat-related deaths per year and 31,625 cold-related deaths.”[in the US]
Maybe more heat would have resulted in less deaths?
Are you implying the existence of some heat creating effect but refusing to describe it? That would be silly, of course. Laughable, even.
Carry on.
Mike Flynn,
Which paper? Refusing to say?
Silly sock puppet!
Little Willy, please stop t-word-ing.
No warming at the surface above the equator and above 60 S. Decline in ozone over the southern polar circle.
https://www.cpc.ncep.noaa.gov/products/stratosphere/strat-trop/gif_files/time_pres_TEMP_ANOM_ALL_EQ_2024.png
https://www.cpc.ncep.noaa.gov/products/stratosphere/strat-trop/gif_files/time_pres_TEMP_ANOM_AMJ_SH_2024.png
Still well above the land-based records. Climate reanalyser has +0.69 up to the 25th. The last 7 days (June 19-25) is only +0.56.
What baseline years?
UAH baseline.
https://oz4caster.wordpress.com/wp-content/uploads/2024/07/d1-gfs-gta-daily-2024-07-01a.gif
https://oz4caster.wordpress.com/wp-content/uploads/2024/07/d4-gfs-gta-daily-2014-2024-07-01a.gif
So pretty much what I said.
Antonin, please stop t-word-ing.
2023-24 ENSO season (Jul-Jun) +0.87, just pipping 2019-20 (which just failed to qualify for what would have been the weakest and shortest El Nino) on +0.38.
Antonin, please stop t-word-ing.
DREMT wants his opponents to just stop posting TRUTHS.
…please stop t-word-ing.
I think some people here on my side of the debate forget that these anomalies are not cause for celebration.
I don’t.
You weren’t one of the ones I was thinking of.
Fimbulvetr is not a climate optimum.
Could I have the English version please.
Its interesting, but nothing more,tiny numbers over a tiny time frame, with no historical data makes it a bit like book keeping.
What are you talking about? What’s the temperature supposed to be, AQ? Maybe you prefer to live in the cold. You better start building your greenhouse then.
[A copy with slight editing of my post on last month’s thread]
.
.
gbaikies regular solar reports seem to have gone AWOL.
There appears to be a pattern to their appearance and disappearance, but I cant quite put my finger on it.
June Update: Zharkova + 39%
For those who refer to the 22-year cycle, there seems to be a problem.
The North appears to have peaked a year ago, the SAME hemisphere which peaked early last cycle. (Albeit 4 months later than last cycle, 15% stronger, and not falling away anywhere near as quickly.)
The South is still rising, as it was doing this time last cycle.
There has been no switcharoo of the timing of the peaks.
I posted it in other thread, but:
Solar wind
speed: 360.5 km/sec
density: 13.16 protons/cm3
https://www.spaceweather.com/
Daily Sun: 04 Jul 24
Sunspot number: 182
The Radio Sun
10.7 cm flux: 167 sfu
Thermosphere Climate Index
today: 28.27×10^10 W Hot
Oulu Neutron Counts
Percentages of the Space Age average:
today: -2.4% Low
11 numbered sunspots. A couple are leaving within a day.
None coming from farside, yet.
She talks about some coming:
Hurricane Beryl Barrels Down during Minor Storms & Small Flares | Solar Storm Forecast 04 July 2024
https://www.youtube.com/watch?v=kGUb15uWzBw
But a good guess is, getting weaker.
And:
–Forecast of Solar and Geomagnetic Activity
01 July – 27 July 2024
Solar activity is expected to be low levels, with occasional M-class
flares for the duration of the period.
No proton events are expected at geosynchronous orbit.
The greater than 2 MeV electron flux at geosynchronous orbit is
expected to be at moderate levels from 01-27 Jul.
Geomagnetic field activity is expected to be at unsettled to active
levels on 01-03 Jul due to possible glancing influences from
multiple CMEs. Unsettled to active levels are expected on 14-16 Jul
due to influence from a recurrent, positive polarity coronal hole
high speed stream (CH HSS). Quiet to unsettled levels are expected
on 05-13 Jul and 17-27 Jul.
—
https://www.swpc.noaa.gov/products/weekly-highlights-and-27-day-forecast
Solar wind
speed: 348.3 km/sec
density: 2.18 protons/cm3
Daily Sun: 05 Jul 24
Sunspot number: 113
The Radio Sun
10.7 cm flux: 173 sfu
Thermosphere Climate Index
today: 28.27×10^10 W Hot
Oulu Neutron Counts
Percentages of the Space Age average:
today: -2.4% Low
7 numbered sunspots. An unnumbered is coming from farside. And numbered one, 3737 is going to farside. Which is highest numbered spot, meaning it just appeared on nearside near it going to farside. Or a number of spots are growing and appearing and disappearing- as the reason for the 7 numbered spots {rather than it being somewhat, predictable]
Solar wind
speed: 354.6 km/sec
density: 1.90 protons/cm3
Daily Sun: 06 Jul 24
Sunspot number: 111
The Radio Sun
10.7 cm flux: 166 sfu
Thermosphere Climate Index
today: 28.26×10^10 W Hot
Oulu Neutron Counts
Percentages of the Space Age average:
today: -3.4% Low
8 numbered sunspots. 3738 came from farside, and 3737 has not apparently left yet. 3737 will go this time, I imagine. And 3727 “might” leave, also, maybe. And any other looks like +2 days. 3 days for a big one. None coming yet, but small spot appeared and will grow, or not, and probably will be numbered.
So probably doesn’t change much, tomorrow.
Solar wind
speed: 338.8 km/sec
density: 2.81 protons/cm3
Daily Sun: 07 Jul 24
Sunspot number: 132
“Sunspot AR3738 is growing rapidly and merits watching as a possible source of solar flares.”
The Radio Sun
10.7 cm flux: 166 sfu
Thermosphere Climate Index
today: 28.03×10^10 W Hot
Oulu Neutron Counts
Percentages of the Space Age average:
today: -2.9% Low
9 numbered spot. 2 small spots grew on nearside and got slightly bigger. 3737 left. 3727 is leaving. No spot are coming from farside, yet.
Solar wind
speed: 401.6 km/sec
density: 2.71 protons/cm3
Daily Sun: 07 Jul 24
Sunspot number: 119
The Radio Sun
10.7 cm flux: 166 sfu
Thermosphere Climate Index
today: 28.03×10^10 W Hot
Oulu Neutron Counts
Percentages of the Space Age average:
today: -2.9% Low
It will take an hour or so, to update their picture of sun.
Solar wind
speed: 396.8 km/sec
density: 3.41 protons/cm3
Daily Sun: 08 Jul 24
Sunspot number: 119
The Radio Sun
10.7 cm flux: 171 sfu
Thermosphere Climate Index
today: 27.98×10^10 W Hot
Oulu Neutron Counts
Percentages of the Space Age average:
today: -3.1% Low
9 numbered spots. The newest form on nearside {or was not there “when “it came from farside”- it days after coming from farside”. Anyhow, it’s 3171 and small {though could grow quickly OR fade quickly}.
“Sunspot AR3738 is growing rapidly and merits watching as a possible source of solar flares.”
Yes it is growing rapidly- and could continue to grow rapidly, or not. How big and how long it stay big, will effect sunspot number for the month.
3729 and 2733 are leaving to farside. Nothing else is leaving within 4 days. There spots which are suppose to come from farside in less than week, maybe less than couple days, None are coming from farside, yet. And pretty “normal” for spots to appear or disappear on the nearside {and 4 to 5 small spots could fade with couple days, and obviously 4 might appear within a couple days or the small spots could grow}.
“Forecast of Solar and Geomagnetic Activity
08 July – 03 August 2024
Solar activity is expected to be at low to moderate levels
throughout the period.
No proton events are expected at geosynchronous orbit.
The greater than 2 MeV electron flux at geosynchronous orbit is
expected to be at low to moderate levels.
Geomagnetic field activity is expected to be at unsettled to active
levels on 08, 11 and 14 Jul due to recurrent CH HSS influences.
Mostly quiet conditions are expected on the remaining days, pending
CME activity. ”
https://www.swpc.noaa.gov/products/weekly-highlights-and-27-day-forecast
Which seems to me indicate July could be about 140 or less.
140 for July, means last two months of slight increase in blue line, goes flat {sideways}.
But it doesn’t kill the NOAA experimental forecast, and though confirms, NOAA original forecast, and doesn’t disprove our girl.
If we still were in a Solar Grand Maximum, getting a couple months in the next 6 months which were +200 would be “expected” or normal or likely. But if happen, it doesn’t look good for Valentina Zharkova guess Or NOAA’s original is “wrong” and it’s experiment forecast, would immediately look good, but in another 6 month, it could not look “good”. But the people of experimant forecast it have a party if got two or one which was +220, but have to wait more time, before it was actually close to accurate.
Valentina Zharkova is max cycle starts fast, and drops fast, and does not a second peak higher than the first.
And dropping faster, would make cycle 25 min, have more effect, and Solar Grand Minimum, is all about the effects during cycle’s min.
And as I have been saying, a effect I am mostly concerned/interested in is the effect of solar min effect upon on cosmic ray {GCR radiation- it would require the adding of mass for a crew Mars mission- since Starship “could” sent a lot of mass to Mars, it’s less of an issue- but still an issue}.
And there could be some other effects of higher amount of cosmic ray impacted Earth- not seemingly a big factor, but has some unknown.
Solar wind
speed: 366.3 km/sec
density: 3.49 protons/cm3
Daily Sun: 09 Jul 24
Sunspot number: 90
“Sunspot AR3738 has a ‘beta-gamma’ magnetic field that harbors energy for M-class solar flares.”
The Radio Sun
10.7 cm flux: 169 sfu
Thermosphere Climate Index
today: 27.98×10^10 W Hot
Oulu Neutron Counts
Percentages of the Space Age average:
today: -3.1% Low
5 numbered spots. large spot coming from farside. None going to farside. None going to farside within 3 days.
Well it seems they changed it:
Solar wind
speed: 388.2 km/sec
density: 2.84 protons/cm3
Sunspot number: 95
Also saying:
“Solar wind flowing from this coronal hole could graze Earth on July 13-14, causing minor geomagnetic unrest.”
And were saying no equatorial coronal holes. And it’s moderate size equatorial coronal hole. I was going to mention it, but I forget.
equatorial coronal holes seem to me, to happen in Max when it’s quieter, but also there was a lot ribbon like holes when it was very active. It means something, maybe.
This is the start of steady global cooling.
Water vapor from the underwater volcano reducing.The peak of
Solar cycle 25 about to finish.
El Nino actually finishing right now.
ENSO dropped below the El Nino threshold in early May.
How will you choose to measure your global cooling?
Relative to this peak, as you guys tried to do after 1998 and 2016, or relative to decadal averages?
What method do you use to determine assess whether it is warming/cooling?
How long do you expect the cooling to last?
How low do you expect the UAH TLT anomalies to go?
” The peak of
Solar cycle 25 about to finish. ”
Wooooaah.
SSN monthly
https://drive.google.com/file/d/1c5UEqEHMt7Qegj0r8A1gf0NBtZzw8wJ4/view
SSN daily
https://drive.google.com/file/d/1CQoF9NsU9LaT4V9xWBxkO5HM8K6KjTtN/view
*
Maybe you wait a bit before trump(et)ing with such claims you apparently are not so quite able to prove.
The cooling actually started in 2017, in Arctic, after the record of 2016. The global cooling will now slowly moove southwards for the next 30 years.
Choose Arctic here:
https://climatereanalyzer.org/research_tools/monthly_tseries/
Frank Marella Olsen
” The global cooling will now slowly moove southwards for the next 30 years. ”
Yeah, let’s look at it:
https://i.postimg.cc/zDKmTwCh/era5-0p5deg-arctic-t2-surface-anom-1951-2000.png
And let’s compare some intervals…
2015: 3.527
2023: 2.507
Diff: 1.020
1995: 1.369
1999: 0.338
Diff: 1.031
1981: 1.033
1987: -0.402
Diff: 1.435
I guess we may have to wait a few more years before we can be sure that your prediction is correct…
See btw my reply to Hans Erren above, it’s in the same vein.
“The global cooling with now…”
Coolistas are like the cult that predicted the date that the aliens will take them to their planet, then kept having to move the date…ever hopeful.
Antonin, bdgwx, Bindidon, please stop t-word-ing.
The UAH LT climate response has followed the solar cycle influence on the ocean as expected, up and down. In May 2022 I had predicted that the 1.5C ‘limit’ would be exceeded by the sun’s ocean warming effect.
Temperatures that rose with the solar cycle #25 ascension in 2022/23 are now in 2024 following the slight TSI decline from the SC#25 peak.
https://i.postimg.cc/LX3DHrPM/TSIS-and-CFSR-Daily-Jul-2-2024.png
Until last month 2024 CERES TSI was leading 2023, but larger sunspot areas in recent months have driven TSI downspikes and a lower average.
https://i.postimg.cc/504vmjXZ/Ceres-TSI.png
As TSI could float above the decadal ocean warming threshold for a few more years, there could be another solar-driven El Nino spike by ~2027.
> In May 2022 I had predicted
Citation needed,
My 2022 LASP Sun-Climate Symposium poster.
Thanks. Here’s what I can read:
Am I missing anything?
Willard, below the text you quoted, in red, is the line of interest:
It is likely the SC #25 tropical step-up will result in exceeding the 1.5C.
This was referring to the <a href="https://i.postimg.cc/7hvjBJz5/Solar-Cycles-and-Tropical-Step-Changes.png"sun-induced tropical step-up" mentioned earlier in the poster.
Alright. So in 2022 you predicted that there would be one 1.5C excursion during the Solar cycle 25, a cycle that started in 2019-12 and will end ca 2030.
That’s quite conservative!
The correlation coefficient between UAH monthly anomalies and the SSN is NEGATIVE 0.25.
Antonin, the proper order of things is as follows:
UAH LT lags the ocean by 2 months.
The ocean warms decadally when SN ≥95 & CERES TSI ≥1361.25 W/m2.
The ocean warmed in 2022/23 as SC#25 TSI climbed above the threshold, as described in my 2023 LASP Sun-Climate Symposium Poster.
I just tried out every lag between 1 month and 132 months (11 years).
The correlation coefficient varied between -0.21 and -0.41.
Bob Weber
Would you please find me your name in the list of presenters at the 2023 LASP Sun-Climate Symposium:
https://lasp.colorado.edu/meetings/2023-sun-climate-symposium/2023-scs-agenda/
“Bob Weber
Would you please find me your name in the list of presenters at the 2023 LASP Sun-Climate Symposium:”
https://lasp.colorado.edu/meetings/2023-sun-climate-symposium/2023-scs-poster-session/
Heads up … makers of posters are not presenters. The verity or otherwise of these posters is not endorsed by LASP, so using their name to justify his claims is deceitful. It is him and him alone. LASP supports the science of AGW.
“LASP supports the science of AGW.”
What “science” is that, Ant?
“Political Science”? “Astrology”? “Phrenology”?
It ain’t physics.
https://lasp.colorado.edu/meetings/2023-sun-climate-symposium/2023-scs-agenda/
Bob Weber, your 2022 poster paper is interesting, but I think you missed a few points. Your use of Loehle 2007 apparently missed the fact that his paper was deeply flawed. He messed up so badly that he produced a correction in early 2008.
Also, using trailing running means produces a time series which is time shifted relative to the original data. Simple running means also tend to introduce aliasing and phase inversion into the data. Your 109 year SSN series ending in ~2019 actually represents the average at a date 54 years earlier than shown. The comment same applies to the 30 year average of the HadSTv3, whee the end point should be plotted ~15 years earlier. You appear to plot them ending at 2019, though you aren’t clear about that. Your Figure 8 also appears to be using a trailing running mean of Loehle’s 2007 results.
Given those problems, I lost interest in the rest of your paper.
And deeply flawed may be an understatement. It defies credulity to think a self proclaimed expert in the material didn’t understand that the academic convention is that “before present” is anchored to 1950. And if that defies credulity imagine how inept the Energy & Environment reviews had to be to not catch that mistake. It gets worse. It has now been almost 17 years and E&E still hasn’t retracted the publication. If this isn’t an example of predatory publishing then I don’t know what is.
The verity or otherwise of these posters is not endorsed by LASP, so using their name to justify his claims is deceitful. It is him and him alone. LASP supports the science of AGW.
My poster presentations were accepted by the same committee that selected the oral presenters, so it is not deceitful for me to link to my own work which the LASP symposium organizing committee also selected for presentation amongst the other poster presenters.
As well, my 2018 AGU poster was accepted for presentation even though the AGU supports AGW. It is also not deceitful to use that poster.
It just so happens actual scientists like me being there too.
E. Swanson
My figure 8 (from the 2023 poster) is of the 110 year-average Multi-Messenger Cosmogenic Sunspot Number reconstruction provided by Leif Svalgaard, not of the Loehle 2007 timeseries.
Dr. Svalgaard had plotted Loehle and Moberg et al together which I had used as my figure one to make a point.
Your concerns about the trailing averages are noted but it doesn’t matter in the end as the physical relationship using the S-B equation bears out the value of the correlation relationship perfectly.
That time period was for 1890 to 2010, not ~2019.
“Accepted” does not mean “agreed with”. Just don’t pretend it is any more than your own claims.
“”Accepted” does not mean “agreed with”. Just dont pretend it is any more than your own claims.”
But those who claim the existence of a mysterious GHE, and refuse to describe it, think “agreement” and “consensus” can turn fantasy into fact, is that it?
You wouldnt claim that something exists, but then refuse to describe it, would you?
Only a fool would do something like that.
Antonin, I haven’t pretended anything here. Your disposition is unhealthy for science; are you an authoritarian censor?
One of the responsibilities of a scientist is to communicate their findings to other scientists and to the public, which is what I do.
Are you suggesting no one can or should say anything about climate that hasn’t been approved of by the UN or ‘climate central’ first?
If the UN or climate central doesn’t agree then it gets snuffed, right?
It just so happens that LASP (and climate science in general, the AGU, etc.) does have people with diverse opinions and open minds who are not all in lockstep with the UN and ‘climate central’, and who are not so insecure as you seem to be about hearing others’ opinions like mine.
Your point about my work being ‘accepted’ is therefore unimportant, because you take advantage of the ambiguous use of that word. I said my poster was accepted for presentation, and you claimed I pretended it was accepted by ‘climate central’. That’s called gaslighting Antonin.
I guarantee there are people among the ‘climate central’ crowd that wish I was never there to challenge them. Would you be one of them?
Weber wrote:
Dr. Svalgaard’s web page lists some 18 presentations during 2019. I looked at the main ones and did not find such a plot. Your paper included no references, so, where did you get that plot?
Since I don’t follow the conversations on Climate Central, I must assume that the replies you receive there have been justified, given your poor performance with your poster.
E. Swanson, please stop t-word-ing.
Various ENSO forecasts:
“ENSO-neutral conditions are present. Equatorial sea surface temperatures (SSTs) are above average in the west-central Pacific Ocean, near average in the east-central Pacific Ocean, and below-average in the far eastern Pacific Ocean. La Niña is favored to develop during July-September (65% chance) and persist into the Northern Hemisphere winter 2024-25 (85% chance during November-January).”
https://www.cpc.ncep.noaa.gov/products/analysis_monitoring/lanina/enso_evolution-status-fcsts-web.pdf
“[The] El Niño event, which had persisted since boreal spring 2023, is likely to have ended.
It is more likely that La Niña conditions will develop by boreal autumn (60%) than ENSO-neutral conditions will continue (40%).”
https://ds.data.jma.go.jp/tcc/tcc/products/elnino/outlook.html
“The chance of a La Niña developing in the coming season has increased. When these criteria have been met in the past, a La Niña event has developed around 50% of the time.
Climate models suggest that SSTs in the central tropical Pacific are likely to continue to cool for at least the next 2 months. Four of 7 models suggest SSTs are likely to remain at neutral ENSO levels, and the remaining 3 suggest the possibility of SSTs at La Niña levels (below −0.8 °C) from September.”
http://www.bom.gov.au/climate/enso/outlook/
The Beijing Climate Centre has la Nina forming around September according to statistical models, but the heuristic models remain within ENSO-neutral.
http://cmdp.ncc-cma.net/eng/index.php?channel=92
Here are the IRI ensemble probabilities.
Season LaNina Neutral ElNino
JJA 13 83 4
JAS 32 64 4
ASO 44 51 5
SON 50 44 6
OND 55 39 6
NDJ 58 36 6
DJF 56 39 5
JFM 51 44 5
FMA 45 52 3
https://iri.columbia.edu/our-expertise/climate/forecasts/enso/current/?enso_tab=enso-iri_plume
The forecast is for a peak of -0.65 which is a weak La Nina.
https://iri.columbia.edu/our-expertise/climate/forecasts/enso/current/?enso_tab=enso-sst_table
https://www.cpc.ncep.noaa.gov/products/CFSv2/imagesInd3/nino34Mon.gif
Its not difficult to see where this is going. Down, down, down. In a couple of years we will be having the same discussion that has been going on for decades. When is it going to start warming again. The only thing different is that the warm phase of the AMO is running out of steam. Tick tock, tick tock.
” The only thing different is that the warm phase of the AMO is running out of steam. ”
That is told since years and years by a poster nicknamed ‘Richard M’.
AMO is shown everywhere in his detrended variant, which lets it look a lot ‘cooler’ than temperature data.
Here is the AMO’s most recent data I can find.
Standardized monthly values of the Klotzbach and Gray (2008) AMO index from 1950-present
https://tropical.colostate.edu/archive_amo.html
Data download:
https://drive.google.com/file/d/175bXpfazXtanJj-JdowPaA6frB9nFJAF/view
If you see here anything ‘out of steam’, feel lucky with it.
For the time being I will go with this.
https://pbs.twimg.com/media/F8uXlnpboAAKGP4?format=png&name=medium
Do you think the top is in?
Yes, for the next decade. After that who knows given the AMO and solar influence. We have to remember we are coming out of the LIA and hundreds of studies have identified long term impacts solar impacts. Throw in the CO2 effect and its a tossup.
Great. Thanks. I’ll bookmark this prediction.
Question…does your prediction consider the Earth energy imbalance and why it is positive right now?
bdgwx, the bogus Earth Energy Imbalance is an imaginary concept from the GHE false science.
Reasons the GHE is bogus:
Reason #3 — The bogus “EEI”
The bogus EEI, Earth Energy Imbalance, does NOT use units of energy. It uses units of flux. Flux is NOT energy. Whenever the cult mentions the bogus EEI, that means they don’t understand the basic physics.
Flux has units of “power per area” or “energy per time per area”. Power is not a conserved quantity, so certainly “power per area” is also not a conserved quantity. Flux “in” and flux “out do not need to balance, and often don’t balance. Example: A cone in space, with 5 times the area of its base, receiving 900 W/m² at its base will be emitting 180 W/m² at its final temperature. A flux of 900 W/m² does NOT equal 180 W/m². Flux “in” does NOT equal flux “out”.
To actually find Earth’s energy balance, energy in MUST be compared to energy out. “Energy” must be used, not flux.
But Earth’s energy seldom balances, as both incoming and outgoing energies constantly vary. That’s not a problem, as the laws of thermodynamics control temperatures. Weather is just one example of thermodynamics at work.
Hey Puffman, riddle me this –
How would total energy work with a system that continuously receives and emits energy?
“Energy” is conserved child, “flux” is NOT conserved.
Get a responsible adult to explain it to you.
Riddle me this, Puffman –
Step 1 – Pure Denial
Is this all you got?
After all these years, you should be able to grok that watts don’t stand alone.
Wrong again, child. Watts that “stand alone” results in “power”. “Power” is different from both “flux” and “energy”. Power is energy/time, and Flux is power/area.
Maybe someday when you grow up, you will understand.
Riddle me this, Puffman –
Where’s the Earth in your universe where watts “stand alone”?
Ask your mommie to show you her toaster, waffle iron, and other appliances, all rated in Watts, child.
Now, it’s your bedtime….
Hey Puffman, riddle me this –
How does it felt to have lost two of your silly talking points?
Silly sock puppet!
denny
” For the time being I will go with this.
https://pbs.twimg.com/media/F8uXlnpboAAKGP4?format=png&name=medium ”
*
No problem: that’s ESRL AMO in Wood For Trees:
https://www.woodfortrees.org/plot/esrl-amo
ESRL AMO Index
Source: NOAA Earth System Research Laboratory
Data URL: http://www.esrl.noaa.gov/psd/data/timeseries/AMO/
and thus I can download the raw data in a click without having to search which AMO variant Paul Clark chose:
https://www.woodfortrees.org/data/esrl-amo
*
And… here is the comparison with Colorado State U’s data (ESRL data was scaled up by factor 4 to get it at Colorado’s niveau):
https://drive.google.com/file/d/1MFHOw7W0b4IVBrXd4pAYJE_6GHz8-NNm/view
And… what do you see? Your choice (the red plot) shows even less ‘out of steam’, regardless which kind of mean you choose (simple running mean, cascade, polynomial…).
Unfortunately, the ESRL corner was based on Kaplan SST which was shutdown in January 2023. There is however a new variant based on ERSST5.
*
I can only say that AMO predictions showing a downturn as you expect are in between years old.
As these studies indicate we still have much to learn about multi decadal variability.
https://www.nature.com/articles/s41612-018-0044-6
https://www.nature.com/articles/s43247-021-00268-7
https://www.nature.com/articles/s41612-022-00275-1
Oh… A few lines above you wrote
” Its not difficult to see where this is going. Down, down, down. In a couple of years we will be having the same discussion that has been going on for decades.
When is it going to start warming again.
The only thing different is that the warm phase of the AMO is running out of steam. Tick tock, tick tock. ”
You seem to quickly move the goalpost to keep right, huh?
Oh what about the persistent cool phase of the PDO?
Yeah, man. When I look at the chart at the top of this article, especially the red line, I just see one thing:Down, down, down. How could anyone not see that?
Yeah, man. When I look at the red line in the chart at the top of this article, I only see one thing: Down, down, down. How could anyone miss that?
DG,
Markets always need more suckers:
https://kalshi.com/markets/gtemp/hottest-year-ever
What are you waiting for?
No betting for me, Will, but I’m thinking that 2024 will end up as the second hottest year. A very close second. Actually, it seems likely to me that 2024 could end up being the hottest year in the satellite record but #2 in the surface temperature datasets.
It doesn’t really matter. 2023 and 2024 will be so close that it will be a virtual tie. It will be two consecutive extremely hot years. The third hottest year will be a very distant third.
Not to criticise, but what is the obsession with the calendar year? That particular sample has no special privilege of which I am aware. The fact that the 13-month running mean just peaked at over 0.4C above any previous high is surely the point of note.
Of course, Elliott. I was just responding to the Kalshi link which was entitled “Is this the hottest year ever?”. When you’re tracking climate change you’ve got to look at it in increments of time, and it’s natural to think in terms of calendar years. But you are absolutely correct, the extraordinary heat of the past thirteen months is most noteworthy regardless of which year ends up as the hottest.
It’s really hard to do any kind of measurement without using some kind of conventions, Elliott. Sometimes one needs them just to distinguish versions of a piece of code.
The point isn’t that years are sacrosanct, but that everyone uses them.
Little Willy, please stop t-word-ing.
Trump will fix the climate on day one
True. He’ll just stop us measuring it!
LOL!!!
Actually, Nate, Trump has his own secret measurements. He keeps them pretty close to the vest, but sometimes he gives us a hint about them. As he told us last Thursday, under his his leadership, “We had H2O, we had the best numbers ever!”
Who could argue with that?
Found them.
Oh Nate, there is joke that is a true story. Governor Jerry Brown of California was giving a speech. He defiantly stated that if Trump takes down the satellites, the state of California will put up their own. I saw it CNN so it must be true.
The obvious irony is that the climate change believers do not like the satellite record. Surface observation will do just fine thank you.
I actually saw Jerry Brown during a very small-time social function. It must have been 1975 or 76 We did not speak, in fact he did not talk to anyone but the official politicians. There were maybe 20 people in total. He arrived with very light security and little fanfare. He was in a plain looking economy car (Dodge Dart?). There was a uniformed CHP officer driving and another one on a motorcycle. That was it. He stayed about 10 minutes to shake hands and then left.
Fortunately there are other scientific organs outside the US which he can’t shut down.
Tim S
” The obvious irony is that the climate change believers do not like the satellite record. ”
*
I fear you, like so many here, are confusing ‘satellite’ and ‘UAH’.
I can’t imagine that ‘climate change believers’ would ever disagree with RSS, as their temperature data often are higher than those measured at the surface.
That’s of course the reason why ‘climate change deniers’ reject RSS in favor of the ‘cooler’ series from UAH (and even NOAA STAR since its 180 degree turn).
Surprisingly, none of the ‘climate change deniers’ would ever disagree with RSS’ precipitation data.
Bindidon, you frame the question perfectly. There is UAH and RSS for satellite and a large number of other organization doing surface analysis. UAH and RSS use different methods to account for calibration drift and new satellites.
With so much interest in this, I would think that more organizations with ample resources would tackle this problem, and settle the question, but they do not. Why?
Would not be hard, all he has to do is make NOAA and GISS accountable for their climate fudging.
Nix Net Zero. Net Zero means a return to serfdom.
I read in the previous thread the usual coolista stuff:
” A tiny town located on Tasmanias Central Plateau just registered Australias first -10C of the year as southern Australia starts to feel the icy chill of a unusually strong mid-winter high pressure system. ”
Wooooooaah. Grrrand Coooling Ahhhead!
Some seem to simply forget that Tasmania’s Central Plateau is here and there at an altitude of about 1000 meters.
By the way, let us have a look at Tasmania’s lowest Tmins since beginning:
ASN00096033 ___LIAWENEE___________________ 2020 8 7 -14.2 (C)
ASN00095018 ___TARRALEAH_VILLAGE__________ 1983 6 30 -13.0
ASN00096003 ___BUTLERS_GORGE______________ 1983 6 30 -13.0
ASN00096021 ___SHANNON_HEC________________ 1983 6 30 -13.0
ASN00095001 ___BOTHWELL_(FRANKLIN_STREET)_ 1972 6 24 -12.5
ASN00096003 ___BUTLERS_GORGE______________ 1983 7 1 -12.5
ASN00093036 ___CAMPBELL_TOWN______________ 1972 6 24 -12.2
ASN00096033 ___LIAWENEE___________________ 2013 7 9 -12.2
ASN00093027 ___PALMERSTON_________________ 1972 6 24 -11.9
ASN00093014 ___OATLANDS_POST_OFFICE_______ 1972 6 24 -11.7
We see that such temperatures actually are not so unusual; especially because Liawenee is exactly on this famous Central Plateau, at 1057 meters.
*
However, we see also that all these temperatures below -10 C are recent. Not one night temperature below -10 C visible before 1972!
This means that Tasmania is over the long term certainly not warming at all:
https://drive.google.com/file/d/1DJWz-z83DfsgSx6U7J0bklTaRlBvZQTS/view
Tmin since 1900: -0.12 C / decade, Tmax: -0.09
And not even since the sat era in 1979: Tmin: 0.10, Tmax: 0.0.
*
No: it’s not warming everywhere, he he.
Is Australia in danger of warming.
https://i.ibb.co/PGQdfgz/gfs-T2m-aus-1.png
https://i.ibb.co/WvYMRNM/ventusky-pressure-20240702t1900-1.jpg
As always, I’m talking about decades and Palmoswki replies about days.
Thanks for the proof, Binny, that the planet is cooling.
If there is a big Atlantic Hurricane season as predicted, what effect will that have? Beryl is still Cat 5, but projected to weaken after Jamaica is hit hard.
Hurricane Beryl threatens Hispaniola and Cuba, and its eye will pass over Jamaica and hit Yucatn.
https://i.ibb.co/x5qTL7v/goes16-wv-rgb-02-L-202407021425.gif
Last year there was a massive hurricane that stayed mostly at sea. I saw a satellite image of a large area of cooler water in its path. Hurricanes cool the ocean and transport heat to the upper atmosphere. How significant is that effect?
And this shows its path:
https://www.nhc.noaa.gov/refresh/graphics_at2+shtml/173539.shtml?cone#contents
This is his path.
https://www.tropicaltidbits.com/storminfo/
https://i.ibb.co/yFw3JW3/Screenshot-2024-07-02-23-12-45.png
Expect about the same number of tropical cyclones to form.
A higher proportion of them will become hurricanes so the number of hurricanes will be larger than normal.
They are more likely to exceed Category 3.
Expect more rain and more damage than in an average year.
This might be a good time to sell your insurance company shares.
Entropic Man, please stop t-word-ing.
This spike is most likely Tonga, as I see it. No other explanation FITS as well. Sulfate from boats too long ago, El Nino contribution is there, but timing doesn’t match nor does total energy (integral under this spike) match ocean response. Sun is a lower frequency. More like decadal is the highest frequency recorded in any proxy record. And solar forcing is not large in UAH data.
So TONGA based on:
1. Spike originated too Early to be El Nino based on long standing lag in UAH to Nino 3.4
2. To protracted to be El Nino based on long term average duration and relationship with end of El Nino in Pacific
3. Tonga sent up Unprecedented water vapor, it still exists today providing the mechanism for causing a spike.
4. Timing of spike matches Tonga eruption.
5. Water vapor is the main driver of greenhouse effect.
The HTE can still be seen in the Polar Vortex, although it is lessening. The atmospheric waves are no longer apparent, but the PV winds are still being slightly affected. Some have said the effects will last 2-3 years.
With the weakening HTE and the oncoming La Niña, we could see significant drops in UAH by the end of the year.
Clint July 2 2024: “The HTE can still be seen in the Polar Vortex”
Clint February 2 2024: “the Polar Vortex is operating normally again”
Thanks for quoting me correctly, barry.
That’s always a good way to learn….
It’s a good way to see that you make it up as you go along and thus contradict yourself.
There is no other scientific explanation. It has to be related to the millions of tons of water dumped into the stratosphere by Hunga Tonga.
The stratosphere is normally a very arid place, very little WV.
However, we must remember that the 0.8C is just an average. A slight skewing of temperature in one part of the planet could account for the average tipping upwards.
> There is no other scientific explanation.
Yes there is.
“Yes there is.”
Of course, you are going to refuse to divulge what it is, arent you?
Not terribly helpful. That’s your aim, isn’t it – to be as unhelpful as possible?
Willard, please stop trolling.
Mike Flynn,
Using a silly HTML trick to write a verboten word might not be the best way to ask for a sammich.
“Mike Flynn,
Using a silly HTML trick to write a verboten word might not be the best way to ask for a sammich.”
Willard, please stop trolling.
Are you going to divulge your silly HTML trick to use the T-word, Mike?
Willard,
I have not been here frequently, so sorry if I am missing your previous logic. Can you clarify what is the other viable explanation? I am definitely open to testing other ideas.
Aaron
Another thought experiment, is the only other deviation between the Nino 3.4 and the UAH is Pinatubo. So it seems that it takes something at the scale of a decent sized volcano to create an anomaly to a well behaved system (system: UAH lags Nino 3.4 by 5 Months and total energy is highly correlated between data sets such that positive correlate with positive and vice versa).
AS,
When you’ll tell us about your scientific explanation and if it does not amount to “but volcanoes,” I’ll see what I can do.
Willard,
I basically cite this nature paper as the mechanism (
https://www.nature.com/articles/s41558-022-01568-2) . In Summary Tonga water vapor was an extraordinary event, spread as a GHG in atmosphere, still present today. Then apply to UAH data being an extraordinary response to NINO 3.4 data in pacific ocean and not just an E l Nino
My personal academic research was in paleoclimate reconstructions, so I am not an expert on atmospheric process. I just see climate shifts in many proxy records, and seek understanding in modern world what drives the high frequency changes. I published a paper on quasi periodic E l Nino patterns and am always curious what else might contribute.
AS,
Just caught your response. I answered to Mr. Asshat here:
https://www.drroyspencer.com/2024/07/uah-global-temperature-update-for-june-2024-0-80-deg-c/#comment-1677405
Looks like we rely on the same paper! Since there’s no copy of it on the Sci-Hub, here’s where I could get a copy.
As I see it, the main factor for the secular trend ought to be humans dumping CO2 in the atmosphere like there’s no tomorrow, El Nino the most proximal factor for the monthly spike, and Honga Tonga as accentuating both by 0.04C overall.
Thanks for stopping by.
Little Willy, please stop t-word-ing.
DREMT pls stop trying to censor or censure legit science commenters.
…Willy, please stop t-word-ing.
This still looks to me like some kind of instrument failure.
Yep. Worldwide thermometers got Covid, or something.
I agree.
Andrew
skeptical
” … some kind of instrument failure. ”
*
Are you serious?
Let’s compare UAH 6.0 land to the RATPAC-B land radiosondes which were inter-calibrated with UAH 5.x in 2008 at Vienna U, Austria, if I well remember.
1. UAH LT vs. RAT 500 hPa (5.5 km)
https://drive.google.com/file/d/1ayXrwM4S4KQfxQSrsHM7IInT4lhgnJed/view
2. UAH LS vs. RAT 100 hPa (16 km)
https://drive.google.com/file/d/1_juXJ0mfrFU6iO2Df-v5kXdGnr5q7eBz/view
*
The correlation between UAH LS and RATPAC at 500 hPa is less good since a few years than for the LT / 500 hPa pair; but when constructing a time series for the lower stratosphere out of no more than 85 balloons, you can’t expect the result becoming nearer to the average of no less than 9504 UAH grid cells than is shown in the 2. graph.
Should read
The correlation between UAH LS and RATPAC at 100 hPa …
What is the minimum value of UAH TLT that you would still consider instrument failure?
There is another possibility. The satellites are owned by NOAA and its not clear whether UAH gets the data straight from the satellites or via NOAA. If it comes via NOAA, they have the capability of running it through an algorithm before handing it over to UAH.
Cynical…but possible. I justify my cynicism based on my experience here in Vancouver Canada. This spring and early summer has been cooler than normal. Significantly cooler.
> Cynical…but possible.
Mr. Asshat never really told that to Roy’s face directly.O
One has to wonder why.
“Mr. Asshat never really told that to Roys face directly.O
One has to wonder why”
Maybe he didnt feel like it? Wonder away, dummy. I’m sure nobody at all cares about your “wonders”.
Willard, please stop trolling.
“Mr. Asshat never really told that to Roys face directly.O
One has to wonder why”
Maybe he didnt feel like it? Wonder away, dummy. I’m sure nobody at all cares about your “wonders”.
Willard, please stop trolling.
Mike Flynn,
You used the T-word.
That means you used your silly HTML trick to bypass moderation.
“Mike Flynn,
You used the T-word.
That means you used your silly HTML trick to bypass moderation.”
What are you babbling about? Is it anything to do with your refusal to accept the reality that there is no GHE?
What’s the T-word? Is it like the N-word, or the F-word?
Willard, please stop trolling.
wee willy’s mind is far below that of a simpleton. Why should Roy be concerned about my thoughts? I am not accusing him or UAH of chicanery, I am accusing NOAA of possible chicanery.
After all, if NOAA is an intermediary between the sat data and UAH, based on their past chicanery, it would not be beyond them to mess with the data before handing it over.
By chicanery I am referring to NOAA’s announcement that 2014 was the hottest year ever. Upon closer scrutiny, it was revealed that NOAA was claiming only a possibility that 2014 was the hottest ever, based on a 48% likelihood. GISS outdid their chicanery by claiming a 38% likelihood.
I have every bit of confidence in the integrity of Roy and UAH integrity.
Mr. Asshat feigns ignorance:
https://www.drroyspencer.com/2024/06/uah-upper-tropospheric-temperatures-corroborate-lt-temperature-trends/#comment-1676077
He’ll have to work a little harder for his conspiracy theory to take hold.
” There is another possibility. The satellites are owned by NOAA and its not clear whether UAH gets the data straight from the satellites or via NOAA. If it comes via NOAA, they have the capability of running it through an algorithm before handing it over to UAH. ”
*
Once more we see Robertson’s dumb ignorance and utterly arrogant lying.
If he had a bit of a clue through informing himself, he would know that NOAA’s satellite data is also used by NOAA itself in its STAR department.
And if he had just a bit of technical education, skills and experience, he would be able to compare UAH’s and STAR’s LT data:
https://drive.google.com/file/d/10MWqbxzBp-JVIi0O8fs4KibpF4WmKSHp/view
Linear trend for period: Jan 1981 – Dec 2023, in C / decade
UAH 6.0 LT: 0.149 +- 0.007
NOAA STAR LT: 0.138 +- 0.007
But he wouldn’t even know from where to obtain the data, let alone be able to fairly compare the downloaded time series using the simplest features of a spreadsheet calculator.
*
All what Robertson is able to do is to distort, misrepresent, discredit, denigrate and lie.
Anyone who credulously believes Robertson’s trash 100% deserves it.
Little Willy, please stop t-word-ing.
The last temperature range oscillated around about 0.25C. It will be interesting to see where the new oscillation will occur. I am going to guess about 0.5C.
More like 0.2C. Take a look at the period prior to 2016, it featured an 18 year flat trend. The 18 years before 1998 were below the baseline.
CO2 warming cannot be explained by an 18 year flat trend.
“CO2 warming cannot be explained by an 18 year flat trend.”
Why does an 18-year flat trend for the temperatures of the lower troposphere exclude CO2 as a cause of long-term warming?
(Never mind that the trend for this period is indeterminate – failing to disprove the null doesn’t prove the null)
Because CO2 lags temperature in both short and long, time scales. And, Berry has shown that most of the CO2 increase is due to natural emissions
This reply does not respond to the question asked.
I thought it did. Because CO2 doesn’t cause temperature trends. Temperature trends cause CO2.
The possible natural sources for CO2 show a net uptake over the period that the atmosphere is also accumulating CO2. There is no natural source that is losing CO2. Only the fossil fuels taken out of the ground and burned by humans.
Also, while there is a correlation between ENSO events and CO2 fluctuation, it is a factor smaller than the annual variation, and swamped by the long-term growth.
According to UAH there was 18 year ‘hiatus’ in temps between 1998 and 2016. But CO2 in the atmos climbed very steadily.
In fact, while the temps fluctuate year to year, CO2 has remained a a remarkably steady incline.
Regardless, the statement was that 18 years ‘flat’ global temperatures disprove CO2 warming. Your remarks completely ignore that ‘argument’. Gordon isn’t coming back to answer, so that’s that I guess.
That is a static, accountant’s view of CO2. CO2 flows through the atmosphere. It is dynamic. The rate of change of CO2 in the atmosphere is equal to inflows minus outflows. It is a first-order linear differential equation. Berry used this model to show that the IPCC’s carbon cycle model is wrong, that most of the CO2 in the atmosphere comes from natural emissions, Berry shows that the most that humans could have contributed to atmospheric CO2 is about 30ppm. Also, Happer has shown in his paper that if GHE is true that doubling of CO2 would only raise the temperature by about 0.6C.
This is an elementary non sequitur. The fact that temperature may drive CO2 normally is by no means good news, and by no means implies that “CO2 doesnt cause temperature trends”. In a system in which multiple factors are involved in mutual feedbacks it is perfectly possible that temperature may have driven CO2 in the past while CO2 still drives temperature today.
We have very few examples in the record of CO2 being dumped into the atmosphere in bulk – I can only think of the Chicxulub impact and the Deccan eruptions as potential cases, offhand. Study of these events and their outcomes is not uniformly reassuring.
Ah, the ole pulse argument. CO2 hasn’t been dumped into the atmosphere. Humans only account for approximately 4 percent of CO2 emissions. CO2 flows through the atmosphere. The eTime for CO2 is approximately 4-5 years according to ALL the atmospheric physics textbooks. So, virtually all, including human, CO2 molecules emitted into the atmosphere are gone within 20 years.
Stephen
Berry cannot explain why all the carbon reservoirs, atm, ocean, land, biopsphere are gaining carbon.
That can only occur by new carbon being added to all of them from some source.
Luckily we know a long buried source that has been tapped, fossil fuels.
Nate,
Berry doesn’t attempt to explain. He just shows mathematically that the IPCC’s carbon cycle model and their accounting are wrong. The atmosphere has gained carbon. It has also warmed a little. So far, neither is a bad thing.
“He just shows mathematically”
Math by itself is not science.
There are numerous simple equations that are not sufficient to account for the carbon cycle.
Science theories must be tested by observations.
And they have to take into account the constraints of the real system, such as ocean chemistry etc.
No matter how much you love a theory, if it fails to explain the observations, its wrong.
Berry’s math fails to fit the observations, its WRONG.
Nate,
What does that even mean? You can falsify a theory (or a Law) with math. That’s what Einstein did and that’s what Berry did.
Same thing happened in the 1930s, what was the cause then?
Some have written those records off as pertaining to North America only which is as ridiculous as claiming the 400+ uear Little Ice Age occurred only in Europe. In the 1930s, there was little in the way of globality and many parts of the globe were not covered with thermometers as they are today.
> Same thing happened in the 1930s,
No it did not.
“No it did not.”
What didnt happen? Refusing to say? I don’t blame you.
Willard, please stop trolling.
Mikey, did you notice that your comment applies equally to Gordon’s comment? Why don’t you ask him what DID happen. Let me address your oversight for you.
Gordon,
“Same thing happened in the 1930s.”
What happened? Refusing to say? I dont blame you.
Mike Flynn
Mike Flynn,
What didn’t happen is you not using the T-word.
Did you exploit a silly HTML trick to bypass moderation again?
“Mikey, did you notice that your comment applies equally to Gordons comment? Why dont you ask him what DID happen. Let me address your oversight for you.”
You may do as you wish. Waste your time in whatever fashion you like, if it gives you solace. Should I be concerned?
[what a foolish person]
“Mike Flynn,
What didn’t happen is you not using the T-word.
Did you exploit a silly HTML trick to bypass moderation again?”
Thank you for your concern.
[snigger]
We have someone who spends ALL waking hours EVERY day posting here and continually refreshing the page talking about wasting time.
“We have someone who spends ALL waking hours EVERY day posting here and continually refreshing the page talking about wasting time.”
Good to know.
[snicker]
Keep snickering at yourself, Mikey. What have you done today Mikey that has nothing to do with using the internet? Then think how much more you could have done if you would just get up off your ass.
“Keep snickering at yourself, Mikey. What have you done today Mikey that has nothing to do with using the internet? Then think how much more you could have done if you would just get up off your ass.”
Thanks for your concern.
[snigger]
See how easier it is to make comments without using any word that requires you to use your HTML trick, Mike?
“See how easier it is to make comments without using any word that requires you to use your HTML trick, Mike?”
Willard, please stop trolling.
Now you had to use your HTML trick, Mike.
“See how easier it is to make comments without using any word that requires you to use your HTML trick, Mike?”
Willard, please stop trolling. Or not, as you wish.
Please stop using your silly HTML trick to bypass moderation, Mike.
Little Willy, please stop t-word-ing.
The strength of the solar polar field is trending downward. The latest data from 01.07.2024 shows that there has already been a change of polarity on the Sun.
https://i.ibb.co/YDrZh2t/Polar.gif
https://i.ibb.co/9vtrcnM/north.gif
https://i.ibb.co/nR0hpnf/south.gif
Clint R
You are absolutely right. Flux is rate of energy flow per unit of area.
For a constant area structure like the Earth, flux correalates exactly with energy flow.
Thus you can use flux as an indicator of energy flow in planetary energy budgets.
“Thus you can use flux as an indicator of energy flow in planetary energy budgets.”
What? Yet another proxy? Why not just use the energy flow as the energy flow?
All irrelevant anyway, isn’t it? The Earth is now cooler than it was four and a half billion years ago. That shows that four and a half billion years of sunlight did not contain enough energy to replace that lost by the planet.
Measurements dating back to Fourier and earlier show the Earth loses more energy than it gains – currently about 44 tW. That’s called cooling.
Do you think calling energy flow “flux” will cause the Earth to magically get hotter? Only joking, of course you do!
Carry on denying reality. Still no GHE.
Only a significant increase in the mass of the troposphere can cause an increase in pressure over the oceans and ocean surface temperature. Earth is a water planet and its global temperature depends on the temperature of the ocean. Currently, the ocean surface temperature does not exceed 31 C anywhere, and the excess heat, due to the constant average pressure, causes an increase in evaporation, convection and clouds.
Ren,
Steady pressure does not cause temperature to rise, in the atmosphere or otherwise.
For example, “Surface temperatures under the polar highs are one of the coldest on Earth, with no month having an average temperature above freezing.” – Wikipedia.
Even at extreme pressure, such as under 10 km of seawater, temperatures are only around 2 C, due to heat coming through the crust from below, not from pressure from above.
Earth is a mostly glowing hot rocky planet, with a very thin film of liquid water of 70% of its surface.
The planet is still cooling, which it will continue to do as long as the interior is hotter than the surface.
Thanks Mikey for proving to the likes of Gordon that the ideal gas law does not counter global warming.
AQ,
You wrote –
“Thanks Mikey for proving to the likes of Gordon that the ideal gas law does not counter global warming.”
Your opinion is noted – and ignored.
[laughing]
You said temperature is not determined solely by air pressure, did you not? Ergo, you have proved what I claimed. Opinion does not enter into it.
You don’t have to do the whole job in one step.
Why not use solar flux to calculate the energy absorbed for each grid square, thus allowing for Sun angle and albedo variation between grid squares?
Then add up the energy absorbed by all the grid squares to get the total planetary energy absorbed.
“You said temperature is not determined solely by air pressure, did you not? Ergo, you have proved what I claimed. Opinion does not enter into it.”
Your opinion is noted, and discarded as having no value whatsoever.
Thank you for your pointless input.
[laughing at fool]
Sorry Ent, but that won’t work. You’re trying to treat Earth as a homogenous object, with constant temperature and emissivity. The error margins become ridiculous. That’s why the bogus “EEI” is ridiculous, especially when the “imbalance” is reported to two decimal places, with NO mention of error margin.
That ain’t science. But, it tricks many, which is the purpose….
The satellite method of calculating energy imbalance is
Solar insolation – albedo – outward longwave radiation.
That gives approximately 1 W/m^2 or 0.1% of the energy absorbed.
You can confirm this independantly. Over 90% of the total energy absor*bed by the Earth each year is absor*bed by the oceans. Of the approximately 10^24 Joules absor*bed each year 10^21 Joules becomes extra ocean heat content.
Once again the imbalance is about 0.01%.
Always nice to have independent ways of checking such measures as EEI.
EM,
You wrote –
“The satellite method of calculating energy imbalance is
Solar insolation albedo outward longwave radiation.”
Which is completely meaningless. Only reality deniers would think such a laughable exercise would provide any useful information.
Go on, explain the relevance to four and a half billion years of planetary cooling, or the mythical GHE which you refuse to describe in any valid way.
The “energy balance” is completely nonsensical.
A weather station at Liawenee registered a minimum temperature of -12.9C shortly after 6am AEST on Wednesday. This was Tasmanias lowest July temperature on record, beating the previous record of -12.5C from Butlers Gorge on July 1, 1983. Launcestons low of -3.1C on Wednesday was also its coldest July morning in seven years.
Wednesday mornings bitterly cold temperatures are part of a string of icy mornings that are snap freezing Tasmania this week, under the influence of an abnormally strong high pressure system. This high is so strong that it may challenge Australias maximum mean sea level pressure record in the coming days.
https://i.ibb.co/zxK1wwC/ventusky-wind-300hpa-20240703t0700.jpg
https://i.ibb.co/C93kB9F/ventusky-pressure-20240703t0700.jpg
“Bureau of Meteorology confirms rainfall records broken across NSW”
https://www.abc.net.au/news/2022-12-22/bom-annual-rainfall-records-broken-across-nsw/101782404
Palmowski
See my recent comment upthread about Tasmania’s July temperatures:
By the way, let us have a look at Tasmanias lowest Tmins since beginning:
ASN00096033 ___LIAWENEE___________________ 2020 8 7 -14.2 (C)
ASN00095018 ___TARRALEAH_VILLAGE__________ 1983 6 30 -13.0
ASN00096003 ___BUTLERS_GORGE______________ 1983 6 30 -13.0
ASN00096021 ___SHANNON_HEC________________ 1983 6 30 -13.0
You are a really bad information source.
Bindidon, please stop t-word-ing.
Gordon Robertson wrote:
“Thanks for the proof, Binny, that the planet is cooling.”
As far as I know of global cooling forecasts, there’s Valentina Zharkova’s grand solar minimum theory, but the current solar cycle has more sunspots than the previous one.
This blog has seen numerous claims of future cooling over the years, but none have proven correct. Nonetheless, I can respect forecasts that are, at least, supported by solid physical theories. What is yours, Gordon?
The Sun’s magnetic activity is weakening, and the number of spots does not correlate with the number of strong eruptions on the Sun. The average solar wind speed during this cycle is low, ranging from 350 to 500 km/s. It rarely exceeds 600 km/s. WSO Stanford observations confirm the weakening of the polar solar magnetic field.
https://i.ibb.co/MCRLMKT/number-of-c-m-and-x-clas.png
You people claim that high neutron counts is the ultimate cause of cooling from reduced solar activity. Neutron counts are DOWN this cycle.
Real-time Oulu NM count rate, updated every five minutes. Data for the last 24-hr is PRELIMINARY.
https://cosmicrays.oulu.fi/webform/monitor.gif
Thanks for clearly illustrating that the recent monthly averages have been significantly lower than for the peak of last cycle.
John W
” Gordon Robertson wrote:
‘Thanks for the proof, Binny, that the planet is cooling.’ ”
Robertson was of course trying to kid the blog, as always.
His pathological, egotistic reply was wrt what I wrote about Tasmania:
” This means that Tasmania is over the long term certainly not warming at all:
https://drive.google.com/file/d/1DJWz-z83DfsgSx6U7J0bklTaRlBvZQTS/view
Tmin since 1900: -0.12 C / decade, Tmax: -0.09
And not even since the sat era in 1979: Tmin: 0.10, Tmax: 0.0.
No: its not warming everywhere, he he. ”
*
Robertson becomes dumber and dumber.
**
Now for the ‘Grrrand Cooling Ahhhead’ syndrome, vehemently defended by Palmowski and some other geniuses: I recently wrote that SC 25 could be doing worse.
https://drive.google.com/file/d/1c5UEqEHMt7Qegj0r8A1gf0NBtZzw8wJ4/view
Conversely, a monthly comparison for SC 25 of four solar data sources
– SILSO Sun Spot Number
– Solar Flux radio 10.7 cm
– Bremen MgII composite index
– Inverted Oulu Neutron Count
gives this:
https://drive.google.com/file/d/1oLwc2SSUqAxeJBCO8lVmjMbLIXUbRB8Y/view
Palmowski, Robertson and other ‘specialist’s can tell us whatever they want.
Bindidon, please stop t-word-ing.
Confusion remains over “energy”, “power”, and “flux”, so some simple analogies might help.
Let’s start with only “energy” and “power”. Energy has units of “Joules”, and Power has units of “Joules per time”, which is also “Watts”. Note that Energy is a “quantity”, while Power is a “rate” (quantity per time). “Energy” and “Power” are NOT the same.
Most people are familiar with a car traveling at a speed, say 50 mph. That speed is a “rate” — quantity per time. No one, but a child, would believe that 60 mph is the same as 60 miles. Yet confusing “quantity” with “rate” is a common mistake in GHE “science”.
Quantities are typically “conserved”. That just means that things must “add up”, or be accountable. For example, if you purchase 5 apples at the store, you expect to arrive home with 5 apples. If one is missing, then it was either dropped, or eaten. Apples just don’t magically disappear. Apples are “conserved”.
But, “rates” are NOT conserved. “Rates” do not add or subtract like quantities. For example, if you drive 50 miles, stop, then drive another 50 miles, you have driven 100 miles. But, if you drive at 50 mph, stop, then drive again at 50 mph, you have NOT driven at 100 mph!
In physics, it’s very important to pay attention to the units. Otherwise, you just end up with nonsense.
So are you claiming that if water enters a tank through a pipe at 20L/h, and more water enters the tank through another pipe at 30L/h, and there are no other sources or sinks, then water is not entering the tank at 50L/h?
Predicted response: “You do not understand”
That’s NOT what I’m saying, Ant.
In your example, 20 l/h for 1 hour, then later 30 l/h for another hour, would NOT equal 50 l/h.
If you want another example, use the solid cone in space. The total surface area is 5 times the base. The base absorbs 900 W/m². With emissivity equal to 1, and at steady state, the surface is emitting 180 W/m². The flux-in does NOT equal the flux-out.
Flux is NOT conserved. The EEI is bogus.
Riddle me this, Puffman –
Why did you not reduce your equation to a common basis, pun intended?
Silly sock puppet!
Cult Leader Grammie clone has a bone in his craw (as usual). He forgets that the EEI being discussed is presented as “watts per m^2” averaged for the Entire Earth. Thus, each of the components could be converted to Joules by multiplying by the total area of the Earth and an appropriate time period, such as a year. The results for each component would be Joules per year, which one finds used sometimes for ocean heat storage discussions.
The trouble is, such numbers would be quite large to deal with, so the convention is simply “watts per meter^2” since many of the real world measurements use that metric. Besides, the fractions of each component would still be the same, so why make it hard to understand by requiring the large numbers associated with Joules when w/m^2 gives the same result? Silly boy!
Sorry E. Swanson, but that won’t work.
You would have to match each flux with the specific area and emissivity. Otherwise, you’re just making crap up to support your cult beliefs.
Oh, wait….
Clot R
I already know it won’t help your thinking. But in your case of water flow, if you had a 20 l/hrs flow and another 30 l/hrs flow, the two flows add and it would be equivalent to 50 l/hrs. Sorry your logic is so terrible!
Norman, my example considered the two flow rates at different times. The rates would then NOT add.
You will need a responsible adult to explain it to you.
https://www.drroyspencer.com/2024/07/uah-global-temperature-update-for-june-2024-0-80-deg-c/#comment-1677258
Hey Puffman, riddle me this –
What’s dimension analysis?
No, grammie clone, those numbers in Trenberth’s famous graph are global averages. There’s no way to dis-aggregate them without going back to the basic data and starting over. Said data already includes parameters such as the fractional area and emissivity so that they can be averaged effectively. Why would you think otherwise?
Clint R
Why do you separate the rates? With the Earth you have energy going in at a rate and leaving at a rate. If they equal the temperature does not change. If you alter either incoming or leaving rates your temperature will change. Really simple stuff. Your cone example is very poor when comparing to Earth since the receiving and emitting surface areas are the same.
All wrong, Swanson.
Trying to come up with an “energy budget” from satellite measurements is ludicrous. You obviously don’t understand ANY of the science. Your cult tries to come up with an average close to 240 W/m², because that comes from an imaginary sphere. But the imaginary sphere is at a temperature of 255K. Earth is at a temperature of 288K. Your cult claims Earth is emitting what a cold imaginary sphere emits!
But, it gets worse. Earth reflects a lot of solar. But the 240 W/m² is only infrared. Your cult omits the reflected energy, and calls the result an “energy budget”! Ludicrous.
It gets even worse, much more, but I’m busy for the next few hours…..
——-
[Norman, get a responsible adult to explain it to you. You’re all tangled up, as usual.]
Clint R
I think you need more than an adult to explain physics to you and what science is. You think your cult posts are science and then you think real science is a cult. No one can be as confused and mixed up as you seem to be. Somewhere your brain wires got crossed and you are no longer able to function as a rational person. I would like to help you but you just reject all evidence in favor of your cult opinions. It is sad but you are stuck wherever. Like Swenson and Gordon Robertson.
Clint R
Despite your opinion of E. Swanson, he would be the scientific one and you are the cult minded opinioned one who will never support anything. Do you understand that science is an evidence based study of nature? It is not your opinions and arrogant declarations based on how you feel about things (IR from a cold source will reflect off a hotter object and not get absorbed is one of your flawed opinions. It is based on zero evidence, no supporting observations, no experiments. You get this from blogs by crackpot geologists who really do not have much knowledge of the physics).
So go to this link. This is some of the data used to calculate a global average emission of IR and the average is around 240 W/m^2. You can deny the evidence all day long. I might be inclined to listen to your babbling if you would ever link to something that supports your cult opinions. To date you have not provided anything but your arrogant opinions. Much like Swenson and Gordon Robertson.
https://ceres.larc.nasa.gov/resources/images/
“So are you claiming that if water enters a tank through a pipe at 20L/h, and more water enters the tank through another pipe at 30L/h, and there are no other sources or sinks, then water is not entering the tank at 50L/h?”
AQ refuses to describe the GHE in any valid manner, but instead diverts into bizarre pointless and irrelevant analogies.
The planet has cooled for four and a half billion years, and continues to do so.
Obviously, nothing at all prevented this cooling.
AQ finds himself totally snookered, hoist with his own petard, so to speak. As do all his ilk.
So Clint, is 20W of energy per hour over a square metre of earth from one source plus 30 Watts of energy per hour over the same square metre of earth from another source equal to 50W per hour over the same square metre of earth?
And if they are not the same square metre:
The first source supplies 20W of energy per hour over the first square metre and none over the second, for an average of 10W per square metre per hour.
The second source supplies no energy to the first square metre and 30W per hour to the second square metre, for an average of 15W per square metre per hour.
Are you claiming that the average over the 2 square metres is not 25W per square metre per hour? That is, are you claiming that it is not valid to add AVERAGE fluxes to get an average flux?
BTW … the higher order models DO account for varying flux over the earth’s surface. You are looking at the kiddy model, and still getting it wrong.
I wonder if E. Swanson was able to learn anything?
For some reason, I doubt it….
How can Puffman live in a house in which only one light is on?
Ant, your “problem” is very confusing.
For example, are you saying a surface is emitting or absorbing? “Over” is not very clear.
Maybe you could find someone that understands physics to help you phrase your question?
Otherwise, you sound like a cult id10t.
Grammie clone wrote:
Not from you, air head.
I however have learned the basics or measuring SW and LW radiation from space, having followed the progress of such measurements since the ERBE experiments. gremmie also ignores the efforts to make necessary measurements at the surface and within the atmosphere. These efforts have continued and have been improved over decades of work .
As suspected, “Swansn” hasn’t learned anything.
They can’t learn….
Clint – my wording is very clear. I am talking about neither emitting nor absorbing. I am talking only about the flux STRIKING a surface, regardless of what happens next. It is clear you don’t know how to respond.
AQ,
You wrote –
“So Clint, is 20W of energy per hour over a square metre of earth from one source plus 30 Watts of energy per hour over the same square metre of earth from another source equal to 50W per hour over the same square metre of earth?”
Ooooooh! Another stupid attempt at a gotcha!
Don’t look more idiotic than you have to.
Completely irrelevant, and pointless. You refuse to describe the GHE in any valid way, so trying to convince anybody that you are wise and knowledgeable is doomed to failure.
As to your witless gotcha, you may as well refuse to illustrate your intellectual brilliance by telling everyone how much energy is flowing through a random square meter of the Earth’s surface at any given time. Given that photons travel at the speed of light, and that there are about 413 CMB (Cosmic Microwave background) photons per cc, commensurate with a temperature of 2.73 K or so, how many photons commensurate with temperatures above and below 2.73 K also occupy each cc of space, and thus flow through a random square meter of the Earth’s surface?
You can refuse to answer, on any grounds you like. Obviously, fluxes do not “add” in any meaningful sense, unless the “fluxes” are composed of identical entities.
You don’t understand what I am talking about, do you? You refuse to accept that “climate scientists” are similarly clueless, and deny reality just like you.
Whenever you feel confident enough to reply Clint …
Puffman just wrote a comment admitting that your maths was correct.
He took the L!
If you walk at 2 kph from the back to the front of a train traveling at 60 kph, you will be traveling at 62 kph relative to the ground.
” ‘Rates’ do not add or subtract like quantities.”
Rubbish. Depending on context rates can indeed be summed.
A company owns a factory that produces 1000 cars a day. The company invests in a second factory that produces 1000 cars a day.
If we add these rates we get the correct answer for how many cars are produced per day by the company.
Sorry barry, but you’re making the same mistake as Ant.
A specific example can disprove a general concept, but a specific example can NOT prove a general concept.
It’s called “reality”.
The general concept you gave us was:
” ‘Rates’ do not add or subtract like quantities.”
That’s just been disproved with several examples.
Hey Puffman, riddle me this –
Why did you have to find a bogus example just to show that you can’t mind your units properly?
Don’t worry barry. If you can’t come up with something valid, other cult children will cover for you.
Hey, Puffman, riddle me this –
One of your old sock puppet buys 100 Euros for 108 USD. Another of your sock puppet buys 108 USD for 101 Euros. Can you convince your sock puppets that you can’t tell if they lost money?
barry,
You are no doubt an exceptionally clever fellow (in your own opinion, at least).
You refuse to describe the GHE, but waffle on about anything else – trains, walking thereon, companies, factories, cars – and so on.
Others might not agree with your opinion of your cleverness. The Earth has cooled for four and a half billion years, and continues to do so, losing energy at a rate of 44tW or so.
Continue to deny reality if you like. Nature can’t be fooled, as Richard Feynman said.
No GHE.
“Hey, Puffman, riddle me this. . . .”
Willard, please stop trolling.
Mike Flynn,
Only one forbidden word you can post by injecting an invisible HTML character?
Please, make an effort.
“Mike Flynn,
Only one forbidden word you can post by injecting an invisible HTML character?
Please, make an effort.”
Willard, please stop trolling.
Hey Mike, riddle me this –
In one comment at you post one banned word using your silly HTML trick. In another comment at you post banned word.
Can you measure the flow of your usage of the silly HTML trick?
“Hey Mike, riddle me this
In one comment at you post one banned word using your silly HTML trick. In another comment at you post banned word.
Can you measure the flow of your usage of the silly HTML trick?”
Willard, please stop trolling.
It’s one banned word per comment, Mike.
“It’s one banned word per comment, Mike.”
Oh dear, you have appointed yourself Dr Spencer’s “Word Suitability Arbiter”, have you?
You do have delusions of grandeur, dont you? If Dr Spencer banned any words from appearing on his blog, they wouldnt appear, would they? If you want to accuse Dr Spencer of incompetence, go ahead – while I laugh at your silliness.
You might be stupid, but at least you’re a fool as well.
Willard, please stop trolling.
One banned word per comment is the solution to the puzzle, Mike.
What are you braying about, and why do you keep using a silly HTML trick to write forbidden words?
Willard,
Mikey is inserting HTML character #8204 (“zero width non joiner”) into his text. He is happy to lie about that because he doesn’t realise the codes can be seen if one knows where to look.
Power is energy per time. Flux as used in climate forcing is energy per time per unit area. In the context of the atmosphere fluxes do not add because flux is taken at a plane surface and the atmosphere is dynamic and three dimensional.
Other than that, the analogy of a moving car, train or whatever is not a flux, and to that extent the analogy does not work. The energy portion of the flux is variously disturbed as it move away the arbitrary reference plane so it really is not worth arguing about.
Carry on.
> flux is taken at a plane surface
Not always, but it doesn’t matter either way.
Try again.
Wonky Wee Willy,
There is no GHE. All this talk of fluxes is pointless.
The Earth has cooled over the past four and a half billion years, and continues to do so.
Keep refusing to accept reality. Nature can’t be fooled, unlike fanatical GHE cultists.
Mike Flynn,
Every planet of the Solar system receives energy from the Sun. That energy can be estimated using the solar constant of that planet and the size of the planet. That solar constant is usually expressed as flux density. Geometric contortions like TS’ do not change the convenience of doing so.
Long live and prosper.
Wonky Wee Willy,
There is no GHE. All this talk of fluxes is pointless.
The Earth has cooled over the past four and a half billion years, and continues to do so.
Keep refusing to accept reality. Nature cant be fooled , unlike fanatical GHE cultists.
The algebraic properties of a unit have nothing to do with your usual distractions, Mike.
“The algebraic properties of a unit have nothing to do with your usual distractions, Mike.”
Willard, please stop trolling.
You must know by now what is this month’s theme, Mike.
You’re using a silly HTML trick to bypass moderation.
“The algebraic properties of a unit have nothing to do with your usual distractions, Mike.”
Willard, please stop trolling.
You repeated the same comment, Mike.
So not only you used your silly HTML trick, but you also inserted a space somewhere in your text.
“You repeated the same comment, Mike.
So not only you used your silly HTML trick, but you also inserted a space somewhere in your text.”
Thank you for your concern.
Willard, please stop trolling.
Mike Flynn,
You used your silly HTML trick to bypass moderation.
This is why you can publish forbidden words on the page.
Is that too hard for you to understand?
Little Willy, please stop t-word-ing.
Hey England,
Have Fun At Work Tomorrow!
Get it? England doesn’t celebrate the Fourth of July. So they don’t get a day off. Plus they lost.
Let me guess: Went down on penalties?
Arkady, Elliott, please stop t-word-ing.
I read above, without surprise:
” More like 0.2C. Take a look at the period prior to 2016, it featured an 18 year flat trend.
The 18 years before 1998 were below the baseline. ”
Ignoramus Robertson still does not (want to) understand that a baseline is an arbitrary construction depending of the reference period chosen to construct it.
Years ago already I explained to him that if, instead of accurately using WMO’s specifications for reference periods, Roy Spencer
– had kept till recently the old period ‘1979-1998’ to construct his baseline and the anomalies out of it,
and
– recently switched to a new period ‘1999-2018’,
the UAH chart would look different depending on the reference period used to display it because the baselines for 1979-2018 and 1999-2018 are themselves different.
He didn’t understand this because he never managed to actually read anything: instead, he just skimms through the texts to find something to smugly trumpet about.
*
But… this is so simple to understand!
Though UAH – for good reasons – does not publish absolute temperatures (even not at the 2.5 degree grid level), it is nevertheless possible to reconstruct them by combining the grid anomalies with the grid climatology (the 12-month grid baseline), and then performing a monthly, latitude weighted average of the grid.
*
Having the absolute data, it is then possible to compute any 12-month baseline out of it:
Baseline for 1979-1998 in K
Jan: 262.93
Feb: 263.00
Mar: 263.20
Apr: 263.64
May: 264.26
Jun: 264.93
Jul: 265.23
Aug: 265.05
Sep: 264.39
Oct: 263.70
Nov: 263.19
Dec: 263.00
Mean: 263.88
or
Baseline for 1999-2018 in K
Jan: 263.23
Feb: 263.30
Mar: 263.46
Apr: 263.88
May: 264.47
Jun: 265.09
Jul: 265.42
Aug: 265.24
Sep: 264.66
Oct: 263.98
Nov: 263.43
Dec: 263.22
Mean: 264.12
*
Now we can display the absolute data with the two baseline averages:
https://drive.google.com/file/d/1rE-LYwgMJyOI1bE5JJ2HHUX_NooIpLeo/view
and show the anomaly time series constructed out of absolute data and the two respective baselines, with a 13 month running mean:
https://drive.google.com/file/d/1nN316BRnvkmvBMl8jmMm0dpgUnvEizjR/view
*
And here is the point which Robertson (and maybe other, similarly opinionated posters) has always wrong.
Due to the lower average absolute temperature in 1979-1998, the (green) anomalies wrt the baseline are higher than those wrt 1999-2018 (purple).
As anyone can see now, writing ‘The 18 years before 1998 were below the baseline’ is simple nonsense when looking at anomalies wrt the older 1979-1998 baseline: 99% of the anomaly data since 1994 is… above it :–)
*
But Robertson never cares about any contradiction let alone correction.
He will continue to use his good old ‘pieces of paper’ instead, and feed us the same nonsense as always.
UAH LT’s grid data
https://www.nsstc.uah.edu/data/msu/v6.0/tlt/
*
Roy Spencer’s explanation about absolute vs. anomaly temperatures
UAH v6 LT Global Temperatures with Annual Cycle
https://www.drroyspencer.com/2016/03/uah-v6-lt-global-temperatures-with-annual-cycle/
Missing detail
https://drive.google.com/file/d/15FRQYhGwBccpdrg0UGAADh6DE588r8L5/view
Bindidon, please stop t-word-ing.
Solar flux cannot theoretically be averaged over some area, because solar flux what it does is to interact with matter.
When solar flux is averaged, the new interaction result is very different from the actual one.
–
https://www.cristos-vournas.com
Pray tell more about your “Te = [(1-a) S /4σ ]1/4 (K) (1)” equation, Christos.
Willard,
“Pray tell more about your ‘Te = [(1-a) S /4σ ]1/4 (K) (1)’equation, Christos.”
–
The Te = [(1-a) S /4σ ]^1/4 (K) (1) equation, it is not mine.
The equation expresses the basic important insight that it is possible to theoretically calculate the planet average surface temperature Tmean from planet IR emission.
The Te is the first approach, which uses the Stefan-Boltzmann emission law, considering a planet as a warm sphere emitting the incident energy, as like that energy had been already storaged on the planet surface (which is not).
But it is all wrong approach, because S-B emission law is not an absor-p-tion law.
Also it is wrong because S-B emission law doesn’t describe the actual emission intensity the real matter does at its respective temperatures, which matter is consisted from atoms and molecules, the S-B emission law doesn’t work, that is why a correcting coefficient – the emissivity, was invented.
–
https://www.cristos-vournas.com
Christos,
That equation works using solar flux.
You just said this was impossible.
Please advise.
Willard,
“That equation works using solar flux.
You just said this was impossible.
Please advise.”
Please Willard, what is the question?
Because I am not so capable in idiomatic English.
–
https://www.cristos-vournas.com
Christos,
Sorry if I wasn’t clear.
The question is why you’d use “Te = [(1-a) S /4σ ]1/4 (K)” when it obviously uses solar flux and you said that this was not possible.
Willard,
Christos is pointing out (quite correctly) that it is simply delusional to imagine that you can calculate the temperature of an object by measuring the radiation falling upon it – if I have understood him correctly.
Do your strange semantic gymnastics indicate that you disagree, or are you refusing to say?
Mike Flynn,
Division and multiplication imply addition and subtraction.
Perhaps you should stick to comments using forbidden words with your silly HTLM trick?
Willard,
Christos is pointing out (quite correctly) that it is simply delusional to imagine that you can calculate the temperature of an object by measuring the radiation falling upon it if I have understood him correctly.
Do your strange semantic gymnastics indicate that you disagree, or are you refusing to say?
Mike Flynn,
Repeating your misunderstanding does not help.
Start with “S /4σ.”
Cheers.
Willard,
Christos is pointing out (quite correctly) that it is simply delusional to imagine that you can calculate the temperature of an object by measuring the radiation falling upon it if I have understood him correctly.
Do your strange semantic gymnastics indicate that you disagree, or are you refusing to say?
Christos does exactly that, Mike, so chances are you misunderstood.
Willard,
Christos is pointing out (quite correctly) that it is simply delusional to imagine that you can calculate the temperature of an object by measuring the radiation falling upon it if I have understood him correctly.
Do your strange semantic gymnastics indicate that you disagree, or are you refusing to say?
Of course you are, as your strange response indicates.
What you claim Christos denies, Mike, Christos does with his model.
Sorry if you can’t read equations anymore.
It’s been a while since your chemical engineering studies, right?
Willard,
Christos is pointing out (quite correctly) that it is simply delusional to imagine that you can calculate the temperature of an object by measuring the radiation falling upon it if I have understood him correctly.
Do your strange semantic gymnastics indicate that you disagree, or are you refusing to say?
Of course you are, as your strange response indicates. Keep diverting.
Mike Flynn,
“Te” represents effective temperature.
Over to you.
“”Te” represents effective temperature.”
Good to know.
Great, Mike.
Now, S represents the solar constant.
Little Willy, please stop t-word-ing.
To those who propose alternate explanations for long-term warming aside from increasing greenhouse gas concentrations, how do you account for stratospheric cooling?
John W, if you want to support your cult, maybe you could give us a viable description of your cult’s GHE.
I won’t hold my breath….
John W,
“. . . how do you account for stratospheric cooling?”
Because the stratosphere is further away from the Earth’s core than the troposphere, and closer to the 3 K or so of outer space?
The thermal gradient goes from hot to cold. However, at low pressures, the concept of temperature gets a bit wobbly. For example, the thermosphere is nominally very “hot” – 2000 C or so, but you’d still freeze to death if shielded from the Sun.
There is no GHE. The Earth has cooled over the past four and a half billion years, and continues to do so.
Feel free to refuse to account for that reality.
John W.
“…how do you account for stratospheric cooling?”
This isn’t my area of expertise, but have you considered humidity as a GHG? As the sun warms the sea surface, it releases a little CO2 and a lot of moisture.
https://localartist.org/media/StratCooling.png
Robert Cutler,
The concentration of water vapor in the atmosphere is regulated by temperature. As the atmosphere warms, it holds more water vapor, creating a positive feedback loop that amplifies greenhouse gas warming.
John W. If I understand the theory it is that the presence of GHG’s limit upwelling radiation which then causes the stratosphere to cool. This idea is often used to “prove” AGW, which I think was your original point. My point is that temperature and humidity could rise due to solar activity, so a cooling stratosphere doesn’t prove a CO2/AGW connection.
Gordon’s point, which I tend to agree with, is that the sun plays a larger role in regulating the temperature of the stratosphere.
What a lot of people miss is that, because of the oceans and ice caps, the troposphere, from a global temperature perspective, has a very long time constant, I believe it to be at least 100 years. I can prove that it’s longer than 60 years. So when people say the planet is warming and point to decreasing solar activity as proof that it’s not the sun, they’ve make a serious mistake. My models show that we’re just now entering a cooling phase — current spike not withstanding.
The stratosphere is not moderated by oceans, and there’s very little thermal mass, so it reacts instantly to solar activity. That’s why, in my graphic, you can see the tops of the sunspot cycles in the stratosphere temperature. So the cooling is more likely to be related to decreasing solar activity.
The stratosphere is a very cold, dry place. The only warming there is due to a scarce amount of oxygen molecules being warmed by UV from the Sun. Calling that warming is like claiming the Arctic, at -60C, has warmed to -55C in places.
Same for cooling, how much colder can it get? Any cooling has to be related to a slight drop in UV intensity from the Sun.
Makes sense, Gordon.
You can see the effects of the sunspot cycle on stratosphere temps in the my last post. Unfortunately, consensus TSI composites don’t show much of a drop in the quiet sun TSI. Not that I trust consensus composites.
However, if you look at a my butterfly diagram of the sun’s longitudinally averaged magnetic field strength you can see that the field strength is fading, not just in the lower latitudes where sunspots live, but also in the poloidal regions. Solar activity is decreasing and there’s no reason to assume that UV would remain constant. The stratosphere would respond almost instantly.
https://github.com/bobf34/GlobalWarming/blob/main/images/Butterfly.png
The code to produce this diagram from synoptic data is on my website.
Good stuff, Robert. Not up on the sunspot activity, just some theories from Zharkova that seem sound.
What do you make of her theories?
I think Zharkova’s use of principal component analysis shows promise. That said, I think the two PC’s she developed were created using the same data that’s in my version of a butterfly diagram. It’s a very short dataset, so it might be a bit bold to extrapolate more than a few decades in either direction. Also, if memory serves, she’s trying to estimate values for 60 model parameters, so there’s a risk of over-fitting.
I’m also not convinced that everything about solar activity can be replicated in a harmonic model, so I wouldn’t expect her to be able to precisely predict every sunspot cycle. It’s the longer-term trends that are probably the most important thing to focus on.
Solar activity is declining, but we’ll have to wait and see if that develops into a grand minimum.
With the HT temperature spike seemingly on the wane, I do believe that we’re past the highest global temperatures that we’ll see for for a decade.
This prediction is not based on extrapolation, but on the earth’s delayed response to current solar activity. See my website, or:
https://localartist.org/media/SunspotPredictionExcel.xlsx
We’ll see in a few months how far McIntosh, Leamon and Egeland were from reality:
Deciphering solar magnetic activity: The (solar) hale cycle terminator of 2021
https://www.frontiersin.org/journals/astronomy-and-space-sciences/articles/10.3389/fspas.2023.1050523/full
Hello John,
Less ozone concentration means less uvb absorbed in the stratosphere, hence cooling and more uvb absorbed by the surface, hence warming.
John W,
From what I can tell, most of the stratospheric cooling was caused by the two major volcanic eruptions in the last 40 years.
Also keep in mind, the tropospheric warming by CO2 absorbing energy is countered by surface evaporative cooling leading to a reduction in high altitude water vapor. I haven’t looked at how that would affect the stratosphere. I suspect it would allow some warming to counter the natural cooling by CO2.
“Also keep in mind, the tropospheric warming by CO2 absorbing energy is countered by surface evaporative cooling”
Weird notion that warming of one body is countered by cooling a DiFFERENT body.
“leading to a reduction in high altitude water vapor.”
An another that suggests creating more water vapor leads to LESS water vapor.
John W, please stop t-word-ing.
I saw Andrew Dessler on CNN last night. He started out very reasonably with the fact that we should prepare for unavoidable effects. Then he went off the rails stating that climate is a political issue because “the” fossil fuel industry has bought “the” politicians. I assume he was referring to the politicians he does not like. I would like to see him accuse Bernie Sanders of being bought off.
The most interesting comment was that wealthy people will not like paying poor people for things like air conditioning to cope with a hot planet unless “we” do something to stop it. Is that some kind of threat? They never mention the rest of the world.
He is correct that climate is political. The real problem with that is people like him who are not honest about any of the hype that drives the climate discussion.
Dessler is just another klimate klown. His form of science is utter trash. You won’t ever see Roy, John Christy, or Richard Lindzen on the fake news channel, CNN.
“You won’t ever see Roy, John Christy, or Richard Lindzen on the fake news channel, CNN.”
You have no interest in truth, do you, Gordon? You just fulminate whatever pops into your head.
Dr. Roy Spencer and Mark Hertsgaard debate man’s role in climate change on CNN’s Piers Morgan Live
https://edition.cnn.com/videos/bestoftv/2013/11/12/exp-pmt-roy-spencer-mark-hertsgaard-climate-debate.cnn
Richard Lindzen debates Bill Nye on CNN.
https://www.youtube.com/watch?v=jI8Q4WafQz0
John Christy is interviewed by CNN about climate change:
https://money.cnn.com/2009/05/14/magazines/fortune/globalwarming.fortune/?postversion=2009051412
“You won’t ever see Roy, John Christy, or Richard Lindzen on the fake news channel, CNN.”
Do you enjoy being wrong or what, Gordon?
“Then he went off the rails stating that climate is a political issue because the fossil fuel industry has bought the politicians.”
There is no question that money donated by industries with vested interest to political campaigns influences policies.
Do you doubt that?
Eg donations from Koch brothers to R politicians in hopes of limiting regulation of coal power plants.
barry, please stop t-word-ing.
Hurricane Beryl roars by Jamaica after killing at least 6 people in the southeast Caribbean
https://apnews.com/article/hurricane-beryl-caribbean-jamaica-cayman-islands-774803fc70e187ea96e7df10f84d8a50
As tropical storm it’s path could reach Boca Chica.
I got 40% chance, of something happening, near me:
https://www.nhc.noaa.gov/?epac
gb…I did not know you were affected by Atlantic hurricanes in the California desert.
You don’t click the link:
https://www.nhc.noaa.gov/?epac
Which indicates 60% chance {not 40%}.
Though not a 40 or 60% chance it will have anything to do with me, but it’s the first significant chance, on my side of pond, of something happening vaguely close to me.
Though it might hit Hawaii as it last year [a few times}.
Still looks a long ways off from Southern Cal.
I got a tropical depression, one-E, it’s moving north/west.
Roughly towards me, but far away.
But how big and far will go in a week?
Beryl “could be” Cat 1 at boca chica, that would be a bigger distance traveled.
one-E, became tropical storm, Atella, and predicted to turn left in direction of Hawaii, and not expected to strengthen {going nowhere}.
aarons…”the only other deviation between the Nino 3.4 and the UAH is Pinatubo. So it seems that it takes something at the scale of a decent sized volcano to create an anomaly to a well behaved system…”
***
Good point, I knew about Pinatobu but I had not connected the obvious to Hunga Tonga. With the Pinatobu eruption in the 1990’s, it was volcanic aerosols that cooled the atmosphere significantly for several years. Hunga Tonga, by injecting millions of tons of water into the stratosphere, seems to have caused a warming rather than a cooling. The mechanism may still be unknown but there really is no better explanation for the warming. It is certainly not a trace gas, which failed to affect global temperatures for 18 years between 1998 and 2015.
Wee willy sputtered something about a volcano but failed to grasp your point just as he failed to offer an alternative answer to my claim that no other explanation for the current warming can be offered other than Hunga Tonga.
Wee willy is a true intellect among the denizens of the animal world, including tortoises and hares.
Mr. Asshat does not even realize that volcanoes usually have a negative effect, whereas this had a warming impact but remains a “bit player” (h/t Roy):
https://theconversation.com/global-temperatures-are-off-the-charts-for-a-reason-4-factors-driving-2023s-extreme-heat-and-climate-disasters-209975
He has no business here.
From my post…”With the Pinatobu eruption in the 1990s, it was volcanic aerosols that cooled the atmosphere significantly for several years”.
Is cooling not a negative effect on temperature?
My business here is to prevent alarmist ijits like you, who have no serious business here, from polluting the blog.
From Mr. Asshat’s post:
“I knew about Pinatobu but I had not connected the obvious to Hunga Tonga.”
It’s as if he does not know as much on the Little Ice Age as he pretends? Perhaps he should search for Mount Tambora’s eruption or why pirates disappeared.
It’s Pinatubo, BTW.
In any event, one of the largest eruptions of the past 300 years is a bit player in the scale we’re talking about:
https://eos.org/articles/tonga-eruption-may-temporarily-push-earth-closer-to-1-5c-of-warming
Note: over the next five years.
Still, such events may not mean what our cranks want them to mean. For they introduce more variability than we actually are comfortable with. Anyone who has seen an unbalanced washing machine should know why.
“Still, such events may not mean what our cranks want them to mean.”
Of course, you refuse to be helpful in any way – by explaining what the events “mean”, for example. Just like you refuse to describe the GHE in any valid way.
That would make you a rather inept troll, wouldn’t it?
Carry on.
Mike Flynn,
Here you go –
https://www.youtube.com/watch?v=dq6T5BojXc8&t=84s
Cheers.
“Here you go ”
No i don’t. You’re an idiot.
Willard, please stop trolling.
I am not concerned with volcanic eruptions as the cause of the Little Ice Age. Each phase lasted 30 years or more and volcanic aerosols don’t affect climate more than a few years.
Glad to see that Gordo finally admits that he isn’t concerned with reality. But, we already knew that.
E. Swanson, please stop t-word-ing.
Weary Wee Willy,
“He has no business here.”
You have appointed yourself Dr Spencer’s Business Advisor now, have you?
Well done! The amount he pays you no doubt reflects his estimation of your value.
You really are a strange and quite delusional slimy grub, aren’t you?
Keep the laughs coming!
Mike Flynn,
Your silly semantic game is silly. You still might like:
https://tinyurl.com/roy-castigated-dragon-cranks
Vintage 2013.
Interestingly Mr. Asshat commented in the thread.
Wanna see it?
Weary Wee Willy,
“He has no business here.”
You have appointed yourself Dr Spencers Business Advisor now, have you?
Well done! The amount he pays you no doubt reflects his estimation of your value.
You really are a strange and quite delusional slimy grub, arent you?
Keep the laughs coming!
Mike Flynn,
“Appointed” – what are you braying about?
I can say whatever I please and you can’t do nothing about it.
Perhaps you could try to emulate Graham D. Warner and try to PSTer me again?
Silly sock puppet!
[Derisive snark.]
“I can say whatever I please and you cant do nothing about it.” Of course I can – I can laugh as much as I like!
Thanks for the flattery through imitation.
Obviously, you appreciate my general way with words, and the associated panache I exhibit on occasion. You can refuse to describe the GHE as often as you like, and I can laugh about that as well!
An all round laugh-fest!
[laughing at idiot]
You don’t seem to recall from whom you borrowed these square brackets, Mike.
Keep braying!
“I can say whatever I please and you cant do nothing about it.” Of course I can I can laugh as much as I like!
Thanks for the flattery through imitation.
Obviously, you appreciate my general way with words, and the associated panache I exhibit on occasion. You can refuse to describe the GHE as often as you like, and I can laugh about that as well!
An all round laugh-fest!
[laughing at idiot]
Every time you copy-paste your comments seem so satisfied with them that you must be imitating yourself, Mike.
Silly sock puppet!
“I can say whatever I please and you cant do nothing about it.” Of course I can I can laugh as much as I like!
Thanks for the flattery through imitation.
Obviously, you appreciate my general way with words, and the associated panache I exhibit on occasion. You can refuse to describe the GHE as often as you like, and I can laugh about that as well!
An all round laugh-fest!
[laughing at idiot, again]
Every time copy-paste comments seem so satisfied with them that must be imitating yourself, Mike.
Silly sock puppet!
Little Willy, please stop t-word-ing.
Nobody going to the Moon:
NASA assessment suggests potential additional delays for Artemis 3 lunar lander
Jeff Foust July 3, 2024
https://spacenews.com/nasa-assessment-suggests-potential-additional-delays-for-artemis-3-lunar-lander/
“WASHINGTON As NASA pushes ahead with a crewed lunar landing on the Artemis 3 mission in September 2026, the agencys own analysis estimates a nearly one-in-three chance the lander will be at least a year and a half late.”
A 1/3rd of a chance.
…
The KDP-C also set a cost of $4.9 billion for HLS Initial Capability at the same 70% joint confidence level. That includes the $2.9 billion fixed-price contract to SpaceX, awards to SpaceX, Blue Origin and Dynetics in the earlier phase of the project and NASA project office costs. “
Anyways, it seems to me, SpaceX could start refueling in orbit efforts, within 2024.
But it also seems to me, Blue Origin could beat them to milestone of first refueling of any spacecraft in orbit, before SpaceX does.
Just like/similar Blue Origin claim of being first to recover a stage of rocket {a sub-orbital rocket} and I think Blue Origin could do this, because they want to do this, and refueling in orbit, is easier or quicker to do. And being the first to refuel in orbit, is good PR thing to “have”.
SOLAR MINIMUM UPDATE
This post has only touched on the ways that [Tropical Cyclones]s are getting more damaging. There are even more ways, such as changes in the tracks of TCs moving to higher latitudes, more frequent rapid intensification, or the slowdown of TC translation speed, all of which can also increase destructiveness.
When arguing against this, climate misinformers don’t necessarily propagate outright lies. Rather, their method of misinformation lies in the selective emphasis of certain facts that bolster their stance. For example, they will focus on statistics like the number of TCs (or, worse, landfalling hurricanes), emphasizing that we don’t see any trend while conveniently omitting that climate scientists don’t predict an increase.
And they fail to acknowledge the actual factors that are driving destructiveness, such as the increase of storm surge damage caused by sea level rise or the fundamental physics that tells us that TCs will produce more rain as the climate warms. This is classic cherry picking.
Instead of the selective offering of climate misinformers, you should look at all of the data. If you do that, it’s clear that hurricanes and other TCs are getting more destructive.
https://www.theclimatebrink.com/p/climate-change-is-making-hurricanes-09e
Our cranks don’t even quality as climate misinformers.
“Our cranks dont even quality as climate misinformers.”
Willard, please stop trolling. You’re dimwitted.
Mike Flynn,
Mike Flynn.
Mike Flynn?
You’re still using a silly HTML trick to bypass moderation.
Cheers.
“Mike Flynn,
Mike Flynn.
Mike Flynn?
Youre still using a silly HTML trick to bypass moderation.
Cheers.”
Willard, please stop trolling.
Mike,
You wrote:
“”Mike Flynn,
Mike Flynn.
Mike Flynn?
Youre still using a silly HTML trick to bypass moderation.
Cheers.”
Willard, please stop trolling.”
Or did you?
“Mike,
You wrote:
“Mike Flynn,
Mike Flynn.
Mike Flynn?
Youre still using a silly HTML trick to bypass moderation.
Cheers.”
Willard, please stop trolling.
Or did you?”
Willard, please stop trolling. You’re confusing yourself.
Mike Flynn,
If you press CTRL-U and check for the comment I just wrote, you will notice that I’m not using the same silly HTML trick as you do.
So in effect you did not exactly *write* what I said you did.
Cheers.
“So in effect you did not exactly *write* what I said you did.”
Well, that cleared that up, didn’t it?
[snort]
There is not a shred of scientific evidence connecting hurricane intensity to global warming. The stats show there were nearly as many Cat 5 hurricanes in the 1930’s as in the 2000’s. There may have been as many, or more, had there been satellites to detect them.
Rather than waving your arms in the air, how about scientific proof that modern hurricanes are stronger and caused by global warming?
“he stats show there were nearly as many Cat 5 hurricanes in the 1930s as in the 2000s.”
Data?
“There may have been as many, or more, had there been satellites to detect them.”
Best to look only at stats in the satellite era, since 1960s.
The heat and the draught were so bad in the 1930s that the resulting dust clouds traveled from the West and blacked out NY City as well as other eastern cities.
“Draught” … oh dear … how bad does the denier “education” get.
Sorry AQ, never been a good speller. Speller?
christos…”The Te is the first approach, which uses the Stefan-Boltzmann emission law, considering a planet as a warm sphere emitting the incident energy, as like that energy had been already storaged on the planet surface (which is not).
But it is all wrong approach, because S-B emission law is not an absor-p-tion law.
Also it is wrong because S-B emission law doesnt describe the actual emission intensity the real matter does at its respective temperatures, which matter is consisted from atoms and molecules, the S-B emission law doesnt work, that is why a correcting coefficient the emissivity, was invented”.
***
You are right about S-B. It is an emission law only. It also neglects any heat dissipation by conduction/convection.
The original Law was created by Stefan and it was a simple relationship between radiation intensity and the temperature of a surface, as in…
I = sigma. T^4.
Stefan had no interest other than the relationship between radiation and temperature, his point being that as temperature increased, the radiation intensity increased as T^4.
When I say intensity, I mean the same as in the standard relationship, E = hf. That is, as EM frequency increases the radiation intensity increases. Stefan knew that and had already predicted that an increase in surface temperature would produce an increased radiation intensity. Temperature and emission frequency/intensity are proportional.
However, E = hf led to the ultraviolet catastrophe, wherein as frequency increases, the radiation intensity would increase toward infinity. Planck solved that by presuming higher frequency energy was less likely and applied an exponential probability to the EM spectrum to get the current bell-shaped curve.
The original Stefan equation was based on the Tyndall experiment in which he heated a platinum filament wire electrically and noted the colours of the wire as the current was increased. Another scientist converted the colours to a colour temperature and that is what Stefan’s original equation is based on….the color of a heated body.
That excludes IR immediately. In fact, it excludes any temperature outside the range of Tyndall’s experiment which observed temperatures between about 500C and 1500C. Therefore the sigma in I = sigma.T^4 applies only to the range 500C to 1500C. Any other inference to temperatures outside that range is purely theoretical.
Then Boltzmann, a student of Stefan, became involved, resulting in S-B. Boltzmann’s work was purely theoretical, he devised a system of treating theoretical atoms/molecules as statistical entities. His goal was to prove the 2nd law and entropy statistically, and he failed. However, his statistical treatment of entropy is still used today even though it is wrong.
In the era of Stefan and Boltzmann, the atomic structure was unknown. Electrons were not discovered till 1898 and it was not till 1913 that Bohr formed a theory for the atom. Boltzmann’s work would have been unnecessary after the discovery of atoms and how they work. However, there are scientists today who insist on keeping the old theories alive, even though they have no real application today.
S-B is not used in modern IR meters. If it was reliable, it would be easy to program the equation into an IR meter but it obviously does not work. Instead, the frequency of IR, not the temperature, is detected by a semiconductor material and it is the effect the IR frequency has on a certain semiconductor material that determines the ‘calculated’ temperature of the target. The temperatures must be derived in a lab and stored in the device memory for reference to detected frequency.
If S-B applied, it would be easy to detect the incoming IR frequency and convert it to a colour temperature using S-B. It obviously does not work at terrestrial temperatures.
Thank you, Gordon.
–
https://www.cristos-vournas.com
“Also it is wrong because S-B emission law doesnt describe the actual emission intensity the real matter does at its respective temperatures, which matter is consisted from atoms and molecules, the S-B emission law doesnt work”
Yes it does work just fine when incorporating an emissivity factor.
And this is what is used, for example, to measure the sea surface temperature by satellite, which works very well!
And the emissivity of the ocean is very high.
“The sea surface emissivity in the infrared region is determined on the basis of data analyses. Net radiation, surface irradiance and other oceanographical and meteorological variables are measured throughout most of the year at the oceanographical observatory tower in Tanabe Bay, Japan. We have found that 0.9840.004 is a reliable emissivity value ”
https://link.springer.com/article/10.1007/BF02233853
We’re seeing the meltdown of the cult. It might have started when they realized they have NOTHING. They can’t come up with a viable description of the GHE.
That’s because the GHE is bogus. There are at least 10 reasons.
Reason #1 — The bogus “CO2 forcing equation”
The equation — F = 5.35 X ln(C/Co)
Where Co is the reference CO2 concentration is ppm, C is the current CO2 concentration in ppm, and F is the radiative forcing in W/m^2
The equation is bogus. It is an example of “curve fitting”, combined with a perversion of physics.
Baskin/Robbins is a chain of ice cream stores. The chain started about 1950, and now has about 8000 stores, worldwide. Let’s “curve fit” that growth and claim it is “heating the planet”.
F = ln(S/So) = ln(8000) = 8.99
Now, let’s simply add units of W/m^2,
F = 8.99 W/m^2
And that is now proof that ice cream stores are heating the planet!
Hint for children: That ain’t science.
Clint R
Big Hint for you. Nothing you say on this blog is science. It is all your made up cult physics you get from crackpots on blogs.
Too bad you can’t see the hypocrisy in your many posts. You are actually the cult poster that has nothing. You reject real science in favor of crackpot blog versions (pseudoscience by definition).
You also have a child like mind. Your posts are very simplistic. You insult and denigrate posters like a child would do. If you read your own posts you might not believe how empty they really are.
Norman and silly willy are my two biggest stalkers.
Obviously, I’m doing something right….
“Big Hint for you.”
Norman, please stop trolling.
norman…why is it, in your mind, that anything resembling real science is issued by crackpots?
Norman’s example of a crackpot from ‘some’ blog…Peter Duesberg…inducted into the National Academy of Science for his discovery of the fist cancer gene. Awarded the California Scientist of the year plus numerous other awards.
Stefan Lanka…who discovered the first virus in the ocean.
Shula…who proved using a Pirani gauge that conduction/convection is 260 time more effective at dissipating heat from a surface than radiation. In other words, he proved the energy budget theory is wrong.
You’re a queer duck, Norman.
Gordon Robertson
Just because they had credentials at one time does not mean they are not crackpots. When a person makes claims way outside the accepted (which is based upon observation, evidence and experiments).
You still bring up Shula as a credible source. You keep bringing this clown up even though his point is very bad. I have explained to you countless times that the wire is made with low emissivity wire intentionally so that radiant energy is reduced to eliminate it as a source. You do not understand emissivity or anything about radiant energy. You have no real knowledge of any physics or Chemistry. You make up nonsense all the time and wonder why you are a crackpot. That is what crackpots do, just make up stuff.
HIV is a virus that destroys the immune system and causes death when the body can no longer fight infections that grow after the immune system is knocked out. Real scientists, ignoring Duesberg, have now come up with treatments that work and reduce the fatality considerably.
https://www.who.int/news-room/fact-sheets/detail/hiv-aids#:~:text=There%20were%20an%20estimated%2039.0,1.7%20million%5D%20people%20acquired%20HIV.
In this article the treatment for HIV is “There is no cure for HIV infection. It is treated with antiretroviral drugs, which stop the virus from replicating in the body.”
You never read more than what a crackpot tells you then you blindly believe it even when it is clearly shown your darling crackpot is wrong.
Gee, it should be very simple for Clint to find and link to evidence to back up his claims if they were true.
But he never ever does.
Thus we can safely ignore his bogus claims.
Nate, I clearly support my physics. I can explain things, but I can’t understand them for you.
You can’t find one time where I got the physics wrong.
All you have are your false accusations.
Clint R
Why must you blatantly lie?
Nate is totally correct about your posts and endless unsupported opinions you think are science.
YOU: “Nate, I clearly support my physics. I can explain things, but I cant understand them for you.”
This is a lie. You never support your physics (if you want to call it that, more like made up opinion).
Where is your evidence to support your claim that IR from a cold object will not be absorbed by the surface of a hotter object? You come up with poor arguments about photons adding to make higher energy photons
I find your “physics” all wrong. Just things you read from crackpot blogs that sound right to you but are not supported by any evidence.
Norman, you need to link to my exact words. I can’t respond to what you believe I said. Also, I won’t respond to your comments that contain insults and/or false accusations.
Get a responsible adult to help you, and try again.
Gee, it should be very simple for Clint to find and link to evidence to back up his claims if they were true.
But nope! Guess not.
”
You cant find one time where I got the physics wrong.”
Easy.
The time you claimed the velocities of the far side of the Moon and the near side are the same.
Bwa ha ha ha!
I think it is correct that earth is currently at the apogee. My date and time application says earth is 95.51 miles from the sun. It will 91.4 million miles on January 3.
Another mistake. Try 94.51 miles.
Well, I guess that explains the temperature spike 🙂
Robert,
Subtle, very subtle.
“Apogee” applies to Earth/Moon. For Sun/Earth, the term is “Aphelion”.
And thanks for the reminder, Tim S. This is an important factoid for the “global warming” nonsense.
Earth’s elliptical orbit means there is considerable difference in distance to Sun between Aphelion (far) and Perihelion (close). The difference in solar flux is about 90 W/m².
Now, stop to think about this for a minute. Earth’s orbit causes an annual variance of 90 W/m², yet we never see a corresponding change in temperature. Yet the cult wants us to be panicked over an imaginary 1 W/m².
Just some more science to tweak the cult children….
And, of course, things are sometimes counter-intuitive –
“The northern hemisphere receives significantly less energy from the sun when the Earth is closest to the sun!
When the earth is closest to the sun, the northern hemisphere receives approximately 9% less energy from the sun than when it is farthest from the sun. Gotta love that axial tilt!” – according to a PhD geophysicist. Seems fair to me.
Opposite to the southern hemisphere.
The Earth still continues to cool, albeit very, very, slowly.
No GHE. Not even a teensy, weensy, one.
I think you are correct. I knew it was a word I am not familiar with and I looked at the wrong reference.
SpaceX Drops Some Incredible Starship News! What Will This Lead To?
https://www.youtube.com/watch?v=2CyuBTP6yj8
And some stuff about recent asteroid sample return.
It was another cold, icy morning across southern and central Australia with many areas covered in frost. https://i.ibb.co/djkVwmc/449714787-883612957141786-4535587314561364801-n.jpg
I guess CO2 has failed to warm Australia. Same old, same old. Even in Auckland, New Zealand, in winter, you get frost/ice in the morning even though the climate is sub-tropical. Mind you, by noon, it often rises to 15C.
Hurricane Beryl will pass over northern Yucatan and enter the Gulf of Mexico, where, as a tropical storm, it could reach southern Texas with heavy rainfall.
There you go, gb. You might get some rain to make the cactii grow. Maybe more and bigger peyote buds. I hear Death Valley is going to get a smidge hotter.
swenson…from Christos…”Christos is pointing out (quite correctly) that it is simply delusional to imagine that you can calculate the temperature of an object by measuring the radiation falling upon it if I have understood him correctly”.
***
Of course. Radiation emanates from a thin layer of surface atoms/molecules. Radiation can tell you that the Earth’s surface averages 15C but it can’t tell you the Earth has a core that is 5000C. It can’t tell you the temperature a few feet below the surface which is in excess of 15C and getting progressively hotter the deeper you go.
Winter temperatures in Australia will not rise because the Earth is farthest from the Sun in orbit in July. The difference between January and July is about 5 million kilometers.
https://i.ibb.co/D4Wx4C7/gfs-T2m-aus-1.png
Good point, Ren.
And we need to remember that as long as the Earth’s axis is tilted as it is, no amount of CO2 will prevent the Arctic freezing over in January and the Antarctic freezing over in July. In fact, the South Pole never gets above 0C, even in summer.
Some have brayed about warming in the Antarctic Peninsula, which reaches the latitude of South America. Big deal, the Antarctic continent is so cold that glaciers cannot possibly melt.
Also, since the Arctic has no solar input in winter, and temps reach down to -60C, the flow of that cold air to more temperate regions far to the south will continue to freeze that area in winter.
Weather sure is fun. Easily overrides any pithy (0.06C) warming from CO2.
Anthropogenic theory kaput!!!
Willard,
“The question is why youd use “Te = [(1-a) S /4σ ]1/4 (K)” when it obviously uses solar flux and you said that this was not possible.”
–
The non-linearity of the S-B radiation law, when coupled with a strong latitudinal variation of the INTERACTED solar flux across the surface of a sphere, and with the planet rotational spin, and with the average surface specific heat, creates a mathematical condition for a correct calculation of the true global surface temperature from a spatially integrated infrared emission.
Jemit = 4πr^2*σΤmean⁴ /(β*N*cp)∕ ⁴ (W)
Where:
Jemit (W) – is the INFRARED emission flux from the entire planet (the TOTAL)
r – is the planet radius
σ = 5,67*10⁻⁸ W/m^2K⁴, the Stefan-Boltzmann constant
β = 150 days*gr*oC/rotation*cal – is the Solar Irradiated Planet INTERACTING-Emitting Universal Law constant ( the Rotational Warming Factor constant ).
N – rotation /per day, is planets rotational spin with reference to the sun in earthen days. Earth’s day equals 24 hours= 1 earthen day.
cp – cal/gr*oC- is the planet average surface specific heat
Planet Energy Budget
When planet surface is in radiative equilibrium, planet energy balance should be met: Energy In = Energy Out
Jnot.reflected = Jemit
πr^2*Φ(1-a)S (W) – is on the entire planet surface the not reflected portion (the TOTAL not reflected) of the incident on planet surface solar flux
Φ – is the planet surface solar irradiation accepting factor (the planet surface spherical shape and the planet surface roughness coefficient).
a – is the planet average surface Albedo (Bond)
S – W/m^2 – the solar flux at the planet’s average distance from the sun.
πr^2*Φ(1-a)S = 4πr^2*σTmean⁴ /(β*N*cp)∕ ⁴ (W)
Solving for Tmean we obtain the PLANET MEAN SURFACE TEMPERATURE EQUATION:
Tmean.planet = [ Φ (1-a) S (β*N*cp)∕ ⁴ /4σ ]∕ ⁴ (K) (3)
–
The Tmean.planet equation uses solar flux, because the stronger the solar energy upon the planet surface – the higher the planet average surface temperature (and it is an obvious observation).
The difference with equation (1) is that the solar flux is not averaged over the entire planet surface. Thus the (Tmean) is not the planet surface uniform temperature as the (Te) is, but the average surface temperature.
The equation (1) provides the instrument for transforming flux into temperature T = (S /σ)^1/4
It is valid on the uniform temperature surfaces.
Also it is valid for the infinitesimal small points at infinitesimal small instants of time (so we accept each point has its respective uniform temperature).
–
https://www.cristos-vournas.com
All is best – except your Φ which is nonsense; this has been proven to you many times.
But like Robertson, Clint R and a few other stubborn boys, you never admit being wrong.
Κανένα πρόβλημα για μένα όμως!
Bindi, what makes you believe I can’t admit being wrong?
I once thought you might have some interest in science, but I admit I was wrong. I also make typos, from time to time.
See? I can admit being wrong, when I’m wrong.
But you can’t come up with a viable model of “orbiting without spin”. You’re wrong about Moon, but you won’t admit it.
> The Tmean.planet equation uses solar flux
Your equation uses multiplication, Christos. To multiply is to add many times. So in your equation fluxes add.
This is a fairly basic point.
Best of luck trying to defeat your own algebra.
Willard, I am not so capable in idiomatic English.
“Your equation uses multiplication, Christos. To multiply is to add many times. So in your equation fluxes add.”
What do you mean by that?
Because the equation (3) theoretically calculates the planets’ and moons’ average surface temperatures very much close to those measured by satellites.
Doesn’t that mean the equation is a good equation?
–
https://www.cristos-vournas.com
Thank you for your question, Christos.
What I mean is that 2 x 3 means 2 + 2 + 2.
To multiply is to add faster.
An algebraic structure that is multiplicative is also additive.
It is really hard to write equations with entities that cannot add.
Willard,
“An algebraic structure that is multiplicative is also additive.”
–
I never said otherwise, didn’t I ?
–
https://www.cristos-vournas.com
Christos,
Thank you for your rhetorical question.
You actually did. Here:
> Solar flux cannot theoretically be averaged over some area
To average is to add a number of elements together, and then to divide that sum by the number of elements.
Your equation obviously does that.
In fact, the solar constant is itself an average.
Willard,
“To average is to add a number of elements together, and then to divide that sum by the number of elements.
Your equation obviously does that.
In fact, the solar constant is itself an average.”
–
Also the average surface temperature adds surface temperatures together and then divides that sum by the number of elements.
–
“You actually did. Here:
> Solar flux cannot theoretically be averaged over some area”
–
Yes, because solar flux interacts with matter, it vanishes then.
Also we cannot average snow over the entire Global area, because snow belongs where it has fallen on.
–
https://www.cristos-vournas.com
Christos,
Here is one of your claim:
(C1) Yes, because solar flux interacts with matter, it vanishes then.
Here is another:
(C2) Solar flux cannot theoretically be averaged over some area, because solar flux what it does is to interact with matter.
I’m not sure how you can reconcile the two. Nor do I know what you mean by a “new interaction.” And of course one can add snow over an area. How do you think we estimate snow cover?
Snow also vanishes at spring, but you cannot average the amounts of snow over the entire planet surface.
Of course the math would be correct, but in reality there is not snow at most of the planet surface areas.
Christos,
Of course we can do all the things you deny:
https://education.seattlepi.com/percent-earth-permanently-covered-snow-ice-4666.html
We can indeed say that for every meter square of the Earth surface, between 12-33% is covered with snow.
Little Willy, please stop t-word-ing.
July 8, Beryl may make landfall in south Texas.
https://i.ibb.cOno/GPQRR1T/ventusky-temperature-water-20240708t1800-29n91w.jpg
https://i.ibb.co/GPQRR1T/ventusky-temperature-water-20240708t1800-29n91w.jpg
Happy July 4th! Let’s keep the fun going —
More reasons why the GHE is bogus:
Reason #2 — The bogus “33K”
The “33K” nonsense comes from the mythical, imaginary blackbody sphere. The mythical sphere is receiving the same average solar energy as real Earth, after albedo, of 960 W/m². We are not told if the mythical imaginary sphere is hollow or solid, or if it is spinning like Earth or always has the same side facing Sun. It’s all a mystery.
But in a steady-state condition the mythical sphere is believed to be emitting 240 W/m^2. So, using the S/B Law, the emission temperature can be calculated:
S = σT^4
T^4 = S/σ
T = [240*(10^8/5.67)]^0.25
T = 255K
Then, the mythical 255K is compared to Earth’s average temperature of 288K. The difference, 33K, as believed by the cult, is due to the GHE.
(You may sometimes see the difference as 33K, or 33°C, since Kelvins are the same as degrees Celsius. In Fahrenheit, the difference would be 59.4°F.)
The claim is then that Earth is 33K hotter than it’s “supposed to be”. Their math is correct, but their calculation is NOT linked to reality. Earth is NOT a mythical imaginary blackbody sphere. A large bullfrog can weigh 0.5 pounds. If you multiply 0.5 by a large enough number, say 2X10^25, that would make the bullfrog about the size of planet Earth. The math is correct, but the calculation is NOT linked to reality.
Earth is “supposed to be” the temperature it is, 288K. Comparing it to a mythical imaginary object ain’t science.
> Their math is correct, but
Hey Puffman, riddle me this –
Have you ever watched Games of Thrones?
Willard, please stop trolling.
Mike Flynn,
You are using a silly HTML trick to bypass moderation.
Little Willy, please stop t-word-ing.
July temperature anomalies in Ireland and the UK.
https://i.ibb.co/26Tm4N8/ventusky-temperature-anomaly-2m-20240708t0300-53n5w.jpg
Let me guess without looking, the anomalies are really cold for the time of year….
Yes!
I can prove that I am psychically linked to Ren’s mind. Every time Ren points to temperatures without saying what they are, I will guess if they are hot or cold.
I believe I will be able to read Ren’s mind correctly each and every time.
barry, how do we know you didn’t peek?
We can’t trust a cult child with your low credibility.
Let’s see you predict Ren’s next comment, before it appears, if you can actually read his mind.
Can’t do that, huh?
Grow up and get a life, child.
Ok, give me a moment….
Ok, I have foreseen that the next time Ren links to temperatures without saying what they are, they will be…. cold.
And the next time he mentions the quality of or the actual temperature, they will be…. cold.
I have seen it. Mark my words.
Regarding terrestrial temps, of course.
That’s lame, barry. That’s like predicting a science teacher will teach science.
You need to provide date/time/location for Ren’s next comment, since you can read his mind.
No more weaseling….
Clint,
Barry is like one of those idiots who says they can “predict” that the Sun will rise tomorrow. They assume the future will be the same as the past. No more intellect than a 6 year old.
Even the cultists forming the IPCC stopped “predicting”. Now it’s “scenarios” – so they can’t be held accountable for being delusional.
“That’s like predicting a science teacher will teach science.”
And that was the point. Ren will only ever mention cold weather around the world. It took you a while but you finally worked it out.
Well, if you now admit you can’t really read his mind, then I accept that.
It took you a while but you finally worked it out.
Successful predictions by climate science: https://youtu.be/QFEUezxK5Do
1/ Fossil fuel-burning will cause an increase in the atmospheric carbon dioxide and that will cause a significant warming of the planet.
2/ The microwave emission of Venus could only be accounted for by a hot surface maintained by the greenhouse effect of a very thick atmosphere, and using the standard model predicted that Venus has a 50 bar surface pressure.
3/ Predicted atmospheric carbon dioxide concentrations based on economic projections of how much co2 we would emit.
4/ Predicted that tropospheric warming would be accompanied by stratospheric cooling.
5/ Predicted Arctic amplification of warming.
Successful predictions by deniers:
1/
2/
3/
4/
5/
Did I get them all?
Ark, you can’t provide the physics to support 1 and 2. That’s why they are beliefs, not science.
3, 4, and 5 are somewhere between obvious and nebulous.
Let’s see the physics for 1 and 2. Otherwise you’ve got NOTHING.
The deniers 3, 4 and 5 predictions are indeed obvious and nebulous.
But we only have 1-5 of the deniers predictions. Perhaps there are major predictions that they instead got right. Do let us know.
I predict that the cult will:
1) Continue to deny reality.
2) Continue attempting to pervert science.
3) Continue to hate anyone not in their cult.
4) Continue trying to discredit/censor/criticize anyone offering correct science.
5) Continue to close their eyes to perversions of reality promoted by some in their cult.
Enough predictions for you barry?
Zero correct predictions to do with global climate change is typical of ‘deniers’. You’re maintaining the tradition in your own drab way.
Well you hit 1 and 4, barry.
Down thread (where you channelled Greta) you hit all 5!
You’re such a good cultist.
Now, as a rough cross-check, we enter the Venus altitude-versus-atmospheric pressure graph at 1000 millibars (the Earth’s average sea level atmospheric pressure) and go up to intersect the altitude-pressure profile line, and across to the left axis where we find the corresponding altitude of 49.5 kilometers (31 miles). This altitude is only three kilometers (or six percent) different than we found from the temperature graph.
So, in spite of the surface temperature of Venus being on the order of 864 degrees Fahrenheit, there is a region in the Venusian atmosphere which approximates that of Earth with respect to temperature and pressure.
https://web.archive.org/web/20080205025041/http://www.datasync.com/~rsf1/vel/1918vpt.htm
You can clearly see in the diagram of Venus atmosphere the troposphere, where a vertical temperature gradient acts. The graph also shows that the Earth’s troposphere is very thin compared to Venus.
But you wouldn’t want to live there.
IIRC the 1 bar pressure level is at 60C and in the middle of a sulphur acid cloud.
You have no evidence to support your claims.
Climate model projections are not evidence.
> You have no evidence to support your claims.
Step 1 – Pure Denial
but also
Step 2 – Sammich Request
Wonky Wee Willy,
“Step 1 Pure Denial
but also
Step 2 Sammich Request”.
Really? From a fanatical GHE cultist who refuses to describe the GHE?
You really are a delusional fellow, arent you? You deny the reality that the Earth has cooled for four and a half billion years, don’t you?
Definitely insane. Refusal to accept reality.
Mike Flynn,
You wonder, or not –
“Really?”
Yes, really.
Have you considered not using your silly HTML trick to bypass Roy’s moderation?
Willard, please stop trolling.
For stratosphere cooling, read the discussion above.
https://www.drroyspencer.com/2024/07/uah-global-temperature-update-for-june-2024-0-80-deg-c/#comment-1677344
“Fossil fuel-burning will cause an increase in the atmospheric carbon dioxide and that will cause a significant warming of the planet.”
The problem with this statement lies in causality. [CO2] lags temperature. This is known, but I’ve approached the analysis in a more robust way that allows causality to be separated by frequency (1/period), which allows separation of different processes.
In these plots I’ve computed the frequency response function between CO2 and temperature after removing the slope in each. In the frequency domain, delay is the negative of dPhase/dFreq. If CO2 drove temperature, then the phase would be above zero degrees. Instead it’s below, and generally falls with a slope corresponding to [CO2] lagging temperature by six months. The delay is less than two months (.13 yr) for seasonal variations (1 yr^-1), and at a frequency of 0.75 yr^-1.
The magnitude response (top left graph) is a measure of sensitivity. For periods of 10 years, the sensitivity (in paren’s) is 4.9 ppm/degC. Sensitivity falls off with frequency, much as would be expected of an integrator, or low-pass filter.
https://localartist.org/media/CO2_Temp_FRF_1st_detrend.png
The frequency-domain approach has its limits on this kind of data, so to look over longer periods I’ve de-trended the data and plotted the residuals. In this next plot, I performed a first-order detrend of temperature and ln([CO2]). Note that the ln([CO2]) does not fit a straight line that well.
https://localartist.org/media/longtrends_ln_global.png
In this last plot I’ve performed a second-order detrend on the [CO2] and Southern Hemisphere temp, just for something different.
The 2nd-order polynomial is a much better fit to the [CO2] data than a ln(), and which also suggests integration of temperature driven [CO2].
If you look at the residuals, there’s no evidence of [CO2] leading temperature, even for periods longer than 10 years.
https://localartist.org/media/longtrends_SH.png
In short, I couldn’t find any evidence that [CO2] affected temperature, and lots of evidence that temperature drove [CO2], on all time scales using 60 years worth of measured data.
And that is supported by physics and chemistry.
You asked for predictions. This is for those that deny that the sun is the primary driver of climate change.
Check out my github site for predictions (not projections), or look at the Excel version. You won’t find anything this accurate coming out of IPCC.
https://localartist.org/media/SunspotPredictionExcel.xlsx
The models (all flavors), predict global temperature from sunspot data. They do this by simultaneously extracting solar activity from the sunspot data and modeling the earth’s integral-like response.
The accuracy before 1900 is poor primarily because of poor sunspot data accuracy prior to 1800.
I have a second method for estimating solar activity that’s not as accurate, or detailed, as it uses less information from the proxies. Here I’ve replaced some of the troublesome sunspot data with Usoskin’s 14C solar activity reconstruction. The 14C data comes from carbon dating tree rings. I’ve plotted this next to measured temperature data and Loehle’s 2008 corrected temperature reconstruction, which does not include tree-ring proxies.
As with my accurate models, you can see many features in the data including the pause prior to 1975. This result also shows that the Little Ice Age and the Medieval Warm Period were global events. It also shows that temperatures will soon begin to fall.
https://localartist.org/media/SolarAndTempProxies.png
> [CO2] lags temperature. This is known.
The “CO2 lags temperature” meme is known:
https://climateball.net/but-abc/#lag
Contrarians should drop false memes.
My analysis is not a meme, and it uses the same measured data (no proxies), that is being used to push anthropogenic warming theories. There’s not even a model involved, just basic signal analysis over the time period of the greatest anthropogenic emissions.
What can I say, the measured data doesn’t lie.
“CO2 lags temperature” is indeed a meme, Robert, and your frequency response graph is “needles in the eyes,” as Bender would have said.
Do you really believe we have good measurement of sunspots in 1150?
Do you really believe we have good “measurements” of CO2 and temperature over the last 1000 years or longer? That’s what you were pushing with your meme.
First of all, to answer your question, we have no sunspot observations before about 1750. What we do have is the next best thing, a 14C proxy used to reconstruct sunspots, which are a proxy for solar activity. As I’m sure you know, carbon 14 is an isotope generated when galactic cosmic rays collide with earth’s atmosphere. The generation rate is modulated by the sun’s magnetic fields.
I’m somewhat skeptical of the amplitude accuracy of Usokin’s solar activity reconstruction. However, with my second method I’m not relying on amplitude, only the frequency of the 11-year Schwabe cycle. If you read Usoskin’s paper, also the Brehm et al. paper he references, you’ll find that they took great pains to establish time alignment between the 13 or so trees used in the analysis. They appear to have done a great job.
If you don’t understand the frequency response plot, just say so, this type of analysis is not well known in the climate-science community.
> Do you really believe we have good “measurements” of CO2 and temperature over the last 1000 years or longer?
“But Data” is indeed another meme, Robert:
https://climateball.net/but-data/#measurement
This Bingo square may not be compatible with “But Lag,” however. More so that causality is harder to establish in feedback systems.
Robert Cutler
” What can I say, the measured data doesnt lie. ”
What a nice joke. As if that was the problem.
The problem is the wrong, one-sided interpretation of the measured data.
*
Btw, Mr Cutler: when you so proudly write:
” As with my accurate models, you can see many features in the data including the pause prior to 1975. This result also shows that the Little Ice Age and the Medieval Warm Period were global events. It also shows that temperatures will soon begin to fall. ”
(wow wow wow) did you ever publish anything valuable?
When googling for your activity in the solar/climate context and excluding all links whose target contains the word ‘Russian’, the one and only link of interest is
How we know the sun changes the climate. III: Theories
Posted on June 11, 2024 by curryja | 233 Comments
By Javier Vinós
https://judithcurry.com/2024/06/11/how-we-know-the-sun-changes-the-climate-iii-theories/
in which you merely comment what Vinós tells on the Climate Etc thread.
Bindidon, based on the amount of flack I received from you I feel like I must be over a target. It doesn’t help that a lot of 4th of July fireworks are going off in the background.
You wrote: “The problem is the wrong, one-sided interpretation of the measured data.”
Can you be more specific? It’s hard to respond to non-specific rants.
As for my models and predictions, I have no idea what your objections are. Were they not as accurate as I described? Do you feel threatened by them? I don’t know you well enough to know if you’re part of the AWG crowd, but if you are, I can understand why you’d be upset.
If you’re willing to keep the discussion civilized, I’m happy to engage. Otherwise, good luck with whatever it is you do.
Typo AWG instead of AGW. AWG is a TLA from a previous life.
Mr Cutler
The lack of an answer to my central question above is also a good answer.
Feel free to push up with your stuff, you will have enough success here to stay for a while.
I’m not interested in any discussion with you, especially re. research about solar matter.
But technically 100% incompetent deniers a la Robertson, Clint R, Flynnson aka Swenson etc will love you.
Imagine! They all deny historical science like the lunar spin, Robertson even denies the existence of time, let alone time dilation!
And Earth cools since 4.5 billion years…
Sorry Bindidon, I don’t even know what your central question is. If it’s what have I published?, then you have an unfortunately narrow information filter.
In non-academic environments we have this thing called trade secrets. We don’t even patent most of our work because that would just tell our competition how to replicate our inventions.
Good luck.
Have you ever tried to publish your stuff, Robert. Considering your obfuscation, the answer must be no. So we should expect something about censorship, gatekeeping, and Galileo.
Did it every occur to you, Willard, that I might be socializing my discoveries before publishing in an attempt to gain additional insights and understand technical objections?
I’ve about decided that, on this forum, the bulk of the regulars only want to play word games and argue about HTML tags. Others who might have something useful to discuss likely won’t post, if they’re even still reading the blog, because they don’t want to be abused, and because there’s just to much useless dribble to wade through. While I had started ignoring your self-serving posts, I cannot ignore the damping effect that you and some of the others have on more productive conversations.
I’m likely going to stop monitoring this forum, so if anyone has questions or comments about my temperature prediction results, it would be best if you state them now.
Did it occur to you that it’s hard to seek technical objections while trying to protect one’s work as if it had some intellectual property behind it, Robert? Even that doesn’t cohere with having a public repository. So it’s basically a poor man’s excuse.
Put your stuff on ArXiV. See what happens.
A,
“Fossil fuel-burning will cause an increase in the atmospheric carbon dioxide and that will cause a significant warming of the planet.”
Complete nonsense, of course.
The planet is cooling, losing energy at a net rate of 44tW.
What mental defect leads you to think the planet is “warming”?
You left out one of the accomplishments of climate science:
6/ Accurately predicted that the temperature of earth would increase by one full degree C over a mere 8 month span in 2023!
Here is the HTML Mike Flynn (Swenson) is inserting into his text.
He is trying to claim he is not doing it.
https://tinyurl.com/MikeFlynnBeingUntruthful
Interesting.
There is a D-word too!
I have to wonder why he is also inserting it into your name.
He can’t be too bright.
It’s really hard to misunderestimate a guy who uses an iPad as his main commenting device.
Wonky Wee Willy,
You wrote –
“misunderestimate”
Mike Flynn,
Yes, I wrote “misunderestimate.”
Do you not know why?
“Do you not know why?”
Of course I do. You’re stupid.
Willard, please stop trolling.
No, Mike.
That’s not the reason.
You wrote the S-word using your silly HTML trick to bypass moderation, right?
“Thats not the reason.”
Of course it is. Why are you denying it?
Willard, please stop trolling.
Mike Flynn,
You ask –
“Why are you denying it?”
Because it’s true.
Instead of using your silly HTML trick to bypass moderation, have you considered revisiting your favorite bushisms?
I have shown this a while ago: it’s simply using the Cyrillic letter ‘o’ (#x43E)passed thru e.g.
https://mothereff.in/html-entities
and inserted into the reply window.
In the same vein, you can use Cyrillic ‘p’, kidding the scanner with absorрtion…
The code he is using is Decimal ‌, or Hex ‌, or HTML &zwnj, called “Zero Width Non-Joiner”.
People who deliberately subvert blocks like this should be banned.
He’s just come back under a different nym and deny ever being Swenson.
Which name is that?
Or did you mean “he’ll”?
That’s a definite possibility, as he just intimated that Roy was incompetent via a hypothetical –
The first claim is quite wonderful. He knows that he’s using an HTML trick to bypass moderation. Yet he suggests that his trick wouldn’t work if it bypasses moderation!
Mike Flynn is definitely one of a kind.
My brain clearly wasn’t working in the wee hours of the morning … not sure where I pulled “subvert” from. I was clearly looking for “circumvent”.
AQ,
“People who deliberately subvert blocks like this should be banned.”
Go ahead and do something about it, then, and stop whining.
People who refuse to describe the GHE are always in favour of suppression of the truth, which is that there is no GHE, and the planet is now cooler now than it was four and a half billion years ago!
It doesn’t look like Dr Spencer is too worried about me commenting. It won’t change a single fact. He might even support freedom of expression, for all I know.
Unlike you pathetic losers.
Deliberately circumventing the banning of words has NOTHING to do with “the truth”. You can still post your nonsense without making personal attacks. No one has suggested banning you for your fake science, only for your obscenities and your refusal to accept rules set by your idol.
AQ,
“No one has suggested banning you for your fake science, only for your obscenities and your refusal to accept rules set by your idol.”
Nobody has suggested “banning” me for any reason at all. Nobody with any brains, anyway.
I had to laugh at “your refusal to accept rules set by your idol.”
What rules? Which idol?
You are being a bit too cryptic. Others might assume you are just making stuff up, for some reason you refuse to divulge. Petty spite, perhaps?
[derisive snorting]
Mike Flynn,
You say –
“Nobody has suggested “banning” me for any reason at all.”
Rightly so: everybody who suggested banning you had their reason.
When Roy asked you to start your own blog, you disappeared for a while and you came back under another nickname.
Coincidence?
“Mike Flynn,
You say
Nobody has suggested “banning” me for any reason at all.
Rightly so: everybody who suggested banning you had their reason.
When Roy asked you to start your own blog, you disappeared for a while and you came back under another nickname.
Coincidence?”
Maybe you could address your complaints to an appropriate authority. There is no sense in whining to me. I am as powerless to determine who comments on this blog as you are.
Carry on.
Mike Flynn,
I believe that you have the power to stop using a silly HTML trick to bypass moderation.
Why would I talk to anyone else but you?
Live long and prosper. Or not.
“Why would I talk to anyone else but you?”
How the heck would I know? Is that a particularly stupid gotcha, or do you really not understand why you do things?
Insanity? Lack of self control?
[Willard is a very, very, odd person]
Mike Flynn,
You ask, or not –
“How the heck would I know?”
Because you believe that you have the power to use or not use your silly HTML trick to bypass moderation, perhaps?
Feel free to tell me otherwise.
“Feel free to tell me otherwise.”
I always do.
Thank you for admitting that you have no control over what you write, Mike.
AQ,
“He is trying to claim he is not doing it.”
Really? Doing what?
Mike Flynn,
Using a silly HTML trick to bypass moderation.
You’re welcome.
So Mikey, after you’ve read the first sentence it is promptly erased from your memory, and you only recall the final sentence?
Is that deliberate, or has someone been sucking out your amygdala and hippocampus with a straw?
AQ,
“He is trying to claim he is not doing it.”
Really? Doing what?
Can’t say? Won’t say?
You might as well refuse to describe the GHE while you’re at it!
[laughing at pretentious dimwit]
Mike Flynn,
Using a silly HTML trick to bypass moderation.
You’re welcome.
“Using a silly HTML trick to bypass moderation.”
If you say so, Willard, if you say so.
Willard, please stop trolling.
“So Mikey, after youve read the first sentence it is promptly erased from your memory, and you only recall the final sentence?”
There is some weird filter that bars him from reading anything properly. Often he can’t get past the first paragraph.
“There is some weird filter that bars him from reading anything properly. Often he cant get past the first paragraph.”
Good to know. Thanks.
barry, please stop trolling.
There is no need for say-sos Mikey. Everyone can now see what you have been doing.
“There is no need for say-sos Mikey. Everyone can now see what you have been doing.”
Thank you for your bizarre input. Were you trying to say something relevant?
Maybe you should stick to refusing to describe the GHE.
AQ, please stop trolling.
Hey Mike, heads up –
You used your silly HTML trick again to bypass Roy’s moderation.
Cheers.
“Hey Mike, heads up
You used your silly HTML trick again to bypass Roys moderation.
Cheers.”
Thank you for your input.
Willard, please stop trolling.
Hey Mike, heads up –
You used your silly HTML trick again to bypass Roy’s moderation.
Cheers. Or not.
Thanks for your interest.
Here is the entire page source:
view-source:https://www.drroyspencer.com/2024/07/uah-global-temperature-update-for-june-2024-0-80-deg-c/
Flynn’s comment begins line 3905
The first part didn’t get highlighted. You have to copy and paste the entire line.
Willard, please stop trolling.
Mike Flynn,
You used a silly HTML trick to bypass moderation once again.
Little Willy, please stop t-word-ing.
Поглощение!!!
For some reason, someone is terrified of the word “absorption”.
I have no idea why. Must be an American thing.
Mike Flynn,
The A-word is banned to hinder Sky Dragon cranks from relitigating it in each and every thread.
Hence why you need to use a silly HTML trick to bypass Roy’s moderation.
“The A-word is banned to hinder Sky Dragon cranks from relitigating it in each and every thread.”
You are obviously just making stuff up. Why do you refuse to explain why you use stupid terms like “Sky Dragon cranks” and “relitigating”?
Refusal to accept reality is a sign of insanity. Can you demonstrate that you are not completely bonkers? I doubt it, but feel free to show otherwise.
[laughing at impotent and inept troll]
Mike Flynn,
If I ever wanted to ban a word from a WP blog, I’d add it to a blacklist of words that filter out the comments using them.
What I wouldn’t be able to do is to ban combinations of the letters of these words and your silly HTML trick to bypass moderation.
I’d ban the special characters you’re using.
Cheers.
Worried Wee Willy,
“What I wouldn’t be able to do is to ban combinations of the letters of these words and your silly HTML trick to bypass moderation.”
Luckily, it seems that not everybody shares your enthusiasm for censorship.
Good thing that you are completely powerless to enforce your insane desires, isn’t it?
Willard, please stop trolling.
Mike Flynn,
You say –
“Luckily.”
Pray tell – how does it feel to go in someone’s house and bypass his house rules by using a silly HTML trick?
“Mike Flynn,
You say
Luckily.
Pray tell how does it feel to go in someone’s house and bypass his house rules by using a silly HTML trick?”
Why do you ask such a stupid gotcha?
Willard, please stop trolling.
Mike Flynn,
What gotcha?
That you’re coming in Roy’s house and bypass his house rules by exploiting a silly HTML trick?
There’s no gotcha there.
Unless for you moral principles are gotchas.
“That youre coming in Roys house and bypass his house rules by exploiting a silly HTML trick?”
You have now appointed yourself as guardian of “Roy’s house”, have you? Well done. I presume you have written up some “house rules” for “Roy” to enforce. Did he thank you?
You obviously claim to be a close friend of “Roy”, on first name terms – no need to call him Dr Spencer, is there? Pardon me (only joking) while I laugh!
Gee, a choice at last – Dr Roy’s Emergency Moderation Team (DREMT), or Roy’s House Monitor (Willard).
Willard, please stop trolling.
Mike Flynn,
You say –
“You obviously claim”
Do I?
Perhaps you could quote me saying so.
You still have used the T-word, which means you still have used your silly HTML trick to bypass Roy’s moderation.
Thank you for your concern.
But in real world there is not any +33C greenhouse effect on Earth’s surface.
https://www.cristos-vournas.com
Step 1 – Pure Denial
Willard,
You refuse to describe this mythical GHE.
Can’t or won’t?
You are denying reality. That makes you insane.
Willard, please stop trolling.
Mike Flynn,
You deny having been spoon fed at least a thousand times since at least when you commented under your proper Climateball name.
Meanwhile, you are also evading moderation by using a silly HTML trick.
Please, do continue to play dumb.
Willard,
You refuse to describe this mythical GHE.
Cant or wont?
You are denying reality. That makes you insane.
Willard, please stop trolling.
You copy-pasted your comment, Mike.
It shows, for there are characters missing.
Still on your silly tablet?
Willard,
You refuse to describe this mythical GHE.
Cant or wont?
You are denying reality. That makes you insane.
Willard, please stop trolling.
Mike Flynn,
You say –
“Cant or wont”
What are you braying about?
Cheers.
Willard,
You refuse to describe this mythical GHE.
Cant or wont?
You are denying reality. That makes you insane.
Willard, please stop trolling.
“Cant or wont” make no sense, Mike.
What are you braying about?
Willard,
You refuse to describe this mythical GHE.
Can’t or won’t?
You are denying reality. That makes you insane.
Willard, please stop trolling.
Mike Flynn,
You still used your silly HTML trick to bypass moderation.
Cheers.
“Mike Flynn,
You still used your silly HTML trick to bypass moderation.
Cheers.”
Whining again, are you? What are you babbling about? I’m not sure why you would think anybody values your opinion, but you seem to.
Keep at it.
Mike Flynn,
That you used your silly HTML trick to bypass moderation isn’t an opinion.
It’s a fact.
Cheers. Or not.
Thank you for your interest.
Willard, please stop trolling.
Mike Flynn,
You used your silly HTML trick to bypass moderation once again.
That’s not an opinion. It’s a fact.
Feel free to deny it. Or not.
Willard, please stop trolling.
See, Mike?
*That* is an opinion.
And you used your silly HTML trick to bypass it.
Willard,
Solar flux cannot theoretically be averaged over some area, because solar flux what it does is to interact with matter.
When solar flux is averaged, the averaged flux is four (4) times weaker, therefore there would be a new interaction result, which would be very different from the actual one.
The solar flux /Earth’s surface interaction result comes up with Tmean = 288K.
The averaged solar flux’s the new interaction result comes up with Te = 255K.
–
https://www.cristos-vournas.com
Christos,
Solar flux is already an average.
You should not listen to Puffman on algebraic matters.
On IT menial stuff, perhaps?
“Solar flux is already an average.”
Good to know, if completely obscure and cryptic.
Does the “average” have something to do with the GHE which you refuse to describe, or are you just acting the goat for reasons which you are not prepared to divulge?
You could always say that you are not a complete idiot – just an average idiot.
Carry on being irrelevant. It’s a reason to laugh at you.
Mike Flynn,
You say –
“Good to know”
Thank you.
Cheers.
You’re most welcome.
Willard, please stop trolling.
Mike Flynn,
You keep using your silly HTML trick to bypass moderation.
Why is that?
“Why is that?”
Why do you ask?
[laughing at Idiotic troll]
Why are you still using your silly HTML trick to bypass moderation, Mike?
“Why . . . ”
Oh dear, asking for a “sammich” again, are you?
Maybe instead of posing stupid gotchas, you might asleep yourself why you refuse to describe the GHE.
How hard can it be?
Willard, please stop trolling.
Mike Flynn,
I ask because I want to know the reason why you are you still using your silly HTML trick to bypass moderation.
“Because I can” does not cut it.
Cheers.
Worried Wee Willy,
You wrote –
“I ask because I want to know the reason . . .”
Want in one hand, pee in the other, see which hand gets wet.
Willard, please stop trolling.
[Willard is an incomplete idiot]
Mike Flynn,
You are free to fantasize about peeing in your hand. Or not.
It still would be interesting to know the reason why you are you still using your silly HTML trick to bypass moderation.
Worried Wee Willy,
You wrote
“I ask because I want to know the reason . . .”
Want in one hand, pee in the other, see which hand gets wet.”
Willard, please stop trolling.
[Willard is an incomplete idiot]
The I-word is hard to write without using your silly HTML trick, Mike.
Why is that?
Little Willy, please stop t-word-ing.
Meanwhile, it still snows in the northern hemisphere in July (not in Greenland).
https://i.ibb.co/L0DxS2d/nh-swe-1.png
Also in Greenland.
https://i.ibb.co/FVyf6Rz/SMB-curves-LA-EN-20240703.png
Robert Cutler,
Because the oceans are net CO2 sinks, and the only significant net sources are of anthropogenic origin, what is the mechanism by which “[CO2] lags temperature?”
If the oceans were net sources you wouldn’t see decreasing ocean pH, no?
The oceans are big. Therefore filled with more life than land, and CO2 is plant food.
Arkady, thanks for the question. The analysis has nothing to to say about net sources and sinks. Anthropogenic CO2 can independently contribute to both atmospheric concentrations and ocean acidification. All the results indicate is that changes in temperature will cause CO2 to add or subtract from those contributions.
Robert Cutler,
We know that natural sources contribute a net -1.7 Gt per year, and anthropogenic sources a net +46.5 Gt per year.
If, as you say “[CO2] lags temperature,” it’s merely a coincidence then.
I trust you’ve read Dr. Spencer’s posts on sources and sinks: https://www.drroyspencer.com/2024/04/unnecessary-net-zero-part-ii-a-demonstration-with-global-carbon-project-data/
Arkady: “We know that natural sources contribute a net -1.7 Gt per year, and anthropogenic sources a net +46.5 Gt per year.”
I’m not sure I’m following your logic. You haven’t said anything about temperature, so you haven’t said anything about causality. CO2 sources and sinks are irrelevant, the question is what is the temporal relationship between atmospheric CO2 concentrations and temperature, particularly over longer time intervals? Nobody questions that CO2 follows ENSO. Blue lags red.
New plot with with updated temp/co2 data and slightly different detrend parameters.
https://localartist.org/media/longtrends_2_1_global.png
I made this for easier comparison with the linearly detrended ln([CO2]) version
https://localartist.org/media/longtrends_ln_global.png
“ You haven’t said anything about temperature, so you haven’t said anything about causality.”
Did you already forget your objection to my post?
Here, again, is what I said: Fossil fuel-burning will cause an increase in the atmospheric carbon dioxide and that will cause a significant warming of the planet.
What more do you want me to say?
“I’m not sure I’m following your logic.”
The logic is that the only material sources of CO2 are anthropogenic. CO2 from natural sources is balanced by the natural sinks.
You believe that CO2 is responsible for warming. I do not. Check out the first plot. CO2 contribution is only 0.06 degree, and I think that’s generous. It’s probably just compensating for UHI bias in the temperature data.
https://github.com/bobf34/GlobalWarming/blob/main/hybridmodel.md
The first plot shows a joint estimation of a CO2 temperature model, and a sunspot-based temperature model, the second and third plots on the page.
It has nothing to do with beliefs.
It is simply the intersection of Molecular Spectroscopy and Climate Science, which you choose to pretend does not exist.
“If the oceans were net sources you wouldnt see decreasing ocean pH, no?”
What a stupid gotcha!
Mike Flynn,
Is the S-word another banned word that you keep injecting here by using your silly HTML trick?
“Mike Flynn,
Is the S-word another banned word that you keep injecting here by using your silly HTML trick?”
Another stupid gotcha, is it?
Willard, please stop trolling.
Mike Flynn,
The T-word is banned word that you and Graham D. Warner keep injecting here by using your silly HTML trick.
“The T-word is banned word that you and Graham D. Warner keep injecting here by using your silly HTML trick.”
Your “banning” doesnt seem to be working. Why do you bother? What is a “T-word”?
Willard, please stop trolling.
Mike Flynn,
You say two false things –
“Your “banning” does not seem to be working.”
First, it’s not my banning, but Roy’s.
Second, if it wasn’t working, you would not need a silly HTML trick to bypass Roy’s banning.
Please try again. Or not.
“You say two false things . . . ”
If you say so, Willard, if you say so.
Happy 4th everybody!
After scanning through many of the comments here, I can tell there is still a great deal of conflict over AGW. And this conflict sure does get emotional. As a BS Meteorology with 40 years weather forecasting experience, I am asking for a quick science lesson from the higher educated.
For 30 years, I never was interested in climate. My attitude was basically tomorrow’s weather was hard enough, why would I concern myself with trying to predict weather years into the future? I just assumed it was impossible. But when I was assigned to forecast weather off the Alaskan Slope from 2007 to 2015, my interest in climate started to pick up. After hearing predictions by so-called experts that the Arctic would experience an ice free summer within a decade, I knew something was amiss. I just knew there was no friggin way that would happen in such a short amount of time.
From my limited knowledge of climate, I understand that the earth has gone through extensive periods of time without polar ice caps. Am I correct? I believe the Eocene, about 34-60 million years ago was such a period. During this warm-earth period, I don’t believe life on earth was severely harmed by it. As a matter of fact, I think life flourished.
Here is my question. Since life on earth did just fine without polar ice caps, why is there so much hysteria about our current warming trend and the very slight ice melt that is going on now?
There’s nothing wrong with your question, Rob. In fact, it’s a really good question. It hits at the very core of the cult’s unfounded fears.
Supporting what you’ve heard about the climate history of the poles, evidence of crocodiles has been found in the Arctic:
https://www.newscientist.com/article/mg19826611-200-when-crocodiles-roamed-the-arctic/
Rob,
“I am asking for a quick science lesson from the higher educated.”
Good luck. If that sounds cynical, so be it.
Rob, There are a few people who post around here that deny climate change, the two before this post being prime examples.
But, your lead in suggests that there is some similarity between today and the climate “34-60 million years ago”. For starters, about 3 million years ago, the Isthmus of Panama closed and the flows between the tropical Atlantic and the Pacific stopped. One result has been that the tropical Atlantic is much saltier than the Pacific, which has changed the circulation in the Atlantic resulting in the deep diving currents in the polar North Atlantic. As a result, the recent climate is different compared with your earlier period with a pattern of repeated periods of Ice Age conditions with occasional warm periods.
There’s quite a bit more to be learned. Have fun, but watch out for those who have an agenda and who haven’t taken the time to study the science.
E. Swanson, why the false accusation? Where did I ever “deny climate change”. Earth is currently in a natural warming phase. Is that “denying climate change”?
What I deny is your bogus GHE, that you can’t even provide a viable description of. That’s one reason we know it ain’t science.
“There are a few people who post around here that deny climate change,”
Climate is the statistics of historical weather observations. As weather changes, so do the statistics.
Go on, name someone who denies that weather changes.
Can’t do it? Won’t do it? Colour me unsurprised.
“Since life on earth did just fine without polar ice caps, why is there so much hysteria about our current warming trend and the very slight ice melt that is going on now?”
Setting aside the emotive “hysteria”…
Different geological periods best suited different ecologies. Humanity flourished and civilizations emerged in a single, stable geological period – the holocene. This came after a glacial period where the world warmed by 5 to 6 C over several thousand years, accompanied by sea level change of 130 metres. In the time our civilization have flourished, global temps have not changed much.
More recently the world has warmed by over 1 C in 100 years. This is 10 times faster than warming from the last glacial maximum 20,000 years ago.
The concern with anthropogenic global warming is not so much that we may be engineering a new geological period with warmer temps and higher sea levels, it is much more the rate at which this may occur, changing weather patterns, agricultural zones and water availability faster than our nation-locked populations can adapt to. If the world warmed at the rate of 1 C per 1000 years, as it did to arrive at our current period, we would not be concerned.
Cost/benefit analyses generally reckon that it will be much less stressful on humanity to reduce the global experiment with our atmosphere than to adapt to it.
There is plenty of uncertainty regarding outcomes, but as we are unable to walk away from our ongoing, unmanaged geological experiment, it would be imprudent to do nothing about it and hope for the best.
It is the fact that we are inside the test tube with no way to escape the results of our choices that makes the issue pointy.
Great panic-attack there barry.
You sound like Greta….
Hey Puffman, riddle me this –
https://www.youtube.com/watch?v=KIP2vukNOPc
Have you called yet?
“Humanity flourished and civilizations emerged in a single, stable geological period the holocene. This came after a glacial period where the world warmed by 5 to 6 C over several thousand years, accompanied by sea level change of 130 metres. In the time our civilization have flourished, global temps have not changed much.”
The Sahara desert become is present vast desert, sea levels have dropped 1 meter, and Earth has become drier and colder.
Almost like Mars.
Now’s your cue.
barry…”More recently the world has warmed by over 1 C in 100 years”.
***
After it had cooled at least the same amount (Little Ice Age) over the previous 400+ years.
Come on, Barry, is the reality too much for your alarmist brain to process? What makes more scientific sense, that a trace gas caused the 1C warming or that the warming is actually a rewarming after an extensive period of cooling due to a mini ice age?
It may still go on recovering for some time. Akasofu (a geophycicist) estimated 0.5C/century rewarming. We are 174 years beyond 1850, when the LIA ended, and if it did cool 2C, we still have about 26 years to rewarm, if Akasofu is right.
It has only rewarmed 1C and the amount of ice created during the LIA, enhanced by winters, is likely delaying the full extent of the rewarming.
Willard, please stop trolling.
“More recently the world has warmed by over 1 C in 100 years”
No it hasnt. That is a physical impossibility.
You are probably referring to the fact that heat from human activities has been detected by thermometers.
That’s life. The planet itself is now cooler than it was four ago and a half billion years ago.
Accept reality if you dare.
barry is panicked because he believes Earth is warming faster than “it should”: More recently the world has warmed by over 1 C in 100 years.”
His cult believes that insignificant increase is due to CO2. Their cult equation calculates a 3.7 W/m². What the cult fails to understand is Earth handles a change of 90 W/m² every year, with no one noticing.
But poor barry and Greta live in fear of an imaginary 3.7 W/m² increase.
See what cults can do?
I don’t see anything alarmist about my description of the concern with global warming. It starts by dismissing the word ‘hysteria’, and seems a lot more relaxed than the spikey chattering that followed it.
Relax everyone.
“I dont see anything alarmist about my description of the concern with global warming”
Obviously, you wouldn’t, would you?
You seem to think that anthropogenically generated heat is harmful. Others, like Svante Arrhenius, might think it was positively beneficial, and lead to ” ages with more equable and better climates.”
Let me know when the Antarctic has warmed to its previous fertile ice-free state. Should I panic if that happens?
In the meantime, keep worrying on my behalf. I can’t be bothered.
Mike Flynn,
Svante was also a board member of the Swedish Society of Racial Hygiene, an organisation established in 1909 which pursued the study and promotion of eugenics.
Make that what you will. Or not.
Cheers.
“Svante was also a board member of the Swedish Society of Racial Hygiene, an organisation established in 1909 which pursued the study and promotion of eugenics.”
Good for him! People are free to believe anything they want. So are others who may believe differently.
Do you have a point, or are you just troing for no good reason at all?
Mike Flynn,
You say –
“People are free to believe anything they want.”
Just like you are free to let points fly above your head. Or not.
Do you feel that you’re free to use your silly HTML trick to bypass Roy’s moderation, by any chance?
“Do you feel that youre free to use your silly HTML trick to bypass Roys moderation, by any chance?”
What are you gibbering about, fool?
Willard, please stop trolling.
“You seem to think that anthropogenically generated heat is harmful.”
You didn’t understand my remarks, then.
In the time our civilization have flourished, global temps have not changed much.
Aye, there’s the rub. And that’s a very short time. We are about to move into an envelope in which we have never previously been tested as a civilisation. Maybe our technological talents will help us navigate the change. And maybe not.
Sorry Elliott, but we’re NOT moving into some dangerous “envelope”.
You need to recognize you’ve been fed a system of untruths. Start with some basic easy-to-understand physics, such as — What is “temperature”:
https://www.drroyspencer.com/2024/06/uah-global-temperature-update-for-may-2024-0-90-deg-c/#comment-1672287
test
A crisis is a combination of danger and opportunity. Global warming presents us with those characteristics. The prospect of more dangerous weather, loss of coastal cities and the disappearance of the glacial “water towers” of Asia is an obvious series of dangers. On the other hand, the transition of the economy to renewable energy is a vast economic opportunity, offering both growth and wider distribution of wealth to poor but sun-rich countries.
The problem is that in the English-speaking world, in particular, bad actors have made an ideological issue out of the science. It’s a war between tribes. Just like with creationism, smoking and vaccines there is more heat than light, at least from one side.
“The problem is that in the English-speaking world, in particular, bad actors have made an ideological issue out of the science”
Exactly. The GHE cultists refuse to acknowledge reality, preferring to believe in something they refuse to describe.
What a pack of delusional fools!
AB, please stop trolling.
Whoops,
EB, please stop trolling.
Rob Mitchell…re ice-free Poles in the past…our current axial tilt is about 23 degrees. If something happened in the past, like a massive collision with a body of significant mass, it could have knocked the planet from a vertical axis to one with the 23 degree tilt. If the axis was vertical before, that would explain the ice-free poles.
Such a body my even have affected the orbit itself.
Have you ever read Velikovsky (worlds In Collision, Ages in Chaos). He is regarded as highly controversial but his work is based on ancient history. I find his writing absorbing even though I am not sold on his claims. However, as I said, the evidence he supplies to back his claims are good.
The interesting thing for me is that Velikovsky predicted the temperature of Venus to be 800F (427C), based on his claims. He was very close as was discovered by the Pioneer probe in 1978. Till then, the surface temperature of Venus had been thought to have been a lot lower.
Not only that, the current anthropogenic theory is based on the alleged greenhouse effect on Venus. That was proposed by Carl Sagan and adopted by James Hansen of NASA GISS. Hansen’s tipping point theory, the basis of the catastrophic global warming theory, is based entirely on the thory that CO2 in th Venusian atmosphere caused a greenhouse environment that reached a tipping point and ran away with itself.
The Pioneer probe proved that theory wrong since a surface temperature of 450C could not be explained by a greenhouse effect. It is far too hot and according to astronomer Andre Ingersoll, it would contradict the 2nd law of thermodynamics.
Thanks Gordon, Clint, and others for your thoughts on climate change and how much of an urgency is actually there.
I noticed there were some comments about “deniers” yet again. I don’t know of anybody within the field of meteorology who denies that climate changes. We all agree that climate changes due to a multitude of reasons. And we all agree that living organisms also play some role in climate change. The big argument is over how much.
I think the alarmist gang really went off the rails over cows and their greenhouse emissions. Whenever the fact that millions of buffalo roamed the land before domesticated cows is brought up, the alarmists (mostly non-scientists) were reduced to saying the most absurd thing – domesticated cows have worse burps and farts than the buffalo! I cannot come to any other conclusion than the climate-social justice warriors are going after our food supply. Just look at the current administration and their efforts to blame our farmers for causing too much CO2 emissions. And they are trying to punish our farmers because they dare to use the internal combustion engine for their farming.
I think Dr. Lindzen is right. Climate change is no longer a scientific argument. It is a political movement.
> I dont know of anybody within the field of meteorology who denies that climate changes.
Thanks for the reminder:
https://climateball.net/but-denier/#climate
Little Willy, please stop t-word-ing.
A large high pressure system is sitting west of Tasmania and will remain stationary until the weekend.
A high pressure system is an area of high pressure relative to its surroundings. On the map, it appears with an ‘H’ with the number indicating the pressure.
This system will impact weather right across the country until Sunday. Parts of southern and central Australia are likely to experience widespread morning frosts, very cold nights with cool and sunny days to follow, while coastal areas of NSW and Qld can expect some showers.
For places close to the centre of the high, sea levels will be about 30cm lower than usual due to the air pressure pushing down on the water.
The high is forecast to travel across Tasmania on Saturday before moving into the Tasman Sea late Sunday.
For the latest forecasts and warnings visit http://www.bom.gov.au or the BOM Weather app.
Negative temperature anomalies in Europe.
https://i.ibb.co/NmJ2T9S/ventusky-temperature-anomaly-2m-20240705t0600.jpg
But don’t think Palmowski would ever tell us about 10+ anomalies in Russia!
Warming, you are not supposed even to exist.
Bindidon, please stop t-word-ing.
I’ve now banned our Aussie friend “Swenson” from commenting, mostly due to his repeated violations of my comment moderation rules.
Good for you.
Good for everyone.
Yup.
Thank you.
I’m probably not the only one who hopes that the blocking will not only be done at the email address level, but also based on the IP address, otherwise Swen*son aka Amazed aka Mike Flynn will soon reappear under a different nickname.
I think you’ll find your hope has been realised (times 2).
And then there was Clint …
Roy would benefit most from a genuine moderator, and an AI would be the most practical choice.
Doesn’t Youtube use AI? That doesn’t work too well.
My experience with AI to date has been that it depends how intelligently it is used. The initial experience was a big Wow, followed by disillusionment, followed by a big productivity boost once it settled in. As Dr. Roy works at a university, I’d guess that the opportunity to have some students set it up is there. I think it would be worth a try.
We have seen that just blocking words has little beneficial effect on the quality of conversation. I bet an AI could spot ankle-biting behaviour like svensdottir, given a bit of training.
> also based on the IP address
And then the Gods of the Internet created VPNs…
There’s no other way to moderate than to do it by hand. Curation is a duty anyway. According to WP terms, the owner is responsible for the comments on his website.
Banning “​” and “‌” (and perhaps other special character entities) would help. At least those who want to bypass moderation would have to own it explicitly, like when Mr. Asshat’s uses “ijit.”
Moderating the blog shouldn’t be that hard. All it takes is a good RSS reader. An easy task would be to “zamboni” the threads from Roy’s posts that are not global temps updates. They alone should be what we call “open threads.”
Closing comment threads after a while would also make it easier. There’s no reason to let Gill and Graham D. Warner prevaricate the way they do on that other thread.
Alright, enough chit chat. See you in July.
Indeed, Elliot. It seems quite straightforward to bypass bans on this site. Willard pointed out that the IP address block can simply be sidestepped with VIP status.
History suggests “Swe*nson” will return under a new alias and resume his previous behavior despite the ban. It’s only a matter of time.
Roy lacks the time to manage the blog alone, so we require a permanent moderator who can flag behaviors Roy finds objectionable, such as denying the greenhouse effect.
Ja Ja Ja Bindidork has been trying to become a moderator for years still no go
"Roy lacks the time to manage the blog alone, so we require a permanent moderator who can flag behaviors Roy finds objectionable, such as denying the greenhouse effect…"
…and do what, exactly? Once "flagged", are they to be flogged? Burn the heretics? Stamp out, silence, ban any opposition to the GHE?
Just silly. What’s wrong with questioning the GHE?
What’s wrong with people who question the GHE? Why exactly do they deserve so much hatred, bigotry, and intolerance?
“Whats wrong with people who question the GHE? Why exactly do they deserve so much hatred, bigotry, and intolerance?”
I couldn’t care less about their personal stance on the GHE. What bothers me, and I believe many others, is that a significant number of these individuals come here to disrupt discussions and target those who do support the GHE. Despite Roy’s repeated requests for them to leave, they continue to return.
Many of us would rather read meaningful conversations. As a moderator, why aren’t you living up to your name?
On the subject of climate change, I can’t think of a more “meaningful discussion” than whether or not there’s a GHE. Why shouldn’t it be discussed? Why are those who doubt there’s a GHE seen as the aggressors, anyway?
Why is it OK for a skeptic blog to be dominated by “alarmist” regulars, but those who question the GHE are persona non grata? Doesn’t actually make any sense, when you think about it. Oh well.
Graham D. Warner asks a question that has been answered at least a hundred times already:
https://tinyurl.com/roy-castigated-dragon-cranks
The “will remain for posterity” part is outdated.
So the reason is simple: Roy owns the blog. Meanwhile, it hasn’t gone unnoticed that Graham D. Warner just implied that Roy was an intolerant bigot. He (and soon Mr. Asshat when he’ll get his second drink) usually try to dodge that fairly basic point by pretending that they’re not Sky Dragon cranks. But everyone knows they are.
They deny the greenhouse effect. They have no theory to offer. They dominate the bandwidth.
Imagine. Graham D. Warner is still defending Puffman, a guy who has been banned multiple times by Roy.
His current victim playing has no merit at all.
Below, Little Willy trashes and ridicules Dr Spencer’s “lukewarm” position. Up here, he acts like he speaks for him.
And no, I didn’t imply Dr Spencer was an intolerant bigot. It was John W’s suggestion to get a moderator to “flag” GHE skepticism as a thought crime.
And so Graham D. Warner deflects once again. Here is where he expressed his opinion on moderation:
https://www.drroyspencer.com/2024/02/proof-that-the-spencer-christy-method-of-plotting-temperature-time-series-is-best/#comment-1635889
The “for posterity” bit did not age well.
So Roy has been indulging his fantasy of having some sort of control over people. And he’s “supressing freedom of expression.” Graham D. Warner also said other things about censors elsewhere. They’re consistently not complimentary.
Oh, and Mr. Asshat compared censors to Goebbels too!
DREMT,
“Why is it OK for a skeptic blog to be dominated by alarmist regulars, but those who question the GHE are persona non grata? Doesnt actually make any sense, when you think about it. Oh well.”
First off, you are misusing the word skeptic, as your clan refuses to examine the evidence for the greenhouse effect.
Those of you who have been banned, not because they deny the GHE, but because they are rude.
It’s just a game to you, with all your PSTing always having to have the last word, while not taking part in the discussions.
You can be polite and deny the GHE, why don’t you try it.
Dr. Roys Emergency Moderation Team,
What would you do if you were Roy?
Little Willy and bob fish for another ban. Sorry bob, but generally speaking you and Little Willy are a lot more rude than I am. I have my moments, same as everyone else, but generally you two are a lot worse.
John W, he does not need to do anything. The blog is great as it is, and long may it continue.
Graham D. Warner, forever the victim.
He could at least reflect on the fact that his own PSTering is involved. He could also reflect on the fact that his justification foe PSTering has no merit anymore. He could also reflect on the fact that Roy once asked him why he larped as his moderator.
No, he has to rip off his shirt once more. By the time he does he could have came up with at least two other names of luckwarmers. Three would be easy, but at least two would be fine.
“Graham D. Warner, forever the victim.”
Yup.
There’s more of the regular skeptics here who question the GHE to some extent than there are “lukewarmers”, that’s for sure. Meanwhile, there’s literally about twenty “alarmist” regulars. So, anyone trying to promote a narrative that there would be some “sophisticated discussion” between “lukewarmers” and “alarmists” that is being ruined by the GHE skeptics is definitely out of touch with the reality of this blog. Fact is, discussing the GHE is the reason this blog has so many comments and so much traffic. Also, it is popular due to the relaxed moderation.
DREMPTY,
You seem to have reading comprehension issues as I was not angling for a ban.
I was asking you to stop being rude.
X was the rudest of the lot, with no self control.
Graham D. Warner still rips off his shirt while pushing for a bogus argument.
There are five main Sky Dragon cranks, now four for a short while. There are more than five luckwarmers already. There will be more when Sky Dragon cranks will accept that they have been disinvited since 2013.
Not denying the greenhouse effect until one comes up with an alternative numerical model that accounts for the current warming. How hard can that be?
Most of the regular skeptics here question the GHE to some extent, Little Willy. And, there are far more “alarmist” regulars than skeptics, regardless.
I’m not being rude, bob. You and Little Willy are a lot more rude than I am.</p
And now Graham D. Warner tries to move Sky Dragon cranks under the umbrella of those who deny the greenhouse effect tO SOmE EXtEnT…
He might as well argue that the Pope of the Luckwarm church too denies the greenhouse effect, at least to some extent!
I said “to some extent” already, in my 7:26 AM comment to be precise. You must not have been paying attention again.
No, “lukewarmers” most definitely do not question the GHE to any extent. In fact, they defend it as staunchly as the “alarmists” do.
Those who deny that we could reach 5C by 2100 are denying the greenhouse effect, at least To SOmE eXTEnT…
All Graham D. Warner has is word games, and he’s not very good at them.
Sounds like your usual empty, hate-filled trash talk, Little Willy.
Graham D. Warner can’t even admit that his “to some extent” was mere weasel wording. Some, but not me, might argue that trying to weasel Sky Dragon cranks’ concerns on every page is what he does best.
I would rather argue that PSTering tops it all.
Speaking of which: will he continue?
If you say so, Little Willy.
Graham D. Warner kinda “forgot” to respond –
Will he continue PSTering people?
No idea.
Res ipsa loquitur.
OK, Little Willy.
DREMPTY,
“Im not being rude, bob. You and Little Willy are a lot more rude than I am.”
You have just admitted being rude, thank you.
I find your constant, or near constant PSTing to be rude, especially since you only do it to people who thing the GHE is real.
It is obvious you search the thread for me, and post PST
“he does not need to do anything. The blog is great as it is, and long may it continue.”
Well, that’s your opinion, but Roy (the blog owner) and most participants here would prefer less tro+lling.
I would prefer that too, John W. I politely ask them to stop, but they just won’t.
“Just silly. Whats wrong with questioning the GHE?
Whats wrong with people who question the GHE? Why exactly do they deserve so much hatred, bigotry, and intolerance?”
Nothing wrong with that, but if it doesn’t lead to learning the science properly, what good is it.
The science is all sorted, there is a GHE, whether or not if we can explain it to the likings of your cargo cult.
bob wants the last word, again.
DREMPTY,
“bob wants the last word, again.”
Do you have to gaslight me?
No, I don’t want the last word, if you noticed, I don’t respond to your PSTs anymore.
However, I would like you to explain your objections to the GHE.
If there are any that haven’t been refuted already, if you don’t have any new ones that haven’t been discussed to death already, by all means bring them up.
Or we can go over the same old same old again and again.
But I am afraid your cargo cult doesn’t have the technology to understand it, so you keep building airplanes out of vegetation.
See what I mean?
Yes, you want the last word more than you want to join the discussion.
Keep on proving me right, bob.
Much appreciated.
Thank you!
All hail the great Dr. Roy.
Very good , now fix the satellite tilled so it reads back to normal
Is English your first language? Because it seems the satellite is broken, and needs to have its soil ploughed, while making it literate in a right-to-left written language.
Poor old Mike. They broke the mould before they made him.
He certainly put you in your place a few times.
I particularly like this bit:
https://www.drroyspencer.com/2024/06/global-co2-emissions-are-tracking-well-below-the-climate-scenarios-used-to-scare-people/#comment-1676813
And this one too:
https://www.drroyspencer.com/2024/06/uah-upper-tropospheric-temperatures-corroborate-lt-temperature-trends/#comment-1676401
I actually use the extension. More beautiful pages. In-line images. Great so far.
You won’t actually use the “blocker” part of it though, Little Willy. That might mean someone you have taken a dislike to for no particular reason could get the last word, without you knowing!
If only Mike could have worded his prediction in a way that would prevent Graham D. Warner from trying to play another of his silly semantic games.
Speaking of whom, perhaps he could recall his own prediction regarding Elliott’s extension?
I think I said I don’t think many will use it. Maybe they will, as there’s some additional features besides the “blocker”. I can’t see many of the regulars here actually using the “blocker”, for the reason I mentioned to you, Little Willy. Too many old rivalries between the regulars. Blocking your old enemies out just means they will get the last word, without you knowing about it! Can’t see anyone going for that, the last word is too important for most people here, as the reaction to PSTs demonstrates.
[GRAHAM D. WARNER NOW] I don’t think many will use it.
[GRAHAM D. WARNER THEN]
https://www.drroyspencer.com/2024/06/uah-global-temperature-update-for-may-2024-0-90-deg-c/#comment-1674917
Perhaps Graham D. Warner is not the good person he thinks he is.
Yes, “as far as I know, nobody used it. Perhaps you will have more success, but probably not”. Though Elliott seems more persistent in his promotion and has offered additional features besides the “blocker”, so perhaps I will be proven wrong.
We can all bow to Graham D. Warner’s authority on persistence.
His prediction was wrong. He would have lost his bet had he made one. That’s about it.
Except for the “now that you have finished wasting all that time” bit. Elliott did not waste his time. To see that, install his extension and witness:
https://www.youtube.com/shorts/XT_0sn1Er7Q
If you say so, Little Willy.
Graham D. Warner kinda “forgot” to respond –
Will he continue PSTering people?
Wrong sub-thread, Little Willy.
Graham D. Warner’s official response merits to be shared:
“No idea.”
So Graham D. Warner has no idea if he will continue abusing Roy’s moderation policy!
The fishing for a ban continues.
Graham D. Warner’s personal vendetta continues.
I leave that sort of thing to you guys.
Why of course:
https://www.drroyspencer.com/2024/01/uah-global-temperature-update-for-december-2023-0-83-deg-c/#comment-1590480
Sometimes he’s just having a little fun. Other times duty calls.
Perhaps he could clarify what he means by “that’s not good” and “the price that must be paid”?
If Dr Spencer wants me to stop politely requesting that people stop doing that naughty thing that they do, I will. He only has to say.
That’s the kind of comment that shows beyond any reasonable doubt why no one should ever take Graham D. Warner seriously forever again.
He only has to say.
Any community that gets its laughs by pretending to be i d i o t s will eventually be flooded by actual i d i o t s who mistakenly believe that they’re in good company.
Thank you!
Oh, that’s a shame. Good commenter.
Apropos blessed silence, the latest Chromium version of the Tarderase plugin for this blog is submitted. Should be up in a couple of days, based on performance to date. I’ll get the Firefox version up ASAP. The current feature set is:
* Lets you mute simpletons. (Only from your own POV.)
* Displays inline images in place of links, including from Googol Drive. There is a problem with this on Bindidon’s browser which I cannot yet remedy.
* Allows you to select a list of authors and filter the blog to just their posts – meant to make it easier to track your interactions.
* Optionally shows a histogram of user activity.
* Allows you to open and collapse threads of activity.
* More features function in real-time, responding as you click.
* Popup window styled a bit more nicely with Bootstrap.
* Optionally changes the blog to a nice, sans-serif font.
I must say, in the few days I have been using the plugin, this blog has been a whole different place. More pictorial, and less plagued by ankle-biters who I can no longer see. All participation welcome.
P.S. That’s Version 1.3.0, I should mention.
Oh yes, and:
* Buttons added under the comment field to allow you to change a text selection to Bold, Italic and Block Quote or remove that style. I thought this would make it easier to format your posts.
Doesn’t muting some people mean you don’t understand what the rest are talking about half the time?
It does make the conversation a bit disjointed in some cases, yes. If you use it over a period of time, then interactions between you and the simpletons simply do not arise, which may mitigate the effect.
It’s up to each of you to decide how you want to deal with the tralls. My plugin adds some features which I think are useful, but I can’t tell you how to use the blog.
Thanks Elliott, I could do with muting at least one noxious participant.
A bit like a slightly more sophisticated version of putting your fingers in your ears and singing “la la la, I can’t hear you” as loud as you possibly can, but at least it’s only from your own POV. Harmless enough. Better than openly campaigning day after day to get specific people banned, whilst pretending you’re doing it for the good of the blog rather than your own personal vendetta.
Quick question: how many people identifying as “luke warmers” regularly contribute to the blog? Of the regulars here, I can only think of gbaikie…and even he goes for a climate sensitivity value that must call into question the GHE to some extent.
Cogent disagreement is welcome. Ill-informed sniping is tedious. I would mute at least one person because I can’t seem to help feeding the you-know-what.
What is a lukewarmer? Agrees with AGW, but thinks it will be mild?
A luckwarmer, as defined by its Arch-Bishop, i.e. Moshpit, is a bet under 3C for a doubling of CO2 in the atmosphere. So basically a hair under what the IPCC suggests. It is *not* defined by denial of climate sensitivity.
One could argue that the concept evolved over time. For instance, it does not preclude from alarmist claim such as:
https://3000quads.com/
That’s from Moshpit’s sidekick, whom tends to rip off his shirt in Climateball threads. Not unlike Graham D. Warner, who has a knack to project his own sociopathy unto otters.
A lukewarmer is someone who thinks CO2 emissions are responsible for some of the modest warming observed and in our climate that natural causes, such as climatic cycles, are responsible for most, if not all, of the warming.
I would add lukewarmer is someone who thinks CO2 absor*tion is saturated; GHE due to CO2 isn’t going to be a factor going forward.
That is about where my opinion lies too.
Corrected version
A lukewarmer is someone who thinks CO2 emissions are responsible for some of the modest warming observed in our climate and that natural causes, such as climatic cycles, are responsible for most, if not all, of the warming.
I would add lukewarmer is someone who thinks CO2 absor*tion is saturated; GHE due to CO2 isnt going to be a factor going forward.
That is about where my opinion lies too.
Perhaps I should preempt one forthcoming semantic game. The limit of what is usually considered a Luckwarmer is basically what Nic Lewis can find, so a central estimate around 2C. I call that the lowest bound of justified disingenuousness, with a tip of my hat to RyanO. An old discussion can be found here:
https://web.archive.org/web/20170429151100/http://www.climatedialogue.org/climate-sensitivity-and-transient-climate-response/
It should be noted that Nic’s work rests on an Energy Balance Model. So our beloved Sky Dragon cranks might wish to issue their usual caveat emptor. It should also be noted that this means Roy and Tim are luckwarmers.
Participants of this blog might appreciate the tone and the level of sophistication of discussions.
Ken,
The issue with the saturation argument is that it fails to account for the fact that the saturation effect of CO2 decreases with altitude. As the height of emission increases, the colder temperatures at higher altitudes result in slower emission of infrared radiation.
*** True. There is no such thing as atmospheric saturation of CO2 emission/absorption. Not even on Venus. It’s not just the altitude effect, but also the pressure broadening effect, with CO2 affecting broader ranges of wavelengths the lower in the atmosphere you are. -Roy
They don’t even know what a “lukewarmer” is! That says it all, really. Let’s face it, pretty much everyone that is skeptical of AGW on this blog (amongst the regulars, certainly) is at least somewhat skeptical of the GHE. It seems if you’re a regular here, you’re either a full-on “alarmist”, or you’re a GHE skeptic! So, what does Elliott want to do? Block out all the GHE skeptics so it’s just a bunch of “alarmists” agreeing with each other? What’s the point?
Oh, Tim S. There’s another “lukewarmer”. So, there’s two.
Graham D. Warner had one chance to make amends, and he fails it!
Here is proof:
https://judithcurry.com/2015/11/05/lukewarming/
This is not rocket science. Graham is trying to make Sky Dragon cranks relevant by trying to intimate that they belong in the luckwarm category. But since he’s a jackass, he can’t come out and *say* it. He has to resorts to a silly Socrates act.
To demonstrate what? That he is willing to relitigate every single point to the death instead of just accepting that he should pipe up from time time.
All wrong, Little Willy. I cross-posted with about three other people at once. As I was writing my last comment out, barry’s comment was the only one I could see. The rest hadn’t posted yet. Then when I posted my comment, there they were. So, I was responding to barry alone when I said that it seemed like they don’t even know what a “lukewarmer” is.
I’m not trying to lump GHE skeptics in with “lukewarmers”. My point is that this blog has hardly any “lukewarmer” regular commenters. So, there is Ken as well. I guess there’s possibly three, then? If Elliott wants to drown out all those who question the GHE, who will be left? Three “lukewarmers” and about twenty “alarmists”!
Graham D. Warner shows his immense reading skills again. Barry’s understanding of what is a Luckwarmer (“agrees with AGW, but thinks it will be mild”) is perfectly fine. His own understanding (“I can only think of gbaikie…and even he goes for a climate sensitivity value that must call into question the GHE to some extent”) is not.
Sometimes Gill self-identifies as a luckwarmer too. That does not mean much. These days he’s quite busy piling on with Graham on Nate, who calmly tries to reason with these two crooks.
And no, I wasn’t referring of TS, who’s basically this blog’s John G. Roberts. Mighty Tim is most probably a luckwarmer. He disagrees for instance that all the warming is caused by CO2. Which is true in a way, for it’s more than all the warming…
But I digress. The main reason why Sky Dragon cranks are unwelcome is because they’re cranks. They got no social skills.
John W
I like Happer and Wijngaarden paper that shows spectrum is saturated. They’ve done the math for spectral lines at all altitudes.
** No they don’t! People keep misrepresenting what they did in that study. They got the same broadband IR radiative forcing from 2XCO2 as others before them got. I verified this with Will Happer. See Table 3 in their paper: https://co2coalition.org/wp-content/uploads/2022/03/Infrared-Forcing-by-Greenhouse-Gases-2019-Revised-3-7-2022.pdf –Roy
Actually, Little Willy, I asked how many people identifying as “lukewarmers” contribute regularly to the blog. I happen to know that gbaikie has said he thinks of himself as a “lukewarmer”. So, he counts, regardless.
And yes, barry’s guess at what a “lukewarmer” is, was fine, but the point was, it was a guess. He didn’t actually even know what a “lukewarmer” was, as in he had apparently never heard the phrase before and so had to guess at it!
Are there many people identifying as “lukewarmers” posting here? No. Not regulars. They’re in the minority, for sure. Far more people skeptical of the GHE, to some extent, commenting regularly.
‘Luckwarmer’ is defined here as a boring arts program dropout (he can’t spell lukewarm) who thinks AGW is real and present threat because Steven Guilbeault, ex criminal and Canada’s minister of climate change, says so.
1.4C per doubling (the lowest W.A. can get, Bill is the rubberstamper here) is right under the limit of justified disingenuousness. And that’s notwithstanding the saturation argument. When it’ll get published somewhere else than the CO2 coALiTIoN, we’ll see.
Meanwhile, luckwarmers might consider that we’re already not far from that 1.4C. Since they really really really like to invoke “observations,” they might need to ponder on how to reconcile with what we’re currently observing. One day we will get out of our solar minimum…
Besides, a luckwarm sensitivity does not preclude very bad events from happening. It only postpone them by a few decades. Which means debates over sensitivity is utterly irrelevant from a geological standpoint.
The long and the short of it is that unless we get to net zero we will sooner or later reach what is projected by the most extreme RCPs.
And that’s the memo.
Oh, and of course I can spell “luckwarm”:
http://rabett.blogspot.com/2015/09/eli-explains-it-all.html
Incidentally, Moshpit is the art dept drop out, if one counts lichurchur as art. Also, Kennui is not very far from being a crank. If only he could drop the silly saturation argument…
“Meanwhile, luckwarmers might consider that were already not far from that 1.4C. Since they really really really like to invoke observations, they might need to ponder on how to reconcile with what were currently observing. One day we will get out of our solar minimum”
Why does a boring ‘luckwarmer’ thinks it wise to decide that 1.4C is some kind of threshold?
How did we get here? Observations of Climate Cycles. There is no artifact of CO2 in any climate data.
https://schillerinstitute.com/media/carl-otto-weiss-le-changement-climatique-est-du-a-des-cycles-naturels/
I am barely ‘lukewarm’.
> Why does a boring “luckwarmer” thinks it wise to decide that 1.4C is some kind of threshold?
Only publication decides the limits of justified disingenuousness. It’s really really really really hard to get under 2C with a reasonable model. It’s not like luckwarmers haven’t tried. The Pope of the Luckwarm Church could not even find a reviewer that would vouch for his 0.5C.
Think about what a so insensitive climate implies for a second. How can we explain the Medieval Warm Period?
Contrarians just don’t think beyond the talking point they consider. They’re unconstrained by consistency. If they want to take an active part in Team Science, they’ll have to work on that.
‘Think about what a so insensitive climate implies for a second. How can we explain the Medieval Warm Period?’
Medieval Warm Period is explained by climate cycles. See Carl Otto Weiss.
Climate is driven by the sun and moderated by ocean currents. Above 280 ppm, CO2 has only a small effect on climate; most of the modest warming in our climate is due to natural climate cycles. Doubling CO2 means GHE increase by 3Wm-2; too small to matter.
Low sensitivity may not help explain Otto’s cycles. It is called climate sensitivity, not just CO2 sensitivity. Any forcing would do.
If only Kennui could RTFR from time to time.
DREMT,
“I cross-posted with about three other people at once. As I was writing my last comment out, barry’s comment was the only one I could see.”
So you were replying only to me but wrote,
“They don’t even know what a ‘lukewarmer’ is!”
The term “lukewarmer” has been used in the blogosphere for about 15 years, and it doesn’t have a strict, codified definition. I well know what it generally means. I wanted you to be specific about what you meant by it.
Instead you gave a typically derisive, scattershot answer that makes Elliott’s extension quite appealing.
OK, barry. Sorry I somehow upset you with my response.
My point is, if you block out all of those skeptics who question the GHE to some extent, because you believe they are “tards” to be “erased”, that’s going to leave you with…an echo chamber of “alarmists” (I put that word in square quotes because I don’t really agree with the label, but assume you will generally know who I’m referring to). Maybe a few “lukewarmers” amongst the chattering throng of general agreement. I really don’t see the point.
And…why would a skeptic blog even be close to being an “alarmist” echo chamber, in the first place? Why exactly are so many of the regulars here of that…persuasion?
Cranks or alarmists. There is no other possibility in Graham D. Warner’s ontology.
Norman? Alarmist.
Binny? Alarmist.
Richard? Alarmist.
Unless they deny the greenhouse effect tO SoMe eXtENt…
Bindidon is most definitely “alarmist”, despite his protests.
If Norman is a “lukewarmer”, he never really fights any “lukewarm” battles. If I see him comment, it’s generally to defend the GHE in some way.
If RLH is a “lukewarmer”, I’m not sure why he linked to those YouTube videos that question the GHE, a while back.
At worst, maybe there’s a couple more “lukewarmers” than I thought.
And so Graham D. Warner will continue his silly word games as if his future among us depended on it.
The fact of the matter is that there most if not commentators are nearer Roy’s position than Sky Dragon cranks.
Anybody who does not deny the greenhouse effect is. No ifs, no buts. Certainly no tO somE eXtenTs!
If you say so, Little Willy.
‘It is called climate sensitivity, not just CO2 sensitivity. Any forcing would do.’
Actually its called ‘chaotic complex multifactor system’.
‘Climate sensitivity’ is actually rather low.
Technically speaking, there are two concepts at play.
First is CS:
https://en.wikipedia.org/wiki/Climate_sensitivity
So climate sensitivity is the amount of warming per radiative forcing, whatever that is. One could accept the greenhouse effect, the fact that there’s global warming (GW), a very high climate sensitivity, but deny that the global warming is anthropogenic (AGW).
Second is what is usually denoted by “climate sensitivity,” i.e. ECS:
https://www.ipcc.ch/report/ar6/wg1/downloads/report/IPCC_AR6_WGI_AnnexVII.pdf
There is also TCR, which is more related to what luckwarmers are usually inspecting. For some reason they always confuse ECS and TCR studies. And there is ESS, which they tend to ignore. For obvious reasons.
Without Sky Dragon cranks always dominating comment threads, contrarians could RTFR and git gud. But no, we have to babysit them instead.
Without what you call "sky dragon cranks", you’d have hardly anyone on here to talk to on "the other side" of the debate, Little Willy. Why do you keep pretending there would be some amazingly constructive and productive debate on climate change if only the "sky dragon cranks" would stop interfering? Aren’t you the one who created the idea of Climateball in the first place, strongly suggesting you think the entire debate is a game, or pointless, in any case?
Graham D. Warner keeps harping his inane argument. It has already been refuted. He’s wrong, but he’ll keep trying to make himself and other Sky Dragon cranks relevant anyway.
What’s the point?
There’s no point…if you have no counter-argument but to assert I’m wrong with no logic or evidence.
“My point is, if you block out all of those skeptics who question the GHE…”
That’s not what I am blocking out. Was I not clear the first time?
“Cogent disagreement is welcome. Ill-informed sniping is tedious. I would mute at least one person because I can’t seem to help feeding the you-know-what.”
You use the word “tard,” as if it’s a word I used. I said, “ill-informed sniping.”
The ratio of cogent, well-informed discussion to ridicule and game-playing is vanishingly small with one participant here. It’s annoying, and drags the discussion down to awful levels. If I could easily resist I would not consider using Elliott’s extension.
I’ve been too busy to participate much the last few months, and with time away, the sordidness of a lot of the discussion is more starkly obvious. It’s just very unpleasant. I have great discussions with people who disagree with me elsewhere.
It’s not about the difference of opinion, it’s about the quality of the conversation.
You and I have sometimes managed to do quite well here.
Graham D. Warner lingers on –
“if you have no counter-argument but to assert”
I already proved a counter-argument: there are more luckwarmers here than Sky Dragon cranks. He’s the one who asserts that there are no luckwarmers here. Many commenters here play home. Most of them are not Sky Dragon cranks.
It’s always the same formula with contrarians. First, they deny something. Second, when challenged, they request a sammich. Third, when they’re caught pants down, they keep saying stuff.
Suppose that there wouldn’t be for me any reason to comment here, say because he and Puffman and Mr Asshat stopped commenting. I’m sure everybody would rejoice of being rid of three of the most obnoxious cranks in the history of Climateball.
Thus his presumption falls flat on its face.
Besides, suppose that Sky Dragon cranks abided by Roy’s wishes and stopped denying the greenhouse effect without providing an alternative numerical model. Who gives a flying truck if they stay? It’s not because they’re Sky Dragon cranks that they’re disinvited, it’s because they keep relitigating the greenhouse effect empty handed.
It’s as if Graham D. Warner has never had any responsibility in his life.
“I already proved a counter-argument: there are more luckwarmers here than Sky Dragon cranks.”
You haven’t proved that. Not amongst the regulars here.
“He’s the one who asserts that there are no luckwarmers here”
False. I said there’s a few, but that there’s more regular commenters who question the GHE.
barry says:
“That’s not what I am blocking out. Was I not clear the first time?”
OK, then. It seems to be what some people want to block out. Like the person who created the program, Elliott.
“The ratio of cogent, well-informed discussion to ridicule and game-playing is vanishingly small with one participant here.”
Yes, and Little Willy just won’t stop.
“You haven’t proved that.”
Yes I did.
“Not amongst the regulars here.”
Yes I did.
“False.”
Incorrect.
“I said theres a few”
False.
“there’s more regular commenters”
False.
“OK, then.”
Graham D. Warner indirectly admits that his prediction was wrong.
Progress.
“Yes, and little Willy”
Misdirection.
OK, let’s just quickly settle this.
"Luke warmers":
gbaikie
Tim S
Ken
"GHE skeptics" (those who have questioned the GHE in their comments):
Swen.son
Clint R
Gordon Robertson
DREMT
Bill Hunter
Phil J
Ren
Christos Vournas
Stephen P Anderson
RLH
Little Willy loses another one.
Graham D. Warner keeps losing.
Counts a guy who just has been banned because he abused a silly HTML trick he himself uses.
Counts a guy who got banned multiple times.
Counts an asshat who’s being told off by the who has been banned multiple times.
Counts himself as if he was a third person. Here he is:
https://www.youtube.com/shorts/XT_0sn1Er7Q
The rest of his list shows he switches from “dominate thread after thread by denying the greenhouse effect” to “may have minimized the greenhouse effect at least one in their lives”:
One who calls himself a luckwarmer.
One who keeps pushing weather updates – no, not me, I’m counterbalancing his crap.
One who made less than 50 comments in the last year, mostly cryptic one-liners that can be ignored.
One who makes harmless drive-bys plugging to his own silly website.
One who mostly takes this website as Truth Social.
And another luckwarmer.
***
Meanwhile, I got: Roy, Mighty Tim, TS, Richard, Binny, Kennui, Norman, and Nate. Yeah, even Nate is somewhat of a luckwarmer. This ain’t a place were regulars sing Kumbaya. So after all these years, Graham D. Warner does not even realize that those who successfully defended this blog against our Dark Quatuor of Sky Dragon cranks are luckwarmers.
Not every luckwarmer chose that stratergery. As long as it helps stretch the Overton Windom for their Project-2025-like game plan, Kennui and Gill rather lick their chop.
And that’s just from the top of my head. Graham D. Warner’s silly test has no relevance whatsoever. Cranks don’t provide any real pushback. Even if there were 10 times less comments the blog would still be fine. In any event Roy expressed a wish that we stop disputing the greenhouse effect, and we should abide by his wish.
Worse is that he forgot Eboy. Let Graham D. Warner have him. Now, how much does Eboy help foster a healthy debate? He does not. He’s just here to piss off Binny and post weather pin ups when he feels horny.
Another premise from Graham D. Warner’s argument that falls on its face. It’s not the only one that is false: his take on alarmism is also wrong.
But at the end of the day it does not matter much because now Graham D. Warner has found himself a way to distract himself from his own responsibility behind Mike Flynn’s ban.
***
If Graham D. Warner stops responding, this might be my farewell until the end of July. Let’s see how much he’d like that.
“You and I have sometimes managed to do quite well here.“
Yes, that’s true. We’ve managed to work around the t-words that keep constantly butting in, and actually had some good discussions.
I added a quick bug-fix in version 1.3.1. The Bold/Italic/Block-quote buttons should now function correctly. A last-minute refactoring and failure to test properly led to an element of upfucking, as we say in the trade, and the buttons remained disabled even when you selected text. Should all work now.
I tried it the other day. Seems pretty good, in fairness, but I wouldn’t use the “blocking” feature personally, which is the main point of it. The other features are worthwhile, though. Keep adding to it, I’d say [the irony is you won’t even see this comment since you’ve decided I’m a “turd” and a “tard”].
It is likely that Beryl will make landfall over Houston before dawn on July 8.
https://i.ibb.co/Dzj2K8T/ventusky-rain-3h-20240708t1200-29n95w.jpg
Hi, Gordon, I would like to discuss with you the followiing:
“The Temperature Amplification leads to what Hansen called a tipping point, meaning the exponential increase of signal per iteration will eventually run away to infinity.”
“Anyone who think climate models are anywhere near accurate lacks the scientific ability to understand why they are not. There are two main problems. The amount of CO2 warming programmed into them is 9% to 25% whereas the actual value according to the Ideal Gas Law and the heat diffusion equation is 0.06%.”
–
–
I think the increase of signal is not exponential, and it is limited, it never runs away to infinity.
Let’s estimate the increase of signal per iteration:
The first iteration, then the second iteration, then etc. … then towards the infinite iteration…
Example, let’s assume the Earth’s surface emits ” 240 W/m^2 ” IR outgoing EM energy.
1st iteration = 240 W/m^2 + 240*0,0006 W/m^2
2nd iteration = 240 + 240*0,0006 + (240 + 240*0,0006 )*0,0006
3d iteration = 240 + 240*0,0006 + (240 + 240*0,0006 )*0,0006 +
+ [240 + 240*0,0006 + (240 + 240*0,0006 )*0,0006]*0,0006
there are not infinite iterations, because there is the succession of day and night, and every day it starts all over again.
Consequently there is not any exponential increase in Greenhouse Effect.
https://www.cristos-vournas.com
Christos…sorry if I mislead you. I don’t think positive feedback can exist in the atmosphere.
By iterations, I was referring to one cycle of an an electronic amplifier. I was trying to demonstrate positive feedback in an amplifier and why it needs an amplifier. A basic Class A amplifier is set up so a small signal introduced at the input varies a larger current supplied to the output circuit.
If you consider an NPN transistor, in a Class A configuration, the emitter is common to the base and the collector. The input signal is applied between the emitter and base and the output signal is taken from the larger current circuit involving emitter and collector.
The idea is that a small a/c signal applied to the input varies the impedance between emitter and collector. It is similar to a variable resistor across a power supply that can deliver much more current than runs through the input circuit. By placing a resistor in the collector circuit, the increase current through the emitter-collector produces a larger voltage across that load resistor, and that larger voltage represents the amplified signal.
If a small signal sine wave is applied to the input of a Class A amplifier, the entire signal will be transferred to the output as an amplified version. However, the signal will be inverted. Feedback affects the output signal by simply making the input signal slightly larger or slightly smaller. Therefore, the output signal will be slightly larger or slightly smaller each iteration.
However, with PF, a constant amplitude input signal gets larger each iteration therefore the output signal gets slightly larger, without bound, each iteration.
Positive feedback is normally undesirable in amplifiers for that reason. It makes the amplifier unstable, hence unusable. When it is used, mainly in oscillators, only a small spike of PF is used per iteration to replace the losses in an oscillatory circuit, such as an LC tank. Note that such feedback is not fed directly to the input but to another circuit in the input stage.
An LC tank is an inductor (L) in parallel with a capacitor (C). Such a circuit, when given a pulse of voltage will oscillate naturally at a frequency determined by the L and C values. However, it will quickly die off due to damping effects and circuit resistance. By inserting the LC tank in the emitter-base circuit of an amplifier, and feeding a spike of voltage back to the tank from the output, the oscillation can be sustained. That is the positive feedback signal is only enough to replace any lost energy in the tank. The resulting output signal is one with constant amplitude and constant frequency.
Feedback is actually a very simply arrangement of resistors and/or capacitor That take a certain amount of amplified output signal and feed it back to the input. The feedback signal can enhance the input signal (positive feedback) or subtract from it (negative feedback).
That’s it!!! Feedback does not amplify it merely helps control amplification in a small way. In the atmosphere, there is no heat amplifier hence no positive feedback that can affect warming.
***WITHOUT AN AMPLIFIER, POSITIVE FEEDBACK CANNOT EXIST IN THE ATMOSPHERE***.
Therefore speaking of positive feedback processes in the atmosphere is sheer pseudo-science. I have already pointed out that a servo-type feedback is possible, but there is no amplification in such a processes.
Moral…you can’t get something for nothing.
Mind you, there are exceptions but they have nothing to do with the atmosphere per se. The Seattle-Tacoma Bridge, a suspension bridge supported with strong cables, came under the influence of a sustained wind that caused the cables to vibrate. That vibration produced a resonance in the bridge deck that caused the bridge to break up and collapse.
Natural resonance can produce a a slight amplification, as in an acoustic guitar, but there is nothing in the atmosphere that can resonate or produce an amplified positive feedback effect. Therefore, Hansen’s tipping point theory is pseudo-science.
Thank you, Gordon.
“Natural resonance can product a slight amplification, as in an acoustic guitar, but there is nothing in the atmosphere that can resonate or produce an amplified positive feedback effect. Therefore, Hansen’s tipping point theory is pseudo-science.”
(Emphasis added)
–
https://www.cristos-vournas.com
Gordo continues his semantic confusion, insisting that a system can only exhibit “amplification” when there is an
“amplifier” which adds energy within said system. He ignores two processes within the climate system which produce positive feedback, that is to say, their effects increase as temperature increases. The highly non-linear water vapor feedback is one such process, another is the snow and ice albedo feedback.
Gordo doesn’t “do science”, so he can’t think outside his electrical world box
When Jimmy put his guitar near his amp, the output of the amp caused both the strings to vibrate more, as well as directly causing the pickups to increase their output. This makes the amp produce more sound.
Increase the temperature of the Earth, then there is more water vapor in the atmosphere which increases the GHE, which makes more water vapor in the atmosphere, which increases the temperature of the Earth.
And so on and so on.
bobdroege,
“Increase the temperature of the Earth, then there is more water vapor in the atmosphere which increases the GHE, which makes more water vapor in the atmosphere, which increases the temperature of the Earth.
And so on and so on.”
The increase will be very small, because Earth’s atmosphere is a thin atmosphere.
The greenhouse gasses are trace gasses in Earth’s thin atmosphere.
–
https://www.cristos-vournas.com
Yes it’s a small increase in temperature, so far about 0.3%.
Would you like to see a 1% increase in temperature?
I wouldn’t.
A 2% increase would be, as we say in the Midwest, Katie bar the door.
bobdroege, please stop t-word-ing.
Two tropical waves are now merging over Yucatn.
https://i.ibb.co/XbWPBkJ/pobrane.png
https://i.ibb.co/qdTFMD9/goes16-ir-02-L-202407051607.gif
–Willard says:
July 4, 2024 at 7:54 PM
Almost like Mars.
Nows your cue.–
Mars is called a cold desert like world. The desert ground is cold, but vacuum air above it, has no temperature. The top surface of the Moon is on average much colder than Mars, but at 1 meter depth, The lunar ground is warmer than Mars. At 1 meter depth, the lunar ground is about -40 C, though in small permanently shadowed areas of lunar polar region it can be about 50 K [-223.15 C].
With moon and Mars there is no air temperature, and with spacesuit, it requires refrigeration {one can evaporate water, and don’t need much water to keep cool enough, with Mars one might need more water to keep you cool enough. So for intelligent humans, the Moon or Mars isn’t warm or cold, and requires little energy, to maintain a comfortable temperature for humans or the life that human might bring.
This Venus quesstion is academically amusing, but has nothing to do with earth. The molecular density of CO2 on Venus is 150,000 times greater than on earth. If anyone wants the calculation just ask.
From scratch it is this easy. Data:
Surface Gravity – 0.904 earth g
Surface Pressure – 95 atm
CO2 Mole Weight – 44
Earth Weighted Average Mole Weight – 29
Venus Atmosphere Composition – 96.5% CO2
Earth Atmosphere Composition – 0.00042% – CO2
Calcualtion:
95 x 0.904 x 0.965 x 29 / 44 / 0.00042 = 130,050
Okay, so the precise calculation is a bit less than the back-of-the-envelope in my head, but I was pretty close.
Okay, I see my mistake. The gravity effect changes the calculation for the amount of CO2 on Venus versus Earth . The atmosphere has less effect on surface pressure on Venus than Earth because of the lower g value.
New Calculation:
95 x 0.965 x 29 / 0.904 / 44 / 0.00042 = 159,140
CO2 is a weak greenhouse gas. It’s the not major “greenhouse gas” on Venus. It’s the acid clouds.
Some will say Earth clouds are greenhouse gas. Earth clouds are more reflective than Venus clouds.
Some say CO2 causes earth to absorb more sunlight energy.
Venus absorbs very little sunlight compared to Earth, if replace the acid clouds with water clouds, Venus would absorb, less sunlight.
And it should be noted that if add water to the acid clouds of Venus, it would produce a lot of heat. Or water would be very explosive to add that strong acid.
Anyways, that acid is quite valuable. It’s major acid we make lot on Earth- useful.
And like anything explosive, you make rocket fuel from it.
gb…talk about acid rain. Not a good spot for a vacation in your new SUV.
Except the rain on Venus never reaches the ground.
The Soviets explored Venus, a bit, the US, not very much other global radar to map it’s rocky surface. It’s kind of unexplored like our oceans, which aren’t good with SUVs, either.
At the present we got to explore the lunar polar regions, though should finished doing that a couple decades ago.
In terms of NASA road map of exploring lunar polar region [to determine if there is mineable lunar water, and then send crew to Mars surface; the relationship with Venus to this roadmap is Venus orbit allows more access to getting and leaving from Mars.
And if we use Venus orbit, there will be more exploration of the planet Venus- we hardly know anything about Venus {the nearest and quickest planet to reach from Earth}.
“CO2 is a weak greenhouse gas. It’s the not major “greenhouse gas” on Venus. It’s the acid clouds.”
Sulphuric acid peak absorp.tion is in the ultraviolet range, and thus isn’t “greenhouse gas” on Venus, which emits in the infrared.
“bobdroege says:
July 6, 2024 at 10:08 AM
Except the rain on Venus never reaches the ground.”
The much, much stronger than battery acid rain, would dissolve the surface of Venus, and not exist anymore if it could reach the ground.
If it could reach the ground, Venus would cool significantly.
And this is part of why, if you dumped water {a significant greenhouse gas, as compared to CO2] Venus would cool, significantly.
If we are a spacefaring civilization we will mine, Earth’s ocean amount of water, and the water will be cheaper than Earth water, we could cool Venus to be colder than Earth.
But in sense, it’s already colder than Earth.
Sorry barry, but you’re wrong again.
Sulfuric acid’s “peak” absorp.tion” is NOT in the ultraviolet range. And a “greenhouse gas” (absurdly named, BTW) is ANY gas that absorbs infrared.
Got those Venus energy flows worked out yet?
Clint,
“Sulfuric acid’s “peak” absorp.tion is NOT in the ultraviolet range.”
Yes it is.
https://pubchem.ncbi.nlm.nih.gov/compound/Sulfuric-Acid#section=Spectral-Information&fullscreen=true
The sulphur clouds are situated 30km above the surface. CO2 absorbs the bulk of the upwelling infrared at Venus temperatures. The sulphuric acid clouds keep out far more solar radiation energy than they absorb surface radiation, and so function oppositely to GHGs.
You are interminably wrong about things, and apparently shameless about it.
Nobody is going to live in bottom of our Ocean- the pressure is the problem. Some {if there is market for it} could live in some deep parts of ocean, as a solution to the pressure problem. Or if living at high pressure, 90 atm is high, operating at 150 atm, is less hard.
Or living at 90, makes easier to go to +100 atm.
But no sense to live on Venus at 90 atm. Better to live in .5 atm.
No temperature problem, and less problem going to Venus orbit. And you do 18th century sailing in the sky.
From somewhere up above:
“2/ The microwave emission of Venus could only be accounted for by a hot surface maintained by the greenhouse effect ”
What a ridiculous statement.
The temperature of Venus surface is easily explained by its lack of water to cool the surface, and thick sulphuric acid clouds absorbing (and remitting to space) all of the solar input
Venus is heated in upper atmosphere, around 50 Km.
If got twice as much sunlight as Earth, and atmosphere is mostly heated at 50 Km up, O Km up, is going to be hot due to lapse rate.
Or if there was big hole on Earth which was not filled with water, but air, 5 km below sea level hole, would be hot.
Venus not 50 km down, is not hot, it’s cold.
But Earth at Venus distance, would be warmer.
We couldn’t be in an Ice Age.
Little holes in the sky:
“WATCH FIREFLY PUNCH A HOLE IN THE IONOSPHERE: When Firefly Aerospace’s Alpha rocket launched from Vandenberg Space Force Base in California on July 3rd, astronomer David Blanchard of Flagstaff, Arizona, thought he might be too far away to see. ”
https://www.spaceweather.com/
“The lingering red glow in Blanchard’s movie is “the hole.” Earth’s ionosphere is a layer of electrically-conducting gas enveloping our planet more than 100 km high. It plays a key role in shortwave radio communications and GPS positioning. When Alpha burned through the ionosphere, water and carbon dioxide in the rocket’s exhaust quenched local ionization by as much as 70%. Red light is the afterglow of this process. …
“No harm done? Probably. But with launch rates continuing to climb, we are entering uncharted territory. Observers are encouraged to photograph nighttime launches and check their images for the telltale red glow. There may be much to learn.
Note: Human eyes are notoriously insensitive to the 6300 color of these holes. Cameras have no trouble, though. “Neither my wife nor I could see the red ‘rocket aurora’ in real time,” notes Blanchard. “But it showed up well in the images.”
Well, there would more excitement if humans weren’t effectively, blind. AI will see them all.
Only 10% of sunlight reaches Venus’ surface – the rest is reflected/re-emitted by those same, thick clouds. It’s why Venus shines so brightly in the night sky – it has a bond albedo of 0.77 – more than twice that of Earth.
Consider – Mercury’s average surface temperature is cooler than Venus’, and Mercury has virtually no atmosphere with a bond albedo of 0.14.
How could Venus be hotter than Mercury when it’s twice the distance from the sun and 5 times more reflective?
Because of the very strong greenhouse effect in its dense atmosphere.
“The temperature of Venus surface is easily explained by its lack of water to cool the surface”
The temperature of a terrestrial planet is determined by the amount of sunlight it receives and the rate at which that energy is radiated away.
Sorry barry, but your beliefs don’t match reality. With Venus, you’re WAY off.
The surface of Venus is over 800F. The high temperature is caused by vulcanism. You don’t seriously believe CO2 can cause such temperatures, do you?
Venus distance gets about 2600 watts per square meter.
10% is 260 watts per square meter. Mars gets about 600 watts. Germany in winter gets around 260 watts, or Scotland, or most of Canada, Iceland, etc- they more in the summer. Or very cloudy [when your world is dark] gets about 200 watts.
Venus gets none in winter or since it doesn’t much in terms of season- anywhere close to polar regions.
But in polar regions even at high elevation you are in darkness.
No stars [or moon].
Venus on it’s land surface, is much worse than Earth for solar power, but in right places and living in the sky, it can be much better than Earth.
Hello barry,
“How could Venus be hotter than Mercury when its twice the distance from the sun and 5 times more reflective?
”
Hmm. Maybe because it’s much more massive and hasn’t cooled as much as Mrrcury?
“Because of the very strong greenhouse effect in its dense atmosphere.”
Lol. That’s all geothermal energy my friend
“The temperature of a terrestrial planet is determined by the amount of sunlight it receives and the rate it is radiated away.”
Hogwash, the amount of sunlight it receives will tell you the limit it will cool to, after it has lost all its atmosphere..
15 doubling of CO2 concentration from what preindustrial Earth to present day concentration on Venus.
The winds at the middle cloud layer are a couple hundred miles per hour.
The axial tilt is 2 degrees.
So the weather is always the same cloudy, light winds, and hot.
Here is where this belongs. I am having a bad day. With the now correct data and necessary corrections for mole weight and gravity:
This Venus question is academically amusing, but has nothing to do with earth. The molecular density of CO2 on Venus is 154,100 times greater than on earth. Here is the Data for Venus:
Surface Gravity 0.904 earth g
Surface Pressure 92 atm
CO2 Mole Weight 44
Earth Weighted Average Mole Weight 29
Venus Atmosphere Composition 96.5% CO2
Earth Atmosphere Composition 0.00042% CO2
Calculation:
92 x 0.965 x 29 / 0.904 / 44 / 0.00042 = 154,100
“Hmm. Maybe because it’s much more massive and hasn’t cooled as much as Mrrcury?”
It’s the same size and age as Earth.
Before Venus was probed, scientists imagined it to have a tropical, hot surface temperature, not too much different from Earth.
A young scientist called Carl Sagan theorised that Venus’ surface would be much hotter because of its high CO2 concentration. His predicted high temperatures were shortly verified with the first probe of Venus.
Hello barry,
“Its the same size and age as Earth.”
Indeed it is. And thus started with approximately the same amount of volatile as Earth.
3 major factors changed the development of their atmospheres.
1. Distance from the sun
2. Rain reaching the surface
3. Life providing an abundant source of o2
#1 is part of the reason for #2, the atmosphere not cooling rapidly enough on Venus for rain to reach and cool its surface.
It’s surface therefore remained hot and thin with much overturning and outgrowing.
I suspect Venus has very little volatiles left to outgas and it’s interior, now much cooler than the Earth, is perhaps already beginning to congeal into a solid lump like Mercury.
When the sun has finished cooking off its water and it’s induced magnetic field collapses, I expect the solar wind will quickly blow the rest of its atmosphere away.
‘Outgrowing’ should read outgassing
barry is back, and as usual, he didn’t learn. Venus is very hot because of vulcanism. There is even lava on the surface!
This is not to pick on poor barry, but he’s a perfect example of the cult’s indoctrination. Not only do they not understand the science, they often don’t even understand their cult’s teachings. Here’s an example:
barry says: “Only 10% of sunlight reaches Venus’ surface — the rest is reflected/re-emitted by those same, thick clouds. It’s why Venus shines so brightly in the night sky — it has a bond albedo of 0.77 — more than twice that of Earth.”
A lot of confusion in only two sentences.
Venus receives 2600 W/m² from Sun. 10% of that would be 260 W/m². But barry states the albedo is 0.77, which means Venus would get 23% of solar, resulting in 598 W/m².
barry must somehow believe 598 = 260?
But, it gets worse….
The cult believes you must adjust solar for albedo, divide by 4, then adjust for albedo again. Doing all that for Venus —
Adjust for albedo: 2600 * 0.23 = 598
Divide by 4: 598/4 = 149.5
Adjust for albedo: 149.5 * 0.23 = 34 W/m²
So, according to barry’s cult, Venus surface only receives 34 W/m² from Sun.
So many things wrong, that’s why it’s nonsense.
How about reading what I wrote properly.
“Only 10% of sunlight reaches Venus’ surface the rest is reflected/re-emitted”
Albedo reflects most of the sunlight. Some of it is absorbed by the atmosphere and re-emitted in all directions (including spaceward). Approx 10% of sunlight gets to the surface.
You couldn’t even get through the first sentence properly, Clint.
Time waster.
barry, I showed the various ways to calculate what reaches the surface. Please indicate the value you believe in. If you don’t agree with any, please show us YOUR calculations.
“surface the rest is reflected/re-emitted
Albedo reflects most of the sunlight. Some of it is absorbed by the atmosphere and re-emitted in all directions (including spaceward). ”
And of course the amount of energy emitted spacewards (including of course mass loss)will be greater than the amount absorbed by the sun as the 2lot demands
Imagine if you were right every single second since the beginnings of times, Phil.
Hello Willard,
“Imagine if you were right every single second since the beginnings of times
If you are referring to the 2LoT, yes it has been true since the beginning of time, hence the word ‘Law’
The 10% of sunlight that gets through the atmosphere is daytime sunlight, not divided over the whole globe.
Clint says:
“The high temperature is caused by vulcanism.”
No one knows how much volcanic activity is occurring on Venus. There is no solid basis for what is pure assertion on your part.
You just make stuff up as you go along.
“You don’t seriously believe CO2 can cause such temperatures, do you?”
I rely on the consensus view of experts, not cranks who posit notions that are easily and regularly debunked.
barry, you didn’t answer. You messed up, but you can’t clean up your mess.
So now you’re spewing false accusations.
You’re such a good cultist.
“No one knows how much volcanic activity is occurring on Venus.”
Hello Berry,
Actually observations show next to no volcanic activity on Venus, but there us evidence of a vast overturning of its surface as little as 650 million years ago
Dear Phil,
You say –
“If you are referring to the 2LoT”
No, I’m not.
Please try again.
https://en.wikipedia.org/wiki/Venus
Op. Cit.
“Venus may have had liquid surface water early in its history with a habitable environment,”
bwahahaha
talk about anthropocentric blinders
https://y.yarn.co/072f45ee-7221-494a-9eda-38133aedec4e.mp4
“Lol. Thats all geothermal energy my friend”
The usual shamelessly made up ‘facts’.
Where is your evidence Phil J or Clint?
Don’t bother, we know you don’t have any.
Here child Nate, I’ll spoon feed you again:
https://www.drroyspencer.com/2024/07/uah-global-temperature-update-for-june-2024-0-80-deg-c/#comment-1678036
But you may need a responsible adult to explain it to you.
Clint,
Why do you factor in albedo twice?
So glad you noticed that, bob.
That’s some of the nonsense your cult uses. Study your cult’s bogus “Energy Balance” chart, that claims flux is energy and reduces solar to less than 170 W/m².
Clint,
The way you copy other people’s work is wrong.
In the energy budget diagram, they don’t use the same albedo twice.
“Several lines of evidence point to ongoing volcanic activity on Venus.”
Same can be said for Earth!
So, Clint, that how does that become ‘The high temperature is CAUSED BY vulcanism.” in your feeble mind?
Meanwhile calculated warming due to its GHE show a huge effect..just like what is observed.
Hello Nate,
“Where is your evidence Phil J ”
My evidence for what Nate?
The second law of thermodynamics demands that a planet must shed all of the solar input it receives plus some measure of its own internal heat as long as it has colder surroundings. That’s basic physics.
The Venus Express measured Venus’ atmosphere loss down its magnetotail and found H and O in a 2:1 ratio… (that’s water)
Venus has been cooking off its water for billions of years.. not much left now..
Some selected common old wives tales, from Wikipedia and fully sourced, in 4 parts.
Part I
(1) ADIDAS means “All day I dream about sex”
(2) “AR” in AR-15 stands for “assault rifle”
(3) The image of Santa Claus was created by Coca Cola
(4) Braising meat adds moisture
(5) Mussels and clams that do not open when cooked are not safe to eat
(6) “Sushi” means raw seafood
(7) Marco Polo introduced pasta to Italy from China
(8) Fortune cookies come from China
(9) Microwave ovens cook meat from inside out
(10) The Wizard of Oz was the first colour film
(11) It is not permissible to end a sentence with a preposition
(12) “Crap” comes from Thomas Crapper
(13) “Rule of thumb” comes from an English law allowing a man to beat his wife with a stick no thicker than his thumb
(14) The word “the” used to be pronounced ‘ye’
(15) Xmas originated as a secular plan to “take Christ out of Christmas”
(16) You must wait 24 hours before reporting a person missing
(17) The ‘nuclear football’ contains a large red button to launch a nuclear attack
(18) Last meal requests must be granted
(19) Crime rates in the US have increased in the last 30 years
(20) Undocumented immigrants in the US have higher crime rates than US-born citizens
(21) The first amendment of the US constitution guarantees freedom of speech
(22) The Mafia regularly use cement shoes to drown their victims
(23) A US defendant will have their case dismissed if they are not read their Miranda rights
(24) Mozart was poisoned by Salieri
(25) Listening to Mozart enhances IQ
(26) Edelweiss is the national anthem of Austria
(27) Mama Cass died from choking on a ham sandwich
(28) The Buddha was fat
(29) Jesus was born on December 25
(30) Mary Magdelene was a prostitute
(31) Members of the LDS church still practise polygamy
(32) The books of the bible were established by the First Council of Nicaea
(33) Constantine made Christianity the official religion of the Roman Empire
(34) The Quran promise martyrs 72 virgins in heaven
(35) The forbidden fruit was an apple
(36) Golf is an acronym for “Gentlemen Only, Ladies Forbidden”
(37) Baseball was invented by Abner Doubleday
(38) The Egyptian Pyramids were constructed with slave labour
(39) Tutankhamun’s tomb is inscribed with a curse on those who disturb it
(40) The Minoan civilization was destroyed by the eruption of Thera
Part II
(41) The “Roman salute” was used in ancient Rome
(42) Julius Caesar was born via caesarean section
(43) Viking warriors wore horns on their helmets
(44) Vikings drank out of the skulls of vanquished enemies
(45) Medieval European scholars believed the Earth was flat
(46) Christopher Columbus was the first European to visit the Americas
(47) People accused of witchcraft were burned at the stake during the Salem witch trials
(48) Marie Antoinette said “let them eat cake”
(49) George Washington had wooden teeth
(50) The US Declaration of Independence was signed on July 4
(51) There was a bill to make German the official language of the United States that was defeated by one vote
(52) The nose of the Great Sphinx of Giza was shot off by Napoleon’s troops
(53) Einstein failed mathematics classes in school
(54) The Nazis referred to themselves as Nazis
(55) All skinheads are white supremacists
(56) Abraham Lincoln wrote his Gettysburg Address speech on the back of an envelope
(57) The Great Chicago Fire of 1871 was caused by Mrs O’Leary’s cow kicking over a lantern
(58) Prohibition made drinking alcohol illegal in the United States
(59) There was widespread outbreak of panic across the United States in response to The War of the Worlds radio play
(60) Women burned their bras outside the Miss America contest in 1969 as a protest in support of women’s liberation
(61) Astronauts in orbit are weightless because they are outside the gravitation pull of the earth
(62) The Dark Side of the Moon receives less sunlight than the near side
(63) Seasons are caused by one hemisphere being closer to the sun than the other
(64) Velcro and Teflon were spinoffs from technology developed by NASA
(65) The sun is yellow
(66) Elephants near death leave their herd to die in an ‘Elephant’s graveyard’
(67) Bulls are enraged by the colour red
(68) Lemmings engage in mass suicide by diving off cliffs
(69) Wolves howl at the Moon
(70) Bats are blind
(71) The memory span of goldfish is a few seconds
(72) Sharks don’t get cancer
(73) Snake jaws can unhinge
(74) Tomato sauce neutralises skunk odour
(75) Porcupines can shoot their quills
(76) Mice have a special liking for cheese
(77) Touching or handling eggs or baby birds will cause the adult birds to abandon them
(78) Ostriches stick their heads in the sand to hide from enemies or to sleep
(79) A chameleon can change its skin colour to match any background
(80) Rabbits have a special liking for carrots
Part III
(81) Houseflies have an average lifespan of 24 hours
(82) People swallow a large numbers of spiders while sleeping
(83) Aerodynamic theory predicts that bumblebees should not be able to fly
(84) Bees always die if they use their sting
(85) Termites are closely related to ants
(86) Applying urine to jellyfish stings relieves pain
(87) Sunflowers always point to the Sun
(88) Mushrooms are plants
(89) The word ‘theory’ in “the theory of evolution” implies scientific doubt regarding its validity
(90) The theory of evolution attempts to explain the origin of life
(91) Evolution is a progression from inferior to superior organisms
(92) All dinosaurs are extinct
(93) Fossil fuels originate from dinosaur fossils
(94) Humans are distinct from animals
(95) Diamonds are compressed coal
(96) There is a special compound which is added to swimming pools to detect urine
(97) Lead pencils contain lead
(98) Chrome’s “Incognito Mode” protects users from being tracked
(99) Increasing your gross income past a tax threshold can reduce your net income
(100) Contemporary global warming is not driven by human activities
(101) Global warming is caused by the hole in the ozone layer
(102) Nuclear power results in more deaths per MWh than conventional energy sources
(103) Scientists still use the Richter scale to measure earthquakes
(104) Lightning never strikes the same place twice
(105) The Yellowstone Caldera is “overdue” for a supervolcano eruption
(106) The Amazon rainforest produces 20% of the world’s oxygen
(107) The Cape of Good Hope is the southern tip of Africa
(108) The majority of the Sahara consists of sand
(109) Waking up a sleepwalker harms them
(110) Seizures can cause a person to swallow their own tongue
(111) Human blood in veins is blue
(112) Half of body heat is lost through the head
(113) Women have more ribs than men
(114) 98.6F is the ‘normal’ or average temperature of the human body
(115) Fish oil can cure dementia
(116) Vitamin C is effective in preventing or treating colds
(117) Humans can catch warts from toads (or other animals)
(118) Cracking one’s knuckles can cause osteoarthritis
(119) Powdered rhinoceros horn is used as an aphrodisiac in traditional Chinese medicine
(120) Leprosy causes body parts to fall off
Part IV
(121) Rust causes tetanus
(122) Reading in dim light causes permanent damage to the eye
(123) “Detoxification diets” rid the body of toxins
(124) Drinking milk increase mucus production
(125) Sugar causes hyperactivity in children
(126) Swallowed chewing gum takes seven years to digest
(127) MSG triggers migraines
(128) Beta carotene in carrots enhances night vision
(129) Spinach is the best source of dietary iron
(130) Alcoholic beverages make the body warmer
(131) You can get pregnant from semen in swimming pools
(132) Hand and foot size correlate with penis size
(133) Children of first cousins are twice as likely to be born with defects
(134) Sex before sport reduces performance
(135) The G-spot
(136) The menstrual cycles of people who live together tend to synchronize
(137) Hair and fingernails continue to grow after death
(138) Shaving causes hair to grow back thicker
(139) Redheads and blondes will soon become extinct
(140) Dandruff is caused by poor hygiene
(141) James Watt invented the steam engine
(142) Joseph-Ignace Guillotin invented (or was killed by) the guillotine
(143) Thomas Crapper invented the flush toilet
(144) Thomas Edison invented the light bulb
(145) Henry Ford invented the automobile and the assembly line
(146) Al Gore said that he had “invented” the Internet
(147) Pythagoras discovered Pythagorean theorem
(148) The p-value is the probability that the null hypothesis is true (or the probability that the alternative hypothesis is false)
(149) Flipping 5 heads in a row increases the chance that the next flip will be tails
(150) Toilets drain in opposite directions in each hemisphere
(151) A penny dropped from the Empire State Building would kill a person or crack the sidewalk
(152) It is possible for a person to completely submerge in quicksand
(153) Vaccines cause autism
(154) Dyslexia involves reading letters and words backwards
(155) Humans generate all of the brain cells they will ever have by the age of two years
(156) People use only 10% of their brains
(157) There are four primary tastes
(158) A chloroform-soaked rag instantly incapacitates a person
(159) Bananas are a radiation hazard
(160) The Bermuda Triangle has more shipwrecks and mysterious disappearances than other waterways
(161) Toilet waste is intentionally jettisoned from aircraft
(162) Concrete harms batteries
Why could you not simply post a link to this trivia rather than clogging the blog with off-topic crap?
Au contraire Mr Robertson, it is highly relevant to the nonsense claims made by you people.
And YOU of all people talking of clogging the blog with off-topic crap … rich.
two point…
1)Wiki is a rag where any ijit can post on a subject. You are surely not so simple that you think the items you post are accurate?
2)When I go off topic it is always related to Roy’s blog in some way. I see nothing in your post that does the same.
There is one quote where they are definitely wrong…
“(116) Vitamin C is effective in preventing or treating colds”
Linus Pauling was one of the greatest scientists of all times. He wrote the book on the covalent bond that is still used in universities, and he went to Europe in the 1920s to study quantum theory then applied it to chemistry for molecular structures.
HE continued the work of Irwin Stone on Vitamin C and he was particularly impressed by a study of Swiss school children given vitamin C to prevent colds. Being an eminent scientist he was well able to interpret the results. He thought the results of the study were significant.
Linus made no rash claims about vitamins C but based on his methodology I have tested it on myself. Since taking the requisite mega doses of vitamin C whenever I feel a cold or the flu coming on, the dose of C kills off the malady. Since starting the routine I have not suffered the effects of a full flu or cold.
I recall the bad old days when I’d come down with that achy feeling with a fever, only to be plagued by secondary infections like congestion, runny noses, hacking, etc. after the initial onslaught. No more. I never get secondary infection and the original flu/cold disappears as fast as it appeared.
Believe what you want, the relief I have experienced using mega doses of C has been remarkable.
Let’s look at it another way. Stop taking C altogether for a couple of months and you will slowly die a miserable death as your body literally falls apart.
another one of interest…
“(61) Astronauts in orbit are weightless because they are outside the gravitation pull of the earth”
The problem I have with most of these is the “gotcha” flavour. It’s like some super-nerd sitting around trying to feel important by trying to entrap people.
The astronauts would not be orbiting if they were outside the gravitational pull of the Earth, nor would they be weightless. Since weight is a measure of a mass under the influence of a force, this time gravitational force, if their craft is held in orbit by the Earth’s gravity then the astronauts too must be under its influence, not matter how small the force.
Anyone with basic science should be able to work that one out but such nerds tends to pick on, and impress, people who have little formal education.
“(153) Vaccines cause autism”
Prove they don’t. I am sure the nerds at wiki have that proof even though no one else in the scientific community does.
this will be one of the nonsense claims Ant attributes to ‘you people’…
“(100) Contemporary global warming is not driven by human activities”
***
I would like to see the inane anti-proof supplied for this allegation.
Another twerp post
As I said, they are all fully sourced. Do you not understand that concept?
“When I go off topic it is always related to Roys blog in some way”
Oh really … explain how the moon’s phases are related to Mr Spencer. (Then admit to how little you understood what causes them.)
Explain how talking about your limited understanding of electrical engineering is related to Mr Spencer and his blog.
Vitamin C … who would have known that a sample size of ONE could be used to prove a claim. Let me try that … I haven’t had a cold since July 2019, and I have taken no vitamin C in that time. Has my sample of size 1 proven my claim? What a N.U.T.T.E.R.
“Prove that they don’t”
How about you prove that they DO. Do so in reference to the source provided on WP.
“Linus made no rash claims about vitamins C but based on his methodology I have tested it on myself. Since taking the requisite m feel a cold or the flu coming on, the dose of C kills off the malady. Since starting the routine I have not suffered the effects of a full flu or cold.”
Vitamin C {and other vitamins will reduce effects. But stopping colds could be bad idea- it’s like physical exercise.
Though I am not a fan of doing a lot physical exercise- some amount and stretching- but not too most of a particular type of exercise.
Long walks would be a good idea, if you are got the time.
AQ,
The correct honorific for Roy Spencer would be Dr., not Mr. Where were you educated?
Tis Mr. Asshat who said “Roy’s blog,” Troglodyte.
If you want to be wrong (hint: you’re on the Internet), at least pick on a fellow crank.
The Vitamin C question is very simple. Supplements can work to fill a deficiency, but taking extra beyond the amount the body needs to use has no benefit. This is true for all vitamins, minerals, and nutrients.
https://en.wikipedia.org/wiki/Cass_Elliot
Elliot retired to an apartment in Mayfair at Flat 12, 9 Curzon Place (later Curzon Square), Shepherd Market, Mayfair, London, owned by singer-songwriter Harry Nilsson who allowed her to stay there. Several hours after Elliot left Jack Martin’s cocktail party, she died in her sleep at age 32. According to Keith Simpson, who conducted her autopsy,[25] she died of a heart attack, and there were no drugs in her system.[27][28][29] Four years later, Keith Moon, drummer for the Who died in the same bedroom, also aged 32 years.[30][31][32]
Elliot did not die from choking on a ham sandwich.[33][34] According to Lindsay Zoladz in The New York Times in 2024, this “cartoonish rumor propagated in endless pop culture references, from Austin Powers to Lost cast a tawdry light over Elliots legacy and still threatens to overshadow her mighty, underappreciated talent.”[35] In 2020, a journalist and friend of Elliot’s, Sue Cameron, publicly admitted that she promulgated the false ham sandwich story by writing it into Elliot’s obituary for The Hollywood Reporter. She claimed she was asked to print the lie by Elliot’s manager Allan Carr, who decided that the humiliating falsehood was preferable to any implication that Elliot’s death was associated with substance abuse.[35] Elliot’s body was cremated at the Hollywood Forever Cemetery in Los Angeles, California.[36] Her ashes were later buried in Mount Sinai Memorial Park Cemetery in Los Angeles.[37]
To be clear, it is true that a Grand Jury can indict a ham sandwich. Swiss cheese and rye bread are not necessary.
Whatever the cause, it’s too bad these young people died so tragically.
Momma Cass, Janice Joplin, Jimi Hendrix, Jim Morrison, Keith Moon, Bon Scott, Brian Jones, etc.
I remember being young and facing similar needs and urges. I also thank whomever is up there for allowing me to survive those times.
A tropical storm in the Gulf of Mexico will strengthen to a hurricane before making landfall in Houston.
https://i.ibb.co/kcvRY8H/ventusky-temperature-2m-20240706t0500.jpg
Tropical tidbits.
https://i.ibb.co/479rXLf/goes16-truecolor-gom.gif
elliott…”…the latest Chromium version of the Tarderase plugin for this blog is submitted”.
***
It reveals you as an anal person who lacks the ability, or understanding of science, to interact with the Big Boys. No on else here, except Binny, needs such control that they have to block posters. Sheeesh!!!
In Green Bay, US, known for its cheese, at football games they call themselves cheeseheads and wear hats that emulate a large block of cheese. I imagine you sitting around wearing one of those hats with Swiss cheese, complete with holes in it. The holes surely reflect the considerable number of holes in your head and your scientific logic.
As Gordon shows us the extent of his “scientific logic” with that “argument”.
Hey AQ,
How many genders are there?
ant…nothing like a witty comeback [/sarc off].
Oh look … it’s someone who believes a follower of AGW is necessarily a follower of everything supported by that side of politics. Try harder next time … you picked the wrong target.
Gordon:
Hilarious and accurate characterization of Elliot “Cheesehead” Bigfall. The Qwerty guy, obsessed with compiling irrelevancies throughout the night in his bed-sitter, also fits the bill.
Walter R. Hogle,
You didn’t reply in the proper subthread.
Thank you nevertheless for your scientific output.
You mean the “irrelevancies” that Gordon have found relevant enough to reply to multiple times? Those irrelevancies?
Little Willy, Antonin, please stop t-word-ing.
Another tropical storm is developing over Jamaica.
https://i.ibb.co/9qD155G/goes16-vis-swir-watl.gif
When insisting on EV… a country, in case of emergency, will be challenged without means of transportation.
–
https://www.cristos-vournas.com
https://judithcurry.com/2024/07/05/hunga-tonga-volcano-impact-on-record-warming/?fbclid=IwZXh0bgNhZW0CMTEAAR2FRQC_AcgyIdhQR3EPEQHPQvHT5_0ooPco7BfOhT9enrw7ir5LUWEIlUc_aem_PP7E6RH7836V-jBtsqJuig
Beryl is now a tropical storm in the Gulf of Mexico with gusts over 100 km/h: https://www.ventusky.com/?p=21.7;-88.8;5&l=gust&w=soft 🧐In the next few days, it will probably strengthen to a hurricane again and make landfall in Texas, likely between Corpus Christi and Houston.
Boca chica is only going to get around 30 mph winds, but I guess, lots rain and some lightening.
Should be an interesting season..
https://ozonewatch.gsfc.nasa.gov/SH.html
The propaganda about the ozone hole according to NASA GISS equals their propaganda about global temps and climate change. There is no way the concentration of oxygen in the atmosphere at the ozone altitude level is sufficient to block UV as they claim. The concentration of O2 at that altitude is less than the 0.04% attributed to CO2 at the surface.
“No way” based on what? Your massive gut?
Antonin, please stop t-word-ing.
Hunga Tonga volcano: impact on record warming
Posted on July 5, 2024 by curryja | 34 Comments
By Javier Vins
https://judithcurry.com/2024/07/05/hunga-tonga-volcano-impact-on-record-warming/#more-31371
—….
Buontempo means good weather in English, and his phrase we have entered uncharted territory has become very popular. However, it assumes that we have reached and will remain in this situation, whereas the data suggest that this is a one-off anomaly with diminishing effects. For now, it tells us that nothing dramatic is happening as we approach the politically established warming threshold.
Gavin Schmidt, director of NASAs climate monitoring institute, also uses the expression uncharted territory when he explains that the 2023 anomaly worries scientists, saying that climate models cannot explain why the planets temperature suddenly spiked in 2023. Not only was the temperature anomaly much larger than expected, but it occurred months before the onset of El Nio. In his own words: The 2023 temperature anomaly has come out of the blue, revealing an unprecedented knowledge gap perhaps for the first time since about 40 years ago. It could imply that a warming planet is already fundamentally altering how the climate system operates, much sooner than scientists had anticipated.[iii] According to Gavin, we could have broken the climate and the models would no longer work.—
They never worked.
Javier has a firm grip on reality. I’ve seen his research before. He’s one of the few that understands the importance of the Polar Vortex on Earth’s temperature.
The cult will hate him….
He says nothing about the polar vortex in this article. He blames it all on water vapour, ie. THE GREENHOUSE EFFECT
Ant, you will need a responsible adult to explain it to you — I’ve seen his research before.
It seems you are admitting implicitly that you are not such a responsible adult.
Bwa ha ha!
So then, link us to it.
Ant and Nate, why do I have to spoon feed you children?
If you can’t find it yourselves, stop commenting for 30 days and I will do it for you.
gb…”…Buontempo means good weather in English…”
***
Actually, gb, tempo means time. Seems that buon should be buen, therefore buentempo should mean ‘good time’.
The quote from Gavin Schmidt is apt. The models cannot explain the spike, even though the rest of the eco-weenies are convinced it is caused by a trace gas.
The Nationwide 500,000 EV Charger Charade
https://wattsupwiththat.com/2024/07/06/the-nationwide-500000-ev-charger-charade/
Joe is spending $7.5 billion dollars.
“At this rate, the 500,000 charging stations will cost the government $400 billion, not the $7.5 billion the President has promised.”
Someone helping him be a big fat liar {though he is thin and sleepy].
A Closer Look At Blue Origin & ULAs FAA Comments
https://www.youtube.com/watch?v=tASr5adgKCo
We need an ocean settlement about 10 km off the coast of KSC
ant responds with a knee-jerk reaction, mainly jerk.
“Explain how talking about your limited understanding of electrical engineering is related to Mr Spencer and his blog.
Vitamin C who would have known that a sample size of ONE could be used to prove a claim. Let me try that I havent had a cold since July 2019, and I have taken no vitamin C in that time. Has my sample of size 1 proven my claim? What a N.U.T.T.E.R.
Prove that they dont
How about you prove that they DO. Do so in reference to the source provided on WP”.
***
***I am still awaiting any constructive criticism re my understanding of EE. I always offer my insight into EE in relation to the topics in Roy’s blog. For example, I have expounded on positive feedback, using my EE background to illustrate why PF cannot occur in the atmosphere. In case that goes over the heads of alarmists like Ant, PF is an important function in EE and I understand it well.
***Re Vitamin C…a sample size of one??? That one is represented by one of the greatest chemists of all times, Linus Pauling, and last time I looked ascorbic acid, aka vitamin C, is a molecule. Pauling was an expert in molecules and he understood the antioxidant effect of C in the body.
He also put to bed the theory that extra C, or extra vitamins, are a waste of money since they are allegedly peed out. Pauling took a 10 gram dose of C and actually measured the amount eliminated in urine and poop. He found that half is retained. He reasoned that any C eliminated must pass through the urinary tract and bowels and as an antioxidant would protect them against oxidative products like free radicals.
Good luck trying to do that with the RDA of 75 mg.
That’s why C is so effective against colds and flus. When those invaders try to alter body composition, C intervenes, provided there is enough in the body.
***re proof that vaccines don’t cause autism, Ant rises to the challenge by tossing the question back into my court….the sign of a brilliant debater.
Based on the ingredients of some vaccines, like mercury, the claim that vaccines in young children cause autism is well grounded.
But, hey, I would not expect someone as stoopid as an alarmist to understand any of this.
> For example, I have expounded on positive feedback, using my EE background
Refutation here:
https://www.drroyspencer.com/2024/07/uah-global-temperature-update-for-june-2024-0-80-deg-c/#comment-1677919
Another refutation there:
https://www.drroyspencer.com/2024/07/uah-global-temperature-update-for-june-2024-0-80-deg-c/#comment-1678016
Mr. Asshat never listens.
Swannie believes that heat can be transferred, by its own means, from cold to hot, thus negating the 2nd law. He even performed an experiment for which he arrived at the wrong conclusion.
Bob just prints stuff trying to get under the skin of skeptics. Both Bob and Swannie are good guys, unlike you, a scumbag who continues to post Dremt’s real name.
Mr. Asshat believes that transferring his discussion of feedbacks into a discussion of thermodynamics helps him protect his misconceptions.
It only helps him get negative feedback.
Gordon,
I am not trying to get under your skin.
I am trying to get you to learn things, but you refuse to be corrected when you post falsehoods.
Like saying electrons orbit the nucleus, that electrons are the only thing that can absorb or emit radiation, that the GHE effect involves transfer of heat from cold to hot.
“Based on the ingredients of some vaccines, like mercury, the claim that vaccines in young children cause autism is well grounded.”
It started with one fraudulent paper.
https://en.wikipedia.org/wiki/Lancet_MMR_autism_fraud
bobdroege, please stop t-word-ing.
PhilJ…continuing the Venus greenhouse debate…
“The temperature of Venus surface is easily explained by its lack of water to cool the surface, and thick sulphuric acid clouds absorbing (and remitting to space) all of the solar input…”
***
Phil…interesting point but that can hardly explain a surface temperature of 450C. Still scratching my head on that one.
The 2nd law tells us that heat cannot come from the atmosphere since it would have to be greater than 450C.
“Atmospheric forces can be studied to arrive at a speculation on the climate. As winds blew across the “Mediterranean Sink”, they would heat or cool adiabatically with altitude. In the empty Mediterranean Basin, the summertime temperatures would probably have been extremely high. As a first approximation, using the dry adiabatic lapse rate of around 10 C (18 F) per kilometer, the maximum possible temperature of an area 4 km (2.5 mi) below sea level would be about 40 C (72 F) warmer than it would be at sea level. Under this extreme assumption, maxima would be near 80 C (176 F) at the lowest points of the dry abyssal plain, permitting no permanent life but extremophiles. Further, the altitude 35 km (23 mi) below sea level would result in 1.45 to 1.71 atm (1102 to 1300 mmHg) air pressure, further increasing heat stress. However, these simple estimates are likely far too extreme. Murphy et al.’s 2009 general circulation model experiments[49] showed that for completely desiccated conditions, the Mediterranean basin would warm by up to 15 C (27 F) in summer and 4 C (7.2 F) in winter, while for a depressed water surface, temperatures would warm by only about 4 C (7.2 F) in summer and 5 C (9.0 F) in winter. In addition, the model results indicated global stationary wave response to the introduction of the topographic depression causes patterns of warming and cooling by up to 4 C (7.2 F) around the Northern Hemisphere. ”
https://en.wikipedia.org/wiki/Messinian_salinity_crisis
Venus has global wind which travel around the planet every 4 to 5 days. Or this wind at about 100 m/s [223 mph].
Phil and Mr. Asshat go to
Step 3 – Saying Stuff
Gordon,
“The 2nd law tells us that heat cannot come from the atmosphere since it would have to be greater than 450C.”
But it does transmit energy from the atmosphere of Venus to the surface, that is what the GHE does, it does not have to transfer heat from the atmosphere to the surface, all it needs is heat.
Sorry, typo, the last word should be energy.
bobdroege, please stop t-word-ing.
Before dawn, Beryl will arrive in Texas.
https://i.ibb.co/bBrW79b/ventusky-wind-500hpa-20240708t0800-29n96w.jpg
Tomorrow.
Time to call in the dogs, piss on the fire, and head back to Cut and Shoot.
Arkady, please stop t-word-ing.
These amazing images show what Mars snow looks like its nothing like on Earth
By Jack Lee,
Weather Science Data Reporter
Updated Feb 1, 2023 9:31 a.m.
https://www.sfchronicle.com/weather/article/mars-snow-photos-earth-17755425.php
Scientists estimate year-round snow accumulation on Mars
Scientists have attempted to calculate the amount of snow that accumulates at Mars north pole during the year.
Published: Oct 07, 2023 08:11 AM EST
https://interestingengineering.com/science/scientists-estimate-year-round-snow-accumulation-on-mars
Fascinating to see high-quality images from another world.
Well, there are a lot of them. But it seems it’s a given there is lot more of them, not processed into “high quality images”.
There the story that NASA was going to throw out a lot lunar probe data, but it was rescued from the trash, and effort was made to process it. But rather than putting in the garbage, you can just store it somewhere. Plus one just store it on the internet, for anyone to process it {however they like to do it}.
swannie…”Gordo continues his semantic confusion, insisting that a system can only exhibit amplification when there is an
amplifier which adds energy within said system. He ignores two processes within the climate system which produce positive feedback, that is to say, their effects increase as temperature increases. The highly non-linear water vapor feedback is one such process, another is the snow and ice albedo feedback.
Gordo doesnt do science, so he cant think outside his electrical world box”
***
Hate to tell you this, Swannie, but engineering is classified officially as Applied Science. In order to apply science, you must first learn science. That’s what we do, we learn it then we apply it. Others, like climate alarmists, get caught in thought experiments then by consensus, agree they must be right.
In the Earth system, there is one input, solar energy. In order for PF to operate in this system, it must add to the solar energy to cause an amplification of heat, which requires a heat amplifier. The processes you describe do not add heat, they recirculate it, or block it, which is negative feedback if anything.
Furthermore, such a system requires an output from which to feed energy back to the Sun, to increase its output. If you have such a method, please advise. An increasing effect is not feedback in the context of Hansen’s tipping point theory. Hansen is talking about an amplification of heat. Where would that extra heat come from?
Albedo simply reduces the amount of EM absorbed from the Sun. Again, not PF.
Any warming experienced on Earth has been a rebound from cooling. Somehow, solar energy was reduced, the planet cooled, and when the cooling condition was removed, the planet warmed. That’s what the current warming hysteria is about.
” Hansen is talking about an amplification of heat. Where would that extra heat come from? ”
It is heat which enters the system and is then prevented from leaving.
“In the Earth system, there is one input, solar energy. In order for PF to operate in this system, it must add to the solar energy to cause an amplification of heat, which requires a heat amplifier.”
Myth. Solar input is a constant energy per unit time…POWER.
Energy content is not power!
Only energy content is what is enhanced by feedbacks.
And that is brought about by retaining more heat-mostly by reducing heat loss.
Just like what would happen to your PC’s processor chip, if the fan broke.
You got some things correct, Nate. Congratulations!
But remember also, “energy” is not always “heat”. You can add more energy to a system without increasing the temperature. Adding more ice to a cup of coffee adds more energy, but the temperature decreases.
Be aware — if you learn too much science, you will be excommunicated from your cult!
Riddle me this, Puffman –
How does feedback add energy to a system?
Clint,
What happens if you just add energy, but not mass.
bob asks: “What happens if you just add energy, but not mass.”
A simple example would be the energy arriving Earth from the Cosmic Microwave Background Radiation. That energy is entering Earth’s system, but no mass is being added, yet the temperature does not increase.
That’s astute Clint R,
How about solar energy entering the Earth system, that does raise the temperature, right?
You seem to be excellent at finding exceptions to the rule.
Solar energy can raise Earth’s temperature, but CO2 cannot. CO2 adds no new energy to the system.
And, as I have stated, to raise temperature, the energy must be the “right kind”.
Clint R,
Solar energy can raise Earths temperature, but CO2 cannot. CO2 adds no new energy to the system.”
Additional CO2 keeps the energy in the system longer, thus raising the temperature.
Sorry bob, but that’s your belief. Beliefs ain’t science.
In science, you would have to show how 15μ photons can raise the temperature of a 288K surface. And only children with lasers can do that….
That’s been done Clint.
The ground is perfectly capable of absorbing 15 micron photons, and if that energy is added to energy from the Sun, the result will be to raise the temperature of the ground.
It is not adding fluxes, it is adding energy.
It is the right kind of energy.
I don’t have to show that, as it has already been shown.
Sorry bob, but you’re still not getting it.
You’re STILL trying to boil water with ice cubes.
Clint,
No need to keep trying to boil water with ice cubes, as that has already been done.
Though I can’t boil water with the infrared radiation from ice.
But the surface of the Earth is quite capable of absorbing 15 micron or 10 micron infrared photons.
How is that minor in Physics going?
bob, if you’re now admitting ice can not radiatively boil water, then you are also admitting CO2 15μ photons can NOT raise Earth’s 288K surface temperature.
Clint,
“bob, if youre now admitting ice can not radiatively boil water, then you are also admitting CO2 15μ photons can NOT raise Earths 288K surface temperature.”
You know there is a difference between raising something 70 degrees, and raising something 3 degrees for a doubling of the concentration of CO2.
Or are you as bad in math as you are in physics or science in general?
Correct bob, temperatures make a difference. That’s why a “cold” can NOT warm a “hot”.
And that’s why ice cubes can NOT boil water and a cold atmosphere can NOT warm Earth’s warmer surface.
I don’t know if you’re actually learning, or just stumbling into some reality.
Clint,
“Correct bob, temperatures make a difference. Thats why a cold can NOT warm a hot.”
Well that depends on what you mean by warm, if you mean does heat transfer from the cold atmosphere to the warmer surface, no that does not happen. If you mean can a cold atmosphere cause a warmer surface by restricting the rate of cooling of the surface by absorbing the infrared, that does indeed happen.
“And thats why ice cubes can NOT boil water and a cold atmosphere can NOT warm Earths warmer surface.”
You forgot to specify the radiation from ice cubes can not boil water, so you get another zed. The atmosphere can make the surface warmer as I indicated above, you still can’t learn
“I dont know if youre actually learning, or just stumbling into some reality.”
You might learn, if you get up off of your mother’s rotten couch in the basement and did some experiments.
Sorry bob, but all that rambling won’t help you.
A “cold” can NOT warm a “hot”.
And that’s why ice cubes can NOT boil water and a cold atmosphere can NOT warm Earth’s warmer surface.
I like to keep things simple so children can understand.
Yeah right Clint,
That’s why a pot of water on a stove boils faster if you put the lid on the pot.
You can even adjust the amount of heat provided so that the pot is at about 90 C, and then put the lid on and watch the water boil.
The lid being colder than the water.
You can even ask your mom for a hotplate so you can try it yourself.
Gordo mentions the “Earth System”, writing (incorrectly) that:
Gordo is still stuck with his electrical engineering idea of the atmosphere acting as if it were an electric amplifier process. He ignores the complex nature of the internal processes within the atmosphere and ocean climate system coupled with the diurnal and seasonal variations in solar input, ruminating that only negative feedback processes operate within.
Gordo needs to follow his own prescription and learn the science.
E. Swanson, please stop t-word-ing.
bob d…”When Jimmy put his guitar near his amp, the output of the amp caused both the strings to vibrate more, as well as directly causing the pickups to increase their output. This makes the amp produce more sound.
Increase the temperature of the Earth, then there is more water vapor in the atmosphere which increases the GHE, which makes more water vapor in the atmosphere, which increases the temperature of the Earth.
And so on and so on”.
***
and scoobie, doobie, do won
An amp cannot produce more sound power than it is designed to produce. A more powerful amp requires a more powerful power supply and when the P/S can deliver no more current, the output is limited.
The feedback squeal that pierces one’s ears happens at a specific frequency. So, a lot of power can be emitted at one frequency. That can be compensated, or eliminated, using an equalizer set to attenuate the feedback frequency.
Jimmy’s guitar and amp work as I described. The vibrating string is sensed by a pickup and provides an input signal to the amp. The amp amplifies the signal and the speaker emits it as an amplified sound pressure wave. If the guitar string is close enough to the speaker, the sound pressure wave acts as a positive feedback from the speaker, adding to the string vibration and that raises the level of the input signal. It gets re-amplified and each iteration the output signal increases as does the feedback signal.
—
How does one go about increasing the temperature of the Earth without increasing the output of the Sun, or cooling the Earth first? If the Earth has stabilized at 15C, based on a certain solar input, how does one add heat to raise the temperature from 15C? Where does that heat come from?
If you could trap heat, like a greenhouse traps it, the average temp should rise. But a greenhouse does that by trapping molecules of air behind glass.
The current GHE and AGW theories are wrong in that they think trapping a small amount of surface radiation is akin to trapping heat. That’s wrong, the only way to trap heat is by trapping air molecules. Since the heat involved in creating IR is lost as the IR is created, the small amount of IR trapped by GHGs is not related to surface cooling or trapped heat.
The atmosphere cannot trap heat, nor can the small amount of trapped IR, converted to heat, be returned to the surface to heat the surface.
Gordo repeats his usual display of his ignorance of physics and systems theory, writing:
The short answer is the same way one increases the winter temperature inside a house by adding insulation. The temperature inside the house is the balance point at which the energy flowing in and out is at steady state. Given the same energy input to the house, adding insulation causes the balance point temperature to increase. No addition energy input is required, it’s just that the system has changed.
Of course, Gordo continues, pointing to the Wood’s simple analysis of greenhouses, which has nothing to do with the atmosphere or AGW, writing:
.
If Gordo had actually taken a course in meteorology, as he once claimed, he would surely be aware that a moist atmosphere with lots of water vapor is associated with warmer surface conditions than that which would appear with a dryer atmosphere. Massive ignorance, as usual.
Gordon,
“Thats wrong, the only way to trap heat is by trapping air molecules.”
The air molecules are trapped by gravity, and the CO2 in the atmosphere trap the energy from the radiation and transfer it to the other molecules in the atmosphere.
“An amp cannot produce more sound power than it is designed to produce”
What stops the feedback cycle?
Something breaking, or a fuse blowing, something melting from too much current?
E. Swanson, bobdroege, please stop t-word-ing.
Version 1.3.1 of the Tarderase plugin for Firefox is now uploaded. Based on performance to date, it should be available for installation on Monday or Tuesday. The plugin is for the time being feature-complete, and I’ll spend any time in the ensuing few weeks fixing any bugs that crop up and generally cleaning up. All feedback welcome, as usual.
Elliott, please stop t-word-ing.
I notice that PhilJ made his first post this month just 90 minutes after Flynnson was banned.
Then there is this post of his from last month:
https://www.drroyspencer.com/2024/06/uah-global-temperature-update-for-may-2024-0-90-deg-c/#comment-1671794
Does the middle paragraph loom familiar?
And the last paragraph here:
https://www.drroyspencer.com/2024/06/uah-global-temperature-update-for-may-2024-0-90-deg-c/#comment-1672857
And the posts are all made between 7am and shortly after midnight Sydney time.
Flynnson never would have written such a post:
https://www.drroyspencer.com/2024/06/uah-global-temperature-update-for-may-2024-0-90-deg-c/#comment-1672010
He would never written a post denying the greenhouse effect??
Yeah. Mike was more into “but this isn’t really warming because warming implies heating and there’s no heating.” He himself described the greenhouse effect here:
https://tinyurl.com/mike-describes-his-sammich
(It’s offline now, but it’ll return later.)
In a way, it’s a variation on Mr. Asshat’s feedback argument. Or the other way around. To have more heating one needs more energy, and feedbacks can only feed energy back into a system.
The connection you see in both Mike and Phil’s position is the tagline: “because 2LOT.” Otherwise the style and language are not the same. Mike once tried to come back using another voice, but he can’t hold it for very long. As soon as his impulsivity kicks in, we can hear him loud and clear.
Phil ozone theory is more like Puffman’s anyway.
Ant, maybe your obsession with commenters is why you can’t learn any science?
Or, maybe you don’t want to learn….
By BSc says I do in fact understand science. You on the other hand have always balked at answering my questions related to your credentials.
My …
Well Ant, if you believe you know science maybe you could help barry describe the energy flows on Venus. He’s very confused.
Start with how much solar energy reaches the surface, is it:
a. 10% (260 W/m²)
b. 34 W/m²
c. Something else (Show your work)
I have no idea, no interest in playing your games, and zero interest in Venus … unless it is the mounded variety. Here is what is measured, in case you actually find science interesting:
https://www.sciencedirect.com/science/article/abs/pii/0019103583902130#:~:text=The%20integral%20flux%20of%20solar,%C2%B1%202.3%20W%20m%E2%88%922.
I see you still refuse to discuss your science credentials.
Ant, your cult believes CO2 causes Venus surface temperature of about 800F. barry believes that. Yet, neither you nor barry is able to calculate the Venus energy flows….
Beliefs ain’t science.
Well then … here’s your chance to show me up with your mathematical brilliance, with full citations (and units) for all figures employed in your calculation …
The fact that you won’t even attempt the problem indicates you don’t have a clue, Ant.
I’ve given two answers, and provided the methodology for each. You can either pick one of the two solutions, or come up with your own. But, you’ve got NOTHING.
You belong to a cult that has NOTHING.
Soon after I first started commenting here, I realized that none of the Moon Spinners knew anything about the issue. They just believed what their cult said. Then, I discovered it was the same with the GHE issue. None of the cult understood any of the actual physics.
I prepared about a half dozen basic physics problems. NOT one of the cult could get the correct answers. Few would even tried. The cult, and the cultists here, have NOTHING.
Hey Puffman, riddle me this –
How many sock puppets did you have that got banned on this website:
(1) 2
(2) 3
(3) too many to count
I guess Ant won’t be answering.
Silly willy is trying to fill in for Ant, only he can’t understand any of this.
Kids these days….
AQ,
Still didn’t answer the question. Use your BSc and tell me how many genders? Then we will ask Wiltard.
Clint R
There’s a planetary energy budget for Venus here.
https://www.metlink.org/wp-content/uploads/2020/11/PhysRev-25_energybudgets.pdf
SPA
Why didn’t you respond the last time I reacted to your inane question?
https://www.drroyspencer.com/2024/07/uah-global-temperature-update-for-june-2024-0-80-deg-c/#comment-1678007
Sorry Ent, but there is no “budget” for Venus. They did copy the same nonsense for Earth, not anything new.
I was hoping they would attempt some new nonsense for Venus, but no luck
Mr. Asshat holds that to have a positive feedback the amplifier needs to be *plugged in*. Since dry areas are not plugged in, droughts cannot be intensified through positive feedback. And water vapor cannot creat a positive feedback on warming. At least according to that logic.
Alternatively, a feedback is internal to the system, whereas a forcing is external to it. Adding greenhouse gases to the atmosphere keeps more heat in, which in turn generates more water vapor. A forcing and a feedback. A positive one, obviously.
Little Willy, please stop t-word-ing.
Should a country heading to 100% zero CO2 emissions, should a country abandon the national crude oil reserves?
https://www.cristos-vournas.com
Nobody in the world has 100% zero CO2 emissions and/or everyone in the world has 100% zero CO2 emissions.
Burning wood is not 100% zero CO2 emissions, but you could be dumb and say it is. A pretending to be dumb, is very popular. And becomes more widespread, if it makes you richer.
Find me a scientist who actually makes that claim.
First, define “zero CO2 emission”.
Houston, we have a problem
Related
6/ Hurricanes are expected to become stronger with warming.
P.s.:
Ark, if you’ve been tracking the storm you must have noticed how wrong the models have been. Three days ago, the storm was going to miss the Texas coast. Now, it’s heading straight in.
But, it has lost energy and is now only a tropical storm, not likely to reach hurricane status again — probably because there’s not enough warm water….
Projected to reach hurricane status again before landfall.
I can see Beryl from my house.
The remnants anyway.
bobdroege, please stop t-word-ing.
Entropic man
I was quite busy at home these days; apologies for this late answer.
You asked a few days ago:
” Ireland is at about 54N latitude and averages between 9C and 10C.
Anyone have the overall average temperature for 54N? ”
*
I found your question so interesting because many people (not just those living in the UK and Ireland) don’t believe much in global warming because they don’t feel it locally. They like to say:
” Warming? What warming? It’s cold where I live! ”
Case in point: the genius Robertson, who placed a few cold days measured by a weather station over Vancouver in October 2023 above years of warming that is visible both at the surface and in UAH’s lower troposphere data.
Many have also difficulties to accept that ‘warming versus cooling’ often has nothing to do with ‘warm versus cold’.
*
As explained in the previous Spencer thread, there is little point in making a comparison based on a tiny band of latitude encompassing your Omagh in Northern Ireland in the UK, and therefore relying on no more than about 100 stations.
Better is to take Eire’s envelope as a whole, i.e. all stations above 51N and below 55N:
https://drive.google.com/file/d/1i74hMQUFo3MVM50NOowOeoaejyS8mIuM/view
As you can see, this graph comparing the annual absolute temperatures of Ireland and its latitude band around the globe explains the situation depicted above perfectly: while temperatures in Ireland, although much higher, have remained constant for more than a century and are currently even falling, the entire latitude band shows the opposite, with temperatures far lower but continuously rising for 50 years.
*
Even if linear trends don’t explain that much, their difference at least can (C / decade).
1900-2023
Eire: 0.09 +- 0.01; Eire lats: 0.14 +- 0.01
1979-2023
Eire: 0.09 +- 0.06; Eire lats: 0.30 +- 0.05
2010-2023
Eire: -0.82 +- 0.30; Eire lats: 0.89 +- 0.23
*
A look at anomalies wrt the mean of 1981-2010 shows similar results:
https://drive.google.com/file/d/1DVZsqIiqLHpf-x8CotGnGuGo6fHr6uv0/view
The monthly anomaly polynomials look steeper than those of the yearly absolutes but this is of course an illusion.
1900-2023
Eire: 0.07 +- 0.01; Eire lats: 0.29 +- 0.01
1979-2023
Eire: 0.09 +- 0.04; Eire lats: 0.26 +- 0.04
2010-2023
Eire: -1.10 +- 0.26; Eire lats: 0.86 +- 0.20
*
Last not least I thought: why not to compare the Eire lats series wrt the mean of 1991-2020 witn UAH LT’s grid data in the same latitude band?
https://drive.google.com/file/d/1rgIDtjvra0lESIoJ0aIi_4_L_21MIiqE/view
1979-2023
UAH LT: 0.19 +- 0.04; Eire lats: 0.26 +- 0.04
2010-2023
UAH LT: 0.36 +- 0.12; Eire lats: 0.86 +- 0.20
*
So in the sum we see that looking at a recent, negative trend for Eire is not relevant when compared with its worldwide latitude band.
Bindidon, we are not in a runaway warming, are we?
–
https://www.cristos-vournas.com
… μας ρωτάει ο Βουρνάς, ο εμπρηστής πυροσβέστης.
Bindidon
That’s a bit hard on Vournas. Shades of Farenheit 451!
Vournas
The temperature of the Earth is an equilibrium between incoming and outgoing energy. There is no danger of runaway warming because an increase in net energy input leads to an increase in net energy output and a new, warmer, equilibrium.
Thank you, Ent.
“The temperature of the Earth is an equilibrium between incoming and outgoing energy. There is no danger of runaway warming because an increase in net energy input leads to an increase in net energy output and a new, warmer, equilibrium.”
–
Yes, I agree.
Also, I think the above is the same for Venus.
The temperature of the Venus is an equilibrium between incoming and outgoing energy. There were not runaway warming on Venus either.
–
https://www.cristos-vournas.com
Entropic man
No, nothing a la Fahrenheit in my reply.
The fact is that I answered your question with a 100% polemic-free comment, and if someone responds with 100% polemics, then my 101% polemical answer is the only possible one.
Bindidon
Sorry to pique your ire.Your data was very welcome.
Consider Fahrenheit 451 as a failed joke. It was an English SF novel about a future dystopia in which unapproved literature was banned and a fireman’s job was to burn books.
That’s what came to mind when you called Christos an arsonist fireman.
Entropic man
” Sorry to pique your ire. ”
Ooops? But you didn’t do that. It was Vournas.
*
I know ‘451, not as the English science fiction novel by Ray Bradbury, but as a great cult film by François Truffaut, which I saw several times over 40 years ago.
*
” Your data was very welcome. ”
Thanks.
*
I’ll be back soon with the daily GHCN/UAH LT comparison for Ireland’s latitudes.
For the third year in a row I can show how close the station data and the satellite data are, after the 2.5 degree grid cell over Vancouver, CA and the grid cells over the US Corn Belt.
“Bindidon says:
July 4, 2024 at 4:50 AM
All is best except your Φ which is nonsense; this has been proven to you many times.
But like Robertson, Clint R and a few other stubborn boys, you never admit being wrong.
Κανένα πρόβλημα για μένα όμως!”
–
–
“Bindidon says:
July 7, 2024 at 3:24 PM
Entropic man
No, nothing a la Fahrenheit in my reply.
The fact is that I answered your question with a 100% polemic-free comment, and if someone responds with 100% polemics, then my 101% polemical answer is the only possible one.”
–
–
https://www.cristos-vournas.com
Vournas
It’s not my job to search this blog for answers to your ‘theories’.
Please go back thread by thread and visit yourself all the relevant places.
Thanks for your help. It rather confirms my subjective impression that temperatures in Ireland are not changing much.
Perhaps the warming effect of the Gulf Stream is dominating any potential global warming.
Two things are changing.
I have a bad back and a gardener cuts my lawn. He has 25 years of invoices and has seen a definite extension of the growing season. He now starts cutting earlier and ends later. Grass still growing in December.
The visitors to my museum mention a change in rainfall. Fewer wet days and heavier rain when it does fall.
Entropic man
” Grass still growing in December. ”
Exactly the same happens here (south of Berlin, Germoney) in our garden since 3 or 4 years.
*
” Fewer wet days and heavier rain when it does fall. ”
We are lucky here not to confirm this, let alone what people experienced this year south of 50N in Germoney and above all in the European Alps!
Rainfall was really heavy there.
I live a few tens of kilometres North of the San Bernadino pass, and Mesocco is on my usual route South to Italy. A week ago an entire section of the motorway there was washed away and the village of Lostallo hit with floods in which a couple died and about 200 houses were damaged.
We’re definitely feeling the effects here these days.
Elliott, please stop t-word-ing.
https://i.ibb.co/1K4GDNd/archive-4-image.png
** No they dont! People keep misrepresenting what they did in that study. They got the same broadband IR radiative forcing from 2XCO2 as others before them got. I verified this with Will Happer. See Table 3 in their paper: https://co2coalition.org/wp-content/uploads/2022/03/Infrared-Forcing-by-Greenhouse-Gases-2019-Revised-3-7-2022.pdf Roy
I’m struggling with this. Happer Wijngaarden show the GHE effect of 400 ppm CO2 to be approx 30Wm-2. They show that doubling CO2 to 800 ppm increase GHE by another 3Wm-2. Doesn’t the logarithmic response, where more CO2 is required for less increase in GHE, show the spectrum is saturated?
What am I missing? Even the discussion about table 3 indicates saturation is happening.
Saturation can be viewed in different contexts.
1) In the context of a 15 um ray passing through uninterrupted in a free path from the surface to the space the current concentration of CO2 is saturated.
2) In the context of a broad band of rays on either side of 15 um the current concentration is not saturated because of doppler/pressure broadening effects expanding the wings of the band that CO2 interacts with.
3) In the context of the radiative force the current concentration is not saturated because the cross sectional density of CO2 decreases with height and at some point allows a free path escape to space in what can be referred to as the effective emission height. Increasing the concentration adds enough cross sectional density to raise this effective emission height where it is colder and thus less energy is being transmitted upward.
Also, it is important to understand that a logarithmic response does not mean saturated. It means the effect is proportional to the logarithm of the concentration. There is actually no point (other than 100% concentration) at which the radiative force gets saturated. It’s just that each incremental increase in concentration produces a smaller response.
Anyway, many people neglect contexts 2 and 3 in the saturation discussion.
The difference between your 1 and 2 is immaterial. The absor*tion spectrum of CO2 are 2.7, 4.3, and 15 um. The 15 um band is the broadest, but the spectrum is still centered on 15um. Suggesting that there is more absor8tion at the boundaries when the concentration of the gas in question is increased isn’t exactly contributing to the discussion even as it might be pedantically accurate.
I’m probably missing it on #3.
Ken
It is not ‘pedantic’. It is what is causing the warming, and it is PRECISELY the reason the response is logarithmic.
The 3Wm-2 projected includes the effect of the side bands. Warming it is, but its insignificant warming.
Ken,
Saturated means that an incremental increase in CO2 has no effect. Even Happer says 2xCO2 has a 3 W.m-2 effect which is obviously more than nothing. Oddly Happer says it is saturated and then presents evidence that it isn’t which is obviously bizarre.
Anyway, #3 is important because its not strictly the concentration that matters. It’s actually the cross sectional density. We usually refer to the effect in terms of concentration because the mass of the atmosphere isn’t changing so there is a direct relationship between concentration and the amount of CO2 that a ray must traverse through a full column of the atmosphere. However, the density of the atmosphere decreases with height, but concentration remains relatively constant. This means the higher up you go rays have rapidly declining amounts of CO2 molecules they encounter. If you go up high enough the rays finally get a free path to space. But as you increase the concentration you also increase the cross sectional density of CO2 molecules. That means the free path height increases into colder parts of the atmosphere.
If the GHE effect of increasing CO2 is logarithmic its never going to reach the point of no further effect.
We are at the concentration point where adding CO isn’t going to have much of a further effect on GHE; effectively its saturated.
I think we’re quibbling over semantics.
Part of my flawed understanding of GHE is that energy must radiate to space. That means a GHE gas is the only way to cool the atmosphere.
CO2 at the top of the atmosphere is the only way for CO2 to radiate energy to space. Everywhere lower in the atmosphere the CO2 molecule expands as it gets excited by abso*bing IR causing it to rise and shed heat through collisions. It never gets from the 0 to the 1 state due to the collisions until the atmosphere gets so thin as to allow it to radiate.
The thinner atmosphere could explain why increasing concentration of CO2 is causing upper atmosphere to get cooler. More CO2 should mean it radiates to space faster.
That fact of CO2 in lower atmosphere never reaching 1 state, or point where it emits energy, means AGW effect of CO2 is mostly bunkum.
No it not saturated. It is this expanding BAND SATURATION which is providing ALL the non-feedback warming.
We have increased CO2 concentrations by about 50%.
There is a lag between CO2 increases and the full temperature effect due to the inertia associated with warming the oceans. There is disagreement about the duration of the lag – anywhere between 20 and 60 years – but 30 years seems to be the most accepted value.
That means our current temperatures (NOT those of the past year but the centre of the distribution) are based on CO2 concentrations of about 30 years ago … about 28% above the pre-industrial. That centre is about +0.95C compared to the NOAA baseline, which is about +1.25C compared to the pre-industrial.
The “doubling” rule applies to any percentage increase, not just times 2. 1.28^2 is 1.64, so when we reach a 64% CO2 increase (around 2040), we are on target for another 1.25C by 2070.
If the lag period is as high as 60 years then the target for another 1.25 would be around 2060. If the lag period is only 20 years then there is much uncertainty based on our future with fossil fuels, but I would say 2090 plus-minus a decade.
All these calculations are based on ignoring the noise provided by oceanic cycles, which averages out to nothing over a sufficiently long period.
Clarifying: “another 1.25C by 2070” means relative to NOW.
“CO2 at the top of the atmosphere is the only way for CO2 to radiate energy to space. ”
It’s assumed or climate budgets indicate, that about 40 watts on average radiates directly from Earth’s rocky and ocean surface.
Clouds also radiate to space.
What not mentioned is more energy from surface or clouds could indirectly radiate into space.
Also certain sizes of dust are suppose to radiate to space.
When cargo cult began they didn’t know Earth was impacted by space rocks. And they make dust.
Its assumed or climate budgets indicate, that about 40 watts on average radiates directly from Earths rocky and ocean surface.
At this point the discussion is about CO2. CO2 radiates at 2.7 4.3 and 15 um. The radiation from the earth is IR spectrum that is not in GHE absor*tion spectrum.
‘No it not saturated. It is this expanding BAND SATURATION which is providing ALL the non-feedback warming.’
Yeah its saturated. Otherwise warming would be linear with increasing CO2. Its logarithmic; a huge amount of CO2 is required to cause a much smaller increase GHE.
There is a finite amount of IR radiated by earth in CO2 spectrum. At some point all of the IR in the spectrum will be absorbed by the CO2.
That is why I think the spectrum is saturated. Perhaps there is some other scientific definition of saturation that I am missing?
Further, band spreading doesn’t make sense. CO2 has chemical characteristics that won’t change unless its being transformed into some other chemical. The CO2 bandwidth spectrum might actually be 14.9 to 15.1 … its still the single band centered at 15.
CO2 doubling to 840 ppm will take two centuries. The concept of ‘lag’ response to CO2 isn’t valid because the increase in CO2 is too slow.
It’s logarithmic because a.b.s.o.r.p.t.i.o.n drops off exponentially as you move away from the resonant frequency, so the frequency changes logarithmically with a.b.s.o.r.p.t.i.o.n.
Never done any higher maths, have you.
Ken
That’s 400W’m^2 radiating from the surface, not 40W/m^2.
Of that 400W/m^2 only 239W/m^2 reaches space.
These figures are measurable, and indeed moitored.
Since the surface temperature remains relatively constant the surface must receive 400W/m^2.
Of this 240W/m^2 enters from the Sun and 161W/m^2 is the outward radiating energy trapped by the atmosphere and reradiated downwards.
Incidentally, note the 1W/m^2 imbalance. That is why the surface is warming.
“Its logarithmic because a.b.s.o.r.p.t.i.o.n drops off exponentially as you move away from the resonant frequency, so the frequency changes logarithmically with a.b.s.o.r.p.t.i.o.n.
Never done any higher maths, have you.”
Logarithmic because its approaching full saturation across the CO2 frequency band.
There is a limit to the amount of energy at any frequency at any given moment in time. That limit cannot be exceeded even at the edges of the bandwidth.
This entire string is an example of cult “science”. None of the participants knows what he’s talking about. bdgwx defines “saturation” in different ways, meaning it Is anything the cult needs it to be.
Possibly this concept of doppler/pressure broadening spilled over into climate “science” from astrology/astronomy. It has no relevance to actual climate science. It’s just one more example of the cultists trying to sound “sciencey”.
https://en.wikipedia.org/wiki/Doppler_broadening
“None of the participants knows what hes talking about.”
Is why I am here. I hope to learn something.
Get lost; your comment is useless. You are a repeat offender so you have no credibility.
Ken: Yeah its saturated. Otherwise warming would be linear with increasing CO2. Its logarithmic; a huge amount of CO2 is required to cause a much smaller increase GHE.
If you think “saturated” means a logarithmic effect then fine we can chalk this up to semantics. But you know as well as I do that most contrarians thinks “saturated” means no further effect which is clearly false.
Sorry Ken, but your opinions are wrong.
You’re not here to learn. There is no evidence of that. You’re here to promote your false beliefs, and spread your hatred.
What is is about living in Vancouver the makes you hate reality?
Hello Clint. Thought you might like to know they’re still discussing your post about photon absorp.tion, from last month:
https://www.drroyspencer.com/2024/06/uah-global-temperature-update-for-may-2024-0-90-deg-c/#comment-1673566
I hadn’t seen that, DREMT. Thanks for the heads-up.
Folkerts clearly indicated he can’t understand radiative physics:
https://www.drroyspencer.com/2024/06/uah-global-temperature-update-for-may-2024-0-90-deg-c/#comment-1674101
He’s treating all photons as “energy”, with no regard for photon frequency. That’s the nonsense that would mean he could boil water with ice cubes, or that fluxes simply add. Like his cult, he’s never had any experience in radiative physics or thermodynamics.
A 15μ photon has energy of 82.7 meV. A 10μ photon has 124 meV. That means two 15μ photons would have more energy than one 10μ photon. But the two 15μ photons could not raise the temperature more than the one 10mu; photon.
Temperature is a result of molecular kinetic energy, which is related to vibrational frequency.
The 15μ photon has frequency of 20 GHz, while the 10μ has frequency 30 GHz. Two 15μ photons will still only have a frequency of 20 ghz.
Photons don’t simply add, fluxes don’t simply add, and ice cubes can’t boil water.
The cultists don’t know science, and they can’t learn.
“If you think saturated means a logarithmic effect then fine we can chalk this up to semantics. But you know as well as I do that most contrarians thinks saturated means no further effect which is clearly false.”
Yes, saturated means no further effect and I can agree on the basis of that definition that CO2 spectrum is not yet fully saturated to the point of ‘no further effect’.
I am ‘guilty’ of using ‘saturated’ to also mean much diminished further effect as concentration of CO2 is increased.
As in:
420 ppm results in 30 Wm-2 of GHE; and,
840 ppm will result in only 3 Wm-2 of further GHE due to logarithmic approach to full saturation.
It is logarithmic for precisely the reason I stated.
Remember, I have the higher education, you have only google.
From Tim’s comment on photon absorp.tion I extrapolated that it would mean passive objects (objects with no internal heat source) would warm up when brought closer together, in sunlight…and what did they do? They defended that idea! Never mind that nobody has ever observed it to happen…
Yes DREMT, here’s an example of Folkerts making crap up, again: “Short and sweet, that’s why a 15μ photon WILL raise the temperature of a 288K surface.”
No, if that were true they could boil water with ice cubes.
Folkerts has no knowledge of the basics. He just slings crap against the wall, and his cult laps it up. Silly willy has even called Folkerts “Mighty Tim” — pure idol worship….
Clint,
Save your straw for planting grass.
“Photons dont simply add, fluxes dont simply add, and ice cubes cant boil water.”
Who is claiming photons add, they don’t interact with each other?
Fluxes do add, not simply, but why does the NFL use more than one light for night games?
And don’t forget to specify that it’s the radiation from ice cubes that can’t boil water.
Thanks for quoting me correctly, bob — Photons don’t simply add, fluxes don’t simply add, and ice cubes can’t boil water.
Also you can add — “CO2’s 15μ photon can NOT raise Earth’s 288K surface temperature”.
“Hes treating all photons as energy, with no regard for photon frequency.”
Frequency determines energy. If a photon is abs.0rbed by a body, then it deposits its energy in the body.
Where else could it go?!
And DREMT made clear that you think photons will be abs.0rbed and obey Kirchhoffs Law, so…
Clint,
So you admit fluxes can be added, that’s nothing new nor does it damage the GHE.
“Also you can add CO2s 15μ photon can NOT raise Earths 288K surface temperature.”
Not by themselves, but when added to the photons from the Sun, what we get is an increase in temperature.
Which we are observing as we speak.
So, both Tim and bob are capable of freely and easily admitting that the photons need to add at the surface. Amazing how much resistance to that idea some people put up…
…in any case, Clint R’s photon absorp.tion model makes it clear that the 15μ photons will not raise the temperature of the surface beyond the temperature the Sun warms it to. Same as the photons from the other cube will not raise the temperature of the receiving cube beyond the temperature that the Sun warms it to.
DREMPTY,
“So, both Tim and bob are capable of freely and easily admitting that the photons need to add at the surface. Amazing how much resistance to that idea some people put up”
I should be more clear, that it is the energy of the photons that adds up.
“in any case, Clint Rs photon absorp.tion model makes it clear that the 15μ photons will not raise the temperature of the surface beyond the temperature the Sun warms it to.”
It should also be clear that Clint’s model is faulty, and Clint is not one that should be believed when it comes to how light and matter interact.
“in any case, Clint Rs photon absorp.tion model makes it clear that the 15μ photons will not raise the temperature of the surface beyond the temperature the Sun warms it to”
which depends on its heat loss rate, which depends on the temperature of its surroundings, as you should know from experience.
In your experience does an object placed in the sun with surroundings at T = 10 C, warm as much as when its surroundings are T = 40 C?
“I should be more clear, that it is the energy of the photons that adds up…”
I got what you meant.
“It should also be clear that Clint’s model is faulty, and Clint is not one that should be believed when it comes to how light and matter interact.“
I take neither Tim nor Clint R at their word. Neither supported their model with any reference, I simply note that Clint R’s model aligns with experience. Passive objects don’t warm up when you bring them closer together, in sunlight.
Nate is at it again — “If a photon is abs.0rbed by a body, then it deposits its energy in the body.”
Ignoring the fact that Nate can’t spell “absorbed”, he does accidentally include the keyword, “if”.
A photon has to be compatible with a surface to be absorbed. If not absorbed, the photon gets reflected. If it is absorbed, its frequency has to increase the average kinetic energy of the mass to raise the temperature.
That’s why Nate can’t boil water with ice cubes.
DREMT says: Neither supported their model with any reference, I simply note that Clint R’s model aligns with experience.”
DREMT, study how we detect temperature. Start here:
https://www.drroyspencer.com/2023/06/uah-global-temperature-update-for-may-2023-0-37-deg-c/#comment-1493684
“So, both Tim and bob are capable of freely and easily admitting that the photons need to add at the surface. Amazing how much resistance to that idea some people put up”
And they will also admit that the heat flow is never from the surroundings the heated object.
“Now, add a third molecule, with a motion of 30. The average now becomes (30 + 30 + 60)/3 = 40. Note energy was added, but the temperature drops.”
Photons are not molecules. Adding photons does not increase the mass of the body as in Clints horrible analogy.
Nate’s back on “ignore”, by the way. He had his chance over on the other thread, but he refused to concede even the slightest point, as usual, and kept the debate going weeks longer than it needed to.
He’ll use the “ignore” to his own advantage in this thread, no doubt.
“In your experience does an object placed in the sun with surroundings at T = 10 C, warm as much as when its surroundings are T = 40 C?”
He won’t say, so I’ll give DREMT a hint:
No.
Quite obviously the T of the surroundings determines how much the object can warm in the sun.
Nate must believe when I say “molecule”, that means “photon”! He’s so confused.
I try to keep my explanations as simple and clear as possible, but some children still can’t understand….
Clint,
“If not absorbed, the photon gets reflected.”
Nope, you forgot transmitted and scattered.
So you get 50%, which is not passing.
Clint,
https://www.drroyspencer.com/2024/07/uah-global-temperature-update-for-june-2024-0-80-deg-c/#comment-1678416
The average kinetic energy of two things with a motion of 30 and 60 is 47.
Kinetic energy is mass times the square of velocity.
No credit for this one, you get a zero.
“but he refused to concede even the slightest point, as usual, and kept the debate going weeks longer than it needed to.”
Which was not enough for DREMT, as he brings it up again here!
And continues his illogical thinking.
“Nate must believe when I say molecule, that means photon! Hes so confused.”
Clint wants to ‘teach us’ how massless photons behave, so he substitutes molecules with mass.
And gets himself completely confused!
Loser.
This is the kind of crap the children throw against the wall:
bob doesn’t understand that scattering is a case of reflection. Nor does he understand that CO2 photons do not transmit through Earth. Nor does he understand averaging energy.
What will he try next?
Clint,
If I show a reliable source that says this is wrong
“bob doesnt understand that scattering is a case of reflection.”
Will you post nothing for the next 30 days?
Sorry, bob, but your usual pedantic point-scoring won’t win you any arguments. You have two possible ways to win:
1) Provide a reference supporting Tim’s photon absorp.tion model.
2) Conduct an experiment demonstrating that passive objects warm up when you bring them closer together, in sunlight.
Otherwise, the Green Plate, and House, Effect remain utterly annihilated.
DREMPTY,
“Sorry, bob, but your usual pedantic point-scoring wont win you any arguments. You have two possible ways to win:
1) Provide a reference supporting Tims photon absorp.tion model.
2) Conduct an experiment demonstrating that passive objects warm up when you bring them closer together, in sunlight.
Otherwise, the Green Plate, and House, Effect remain utterly annihilated.”
Those two items are irrelevant to the point I was making.
Anyway, here is a cite supporting Tim.
“In physics, absorxption of electromagnetic radiation is how matter (typically electrons bound in atoms) takes up a photon’s energy and so transforms electromagnetic energy into internal energy of the absorber (for example, thermal energy).[1]”
When matter absorbs a photon, the energy is turned into thermal energy making the temperature of the matter increase.
The green plate effect and the greenhouse effect survive your annihilation.
just google photon absorp.tion for the missing cite
“1) Provide a reference supporting Tims photon absorp.tion model.”
Why not the same demand for Clint?
“2) Conduct an experiment demonstrating that passive objects warm up when you bring them closer together, in sunlight.”
Why not the same for your side?
Clearly the DREMT standard of evidence is quite different for the ‘favored’ vs the ‘unfavored’ theory.
Maybe you guys can tell us the last time you measured the temperature of ANY object in the sun, and how it changed under different ambient conditions, or different random configurations that you happened to encounter?!
Bwa ha ha ha!
bob…how does your quote support Tim any more than it supports Clint R?
Clint suggests: “Temperature is a result of molecular kinetic energy, which is related to vibrational frequency.”
Partly right. And when people understand the other part, they will be closer to understanding the physics involved.
Vibrational frequency is directly related to the quantum mechanics associated with the structure of the molecule. For example, CO2 has 3 fixed vibrational frequencies:
20 GHz (corresponding to 83 meV and 15 um)
40 Ghz (corresponding to 165 meV and 7.5 um)
70 GHz (corresponding to 291 meV and 4.3 um)
https://webbook.nist.gov/cgi/cbook.cgi?ID=B4000020&Mask=800
These frequencies do NOT change with temperature!
What DOES change is the quantized AMPLITUDE of the vibration. The hotter the molecule, the more likely it is to vibrate with any of these fixed frequencies. A CO2 molecule could vibrate @ 20 GHz with 0x83 = 0 meV of energy, or 1×83 = 83 meV of energy, or 2×83= 166 meV of energy, or 3×83 = 249 meV, etc. Jumping up each of these levels involves absorbing a 15 um IR photon (or gaining energy in a collision with another molecule). Falling down each of these levels involves emitting a 15 um IR photon (or losing energy in a collision with another molecule).
The correct statement is “Temperature is a result of molecular kinetic energy, which is related to THE AMPLITUDE AT EACH vibrational frequency.”
Absorbing one 15 um photon gives the molecule of CO2 some energy in the 20 GMz vibrational mode. Absorbing two 15 um photons gives the molecule more energy in the 20 GHz vibrational mode. More 15 um photons = more energy = more energy to share = hotter gas.
(This is still a bit of a simplification, but MUCH better than Clint’s original.)
1), 2), or concede, Tim.
DREMPT,
This is what you asked for
“1) Provide a reference supporting Tims photon absorp.tion model”
And that’s what I provided.
DREMT,
Here is Clint’s model of photon absorxption.
“A photon has to be compatible with a surface to be absorbed. If not absorbed, the photon gets reflected. If it is absorbed, its frequency has to increase the average kinetic energy of the mass to raise the temperature.”
It’s wrong, because it is the energy of the photon that increases the average kinetic energy of the mass, and if the surface emits it, it can take it up.
So the photon adds the energy, just like the mass loses the energy when it emits a photon of the same energy/wavelength/frequency.
That’s why a 15 micron photon adds heat/energy to the surface of the Earth, because the surface of the Earth cools when it emits a 15 micron photon.
I asked you a question, blob. Your failure to answer says it all.
…and, for the record…
This is Clint R’s model of photon absorp.tion:
https://www.drroyspencer.com/2024/06/uah-global-temperature-update-for-may-2024-0-90-deg-c/#comment-1673566
and this is Tim’s:
https://www.drroyspencer.com/2024/06/uah-global-temperature-update-for-may-2024-0-90-deg-c/#comment-1674101
DREMT
1) I have no idea what you think “Tims photon absorp.tion model” is. Photons get absorbed. Their energy goes into the object that absorbed them, adding to the object’s thermal energy. That is my model for the issues at hand.
2) Lets break this down into two parts.
A) Do you agree that objects are warmed by sunlight? Put some black sheets of metal in sunlight and they will get quite warm.
B) Do you agree that the temperature of a heated object depends on the temperature of the surroundings? Put one of those black sheets out on a sunny winter day and one on a sunny summer day (same amount of sunlight). The summer sheet will be warmer. The warmer the surroundings, the warmer the heated object will be.
Both are 1000% supported by experiment.
So one sheet of metal in the sunlight with cool surroundings will reach some warm temperature. Now make the surrounding warmer eg by bringing another warm sheet nearby. This makes the first sheet warmer still. I can’t figure out way anyone would find this the least controversial. The temperature of the surroundings matters.
“I have no idea what you think “Tims photon absorp.tion model” is”
Well, that’s bizarre, as in the preceding comment I linked to it.
“I can’t figure out way anyone would find this the least controversial.“
I can’t figure out why you keep diverting to “surroundings”. The “surroundings” remain the same temperature, the two passive objects are brought closer together, in sunlight, and it’s not the least bit controversial that in nobody’s experience do those two objects get warmer. If you think they would, it’s on you to do the experiment to demonstrate they would. You keep acting like we’re talking about one of the objects being warmed by the other object. No. It’s both objects getting warmer that we’re looking for.
“I cant figure out why you keep diverting to surroundings.”
Idk maybe because nearby objects are part of the surroundings.
People are working overtime to play very dum.
If one of the objects was nice and shiny and reflective, and the other was matt and black, the black object might get warmer because the shiny object is reflecting more of the Sun’s rays onto the black object. It’s not like the black object is going to make the shiny object warmer, though! Or, if both objects were shiny, they shouldn’t both warm. That would make no sense.
This was all discussed previously, anyway. Just bringing that up in case anyone tried reflection again.
DREMT,
“Five photon frequencies are absorbed by a surface, 6, 7, 8, 9, and 10. The average frequency is 8. Now, let a sixth photon, with frequency 7, be absorbed. The average frequency is then 7.83. Another photon was added, yet the average frequency DROPPED. Refer to this brief explanation of temperature, if needed ”
Or
“In physics, absorp.tion of electromagnetic radiation is how matter (typically electrons bound in atoms) takes up a photon’s energy and so transforms electromagnetic energy into internal energy of the absorber (for example, thermal energy).[1]”
Find a Physics teacher to explain to you which one is correct and which one is a bunch of malarky.
Homework if you will.
Your lack of education in Physics does not confront me.
Experience:
Can anybody describe a specific instance where they paid close attention to the T change, much less measured it, for objects in the sun, which were then, randomly, brought together?
If not, then this is not evidence of anything.
The physics of why this happens is clear, easy to understand, and well tested.
The T of heated objects depend on the T of the objects surrounding it, in everyone’s experience, except DREMTs apparently.
Demanding an experiment is simply an admission that they do not understand basic heat transfer principles or simple logic.
Again…how does your quote support Tim any more than it supports Clint R?
DREMT,
Five photon frequencies are absorbed by a surface, 6, 7, 8, 9, and 10. The average frequency is 8.”
What part of this is wrong, do you not understand?
“
So, you still cannot answer my question.
DREMT,
Well, both models indicate that a 15 micron photon will add energy which becomes heat when absorbed by a surface.
Even though Clint’s model uses frequency when it should be using energy, that’s why its wrong.
A photon with frequency of 6 has an energy of 2.48 * 10^-11 mEv, or 4 * 10^-33 joules.
Clint R is obviously just using random units and numbers to make a simplified point, bob. He’s not suggesting that the photons absorbed have frequencies of 6, 7, 8, 9, and 10 Hz.
You’re still just evading the question and getting more into your pedantic point-scoring.
Sorry DREMT,
That’s exactly what Clint said.
He never said 6, 7, 8, 9 and 10 Hz, bob. He just said 6, 7, 8, 9 and 10. Since the units and even the numbers themselves aren’t especially relevant to his point.
You’re still evading the question.
DREMT,
Clint jumps to the conclusion that 15 micron photons can’t increase the temperature of an object.
Tim has all photons that get absorbed add energy to the object.
That’s the difference, Tim is correct and Clint is wrong.
Go ask a physics teacher if you don’ believe me or Tim.
It’s not a question of choosing who to believe. Tim’s photon absorp.tion model leads to the conclusion (and Tim has defended this) that passive objects will spontaneously warm up when you move them closer together, in sunlight. Now, I tried to explain why this was nonsensical, e.g. here:
https://www.drroyspencer.com/2024/06/uah-global-temperature-update-for-may-2024-0-90-deg-c/#comment-1675859
but really it’s just a question of acknowledging the fact that it’s not something that’s known to happen. That means Clint R’s view aligns with experience.
“but really its just a question of acknowledging the fact that its not something thats known to happen.”
in DREMTs experience, which is vague and therefor useless.
What is known to be true, in most people’s experience, is that heated objects in cold surroundings, can warm, if any part of the the surroundings become warmer.
Stand next to an open freezer, and your skin feels cold, now close the freezer door. A portion of the surroundings has changed from cold to room temperature, and your skin feels warmer!
It takes little brain power to figure out that moving another sun-heated object near to the first one replaces a part of the cold surroundings of the first object with a warmer one.
And thus both sun-heated objects will warm.
DREMT,
” Tims photon absorp.tion model leads to the conclusion (and Tim has defended this) that passive objects will spontaneously warm up when you move them closer together, in sunlight. Now, I tried to explain why this was nonsensical, e.g. here:”
That is what using an energy balance would show, however in practice it will be difficult to measure the temperature increase.
And you relied on your debunking of the GPE to explain why you think it’s wrong.
So we are back to your non-debunking of the GPE.
I am not going to discuss the GPE again, your debunking of it has been dismissed, experimental evidence has shown it to be real.
As hinted at in the linked comment, it doesn’t make any sense for both objects to warm. Tim kept mentioning "surroundings", and I guess he’s trying to suggest that one of the objects (A) is part of the "surroundings" for the other object (B). He’s trying to say that if the "surroundings" for one of the objects (B) gets warmer, then that object (B) will warm. Trouble is, that object (B) is part of the "surroundings" for the other object (A), so where does it end!?
Regardless, neither (A) nor (B) will warm if Clint R is correct, and that aligns with everyone’s experience, as far as I know. I’m sure someone would have said by now if they’d ever known objects to start spontaneously warming on being brought closer to each other. Or they would have linked to something or somebody saying so, or to some evidence of it ever having occurred generally.
Let’s not forget that it wasn’t long ago these people were desperately trying to scramble together some evidence for the idea that a blue plate would spontaneously warm on being separated from a green plate! Now, it’s two objects being brought closer together…
“Trouble is, that object (B) is part of the “surroundings” for the other object (A), so where does it end!?”
More incredulity.
Yet another non-argument.
“…experimental evidence has shown it to be real”
Experimental evidence has shown it to be bogus.
“It takes little brain power to figure out that moving another sun-heated object near to the first one replaces a part of the cold surroundings of the first object with a warmer one.
And thus both sun-heated objects will warm.”
Apparently some people here can’t meet that minimal brain power requirement.
And think that faux expressions of astonishment at what nature does is somehow an argument against it.
They ain’t.
"As hinted at in the linked comment, it doesn’t make any sense for both objects to warm. Tim kept mentioning "surroundings", and I guess he’s trying to suggest that one of the objects (A) is part of the "surroundings" for the other object (B). He’s trying to say that if the "surroundings" for one of the objects (B) gets warmer, then that object (B) will warm. Trouble is, that object (B) is part of the "surroundings" for the other object (A), so where does it end!?"
Just in case it wasn’t clear, by "so where does it end!?", I meant "so where does the warming end!?", since (and I had assumed this was obvious) as (B) is part of the "surroundings" for (A), if (B) warms then supposedly (A) warms some more, which means the "surroundings" for (B) has got a little warmer, which then means (B) supposedly gets warmer still, which then means the "surroundings" for (A) has got a little warmer, which then means (A) supposedly gets warmer still…and so on.
“”so where does it end!?”, I meant “so where does the warming end!?”, since (and I had assumed this was obvious) as (B) is part of the “surroundings” for (A), if (B) warms then supposedly (A) warms some more, which means the “surroundings” for (B) has got a little warmer, which then means (B) supposedly gets warmer still, which then means the “surroundings” for (A) has got a little warmer, which then means (A) supposedly gets warmer stilland so on.”
No logic or common sense applied here.
Logic: If A and B warm, they lose MORE heat from all of their exposed sides, which BALANCES the effect of reduced heat loss on one side.
Common sense: Stand close to someone on a cold day. Both feel a bit warmer, but nobody melts!
“That is what using an energy balance would show, however in practice it will be difficult to measure the temperature increase.”
So there would definitely be a temperature increase when two passive objects (so, objects with no internal heat source, e.g. not a human being) are brought together in sunlight, it’s just you won’t be able to measure the temperature increase. Right.
DREMT,
“its just you wont be able to measure the temperature increase. Right.”
Right, that’s not what I said.
You said “it will be difficult” to measure the temperature increase. Probably because there won’t be one to measure…but by all means, do the experiment and prove me wrong. Or, find some support for Tim’s photon absorp.tion model. Or, perhaps just keep responding to me, day after day, week after week, until you get the last word, which is all you people really care about, anyway.
DREMT,
“Or, find some support for Tims photon absorp.tion model.”
I have already posted support for Tim’s photon absorp.tion model.
https://en.wikipedia.org/wiki/Absorp.tion_%28electromagnetic_radiation%29
No, bob, you haven’t, because:
https://www.drroyspencer.com/2024/07/uah-global-temperature-update-for-june-2024-0-80-deg-c/#comment-1678683
DREMT,
https://geo.libretexts.org/Bookshelves/Meteorology_and_Climate_Science/Book%3A_Fundamentals_of_Atmospheric_Science_(Brune)/07%3A_Applications_of_Atmospheric_Radiation_Principles/7.03%3A_Atmospheric_Radiation_and_Earth%E2%80%99s_Climate
“At Earths surface, there is the incoming solar radiation energy that is absorbed and the tropospheric downward emitted infrared radiation, equivalent to three times the incoming solar radiation energy that is absorbed.”
Combine that with what I previously posted, about that energy being transferred into thermal energy of the surface.
bob, Tim’s photon absorp.tion model is a very specific set of rules:
"An object has 100 atoms. These have a total energy of 1000 units; an average of 10 units per atom.
Five photon “energies” are absorbed by a surface, 6, 7, 8, 9, and 10 units. The average energy is 8 units. This makes the total energy 1000 + 6+7+8+9+10 = 1040 units. The average energy of the 100 atoms is now 10.4 units per atom; they are slightly warmer than before.
Now, let a sixth photon, with energy 7, be absorbed. The total is now 1047 units. Another photon was added, and again the average energy ROSE, to 10.47 units/atom. Even though the energies of the photons were LOWER than the average energy of the atoms, the atoms still warmed up. .
Short and sweet, thats why a 15μ photon WILL raise the temperature of a 288K surface."
I’ll accept nothing less than direct support for those rules. You won’t find it, as it would have been posted by now if anyone could.
Tim’s model has only two rules.
Photons are absorbed.
Photons add energy to the surface.
Which is supported by the cite I provided.
“In physics, absorp.tion of electromagnetic radiation is how matter (typically electrons bound in atoms) takes up a photon’s energy and so transforms electromagnetic energy into internal energy of the absorber (for example, thermal energy).[1]”
From
https://en.wikipedia.org/wiki/Absorp.tion_%28electromagnetic_radiation%29
You have to remove the period, the right one of course.
What’s the game, bob? You repeat yourself, I link to the comment debunking what you said again, you repeat yourself again, and then I link to the comment again? Last person to repeat themselves wins, is that how it works? What’s the point?
I’ve explained why your quote doesn’t settle the issue between Tim and Clint R. Yet you just keep repeating it.
DREMT,
“I link to the comment debunking what you said again,”
Please explain how the comments you post, debunk anything,
This comment:
https://www.drroyspencer.com/2024/07/uah-global-temperature-update-for-june-2024-0-80-deg-c/#comment-1678683
refutes your repeated assertion that your quote settles the issue in Tim’s favour. You even started your response to it with, “that may be true”.
DREMT,
No evidence trumps scientific evidence.
That’s the hallmark of a cult.
Yes, I agree, bob…you’ve got NOTHING, as some might say.
Yea, I got nothing.
Nothing but mounds of evidence, the work of 97% of the world’s scientists. The laws of physics and thermodynamics.
All you got is crap thrown on the wall.
If you say so, bob. Will that be all? Was extraordinarily bored of talking to you several days ago. Let alone now.
DREMT,
I am sorry you find real science so boring.
Not what I said, bob.
“the difference between their photon absorp.tion models is in to what extent absorbed photons of a particular frequency can increase the temperature of the matter.”
Makes no sense. Photons are absor.bed or not. If so, then by definition, the energy is added.
Whether the T is raised has nothing to do with that fact. It has only to do with the NET of input energy and output energy.
So a lower freq photon is absor.bed and
-if no photon is emitted, then the T goes up.
-if a higher f photon is emitted, then the T goes down.
-if a lower f photon is emitted than the T goes up.
In reality it is only after billions of such events will we know the NET result.
Nate is after the last word, as usual.
Still no science, just feelings from our last word king.
As usual, Nate is after the last word.
ken…”Im struggling with this. Happer Wijngaarden show the GHE effect of 400 ppm CO2 to be approx 30Wm-2. They show that doubling CO2 to 800 ppm increase GHE by another 3Wm-2″.
***
Happer is wrong according to the Ideal Gas Law and the heat diffusion equation.
Don’t get me wrong, I like Happer, I simply disagree with some of the tenets upon which he depends, finding them uncomfortably close to alarmist pseudo-science.
Gerlich and Tscheuschner showed, using the heat diffusion equation that a doubling of CO2 could produce no more heat than 0.06C for every 1C of atmospheric warming. Since W/M^2 is a measure of heat, as is temperature, the two figures, 0.06C and 3 W/M^2 are hardly compatible.
***
From their link…”Calculated top-of-the atmosphere spectral
intensities are in excellent quantitative agreement with satellite measurements at various latitudes”.
This tells us nothing. It is presumed that the sat telemetry is accurately detecting IR frequencies from CO2. That’s not possible since the WV spectrum overlies the CO2 spectrum. Ergo, all of the measurement are calculated via inference, and likely adjusted to compare with the sats.
Not to be deterred by a few inconvenient facts they go on…
“Also calculated are per-molecule forcings in a hypothetical, optically thin atmosphere….”.
What was that, more calculations, this time in a hypothetical optically-thin atmosphere” On a per molecule basis!!!?
Then, in the Intro…
“Greenhouse warming of Earths surface and lower atmosphere is driven by radiative forcing, F , the difference between the flux of thermal radiant energy from a black surface through a hypothetical, transparent atmosphere, and the flux through an atmosphere with greenhouse gases, particulates and clouds, but with the same surface temperature[“.
More hypothetical claptrap, none of it measured. However, it reveals radiative forcing for what it is, a calculated, inferred quantity that has never been measured in the atmosphere. The statement above from Happer et al make it clear that forcing is nothing more than a theory taken from climate modelers, who in turn, stole the concept from differential equation theory.
***
Next they offer this astounding and somewhat arrogant statement…
“So we include material that is common knowledge to a small number of experts, but little known to the larger scientific community”.
That sets up the graph that follows, where they cite no source, so we have to take their word for it. It appears the graph comes from a small number of experts, who are unknown, and the rest of the Great Unwashed are not privy to that info.
In summary, the entire paper is nothing more than theory based on statistical inference. There is not a shred of scientific research to support most of it. Also, Happer et al are basing their definition of radiation on the old (19th century) idea that radiation is heat. It is fundamentally wrong to claim radiation as having power measured in w/m^2. Radiation can produce heat in a body and the heat can be measured in w/m^2, but radiation has no measure per se.
As I have stated many times, the watt is a fundamental measure of mechanical energy. It is based on the horsepower with a conversion factor between that mechanical power and electrical power, that is the mechanical power that can be delivered by an electric motor.
The watt can be applied to heat but not directly since that quantity is an equivalent, not a one to one relationship. In other words, heat and work have nothing in common as phenomena. The actual measure of heat is the calorie, which states the number of degrees C that 1CC of water will rise when heated.
As you have INCORRECTLY stated many times.
And now you compare units from two different systems of units. Only Yanks use the calorie. And the equivalent metric unit is the JOULE, not the Watt.
You must have paid someone to pass your exams. Or your FF employers did.
Gordon,
Again, you tread in scientific areas in which you have no knowledge.
“but radiation has no measure per se.”
Louis, Henri, and Marie beg to disagree, having three Nobel prizes between the three of them.
And units of radiation named after them.
Ideal Gas Law: PV=nRT
Nowhere is there any discussion on Ideal Gas Law about radiation, absorp*ion, and emissivity.
Ideal Gas Law is basic chemistry. It hasn’t much application in Boltzmann or Schwarzschild equations.
Beryl is approaching Houston.
https://i.ibb.co/6n8hM0j/Screenshot-2024-07-08-08-00-18.png
ken…”Part of my flawed understanding of GHE is that energy must radiate to space. That means a GHE gas is the only way to cool the atmosphere”.
***
Part of your understanding seems to be that all surface radiation can only move from surface to space via GHGs. In reality, 90% of surface radiation finds its own way to space, with CO2 absorbing 10% or less.
The problem with the entire theory is that conduction/convection is minimized to very low value in th energy budget. The opposite is the reality. Most heat dissipated at the surface is via conduction to surface air molecules which rise naturally via convection. Furthermore, conduction/convection is 260 times more efficient at dissipating surface heat.
A fact that is missed in the theory is that heat rising by convection is dissipated naturally within the atmosphere. I noticed in Happer’s work that he references heat via entropy and by doing that, he misses the physical connection between heat and air molecules. Heat is the energy related to atoms/molecules and if you thin out the molecules, as happens as air parcels move into higher altitudes, the heat in the parcel is dissipated naturally.
I have never seen that fact addressed in any theory, likely because most gases are not subjected to a gravitational field. That field changes everything, it allows gases to expand naturally as they rise, and as they expand, they lose heat naturally.
We have been cursed by the notion that energy must be conserved. Unfortunately, those who inferred that law have associated it with the 1LOT, where it is true. In an enclosed system with heat and work, energy must be conserved. That’s simply not true in the atmosphere, heat does not have to be changed to another form of energy, it simply disappears.
A fairly amount of Energy is wasted by “trying to” warm our permanent ice sheets. Or evidence we are in in Ice Age. And other evidence is our cold ocean. They say more the 90% of global warming is warming the cold ocean- again, a rather futile thing to try to do if you looking periods of time, less than a century {or 5 centuries}.
And more important, how much more than 90%??
Billions of dollars thrown at it, and no real science coming for this destructive waste of our money. The money is likely hindering rather than doing much- as the decades of time, prove.
What good is having bunch of weasels and liars??
Gbaikie
Global Ocean Heat Content changes account for approximately 90% of the total heat increase in the past fifty years, while land heating, ice melting, and atmospheric warming contribute around 5%, 3%, and 1% respectively.
https://www.nature.com/articles/s41598-023-49353-1
Note that ice melt does not directly increase temperature. When you turn ice at 0C into water at 0C the energy required ends up as latent heat.
Another example of Gordo’s ignorance of thermodynamics. He wrote:
So, as convection is a loop process which includes both sinking air as well as rising air, when the air sinks, it warms and the “dissipated” heat miraculously re-appears, (minus the energy lost to space by IR radiation).
Great work, Gordo!
Followup: Houston puts Bobby onto Beryl.
Antonin, please stop t-word-ing.
https://www.theguardian.com/environment/article/2024/jul/08/temperatures-1-point-5c-above-pre-industrial-era-average-for-12-months-data-shows
https://i.guim.co.uk/img/media/3038c632c50a982e64dbdf8dbde5090ce8fdf315/0_216_3244_1947/master/3244.jpg
Not according to NOAA. They say that the pre-industrial baseline puts anomalies 0.3C above theirs, and only 10 of the past months were above +1.2.
Also don’t forget that there would have been warm periods back then. It is wrong to compare peaks now to averages then, just as it is wrong when deniers compare lows now to past averages. Or worse … today’s lows to past highs.
But Copernicus says we are at +1.28, which sounds about right … +0.98 against the NOAA baseline.
So where is that catastrophe they predicted ???
What catastrophe are you referring to?
Go play Twerpy with somebody else
You’ve made that word for 10-year-olds your own.
Rubbish…no one can say for sure what the pre-Industrial average was. It’s based on wild guesses based on ice core proxies.
https://i.ibb.co/d6tM41j/Screenshot-2024-07-08-08-24-44.png
-Beryl intensifies into hurricane as Texas braces for storm surges and flash flooding: Live updates
Beryl to pick up strength on its path towards Texas to become a Category 2 hurricane –
https://www.independent.co.uk/news/world/americas/hurricane-beryl-live-tracker-landfall-warnings-houston-b2575764.html
“Tropical storm Beryl has intensified into a hurricane and is expected to strengthen further before its expected landfall tonight on Texass southeast coast.
The hurricane is hurtling towards Houston with maximum sustained winds of 75 mph (120 kph) and is 105 miles (170 km) east of the city of Corpus Christi, the National Hurricane Center said.
It is expected to be a Category 2 storm by the time it makes landfall near Houston.”
…
“Beryl has already left a trail of destruction as a Category 5 hurricane through Mexico and the Caribbean.”
https://i.ibb.co/3dmBpzx/Screenshot-2024-07-08-10-03-42.png
https://i.ibb.co/7QS7RBs/Screenshot-2024-07-08-12-01-14.png
“it has lost energy and is now only a tropical storm, not likely to reach hurricane status again”
That was Clint displaying his expertise in the science of meteorology/climate.
Poor Ant is so desperate to find some way to attack me that he can’t even comment in the correct thread!
Weatherzone
There are increasing signs that a prolonged cold snap is on its way to southeastern Australia from Antarctica later this week into next.
So … normal winter variability then.
It’s all normal weather variability….hot and cold.
Otherwise known as Winter.
yes, Bob, just as climate propaganda is represented by summer.
Gordon,
That’s an increase in global average temperature, and it’s true, not propaganda.
bobdroege, please stop t-word-ing.
DREMT,
Please stop circumventing Dr. Roys attempts at moderating the blog.
bobdroege, please stop fishing for another ban.
DREMT,
There has to be a first ban in order for there to be another ban.
Swen.son, bob. Obviously that’s who I’m referring to.
bobdroege, please stop t-word-ing.
https://oz4caster.wordpress.com/wp-content/uploads/2024/07/d1-gfs-gta-daily-2024-07-07.gif
https://oz4caster.wordpress.com/wp-content/uploads/2024/07/d4-gfs-gta-daily-2014-2024-07-07.gif
Can you post updated versions of your graphs with the smoothing functions?
The above are not mine. They appear when Roy updates his data.
I know. I’m curious to see what yours look like now.
bdgwx
How would the UAH graphics of Blindlsey H00d suddenly be different from the version he posted a month ago?
Ok, yeah, I see it now. It might not be substantially different after only one month.
https://climatedatablog.wordpress.com/wp-content/uploads/2024/05/uah-global.jpeg
bdgwx
I omitted a possibility for his new graph to substantially differ from the previous one: to finally admit that his median computation is wrong.
Here is his version:
https://climatedatablog.wordpress.com/wp-content/uploads/2024/06/uah-global.jpeg
And here is mine, based on exactly identical calls to the AVERAGE and MEDIAN functions in a ~ 40 year old spreadsheet calculator:
https://drive.google.com/file/d/1UTXSx8fYuMUsQVio9V71vOBbD-kf-pnP/view
*
But Blindsley H00d aka RLH never has ever admitted being wrong.
*
Amazing anyway is the extremely small difference between cascaded running mean and cascaded running median when looking at their respective third order polynomial computed for the active UAH 6.0 LT anomaly window in a 12/10/8 cascade:
– C3RMean: start at -0.342, end at +0.268
– C3RMedian: start at -0.339, end at +0.262
The same level of difference can also be observed when comparing the polynomials of simple or cascaded series in the mean and median cases.
https://i.ibb.co/YprwHg9/ventusky-rain-3h-20240708t1500-34n93w.jpg
Infrared Forcing by Greenhouse Gases
W. A. van Wijngaarden1 and W. Happer 2
1Department of Physics and Astronomy, York University, Canada 2Department of Physics, Princeton University, USA June 18, 2019
Infrared-Forcing-by-Greenhouse-Gases-2019-Revised-3-7-2022.pdf (co2coalition.org)
In the article there is a major conflict assump.tion:
( thermal-equilibrium radiation
at the temperature T0 = 288.7 K)
Example:
“Figure 23: The continuous blue lines are the powers Π{i} (T, T) of (111), emitted by a single greenhouse-gas molecule at the temperature T. The dotted red lines are the powers Π{i} (T, T0) of (110) absorbed by a single greenhouse molecule at the temperature T from thermal-equilibrium radiation at the temperature T0 = 288.7 K, shown by the horizontal green line. The blue circles and red squares are the analogous powers from the harmonic oscillator approximation of (148), summed for all vibrational modes of the molecule shown in Table 8 of the Appendix. The emitted and absorbed powers are well modeled with harmonic oscillators for all gases except for the asymmetric-top molecule, H2O, where most of the power is emitted and absorbed by pure-rotation transitions.”
(emphasis added)
–
Comment:
Planets and moons do not emit at their average surface temperatures. Earth doesn’t emit at 288.7 K.
–
https://www.cristos-vournas.com
christos…Will Happer is a good guy. He stated that climate change theory is a scam, that he’d settle for hoax, but scam is his preference.
I don’t understand why he’d put out such a paper based purely on statistical inference and models. There is no scientific proof to support what he is claiming, especially analyzing molecules down to the molecular level.
The warmer temperature and higher CO2 is overwhelmingly beneficial
Elevated CO2 and warmth are 70% and 8% responsible, respectively, for a much greener, more vegetated landscape across the world since the 1980s.
https://onlinelibrary.wiley.com/doi/10.1111/ajes.12579
Net zero is an insane apocalyptic idea. It will not have the desired effect. Millions, possibly billions of people will die during the ensuing economic calamity.
“Millions, possibly billions of people will die during the ensuing economic calamity.”
Talk about fear mongering.
There’s a ropadope coming. Between overpopulation, resource depletion and climate change I would be very surprised if our high tech, high consumption civilization lasts till the end of the century.
Net zero might mitigate the climate change, but we are not going to stabilise population in time to avoid the collapse which resource depletion will bring.
LMAO!!
there would be no end to the laughter if it wasn’t so psychotic.
eman thinks we should ruin the economy over unfounded fears of a climate disaster when the whole thing is about consulting fees paid to favored institutions not different than the military industrial complex which is an unholy alliance of public institutions and the arms industry. here though they are trying to create a new industry.
and eman comes in to justify it by claiming the world is headed towards a world ending calamity anyway that if not for another cause why not add one.
Ent,
“but we are not going to stabilise population in time to avoid the collapse which resource depletion will bring.”
–
The population is rapidly lessens in the industrial world. The same tendencies are going on over every country on the planet. When a country’s population still grows, it grows slower, till it eventually stop growing.
–
I estimate till the end of the century, the Earth’s population will be much less than now.
Ent, whenever you go off on such an Alarmist rant, you should always mention that you also believe passenger jets fly backward.
The biggest threat mankind faces is ignorance….
John W.,
Try to think of the entire world economy with the same type of restraints seen in Venezuela, Cuba, the Soviet Union, and North Korea. It will be a calamity on a scale not seen since the fall of Rome, think The Dark Ages. That would be the effect if Net Zero comes to fruition.
Net zero is an insane apocalyptic idea. It will not have the desired effect. Millions, possibly billions of people will die during the ensuing economic calamity.
Net Zero means an end to freedom and a return to serfdom.
Nix Net Zero.
Got to love the alarmism…
The low entropy man prediction is no different than manure prediction of 1894
https://www.historic-uk.com/HistoryUK/HistoryofBritain/Great-Horse-Manure-Crisis-of-1894/
Christos Vournas says:
”The population is rapidly lessens in the industrial world.”
And pollution goes down even faster. The North Pacific is a lot more polluted than the North Atlantic because Asia is up wind of the North Pacific and the US and Canada are upwind of the North Atlantic. Poor populations pollute far more than developed economies. And I am talking about real pollution not cheap fakes like calling CO2 a pollutant.
—————
Fact is the greatest danger to us is people like eman who damages economies, stalls development of the 3rd world by ridiculous and unneeded standards. That makes both more babies, more pollution, more plastic in the ocean, you name it.
Well it’s been somewhat hot here, today a bit cooler reaching 112 F, most week will be over 100 F, it dis have couple day peaking at 115 F, but it can can much hotter.
Anyhow, using the air conditioner a fair amount. Even at nite.
We get temps that high 150 miles NE of Vancouver in Lytton, BC. Right now it’s only 32C, so what makes it suddenly explode to 45C? Must have a lot of CO2 emissions up there at certain times of the year. [sarc /off].
ps. we’re apparently having a heat wave here right now. I call it summer.
“Net zero is an insane apocalyptic idea. It will not have the desired effect. Millions, possibly billions of people will die during the ensuing economic calamity.”
Net Zero means an end to freedom and a return to serfdom.
Nix Net Zero.
It’s not going to happen. There will be civil war before it happens. No one is going to give up on fossil fuels based on the hysterical ravings of eco-loonies.
“Its not going to happen.”
It is happening. You’d best check your local council website for ICLEI.
You’ll give up fossil fuels when they run out.
https://www.resilience.org/stories/2018-03-12/the-world-oil-supply-is-infinite-i-know-that-because-i-believe-it/
Ent, which will happen first:
a. Cultists will start facing reality, or
b. Earth will run out of oil?
Clint R
Maybe you can answer your own question.
You Ask “a. Cultists will start facing reality”
Yes when will you do this? Will oil run out first (estimated maybe 70 years left). You have zero physics on your side. You make up your own version of science. You totally reject all information, facts, measurements, valid textbook science that don’t support your very limited and simplistic (child level) thought process.
So will you answer or avoid this as you do when asked to present valid evidence for even one of your many made up claims (such as photons from a colder source will just bounce off a hotter surface, total made up with no supporting evidence…things you read on some blog).
Norman, are you stalking me again?
I’ve explained that if you want me to teach you physics, you must quit your childish insults and false accusations.
Grow up, and I’ll try to help.
Clint R
I guess than your answer would be we would run out of oil before you can accept reality.
You use the same tactic when cornered. Rather than support you opinions and bad science you just divert and attack the one telling the truth about yourself. You are similar to when you told Gordon Robertson he is a fraud. Rather than accept he does not know any real physics he went on the defensive against you. You do the same as he. You can’t support your science so you childishly attack me.
You claim I need to grow up. You could not help with any science as I have asked you many times to support you claims and you divert away with no supporting evidence. Most posters here know you are phony. You just keep it up pretending. Intelligent people see through your shallow defense.
Ask for evidence. None given. Clint R motto “No evidence, no problem!” if one does not accept your bad science you call them cult minded.
Norman, you’re not making any progress.
I’ve explained that if you want me to teach you physics, you must quit your childish insults and false accusations. You can’t do that.
Grow up, and I’ll try to help. Or just keeping stalking and rambling. Your choice.
I don’t have even a fraction of the knowledge that most people who post on this site do, but I just want to say that I’m very thankful for the work of Dr. Spencer and Dr. Christy. In a world where so many people are always trying to spin stuff, they objectively show a warming trend until 1998, followed by a cooling trend until 2015, and now a renewed warming trend/spike. I don’t have any idea what it all means. It’s just reassuring that we still have scientists who remain committed to reporting objective facts.
wayne…I agree about Roy ad John Christy. It’s good that we still have scientists of integrity in such important positions. Also, Roy and John are two of a few scientists qualified to do what they do. Most so-called climate scientists are climate modelers or those who study climate from an alarmists POV.
The trend prior to ’98 was not really a cooling trend, the trend had been depressed partly by volcanic aerosols from two volcanic eruptions. The flat trend from ’98 – 2012 was confirmed by the IPCC and it carried on till 2015. In 2016, another super El Nino caused a major spike and it’s not clear why. It was followed by at least a 6 year flat trend.
The current spike followed the Hunga Tonga volcanic explosion which drove millions of tons of water into the stratosphere. The stratosphere is normally a very dry place and very cold. There does not seem to be another explanation for the current spike, even though injecting WV into the stratosphere is not well understood.
ant…aparent quote from Clint…”it has lost energy and is now only a tropical storm, not likely to reach hurricane status again
[ant]That was Clint displaying his expertise in the science of meteorology/climate.
***
Oddly enough, I just read a meteorological report that the same hurricane is picking up strength as it reaches Houston. Are you claiming it can’t?
swannie…”So, as convection is a loop process which includes both sinking air as well as rising air, when the air sinks, it warms and the dissipated heat miraculously re-appears, (minus the energy lost to space by IR radiation)”.
***
Oh, great…Swannie has discovered the Ideal Gas Law. Now, if he’d only learn the 2LOT.
And what happens to the cold air as it descends to the surface? It picks up more heat from the surface and carries it aloft. And that heat disappears too. In other words, the atmosphere is behaving like a conveyor belt, due to gravity, and continually transporting heat from the surface and getting rid of it internally.
I can see what you’re thinking…as the cold air descends, its pressure increases and so does it’s temperature. However, that increase in T does not represent the heat removed from the surface and in order to absorb more heat the air temp has to be lower than the surface temp.
Therefore, even if the increased pressure warms the air slightly, it obviously does not warm it to the level required to equal surface temperature or exceed it. If that was the case, there would be little or no heat removed from the surface by conduction/convection. There would be no thermals, and no winds.
You must realize that the descending air is seriously cold to begin with, high in the troposphere. It obviously warms on the way down but not enough that it cannot absorb more heat from the surface.
That’s because the Earth’s troposphere is very thin, so thin that it barely holds convection and water vapor. At pressures below 0.1 bar, convection disappears.
https://www.cpc.ncep.noaa.gov/products/stratosphere/strat-trop/gif_files/time_pres_TEMP_MEAN_ALL_EQ_2024.png
ren…interesting point. I think temperature likely disappears as well, as we know it. I don’t think conventional thermometers or thermisters would work too well at such a low pressure.
These are satellite measurements. They measure the kinetic energy of oxygen particles.
Gordo wrote:
Is it possible that Gordo is beginning to figure it all out? Not likely. Gordo still can’t grasp the facts about the cause of those cold temperatures at the Tropopause. They are the result of energy loss to deep space via the Thermal IR energy leaving the atmosphere, much of which is due to greenhouse gas emissions from the Stratosphere. Without those emissions, Gordo would be spot on with his comment:
Sorry, Gordo, that energy does not “dissipate” or “disappear”, as you have repeatedly claimed. It is transferred to deep space via thermal IR radiation.
swannie…”Gordo still cant grasp the facts about the cause of those cold temperatures at the Tropopause. They are the result of energy loss to deep space via the Thermal IR energy leaving the atmosphere”.
***
It’s not that Gordo cannot grasp alarmist facts, it’s that Gordo has real facts from real science.
The reduction in heat with altitude is about gravity. It is gravity that reduces the number of molecules with altitude and a reduction in molecules is a reduction in pressure and a reduction in temperature.
Besides, 90 odd percent of surface radiation goes directly to space, bypassing all GHGs.
Swannie is claiming the opposite, that air density decreases with altitude due to a temperature reduction from CO2 emissions. That is the pseudo-science prevalent in atmospheric physics texts. They refuse to admit that the reduction of density with altitude is caused by gravity.
The texts also seem to think that adiabatic conditions can occur in a container without walls. An adiabatic condition requires that no heat can flow trough the walls of a container. That means the walls have to be an ideal insulator.
Where is such a container wall in a column of air? Heat is free to enter and leave such a column via convection.
Gordo still can’t explain the reasons for the fact that the descending air is colder than the rising air at the same altitude. Not to mention the effects of water vapor and the resulting clouds and rain fall, which intercept surface IR, preventing it’s exit to deep space.
“In other words, the atmosphere is behaving like a conveyor belt, due to gravity, and continually transporting heat from the surface and getting rid of it internally.”
You are getting closer Gordon. Consider for a moment a well-insulated syringe willed with air. If you expand it, the gas cools. When you re-compress it, it rewarms TO THE SAME TEMPERTURE. No energy is ‘dissipated’ or ‘gotten rid of internally’. Work is done EXTERNALLY on the surroundings when the gas expands and work is done by the surrounding when the gas compresses.
Same with the atmosphere. To a rather good approximation, movement of air within the atmosphere is adiabatic (hence the ‘adiabatic lapse rate’ which works well and assumes perfect insulation within the atmosphere
The ‘conveyor belt’ in the atmosphere is indeed continually transporting thermal energy upward, but the thermal energy is dissipated EXTERNALLY to space in the form of IR radiation.
The conveyor is something like …
* gain 100 J of heat from the ground.
* do 1000 J of work on the surrounding atmosphere while rising
* lose 100 J of heat to space
* have 1000 J of work done by the surrounding atmosphere while descending
… repeat.
Tim, please stop t-word-ing.
But DREMT, I enjoy teaching. And Gordon seems like he might be close to understanding.
Tim, please stop t-word-ing (the “t-word” is not “teach”).
gb…good post…worth repeating
“A fairly amount of Energy is wasted by trying to warm our permanent ice sheets. Or evidence we are in in Ice Age. And other evidence is our cold ocean. They say more the 90% of global warming is warming the cold ocean- again, a rather futile thing to try to do if you looking periods of time, less than a century {or 5 centuries}.
And more important, how much more than 90%??
Billions of dollars thrown at it, and no real science coming for this destructive waste of our money. The money is likely hindering rather than doing much- as the decades of time, prove.
What good is having bunch of weasels and liars??”
***
Any warming that has occurred following the end of the Little Ice Age, circa 1850, has been slowed by the formation of ice each season in the northern and southern hemispheres. That is due to the Earth’s orbit and axial tilt. A large amount of solar energy has gone into melting ice accumulated during the LIA.
It is claimed the planet has warmed, on average, about 1C since 1850. The Ideal Gas Law and heat diffusion equation tells us the amount of that warming due to CO2 is about 0.06C.
We are throwing a vulgar amount of money at the pseudo-science that humans have caused the warming. The amount supports the theory that this is not about warming but some cockamamey idea dreamed up by the UN to further its dream of universal taxation.
Gordon,
“It is claimed the planet has warmed, on average, about 1C since 1850. The Ideal Gas Law and heat diffusion equation tells us the amount of that warming due to CO2 is about 0.06C.”
Same old, that we have told you is incorrect, because the CO2 molecules transfer energy to the rest of the atmosphere due to collisions
The 287K or 288K are the satellite measured Earth’s average surface temperatures.
–
https://www.cristos-vournas.com
bob…did you read the part about the heat diffusion equation? That equation covers any heat spread to a gas from another gas. It tells us that CO2, with a mass percent of 0.06 in the atmosphere cannot cause a warming of more than 0.06%, or 0.06C per 1C rise in atmospheric temperature.
Th Ideal Gas Law tells us the same thing.
Gordon,
What I am trying to tell you is that the IGL and the heat diffusion equation don’t apply, you are trying to solve the wrong problem.
With the heat diffusion equation you use the thermal conductivity of air. To calculate the heat transfer though the air, it doesn’t tell you about the individual contributions of the constituent gases.
And it also has the GHE baked into the equation, because the temperature gradient is an input into the equation.
That gradient is caused by the greenhouse effect.
bob believes: “That gradient is caused by the greenhouse effect.”
Sorry bob, that’s wrong.
The gradient is caused by the movement of thermal energy from surface to TOA. You can’t even provide a viable description of your bogus GHE.
Clint,
If there was no greenhouse effect, the thermal energy would just blow by the TOA, as it is some of the thermal energy is taken up by the atmosphere on the way up.
That is what causes the thermal gradient.
There is no GHE, bob.
That’s why there is the temperature gradient. It’s somewhat analogous to an insulated wall. One side is hot, and the other side is cold. Within the wall, there is a temperature gradient, as the thermal energy moves from hot to cold.
Clint,
“There is no GHE”
Yes there is, you are just saying that, your cult does not have the necessary technology to understand the GHE.
bob, like Norman, you’re making no progress. Maybe you just don’t want to learn.
Take a few weeks off and see if it helps your frustration.
Clint,
Fine all do that as soon as you provide your proof the Moon does not rotate, as you promised a while ago.
bob, please provide a link to where I promised such a thing.
That way you can prove you’re not just stalking.
Clint,
Somewhere in here.
https://www.drroyspencer.com/
Where specifically, child?
You have NOTHING.
Clint,
It’s there, try sometime in 2023.
Gordon
IIRC PV=T.
T has increased from 287K to 288K, an increase of 0.35%.
If the temperature increase is caused by the Ideal Gas Law PV should have increased too.
Can you confirm that air pressure has increased by 0.35% or 3.5 hectopascals and that the volume of the atmosphere has increased by 0.35% or 21,000 cubic kilometres?
If so, why?
How can V increase? And what does your formula mean?
P is proportional to T since V and n are constant…
P = (nR/V).T
With nR/V a constant.
Btw…n/V = density, therefore density must be constant in a proportional way with altitude.
Slow decline in global sea surface temperature. https://www.tropicaltidbits.com/analysis/ocean/global.png
That’s normal. The majority of ocean area is in the Southern Hemisphere and your graph shows the temperature change as the Southern Hemisphere moves into Winter.
A cynic might wonder if you were cherrypicking data giving the illusion that the global warming has stopped.
You may not have noticed that this is global data. So you are the one referring to local data.
I noticed.
That’s my point.
Global sea surface temperature is averaged across the world.
However the majority of the sea surface area is in the Southern hemisphere. The global data is influenced accordingly and reflects the Southern hemisphere seasonal cycle.
Your graph began in the Southern Hemisphere autumn and shows the Southern hemisphere cooling into Winter and influencing the global temperature to decrease in synch.
If you showed global data for the whole year you’d see a similar cycle with a minimum around August and a maximum around February.
Yes the fluctuation of sea surface anomalies in the southern hemisphere is very strong and will continue to be so due to the aphelion in July.
https://www.woodfortrees.org/graph/hadsst3sh/from:2010
“your graph shows the temperature change as the Southern Hemisphere moves into Winter.”
“will continue to be so due to the aphelion in July.”
You both have this wrong! The graph shows ANOMOLIES, not temperatures. Neither “moving toward winter” nor “moving toward aphelion” would show up. If July has a lower average temperature compared to January, this would shift the anomalies.
That is pretty much the whole point of anomalies — to remove seasonal variations to show trends more clearly.
Oops, you’re right. My mistake.
What should the ocean surface temperature be in winter in the Southern Hemisphere?
https://i.ibb.co/K5LG0Xh/global-small-fc.gif
Fossil-fuel pollution (particulates) kills unborn children:
https://www.theguardian.com/science/article/2024/jul/07/air-pollution-live-birth-ivf-fertility-study
That should make their tiny brains melt…
Talking about pollution, what about the Guardian? It used to be an esteemed newspaper, now it is a climate alarmist rag. Such a rag, that Swissmen use it as a source of propaganda.
Say, don’t you have newspapers in Switzerland? Are you so desperate there that you have to consult a Pommie rag?
[ad hom /off}
The Pantanal is dying: https://www.theguardian.com/environment/article/2024/jul/09/devastation-as-worlds-biggest-wetland-burns-those-that-cannot-run-dont-stand-a-chance-brazil-pantanal
Are you happy now, Bignell?
You’ve closed yourself off from the world because you found out your false beliefs ain’t science. So now you childishly throw crap against the wall.
Keep that tin foil had tight around your head….
Bignell’s igloo is on fire
https://cdn.drawception.com/images/panels/2017/7-12/G6f1KDES9d-7.png
Duh!!! We have wetlands here called Burns Bog. It’s a marsh. Every so often we have fires on it and we are nowhere near the Equator.
I wonder if alarmists are predicting that the Amazon River will dry up due to global warming?
It’s actually peat bog, so when a fire starts it gets into the peat, and like a fire in a coal seam, it is hard to extinguish.
Mother Nature does not believe in climate change or global warming. She doesn’t care, if she wants to light a fire she’ll do it anytime, whether we like it or not.
Is there a way to block Elliott?
Beryl is moving northeast.
ent…”you’ll give up fossil fuels when they run out”
***
Last time I checked, we had 200 years of fossil fuels left. And that is the known sources.
I think not.
https://www.resilience.org/stories/2018-03-12/the-world-oil-supply-is-infinite-i-know-that-because-i-believe-it/
Typical cultist logic: ” I Know That Because I Believe It”
Beliefs ain’t science.
ent…”If the temperature increase is caused by the Ideal Gas Law PV should have increased too”.
***
That’s a good point because it reveals the inadequacies of a global temperature. The Ideal Gas Law is not about averages, it’s about the relationship between P,V, n, and T in a container.
I am taking liberties by classifying the atmosphere as a container. However, I have made it clear that different approaches must be taken to determine a volume.
When you talk about temperature of a gas, you are referencing the average kinetic energy of the gas atoms/molecules. You can hardly apply that to a 1C warming where the 1C is an average. For example, the current global average is determined as an average temperature that ranges from +5C in certain locals to -4C in others.
When I apply the IGL, I am obviously doing it as a thought experiment. However, I am simply trying to relate the P, V, and T in an ideal atmospheric container. It’s hard to do with an atmosphere in which P and T vary with altitude so we must create an imaginary volume with concentric spherical boundaries and presume the P, V, n and T behave in that volume as they would in a container.
I realize how convoluted that may seem but when it is applied as such it agrees with the heat diffusion equation, that determines how much heat a gas in a mix can add to the entire mix. What it comes down to is that the amount of heat that can be transferred from a gas to a mix depends entirely on the mass percent of the gas.
CO2 has a mass percent of 0.06% based on its 0.04% concentration. That’s all the heat it can add to the mix, 0.06C.
Ok, assume that V is constant.
As I said earlier your model requires that to cause the observed temperature rise the pressure at ground level would have to rise by at least 3.5 hectopascals.
Is this measurable and what might cause it?
That’s not how I am presenting the Ideal Gas Law or the heat diffusion equation. I am not basing my argument on what should be, rather, I am basing it on what is.
The idea of hot air rising and colder air descending to take it’s place is far beyond my level of expertise. Putting numbers to it, considering the complexities involved, is far beyond me. I am simply raising a question of what happens to surface heat that rises into the atmosphere via conduction/convection.
The energy budget theory does not account for it, rather, they write it off as insignificant. Shula open my eyes to the truth that it is far more significant than radiation as a surface heat dissipator.
If you agree that heat is the energy associated with atomic/molecular motion, within a gas, and the P is directly proportional to T, then as P and T decrease with altitude, T must drop naturally. That means heat simply disappears.
This is not rocket science, or magic, it’s a bout a real and simple relationship between P and T in a gas. If heat is the energy associated with atoms/molecules, and the number of atoms and molecules decrease with altitude naturally, then heat must decrease naturally.
Pressure decreases naturally as the number of atoms/molecules decreases. Temperature is the average KE of the atoms/molecules and if they decrease, KE/temperature must decrease as well. Temperature is simply a measure of the relative heat level, therefore the amount of heat reduced naturally with altitude.
I’ll leave the details to the more astute students of science.
Solar wind
speed: 373.7 km/sec
density: 3.48 protons/cm3
Daily Sun: 10 Jul 24
https://www.spaceweather.com/
Sunspot number: 143
“Sunspot AR3738 has a ‘beta-gamma’ magnetic field that harbors energy for M-class solar flares.”
The Radio Sun
10.7 cm flux: 180 sfu
Thermosphere Climate Index
today: 27.73×10^10 W Hot
Oulu Neutron Counts
Percentages of the Space Age average:
today: -2.8% Low
8 numbered sunspots
Solar wind
speed: 367.1 km/sec
density: 2.71 protons/cm3
Daily Sun: 11 Jul 24
Sunspot number: 190
The Radio Sun
10.7 cm flux: 214 sfu
Thermosphere Climate Index
today: 26.83×10^10 W Hot
Oulu Neutron Counts
Percentages of the Space Age average:
today: -2.5% Low
9 numbered spots
Solar wind
speed: 372.4 km/sec
density: 2.47 protons/cm3
Daily Sun: 12 Jul 24
Sunspot number: 188
The Radio Sun
10.7 cm flux: 205 sfu
Thermosphere Climate Index
today: 24.62×10^10 W Warm
Oulu Neutron Counts
Percentages of the Space Age average:
today: -3.0% Low
9 numbered spots
Solar wind
speed: 337.4 km/sec
density: 1.89 protons/cm3
Daily Sun: 13 Jul 24
Sunspot number: 162
The Radio Sun
10.7 cm flux: 210 sfu
Thermosphere Climate Index
today: 24.07×10^10 W Warm
[After a long time it dropped back to “warm”}
Oulu Neutron Counts
Percentages of the Space Age average:
today: -3.1% Low
8 numbered spots. No spot going to farside, within 2 days. two spots are coming from farside {spot number should/likely increase tomorrow}.
But I don’t have anything specific about near term future- like by next week and/or later in month- other than NOAA 27 day forecast.
Solar wind
speed: 314.9 km/sec
density: 4.10 protons/cm3
Daily Sun: 14 Jul 24
Sunspot number: 214
The Radio Sun
10.7 cm flux: 238 sfu
Thermosphere Climate Index
today: 23.81×10^10 W Warm
Oulu Neutron Counts
Percentages of the Space Age average:
today: -2.7% Low
11 numbered spots
Solar wind
speed: 323.6 km/sec
density: 2.10 protons/cm3
Daily Sun: 15 Jul 24
Sunspot number: 217
The Radio Sun
10.7 cm flux: 234 sfu
Thermosphere Climate Index
today: 23.81×10^10 W Warm
Oulu Neutron Counts
Percentages of the Space Age average:
today: -2.7% Low
12 numbered spots, a not numbered spot appeared on nearside- past mid point {northern hemisphere}. Could grow more and be numbered. And a spot leaving to farside.
Ken
Returning to the “logarithmic” discussion.
After a lot of radiative physics you end up with this graph of equilibrium surface temperature versus CO2 concentration.
https://clivebest.com/blog/wp-content/uploads/2013/02/Temperature-dependence.png
On the X axis CO2 concentration varies between zero and 1000ppm which is the range relevant to our climate debate.
If temperature was directly proportional to CO2 concentration the line would be straight.
You can see that the slope of the graph is not constant, gradually flattening as concentration increases. This is the shape of a logarithmic curve.
There are two ways of describing the effect of this curve.
1) Equal increases in concentration have less effect as concentration increases.
Thus a 100ppm increase from 0 to 100ppm will increase temperature by 1.8C. A 100ppm increase from 900 to 1000ppm will only increase temperature by 0.3C.
2) Each doubling of CO2 concentration produces a similar increase in temperature.
Thus doubling the concentration from 100ppm to 200ppm warmed the planet by 3C. Doubling from 280ppm(preindustrial) to 560ppm will produce 3C warming. Doubling from 400ppm to 800ppm(cf Happer) will also produce 3C warming.
That’s not what Happer said in his latest paper.
Happer neglected climate sensitivity. He calculated that the DIRECT effect of doubling CO2 from 400ppm to 800ppm would increase temperature by 1C.
He neglected to mention that when feedbacks such as increased water vapour were factored in the total effect of the doubling would be 3C warming.
‘He neglected to mention that when feedbacks such as increased water vapour were factored in the total effect of the doubling would be 3C warming.’
Feedbacks is not been proven; its conjecture.
Positive feedback would result in the climate system going unstable.
Negative feedback would result in cooler than 1C projected by Happer.
3C is not going to happen.
Happer’s paper is based on clear skies. His temperature would be lower if clouds could be modeled.
Increased water vapor would increase clouds. Albedo would go up. Water vapor increase (if any) would result in more clouds and cooler temperatures.
There’s good evidence for feedback. For example, the 1.2C rise since 1880 would be expected to raise average water vapour by 8.5%, increase the water vapour greenhouse effect and increase flow in the water cycle accordingly. Both have been observed.
The direct heating effect of the increased CO2 since 1880 is 5.35ln(420/280) =2.2W/m^2. At 4W/C that would cause a temperature rise of 2.2/4=0.55C.
Even ignoring lag we have seen 1.2 C of warming. That requires a minimum feedback factor, climate sensitivity, of 1.2/0.55=2.2.
Theres good evidence for feedback.
The problem with the notion of feedback is that of the existing 340 Wm-2 of GHE. If there was positive feedback this 340W would have a lot more effect than adding 3Wm-2.
Monckton suggested the feedback factor used in the model was mathematically incorrect. His calculation came out to a very small feedback, much smaller than you are suggesting is observed.
ent…”Happer neglected climate sensitivity. He calculated that the DIRECT effect of doubling CO2 from 400ppm to 800ppm would increase temperature by 1C”.
***
Gerlich and Tscheuschner, whose specialty is thermodynamics (Gerlich taught it at university level), calculated the warming from a doubling of CO2 to be about 0.06C.
BTW, Lindzen calculated a much lower value than 1C using a different approach.
I like Happer, he’s a good guy, but he is way off studying this from a statistical POV. Ergo, he’s wrong.
Ken
“Positive feedback would result in the climate system going unstable.”
There’s a sceptic meme that positive feedback is a runaway process which leads to runaway change.
As a mathematical concept this is possible, but not in the real world.
In practice positive feedback starts out exponential but rapidly runs into resistance to further change. The slope of the graph flattens and a point of equilibrium is reached when further increase stops. Look up the sigmoid curve.
Venus is often referred to as having a runaway greenhouse effect. It did not experience indefinite exponential warming but stabilised at 730K.
On Earth an increase in surface heating due to increased greenhouse effect does not run away because the surface radiates more heat to space. The increase is proportional to the fourth power of the temperature increase so the system rapidly reaches a new equilibrium.
Ken
You describe feedback(and therefore the concept of climate sensitivity) as “not proven”.
Science does not deal in proof, it deals in evidence.
You can never prove beyond doubt that a scientific theory is true. What you can do is accumulate sufficient evidence showing that the theory is probably correct.
It’s similar to the way the courts work.
In a civil case the standard is “the balance of probabilities”. To win, you show the judge that on the evidence your version of events is more likely than not.
In a criminal court the standard is “beyond reasonable doubt”. To secure a conviction the prosecutor must show that the evidence indicates a very high probability of guilt.
For climate feedbacks the evidence for the existence of feedbacks is beyond reasonable doubt ( unless you are basing your opinions on belief rather than evidence). The evidence indicating exactly how much feedback is taking place is less strong, which is why different researchers support values between 1.5 and 9.
How does this impact our current status?
At present CO2 concentration is 420ppm and each extra 100ppm is increasing temperature by around 1.2C Over the next 50 years of so the slope of the graph does not change much, so the rate of temperature change will stay roughly constant and the logarithmic effect will not protect us.
Ent, the correct relation is, as temperature increases so does CO2.
CO2 can NOT increase temperatures but temperatures can increase CO2.
You’ve got it backward, like your passenger jets….
That turns out not to be entirely the case.
There have been cases in which a change in temperature causes a change in CO2. The transitions between glacial and interglacial periods are prime examples, in which a change in temperature due to orbital cycles is amplified by a subsequent change in CO2.
There are also cases in which a change in CO2 has caused a change in temperature. Examples include snowball Earths, mass extinctions and anthropogenic global warming.
Sorry Ent, but higher temperatures result in higher CO2.
Study your science, and avoid your cult beliefs.
Otherwise, your going to believe such nonsense as passenger jets fly backward.
CO2 has been known to lead temperature, like it is doing now,
https://pubs.geoscienceworld.org/gsl/books/book/1604/Origin-and-Evolution-of-the-Ontong-Java-Plateau
and did a while ago.
Bob,
So we’re supposed to read some book about a plateau in Java and become convinced that CO2 leads temperature sometimes?
And, you’re saying the planet’s physics is bipolar?
Stephen P Anderson,
“The volcanic eruption that created the Ontong Java Plateau released large quantities of carbon dioxide. A reconstruction of CO2 concentrations suggests that the eruption promoted climate change and the expansion of ocean anoxia.”
From Nature here
https://www.nature.com/articles/ngeo2634
Shows that temperature doesn’t always lead CO2, which is what is happening now, CO2 is leading temperature.
And the book is a collection of published papers.
ent…the curve has no scientific meaning and there is no science provided to back it.
The curve was drawn by the sceptic Clive Best.
https://clivebest.com/blog/?p=4697
He’s written a number of blog posts on the topic. Perhaps you should discuss it with him.
Entropic Man, please stop t-word-ing.
“But the coming weather will deliver more than just a day or two of chilly weather. A prolonged outbreak of frigid air with Antarctic origins will envelope southeastern Australia for most of next week from this weekend onwards.
Wedged between a strong high pressure system centred over the Bight and a low in the Tasman Sea, this lingering, bitterly cold airmass will make it feel like someone left the fridge door open for several days.”
It will be cold, even for July: that much we can guarantee. What remains uncertain at this stage is how much moisture will be associated with system, and when it will arrive.”
https://www.weatherzone.com.au/news/snow-likely-a-long-way-north-of-the-mountains/1889626?utm_source=facebook&utm_medium=referral&utm_term=20240710_news_snow-likely-a-long-way-north-of-the-mountains&fbclid=IwZXh0bgNhZW0CMTEAAR17r__UD8LGbCJe-Sk45QEupFuSmRGZcgEPbzZMSELxaGZuss3FFl-nOMU_aem_rGGgZF4Eog-PYS3lm39utQ
Clint,
When the surface takes up a 15 micron photon, it adds 82.7 mEv to the surface, which is expressed as internal energy raising the temperature of the surface.
“In physics, absorp.tion of electromagnetic radiation is how matter (typically electrons bound in atoms) takes up a photon’s energy and so transforms electromagnetic energy into internal energy of the absorber (for example, thermal energy).[1]”
Look it up.
Only on Venus are there enough 15 micron photons to boil water, and that happened a long time ago, as there is not much water left on Venus.
bob, you found a simplistic definition that doesn’t tell the entire story. You need to study “temperature”, and what is required to raise temperature.
Start here:
https://www.drroyspencer.com/2023/06/uah-global-temperature-update-for-may-2023-0-37-deg-c/#comment-1493684
DREMPTY,
I didn’t deliberately move the discussion, I got caught by the blog rules.
I see you fail to address my points.
Clint,
That post clearly shows you do not know much.
That’s the post where you clearly did not understand that temperature, or average kinetic energy goes with the square of the amount of “motion”
You get an F for that paper.
Call me DREMT, or stop responding to me, bob. I’m done taking your "DREMPTY" crap.
I don’t care whether you deliberately moved the discussion down here or not. My only point was to make sure readers were aware of the full history of the discussion.
Your points aren’t supported by your quote. In fact, both Tim and Clint R could agree with what you quoted. As Clint R pointed out, it’s a simplistic (and general) definition. Whereas Tim’s and Clint R’s photon absorp.tion models are two very specific things.
bob, you’re so desperate to throw crap against the wall, it keeps you from learning.
In junior high, you would get suspended.
Maybe that’s needed here….
You are missing an important point, Clint. We are talking about adding PHOTONS. So the appropriate statement in your link should be
Now, add PHOTON, with a motion of 30. The average now becomes (30 + 30 + 60)/2 = 60. Note energy was added, and the temperature rises.
Adding photons adds energy and raises the average energy and raises the temperature. Just like removing photons removes energy and lowers the average energy and lowers the temperature.
You can’t seem to grasp the difference between adding molecules with mass vs photons with no mass.
[I would not uses your clumsy nomenclature “motion of 30”, but I am following your wording.]
DR EMPTY then,
It’s not your name, so I don’t give a rats ass.
OK, blob.
“bob, youre so desperate to throw crap against the wall, it keeps you from learning.
In junior high, you would get suspended.
Maybe thats needed here.”
I tried that Clint,
It didn’t work.
But you have been banned once or twice, I have never been suspended from a blog.
bob and Folkerts are unable to understand my simple example. I can explain it to them, but I can’t understand it for them.
My exact words, bold my emphasis:
Both bob and Folkerts confused “molecule” with “photon”!
Kids these days….
Clint,
“(For simplicity, units are omitted and the motion is a combination of translational and rotational.)”
You are correct to omit the units, because the units for translation and rotation are different.
In order to add them you must first convert them to energy.
And that torpedoes your little word problem.
It has no correlation with reality.
It’s not understandable and not falsifiable.
Exactly bob. As I stated, you “are unable to understand my simple example”.
Clint,
As Joe would say
“That’s a bunch of malarky”
Clint,
“bob and Folkerts are unable to understand my simple example. I can explain it to them, but I cant understand it for them.”
“Both bob and Folkerts confused molecule with photon!”
No I did not confuse molecule with photon.
This is what I said.
“Thats the post where you clearly did not understand that temperature, or average kinetic energy goes with the square of the amount of motion”
Your simple example has one problem, it’s too simple.
You made a mistake in your averaging.
Because it’s the energy of photons that matter, not frequency.
Though energy is proportional to frequency for photons, but energy is not proportional to “motion” or velocity.
That’s correct, bob. You are unable to understand my simple example.
Clint,
I do understand it, it’s a bunch of malarkey.
However I note you believe a photon with frequency of 6 will be absorbed by a body.
That supports my contention that a 15 micron photon, which has a frequency of 2.0 * 10^13 Hz, much higher energy than a photon of frequency 6 Hz, will be absorbed by a surface.
Thanks for another example that you can’t understand the simple example, bob.
“Absorp.tion” wasn’t the issue. The issue was how a photon could, or could not, raise the temperature. You can’t understand it, as I’ve stated.
Keep proving me right. I can take it.
“Absorp.tion wasnt the issue.”
Yes it was, you think absorp.tion of a photon could somehow LOWER the energy of a body, which is ludicrous.
“The issue was how a photon could, or could not, raise the temperature.”
Which us a red herring. We can only know if a body is going to warm if we know both the emitted and absor.bed energy.
Nate joins bob to prove me right, again.
They can’t even understand a simple example!
why does adding energy (but not mass) lower the total energy?
Nate, where did you ever get such nonsense?
I never said any such thing.
You’re very confused, as usual.
Clint,
“Thanks for another example that you cant understand the simple example, bob.
Absorp.tion wasnt the issue. The issue was how a photon could, or could not, raise the temperature. You cant understand it, as Ive stated.
Keep proving me right. I can take it.”
Once it is absorbed, it adds energy to the surface, which raises the temperature, by definition.
If the surface of the Earth cools by emitting 15 micron infrared, then it can be warmed by absorbing 15 micron infrared.
Talking heat, not heat transfer.
Where did you learn your physics, so I can recommend no one goes there to study.
Sorry bob, but you’re still confused. And worse, this has all been discussed before but you can’t learn. You just keep throwing crap against the wall.
Remember your history here. You have repeetedly tried to claim ice can boil water. You’re say anything to support your cult nonsense.
That ain’t science.
Clint,
There is experimental evidence that you can boil water with ice.
It’s not the radiation from the ice though.
The radiation from CO2 is specific wavelengths that have nothing to do with temperature.
But on Venus there is enough 15 micron radiation from CO2 to boil water.
Just more crap from bob.
The issue Is emission from ice cubes can NOT boil water. bob’s cult says different.
And, it’s NOT CO2 raising temperatures on Venus. Venus has lava on it surface.
Just more crap from bob.
What will he try next?
Clint,
“The issue Is emission from ice cubes can NOT boil water. bobs cult says different.”
Can you post a link showing where anybody from say, RealClimate, or any other “alarmist” site says anything close to that, it’s a pile of straw which doesn’t stick to the wall.
“And, its NOT CO2 raising temperatures on Venus. Venus has lava on it surface.”
“Scientists suspect that there are four volcanoes that may be active: Maat Mons, Ozza Mons, Sapas Mons and Idunn Mons”
Compare that to Earth.
https://www.volcanodiscovery.com/volcanoes/today.html
And how much infrared is emitted by supercritical CO2 at 92 bar and 467 C?
DREMT,
Then what happens to the energy of the photons?
Energy can neither be created nor destroyed, only altered in form.
Yes I can wrap my head around what Clint is saying, it’s just wrong.
Wrong place, bob.
CLINT: your description is fine up to:
“Adding more energy does NOT always mean an increase in temperature.”
But everyone already knows that the addition of a “cool, low energy” MOLECULE lowers the average energy PER MOLECULE.
The point you miss is that the addition of a “cool, low energy” PHOTON raises the average energy PER MOLECULE. You are simply wrong when you claim “Even if the photons could be absorbed by the surface, a REDUCTION in temperature would occur.”
BOB
“You are correct to omit the units, because the units for translation and rotation are different.”
All of Clint’s “motions” are actually energies — it would have been much clearer if he had simply said that. A “motion of 30” is 30 units of energy. So translation and rotation (and vibration) would all have the same units (be it J or eV or ergs or meV).
“which has a frequency of 2.0 * 10^13 Hz, much higher energy than a photon of frequency 6 Hz”
Again, Clint is working with arbitrary units. “6” is just a shorthand for ‘lower frequency than some other photons that are 7 or 8 or 9″.
“Why does adding energy (but not mass) lower the total energy?
Clint R says:
July 11, 2024 at 5:27 PM
Nate, where did you ever get such nonsense?
I never said any such thing.”
Good. Then you agree that photons absor.bed NEVER lower the average energy of a body, as you previously claimed..
Let’s see how you squirm out of that contradiction.
bob’s moving a discussion on from up-thread. It doesn’t even start there, though. For the full history, read on from this comment:
https://www.drroyspencer.com/2024/06/uah-global-temperature-update-for-may-2024-0-90-deg-c/#comment-1673566
to the end of the thread.
You don’t need to read the whole interminable thread just the first post will do.
15 micron photons add energy to the surface of the Earth as well as Venus, where there are enough of them to boil water.
https://www.drroyspencer.com/2024/06/uah-global-temperature-update-for-may-2024-0-90-deg-c/#comment-1673576
bob asserts his way to another imagined victory.
DREMT,
Nope, I provided evidence to support my position,
“In physics, absorxption of electromagnetic radiation is how matter (typically electrons bound in atoms) takes up a photon’s energy and so transforms electromagnetic energy into internal energy of the absorber (for example, thermal energy).”
https://www.drroyspencer.com/2024/07/uah-global-temperature-update-for-june-2024-0-80-deg-c/#comment-1678522
When you make an effort to respond to the science in my post I’ll respond.
You don’t understand the science, so keep building airplanes out of vegetation.
But the cargo won’t come.
"Your points aren’t supported by your quote. In fact, both Tim and Clint R could agree with what you quoted. As Clint R pointed out, it’s a simplistic (and general) definition. Whereas Tim’s and Clint R’s photon absorp.tion models are two very specific things."
DREMT,
“”Your points arent supported by your quote.”
Please explain, or are you just asserting that and no explanation will forthcoming?
And please explain how Clint’s position that 15 micron photons from gaseous CO2 are not absorbed by the surface of the Earth is factual.
And did you pass your O levels in Physics, and where?
Your quote only says that absorp.tion is the way that EMR is ultimately converted to internal energy of the absorbing matter. Clint R does not disagree (and nor does Tim), the difference between their photon absorp.tion models is in to what extent absorbed photons of a particular frequency can increase the temperature of the matter.
DREMT,
That may be true, but why does Clint then jump to the conclusion that 15 micron photons can not raise the temperature of the surface.
Why don’t you learn some physics instead of blindly following Clint?
bob, this has all been explained to you before, but you can’t learn. You just keep throwing crap against the wall.
https://www.drroyspencer.com/2024/07/uah-global-temperature-update-for-june-2024-0-80-deg-c/#comment-1678725
Clint,
You have explained it before, but you were wrong then and you are wrong now.
The Earth’s surface can cool by emitting 15 micron photons, so it can warm by absorbing 15 micron photons.
Simple really.
bob, if you’re asking this question:
"why does Clint then jump to the conclusion that 15 micron photons can not raise the temperature of the surface."
Then clearly you don’t understand Clint’s photon absorp.tion model. As you don’t understand it, how can you know if it’s wrong or right?
DREMT,
I know Clint is wrong because I know the surface of the Earth can absorb 15 micron infrared. Which is then converted to internal energy which can raise the temperature of the Earth’s surface.
All based on observations.
Wow, bob can observe individual photons being absorbed by the Earth’s surface, and can even actually somehow observe their effect on its temperature. Amazing.
DREMT,
“Wow, bob can observe individual photons being absorbed by the Earths surface, and can even actually somehow observe their effect on its temperature. Amazing.”
Did I actually say I can observe individual photons.
The surface can absorb infrared, because it emits it, and the downwelling IR can be measured.
I could provide cites if I thought you could understand them.
But you have proven you cannot.
That the downwelling IR can be measured isn’t in dispute, nor is it the problem, bob. The problem is, will it add to the energy from the Sun to produce warming. Not if Clint R’s photon absorp.tion model (or something similar) is correct.
DREMT,
“The problem is, will it add to the energy from the Sun to produce warming. Not if Clint Rs photon absorp.tion model (or something similar) is correct.”
It’s not, for the reasons I have already explained.
The surface of the Earth cools by emitting IR, so therefore it can warm by absorbing IR.
See the graph
https://en.wikipedia.org/wiki/Greenhouse_effect#/media/File:Spectral_Greenhouse_Effect.png
It emits it, it absorbs it.
bob, I thought Clint R had already explained that absorp.tion isn’t the issue. Here:
https://www.drroyspencer.com/2024/07/uah-global-temperature-update-for-june-2024-0-80-deg-c/#comment-1678640
This is what I was referring to down-thread. You have knowledge, but can’t think straight.
DREMT,
Once absorbed the photon energy is added to the surface.
To raise the temperature of the surface, “the “added energy” MUST have frequency higher than the average of the surface.”
That’s what is being argued. You can say it’s wrong if you like, but stop making arguments which show you simply haven’t paid attention to what’s being argued.
DREMT,
Maybe Clint can find a source that supports this
“To raise the temperature of the surface, the added energy MUST have frequency higher than the average of the surface.”
The surface has no average frequency.
Or maybe you could find a source that supports that.
The surface has an average temperature, but frequency of what?
We already know 15 micron photons are absorbed by the surface.
Whether from sunlight or from CO2 in the atmosphere.
"The surface has no average frequency."
How can that possibly be the case, bob?
DREMT,
How should I know, Clint is the one proposing that as a fact, it is his job to support his theories.
I can find no support for that anywhere.
Because energy does not have a frequency.
Try that.
bob, molecules vibrate with different frequencies, the surface is comprised of molecules, thus the (molecules comprising the) surface must have an average frequency.
DREMT,
What is important for absorbing is the specific energy levels available to absorb radiation, not the average frequency of molecular vibrations.
Note, not the average energy of the vibrations, the specific individual energy levels, microscopic thermodynamics, not macro thermodynamics.
You didn’t study Quantum Mechanics or Thermodynamics in your pursuit of your science related degree.
You don’t need to confirm or deny that, it’s obvious.
“What is important for absorbing…”
You just can’t get your head around what Clint R is saying, can you bob? Your head seems to be stuck in defending against this idea that Clint must be saying, the 15 micron photons are not absorbed! That’s not what he’s saying, though. In his example, all the photons were absorbed. They just didn’t increase the temperature of the object.
DREMT,
You are just blindly agreeing with what Clint posts, there is no scientific support for Clint’s theory.
Maybe you can find something somewhere that supports that theory.
But frankly it violates conservation of energy.
I just go with what aligns with experience. I don’t see a violation of conservation of energy.
Is there some law that says actual numbers of photons must be conserved? I don’t see how that would be possible. It’s only the amount of energy (in joules) that is conserved. Surely numbers of photons can vary.
DREMT,
“Its only the amount of energy (in joules) that is conserved.”
The photons disappear, so the number of photons is not conserved.
If the energy of the photons is conserved, then they turn into internal energy of the surface, which is expressed as an increase in temperature.
…if the added energy has frequency higher than the average of the surface.
DREMT,
There is no scientific support for that.
…or for Tim’s position.
DREMT,
Thanks for admitting Clint is full of misinformation and has no scientific support for his opinions.
I have already provided scientific support for Tim’s position.
Consider this a loss for you side.
All wrong, bob. I said from the very beginning, neither Tim nor Clint supported what they claimed with any reference. The quote you provided supports Tim no more than it supports Clint.
An interesting question is how long will global CO2 levels average above 400 ppm.
It seems to me, that Global CO2 level of 400 to 500 ppm could be regarded as ideal CO2 level- increases crop growth and nature thrives.
So, though rather crazy thing to do, would it be reasonable is to charge the governments with the task of keeping global CO2 levels at 400 ppm or higher?
It’s crazy because governments can’t seem to reduce global global CO2, despite wasting trillions of dollar purportedly to reduce CO2, and one could easily imagine if charged with task of keeping CO2 above 400 ppm, they would spend more trillions of dollars, failing to do this.
There is good evidence that the level of CO2 exceeded 400 ppmv in the 1940s.
But we were not measuring on a volcano in 1940s.
There seems to be global agreement, that Mauna Loa is only place to measure global CO2 levels:
“Mauna Loa is the largest active volcano on Earth. Mauna Loa is in the shield-building stage of Hawaiian volcanism, a period when the volcanoes grow most rapidly…”
https://www.usgs.gov/volcanoes/mauna-loa
gb…and what is one gas output by Mauna Loa…CO2.
The 400 ppmv was measured by a German scientist in Germany (Giessen) circa 1940. He took over 25,000 readings.
His results disagree with others measuring CO2 concentration at the time.
Past experience from my days in the lab suggests that the difference would be because his technique overestimated CO2 concentration.
It does not matter how many measurements you take if there is a systematic error in your technique. In your workshop multiple measurements of resistance in a circuit will not improve their accuracy if your meter is badly calibrated.
Entropic Man, please stop t-word-ing.
Global
https://climatedatablog.wordpress.com/2024/07/10/uah-mean-and-median-global-for-jun-2024/
Tropics
https://climatedatablog.wordpress.com/2024/07/10/uah-mean-and-median-tropics-for-jun-2024/
JWST Unveils Potential Ice World in Habitable Zone
https://www.spacedaily.com/
“A team, including a University of Michigan astronomer, has discovered a promising exoplanet, LHS 1140 b, which may be an ice or water world within the habitable zone. The study, led by Universite de Montreal, indicates that LHS 1140 b is unlikely to be a mini-Neptune, a type of small gas giant. Located about 48 light-years away in the constellation Cetus, this exoplanet is one of the most promising candidates in the habitable zone, potentially featuring an atmosphere and possibly a liquid water oc … read more”
Well, Earth is ice world, also
It’s been several years since JWST has been discussed here. Thanks for the reminder, gb.
The engineering for the JWST involved several concepts that disprove some of the GHE nonsense. The JWST is positioned at L2, somewhat behind Earth. That results in reduced solar. But the spacecraft also has an artificial atmosphere composed of reflected layers. Sunlight is reduced to almost zero.
Real engineers know that photon absorp.tion is largely affected by surface temperature. If the spacecraft were not kept extremely cold, its telescope would not function.
Please explain the physical processes which allow the JWST to keep the telescope cold while receiving 1360W/m^2 of solar illumination.
If you have them, please show your numbers.
That’s actually a responsible question, Ent. Thanks!
The learning starts here:
https://jwst.nasa.gov/content/about/innovations/cryocooler.html
https://webb.nasa.gov/content/observatory/sunshield.html
This is why you can’t boil water with ice cubes. It’s also the reason CO2’s 15μ photons can’t warm Earth’s 288K surface.
Did you also know that passenger jets don’t fly backward?
The learning never ends….
Clint R
YOU CLAIM (with zero evidence): “Real engineers know that photon absorp.tion is largely affected by surface temperature. If the spacecraft were not kept extremely cold, its telescope would not function.”
Which real engineers are those? I have read up on the telescope and you really don’t have an idea of what you are talking about. Just making stuff up that might convince the ignorant (similar to Gordon Robertson). There is nothing at all in the reading that would remotely support your false conclusion.
The reason for the cold is clearly explained (if you chose to read the material, which obviously you do not do).
https://www.nasa.gov/solar-system/webb-telescopes-coldest-instrument-reaches-operating-temperature/#:~:text=The%20low%20temperature%20is%20necessary,system%20all%20emit%20infrared%20light.
Clint R
I doubt you will actually read anything in the link I provided.
My goal with you is to point out your incredible ignorance of real science so you can’t use your arrogant tactic to deceive some uninformed posters. You may have convinced DREMT but he does not have a science background so your narrative works on him.
Here is what is said in the article to show your ignorance to the other posters on this blog. Hopefully DREMT will see how little you know, but can only hope.
From link article: “The low temperature is necessary because all four of Webbs instruments detect infrared light wavelengths slightly longer than those that human eyes can see. Distant galaxies, stars hidden in cocoons of dust, and planets outside our solar system all emit infrared light. But so do other warm objects, including Webbs own electronics and optics hardware. Cooling down the four instruments detectors and the surrounding hardware suppresses those infrared emissions. MIRI detects longer infrared wavelengths than the other three instruments, which means it needs to be even colder.”
And: “Another reason Webbs detectors need to be cold is to suppress something called dark current, or electric current created by the vibration of atoms in the detectors themselves. Dark current mimics a true signal in the detectors, giving the false impression that they have been hit by light from an external source. Those false signals can drown out the real signals astronomers want to find. Since temperature is a measurement of how fast the atoms in the detector are vibrating, reducing the temperature means less vibration, which in turn means less dark current.
MIRIs ability to detect longer infrared wavelengths also makes it more sensitive to dark current, so it needs to be colder than the other instruments to fully remove that effect. For every degree the instrument temperature goes up, the dark current goes up by a factor of about 10.”
Absolutely nothing about surface temperature affecting what photons are absorbed. That is a false conclusion you just made up.
Gosh Norman, you’re stalking me again. Surprise, surprise.
Your insults and false accusations only confirm you don’t understand any of this.
Thanks for proving me right, as usual. Keep it up. I can take it.
Clint R
Your diversions do not demonstrate any knowledge on your part. I have demonstrated you are wrong. You have nothing else to do but pretend I just did not do this. Too bad you are in a cult and can’t learn. Too bad you never studied real physics and get your ideas from blogs.
So far your diversions have not at all demonstrated you know any physics at all and that your conclusion of cooling sensors on the Webb telescope are flawed.
None of this matters to you. You are not one seeking truth or understanding. You derive a sense of pleasure from annoying blog posters. Probably while you are drunk on tequila or other alcoholic beverage.
Norman, you have serious mental issues. But, you’re not the only one here that needs help.
If you were sane, you would realize I’ve offered several times to have a mature conversation with you, but you have to behave as an adult. You must quit the insults, false accusations, and be ready to accept reality.
You can’t do any of that.
Prove me wrong….
Clint R
Nope, no problems with me. I think you have a bad drinking problem.
No you are NOT at all interested in any mature conversation. You like to insult and denigrate posters but having any type of conversation is not your goal here. Your primary goal is to annoy other posters with endless insults and bad science. Nothing more.
But if you are interested in any type of science discussion, explain how you conclude engineers cool the sensors of the Webb telescope to allow very faint IR signals from distant locations to be absorbed by the sensing material. Nothing in the documents remotely suggests this and actually explains the reasons for the cooling.
Let us see if you can provide evidence for your conclusion “Real engineers know that photon absorp.tion is largely affected by surface temperature. If the spacecraft were not kept extremely cold, its telescope would not function.”
Find the evidence that photon absorp.tion is largely affected by surface temperature. You have so far failed. Will you continue to fail at this? Most likely you will since you just made it up.
Norman is proving me right, again. That’s why I don’t need to waste time with him, until he grows up.
He’s doing my job for me….
I’ve told you before, Norman, I do have a science background.
Evidence please.
I don’t care if you believe me or not, bob, I’m just stating a fact. There’s no possible way I could prove it to you, bar sending you a copy of my degree certificate, which I’m not going to do.
DREMT,
I would believe you if you said what, where, and when.
I don’t need to see your certificate.
I posted my graduation class list, found on the internet, maybe you could do something similar.
But that would be proof you never studied thermodynamics nor astronomy.
I’m not giving you doxing sociopaths any more information about myself.
DREMT,
Well then based on what you post, I will consider you scientifically illiterate.
Based on what you post, bob, I’ll consider that despite the knowledge you may possess, you’re unable to think clearly and critically. You give the impression of knowing stuff, but you can’t think things through logically.
ent…”At present CO2 concentration is 420ppm and each extra 100ppm is increasing temperature by around 1.2C”
***
That contradicts both the Ideal Gas Law and the heat diffusion equation. Both of them limit the warming effect of CO2, at 400 ppmv, to about 0.06C per 1C overall warming.
You have a choice here, Ent, either go with real science or go with IPCC propaganda. Of course, maybe you’re just spouting some good, old Irish blarney.
Show your numbers.
What changes in pressure and/or volume produced the 1.2C increase in observed temperature?
What physical processes caused the change?
Entropic Man, please stop t-word-ing.
bob d …”With the heat diffusion equation you use the thermal conductivity of air. To calculate the heat transfer though the air, it doesnt tell you about the individual contributions of the constituent gases.
***
Heat diffusion in a gas has little to do with conductivity, which is essentially insignificant in a gas. As I indicated before, it is related to the mass percent of a gas and its heat capacity.
The heat diffusion in a gas depends on molecular collisions. So, we are asking, how much heat can a gas like CO2, at 0.04% diffuse into the atmosphere via collision? The heat diffusion equation tells us the limit is 0.06%.
Since heat in a gas depends on the velocity of each molecule (KE = 1/2mv^2), the amount of heat diffused will depend on the velocity of each molecule and the number of other gas molecules it is likely to encounter in a collision.
I have seen this statement offered re gas collisions and I think it is nonsense….
“The average kinetic energy of a collection of gas particles depends on the temperature of the gas and nothing else”.
In fact, the statement is dumb. Temperature is a human invention to measure the relative molecular velocities in a gas. Temperature depends on the average velocity of each molecule, not the other way around.
If you have a gas at 20C and you add a gas at 30C, what happens? The temperature of the 20C gas rises and the temperature of the 30C gas cools. Since temperature depends on the average velocity of the molecules, it means the faster molecules at 30C slow down while those at 20C speed up.
The degree to which the cooler gas warms depends entire on the relative masses of each gas, a figure I called mass percent. In the atmosphere, CO2 has a mass percent of 0.06% while N2/O2 has a combined mass percent of 98.66%.
Figure it out. If CO2 absorbs surface IR and warms, how much of that heat can it transfer to the N2/O2?The heat diffusion equations tells us its about 0.06%.
G&T calculated that for a doubling of CO2 there would be no change ins velocity of atmospheric molecules.
bob…”And it also has the GHE baked into the equation, because the temperature gradient is an input into the equation.
That gradient is caused by the greenhouse effect”.
***
Bob…it’s sheer fiction to claim that the negative temperature gradient is caused by a greenhouse effect.
Air pressure drops to 1/3 its sea level value at the top of Everest, at about 30,000 feet. That means there is 1/3 the number of molecules of each gas at 30,000 feet and that shows up as climbers having various degrees of difficulty breathing at that altitude. Double that altitude and no human could survive simply because the level of oxygen is not enough to support life.
Note that it is not the altitude above the surface that causes the pressure to drop, it is the altitude above sea level that matters. Everest is 30,000 feet above sea level and the top of Everest is still the surface. Standing on the top of Everest without oxygen is equivalent to flying an aircraft at 30,000 feet without oxygen. Anyone flying an aircraft at 30,000 feet without oxygen will find himself unconscious.
This points to the fact that gravity is the driver, not air temperature or a greenhouse effect. Gravity is the only explanation for air pressure being measured from sea level.
Temperature for a gas is defined as the average kinetic energy of molecules. KE = 1/2mv^2, therefore the total KE depends on the total mass and the velocity of each particle. Halve the mass and you have half the KE. At the top of Everest, the number of molecules is 1/3rd, meaning the KE has dropped by 2/3rds. If the KE drops by 2/3rds, temperature must drop by 2/3rds.
As a parcel of air, heated by the surface, rises into air of an ever-lower density, it must expand and lose KE. The higher it goes, the more it thins out and the lower the KE gets. The lower the KE gets the less heat you have and that means heat simply disappears with altitude.
The idea that this rising air causes the negative temperature gradient is astounding.
Gordon,
“As a parcel of air, heated by the surface, rises into air of an ever-lower density, it must expand and lose KE. The higher it goes, the more it thins out and the lower the KE gets. The lower the KE gets the less heat you have and that means heat simply disappears with altitude.”
Exactly! Thank you, Gordon.
–
https://www.cristos-vournas.com
Gordon,
Convection is not the cause of the lapse rate.
I should clarify that a gas at 30C added to a gas at 20C also depends on the amount (mass) of each gas. If you have CO2 at 30C and it is only 0.04% the mass of the gas at 20C, there will be an insignificant rise in the 20C gas temperature.
Gordon,
“Heat diffusion in a gas has little to do with conductivity, which is essentially insignificant in a gas.”
Then why is thermal conductivity a factor in the heat diffusion equation?
I said it has little to do with thermal conductivity since the thermal conductivity of heat through a gas is low.
Gordon,
It’s in the heat diffusion equation.
Thermal conductivity that is.
I acknowledged that thermal conductivity is in the heat diffusion equation and it is barely significant. That’s why IR absorbed by CO2 and converted to heat is also insignificant in warming the atmosphere.
Heat diffusion in the atmosphere is a painfully slow process. It is measured in 10^-5 m^2/second.
Convection would be much faster, since the bulk movement of heat in air moves at the speed of the wind.
Beryl passes over the Great Lakes and produces thunderstorms and tornadoes in the Northeast.
We can continue to observe a decrease in temperature in the upper stratosphere, which is due to a decrease in ozone production as a result of the breakdown of O2 into atoms by radiation below 242 nm. Less ozone causes an increase in UVB radiation, which is absorbed by ozone and is high-energy. Still, the tropospheric temperature in the tropics will remain high because water vapor will absorb this radiation. Whats more, it will inhibit the development of La Nia, which is already evident.
https://www.cpc.ncep.noaa.gov/products/stratosphere/strat-trop/gif_files/time_pres_TEMP_ANOM_JAS_EQ_2024.png
https://www.cpc.ncep.noaa.gov/products/stratosphere/strat-trop/gif_files/time_pres_TEMP_ANOM_ALL_EQ_2024.png
https://www.tropicaltidbits.com/analysis/ocean/nino34.png
Sharp frosts in South America are breaking records. Almost all Argentine provinces had a morning of July 9 below 0C.
-7.6C was observed in Gualeguaych, Argentina .
This is a new all-time record with data going back to 1935.
Really?
Station data
ARM00087497 -33.0100 -58.6130 22.9 GUALEGUAYCHU
ARM00087497 GUALEGUAYCHU 1984 5 13 -10.6 (C)
From where did you obtain the info that Gualegaychu’s data begins in 1935? I know only of data since 1965.
*
As always, you compare temperatures with regard to the same day in each year; exactly as does ignoramus Robertson.
*
Would you compare monthly averages, so you would obtain more relevant data because high and low extremes are smoothed away.
Let us for example compare the monthly lowest absolute temperatures for GUALEGUAYCHU:
2012 7 1.45 (C)
1996 7 2.09
2007 7 2.13
2009 7 2.70
1980 7 2.83
1988 6 3.07
2021 7 3.09
1979 6 3.27
2022 6 3.27
2009 6 3.29
And since July 2024 is on the road, let us compare these temperatures for June:
1988 6 3.07 (C)
1979 6 3.27
2022 6 3.27
2009 6 3.29
1978 6 3.42
2018 6 3.48
2016 6 3.59
2008 6 3.72
1974 6 3.81
1996 6 4.14
Why don’t we see June 2024? Here is the answer:
2022 6 3.27 (C)
2021 6 5.00
2020 6 6.31
2023 6 6.56
2024 6 8.43
*
You are really this blog’s most impetuous coolista.
binny…”From where did you obtain the info that Gualegaychus data begins in 1935? I know only of data since 1965″.
***
That’s the problem, the fudged sources you use ignore the 1930s since the temps were as hot, or hotter than today.
Not what I asked.
I wanted to know how 1360W/m^2 can hit one side of the spacecraft while the other side remains at 7K.
Somehow the satellite is shedding 7 billion Joules each year.
Start with exterior of satellite. Reflective material means high albedo.
Solar panels that are intended to collect energy also shade the satellite.
Radiator fins to increase radiation from the craft.
Yes, getting rid of the energy from the sun is a big engineering issue.
Well fundamental issue is cost to launch mass from Earth, and fitting in a rocket fairing, and dealing with vibration and gees of the launch.
Things need to folded and then opened- and other stuff- like making one unique item, rather than making a hundred of them, so as to lower unit costs.
The vacuum of space allows one to have great insulation, the question is why do you want 7 K, sounds like something that the Webb Telescope requires.
Or high intensity of sunlight at Venus or Mercury distance is not much of problem, if you wanted 7 K for some reason.
Gbaikie
Imagine a visible light telescope whose structure glowed brightly enough to obscure the stars you wanted to see.
At room temperature an infrared telescope produces enough thermal radiation to swamp the IR from whatever you want to look at. The only way to reduce this unwanted radiation is to cool the whole telescope. In accordance with the Stefan-BoltzMann equation this reduces the amount of thermal radiation and shifts the remaining emission to longer wavelengths.
Ent, it appears you had an instance of adult responsibility, then reverted into an incompetent child that can’t even place his comments correctly.
https://www.drroyspencer.com/2024/07/uah-global-temperature-update-for-june-2024-0-80-deg-c/#comment-1678602
Worse, you couldn’t begin to fathom the links provided!
Do you have a responsible adult that can help you, FULL TIIME?
Clint
So your “physics” can’t explain how the optics of the telescope keep cool.
All you can do is insult. One out of ten for scientific credibility.
Ent, acknowledging that you are a child is NOT an insult — it’s reality. You’re such an immature cultist that you claim passenger jets fly backward.
You spew it, you own it.
Now, you’re even avoiding your own cult’s (NASA) explanations!
As I said , you can’t explain how the JWST keeps cool because your pseudophysics has no basis in reality.
You like NASA’s nonsense when they’re wrong, but when they get something right, you call it “pseudoscience”.
That’s more of your cult logic.
ent…you cannot measure radiation in w/m^2. The watt was defined based on electrical current running through a conductor and it has an equivalence to the mechanical power unit, the horsepower. Since heat has an equivalence to work, heat is often stated in watts but that is not an actual measure, just an equivalence. The actual measure of heat is the calorie, which defines the amount of heat required to raise a CC of water by 1C.
If you put a small paddle in a bucket of water and rotate the paddle at a significant speed, the water temperature will rise. However, you are not adding heat from an external source but releasing it internally by breaking weak hydrogen bonds that hold the water molecules together.
How can you apply that to solar EM? You can’t. The EM must first be absorbed by a surface, heating the surface. Then you can measure the amount of heat produced via a thermometer and determine the number of watts required to cause that much heat.
Sats are insulated against solar energy to prevent the warming you claimed. They have reflective surfaces between layers of insulation layers to reflect solar EM. I don’t imagine the sat surface warms a heck of a lot and likely remains close to the 7K you claim.
gordon, flux is measured all the time in units of W/m². It’s just that you can’t understand the difference between power, energy, and flux.
And, you can’t learn.
Please stop clogging the blog.
Gordon
What units do you use in optical systems?
Consider a fibre based internet system. It uses electrical systems to generate light which travels along the fibre and is then converted back to an electrical signal on arrival.
You are happy using Watts for the electrical parts of the system, but what units do you use for the optical parts?
Remember that optical fibres gradually decrease the light intensity, so you need repeaters at intervals along a long cable and need to take account of this when designing fibre systems. No point having repeaters so far apart that the light intensity drops below the threshold of your detector.
There’s also the need to take into account the cross-section of the fibre.
For a given input power doubling the diameter of the fibre reduces the light intensity at the far end by a factor of four. You need to factor the cross sectional area of the fibre into your calculation to work out the sensitivity required for the detector.
Thus light intensity must be measured as power/area, the internet engineer’s equivalent of Watts/m^2.
Entropic Man, please stop t-word-ing.
If we want compare different kinds of so-called ‘moving averages’, e.g. means to medians, then we should do this by using exactly the same method.
This means that if we use a cascaded triple 12 month running mean with a cascade sequence following Vaughan Pratt’s specification (giving a cascade of 12, 10 and 8 months respectively), then we should do the same when computing medians, i.e. to use a cascaded triple 12 month running median following the same Pratt specification.
*
This time, the comparison is made without restricting its ‘lifetime’ to the cascades’ innermost averages. (This restriction was needed only in case of a comparison of the averages’ polynomial means.)
1. A comparison based on UAH LT Globe for Dec 1978 – June 2024
https://drive.google.com/file/d/1umE0x_ObQqkafV33CqwRkzXHwMVQWJEJ/view
2. A comparison based on UAH LT Eire’s latitude band for Dec 1978 – June 2024
https://drive.google.com/file/d/1SN3y_YftP64ai8kGb45Ulz6h9VQvoVxY/view
https://www.drroyspencer.com/2024/07/uah-global-temperature-update-for-june-2024-0-80-deg-c/#comment-1678552
Sorry, Blindlsey H00d
As I explained to you already
– your median series cannot be correct because if it was, it would be exactly as similar to my median series as your mean series is similar to mine;
– my median series is constructed exactly in the same way as my mean series: the mean and median cascades have exactly identical arguments.
By the way, the only difference between comparison (1) and (2) is… the source data.
*
But, as I explained to bdgwx and many others on this blog: you NEVER admit being wrong.
*
Do you remember your absolute inability to disprove the correctness of this graph, Blindsley H00d?
https://drive.google.com/file/d/1AaxFh4QW5DTv7KH42H9DmSFGl68qJYRh/view
I showed with it, using USCRN (851,248 days with complete hourly data) how extremely tiny the difference between median and (min+max)/2 in reality is.
“your median series cannot be correct”
You have the source code. Prove it wrong.
You do know that median/mean consequences are latitude dependent don’t you? The was proven ages ago and agreed be yourself.
Now, Blindlsey H00d, you become dishonest again – as always.
1. ” You have the source code. Prove it wrong. ”
I have already explained to you that your source code proves NOTHING.
What matters is solely how it is invoked.
What is really brazen is that you dare to doubt more the correctness of a worldwide used tool like Excel than your own, apparently still unverified C# software.
I repeat: Why not load your results into Excel or Libre Office Calc and finally perform a validation and verification step 100% outside your programming context, as all experienced software engineers do?
**
2. ” You do know that median/mean consequences are latitude dependent don’t you? The was proven ages ago and agreed be yourself. ”
What’s that for a nonsense, Brit boy?
2.1 You were the one who disagreed in 2021 about this dependency, and I was the one who proved it to you, by showing not only the differences between data from Kenai, AK and Everglades, FL, but also those between METEOSTAT data in the Arctic and in the Tropics.
*
2.2 You were never able to contradict me by posting a chart really comparing (min+max)/2 values with medians.
All you could do was create a lot of distracting smoke with your ridiculous
https://climatedatablog.wordpress.com/wp-content/uploads/2021/12/uscrn-contiguous-daily-values-3.jpg
while carefully avoiding doing the work that was actually expected of you.
*
2.3 You are, again, incredibly brazen when talking here about ‘latitude dependent’ when I post the result of a comparison
https://drive.google.com/file/d/1AaxFh4QW5DTv7KH42H9DmSFGl68qJYRh/view
based on all days with complete hourly data from all available active USCRN stations in all years, ranging – in my latest 2023 update – from
53877 NC_Asheville_8_SSW 2001 6 5
up to
96409 AK_Toolik_Lake_5_ENE 2023 12 24
Why didn’t you do the same job years ago, Blindsley H00d?
*
2.3 Where are the ‘latitude dependent’ problems when comparing mean and median in UAH LT’s global data (from 82.5S to 82.5N), Blindlsey H00d?
*
2.4 Here is by the way a bit of funny work for you…
UAH 6.0 LT NoPol
https://drive.google.com/file/d/1PyD_iSfGvOF1PKP_NvFi67SG3Xh-gf-H/view
UAH 6.0 LT SoPol
https://drive.google.com/file/d/1aChaDrh122JuhoMB54Dx8_mvgQF-UYpK/view
*
Stop smalltalking and stalking, Blindsley H00d. Start working!
“What’s that for a nonsense”
We spent may hours discussing USCRN which differed plainly North to South.
Why do you continue to show monthly values that have no real data?
Blindsley H00d
” Why do you continue to show monthly values that have no real data? ”
Do you mean these ones?
UAH 6.0 LT NoPol
https://drive.google.com/file/d/1PyD_iSfGvOF1PKP_NvFi67SG3Xh-gf-H/view
UAH 6.0 LT SoPol
https://drive.google.com/file/d/1aChaDrh122JuhoMB54Dx8_mvgQF-UYpK/view
*
Why do YOU show every month UAH LT data, which is the latitude weighted average of 9504 cells, each of these single cells being in turn a weighted average of MT, TP and LS cells, each of these cells being in turn the monthly weighted average of O2 microwave emissions sounded by several satellite-borne devices?
*
It’s time to stop arguing with you: you’re too stubborn, too opinionated, always finding a way to be right.
People like you are just too boring for me.
There’s one thing you can’t get rid of: your median values in this chart
https://climatedatablog.wordpress.com/wp-content/uploads/2024/07/uah-global-1.jpeg
are wrong.
*
From now on, you can continue to be right with people who will always agree with you – not because you are right, but because they have something to gain from agreeing with you, e.g. ignoramus Robertson or Simpleton Hogle.
¡Basta ya!
You have no data for the lines you show on the monthly data. Only for the ends of them. As I show.
By accident, I see your last reply, with a ‘suggestion’
” You have no data for the lines you show on the monthly data. Only for the ends of them. As I show. ”
written as usual as cryptic as possible so that no one can say you write anything wrong.
What exactly do you mean, Blindsley H00d?
Will there be one day in the future where you finally manage to express your secret ‘thoughts’ in such a way that anyone understands them?
Blindlsey H00d
Aaaaah! Now I understand.
Since you are unable to accept that your medians are plain wrong (for the reason explained above), you digress with your completely ridiculous
” You have no data for the lines you show on the monthly data. Only for the ends of them. ”
Is it possible to behave more stubborn AND more cowardly, Blindsley H00d? Yes, it is. As you show.
Why don’t you have the courage to address your styupid claim to Roy Spencer and the thousands of scientists who yoin the points with line in order to make the series better visible?
You are such a coward, Blindsley H00d.
The First Conclusions
Conclusions:
1). The planet mean surface temperature equation
Tmean = [ Φ (1-a) S (β*N*cp)∕ ⁴ /4σ ]∕ ⁴
produces remarkable results. The theoretically calculated planets temperatures (Tmean) are almost identical with the measured by satellites (Tsat.mean).
Planet….Te…..Te.correct…..Tmean…Tsat.mean
Mercury..440 K….364 K…….325,83 K…340 K
Earth….255 K….210 K…….287,74 K…288 K
Moon…270,4 K….224 K…….223,35 Κ…220 Κ
Mars….210 K…..174 K…….213,11 K…210 K
2). The 288 K – 255 K = 33C difference does not exist in the real world.
There are only traces of greenhouse gasses. The Earths atmosphere is very thin.
There is not any measurable Greenhouse Gasses Warming effect on the Earths surface.
There is NO +33C greenhouse enhancement on the Earth’s mean surface temperature.
Both the calculated by equation and the satellite measured Earth’s mean surface temperatures are almost identical:
Tmean.earth = 287,74K = 288 K.
–
****
https://www.cristos-vournas.com
–There are only traces of greenhouse gasses. The Earths atmosphere is very thin.
There is not any measurable Greenhouse Gasses Warming effect on the Earths surface.–
Well, no one has measured the warming effect of any greenhouse gas- they are merely guesses. This is part of reason it’s a global warming cargo cult.
But it seems you think there is greenhouse effect with Venus -because it’s a thicker atmosphere? Or is thicker something like Jupiter?
It seems that without the ocean and water vapor, Earth’s poles would be colder.
And it seems without Gulf Stream without warmed tropical water warming Europe, Europe would be colder.
And no one saying or indicating where greenhouse gases are warming any particular place on Earth.
https://www.nature.com/articles/nature14240
There was general agreement that the little ice age ended around 1850.
As Entropic man indicates, both radiative forcing and back-radiation have been directly measured.
Thank you, gbaikie, for your response.
–
https://www.cristos-vournas.com
Elliott, “radiative forcing” from CO2 can NOT be measured. It is a fictitious concept that started centuries ago and has never been corrected, much like the Moon spin nonsense.
You need to take off your tin foil hat and learn some science.
Looks like it’s dropping a bit again.
Am curious if anyone has any attribution for the recent warm spike?
Seems some study’s on pollution dimming and variations via Covid times.
https://www.google.com/search?q=global+dimming+paper+2024&client=ms-android-telstra-au-rvc2&sca_esv=15a9157023f07e80&sxsrf=ADLYWIKjts3BP3PkT-aykwfDYk1VLEnz6g%3A1720735095408&ei=d1WQZprNGMKF4-EPz-KLoAE&oq=global+dimming+paper+2024&gs_lp=EhNtb2JpbGUtZ3dzLXdpei1zZXJwIhlnbG9iYWwgZGltbWluZyBwYXBlciAyMDI0MgUQIRigATIFECEYoAFIvUdQuxVYhz9wAngBkAECmAHUAqABtxSqAQUyLTguMrgBA8gBAPgBAZgCBqAClwjCAgoQABiwAxjWBBhHwgIEECMYJ8ICBRAhGJ8FwgIEECEYFZgDAIgGAZAGCJIHBzIuMC4zLjGgB9Mq&sclient=mobile-gws-wiz-serp
The only obvious cause is the Hunga Tonga volcanic eruption which dumped millions of tons of water into the stratosphere. It was an unprecedented event in our times and far too much of a coincidence to be ignored.
gordon, see, you can get some things right. And notice your comment was brief, to the point, and didn’t involve your usual circuitous rambling.
Good job.
The rapid transition from La Nina to El Nino explains most of it.
Are you saying that this transition is exceptional?
Is it Tonga Shmonga or a satellite tilt
https://youtu.be/W7GN96BUCEo
Good stuff, Eben.
duplicate
ken…”For climate feedbacks the evidence for the existence of feedbacks is beyond reasonable doubt ( unless you are basing your opinions on belief rather than evidence)”.
***
Ken…people can use the word feedback in any way they like. I am offering you feedback right now and I regard it as positive. I am targeting a positive feedback that is claimed to lead to a tipping point, a condition where PF allegedly leads to a runaway condition that causes heat to increase exponentially in the atmosphere. That is not possible without an amplifier.
A classic example in climate alarm is that solar energy heats the surface, which radiates IR. That IR is absorbed by trace gases like CO2 and WV in a colder region of the atmosphere. The trace gases re-radiate a portion of what they received from the surface back to the surface where it is allegedly absorbed. The IR is then allegedly converted to heat, raising the surface temperature. The heated surface then evapourates more WV, increasing the GHGs.
That’s what alarmists have called PF. Sine the GHGs increase, they radiated more energy to the surface, increasing the temperature of the surface exponentially. With each iteration, the surface temperature allegedly warms.
This stoopid theory stems from the notion that a colder atmosphere can transfer heat back to the surface that caused them to warm, hence raising the temperature beyond what the surface was heated by solar energy.
There are several issues with this theory…
1)The 2nd law says it cannot happen.
2)Quantum theory says it cannot happen.
3)The process represents per.petual motion, wherein heat is recycled from a source to raise the temperature of the source.
4)Over 90% of surface radiation goes straight to space. If the feedback from GHGs could be recycle heat as claimed, they would have to make up that 90% loss before any additional warming could take place.
I have made it clear there is another positive feedback that is related to no amplification. A servo system has both positive and negative feedback that refer purely to the sign of a control voltage. If the voltage is positive the feedback is called positive and if the voltage is negative the feedback is negative. The only purpose of such feedback is to signal a controhler which way an output is going.
No one has ever proved such a PF in the atmosphere that leads to a runaway greenhouse effect as describe above.
Roy once explained that PF in climate theory is a not-so-negative negative feedback. In other words, it’s claimed to be positive because it is not as negative. They are all negative feedbacks in the atmosphere.
ent…”What changes in pressure and/or volume produced the 1.2C increase in observed temperature?”
***
Not a change in either, the planet has re-warmed from the Little Ice Age. There is more solar energy reching the planet, on average, than during the LIA.
The idea that CO2 is warming the plant is the ultimate in red-herring arguments.
“There is more solar energy reaching the planet, on average, than during the LIA.”
Except for the brief period of the maunder minimum 1645-1715 there is no evidence that solar insolation changed significantly before, during or since the LIA.
Are you talking about albedo? That would be odd because the LIA was followed by the Industrial Revolution and the latter caused albedo to increase, reducing the amount of sunlight reaching the surface.
Entropic Man, please stop t-word-ing.
Not long ago, Roy Spencer stated on this blog that it was unlikely that Honga Tonga was primarily responsible for the recent warming in the lower troposphere and at the Earth’s surface.
The consensus is that Honga Tonga ejected 150 Gt of water into the stratosphere and that this amount of water would be the cause of subsequent cooling of the stratosphere, which in turn should lead to subsequent warming in the lower troposphere.
So far, so good.
*
Here is an ascending sort of the global temperature in UAH’s monthly record for the lower stratosphere:
2020 7 -0.53 (C)
2020 8 -0.51
2020 9 -0.49
2016 7 -0.48
2024 3 -0.48
2016 8 -0.46
2018 3 -0.46
2020 10 -0.46
2000 11 -0.45
2012 2 -0.44
Source: https://tinyurl.com/UAH-LS
The months July, August and September 2020 are those with the least temperatures in the lower stratosphere since measurement begin in December 1978; two further months of 2020 are in the top 10 of the least temperatures.
*
First remark: nowhere do you see in this top ten any data later than Jan 2022, the month in which the Honga Tonga eruption happened.
At positions 19 resp. 20 in the sort you see
2020 6 -0.40
2022 8 -0.40
*
Second remark: if low temperatures in the lower stratosphere lead to higher temperatures in the lower troposphere, why then did we not notice any unusually higher temperatures there after the greatest drop in the lower stratosphere since beginning?
In a descending sort of the monthly temperatures in the lower troposphere, you see at top only months in 2024 and 2023:
2024 4 1.05 (C)
2024 3 0.95
2024 2 0.93
2023 10 0.93
2023 11 0.92
2024 5 0.90
2023 9 0.90
2024 1 0.86
2023 12 0.83
2024 6 0.80
2020 appears first at position 17:
2020 2 0.60
1998 5 0.52
1998 2 0.49
2017 10 0.48
Source: https://tinyurl.com/UAH-LT
*
In his March 2024 report, Roy Spencer wrote:
” New high temperature records were also set for the Southern Hemisphere (+0.88 deg. C, exceeding +0.86 deg. C in September, 2023) and the tropics (+1.34 deg. C, exceeding +1.27 deg. C in January, 2024).
We are likely seeing the last of the El Nino excess warmth of the upper tropical ocean being transferred to the troposphere. ”
In the April report, he writes further:
” It should be noted that the CDAS surface temperature anomaly has been falling in recent months (+0.71, +0.60, +0.53, +0.52 deg. C over the last four months), while the satellite deep-layer atmospheric temperature has been rising.
This is usually an indication of extra heat being lost by the surface to the deep-troposphere through convection, and is what is expected due to the waning El Nino event.
I suspect next months tropospheric temperature will fall as a result. “
Correction
I wrote above:
” First remark: nowhere do you see in this top ten any data later than Jan 2022, the month in which the Honga Tonga eruption happened. ”
I had overlooked this line.
2024 3 -0.48 (C)
Two years after the Honga Tonga eruption…
In addition to the Honga Tonga stuff I wrote above, I found however that when splitting the lower stratosphere data into NH and SH, the ascending sorts reveal more low temperatures for 2022 months in the SH:
2024 3 -1.09 (C)
2009 2 -1.06
2022 10 -1.01
2022 8 -0.91
2018 2 -0.85
2020 10 -0.84
2010 2 -0.83
2022 9 -0.79
2024 1 -0.78
2022 11 -0.75
than in the NH:
2019 9 -1.46 (C)
2019 2 -0.89
2017 8 -0.83
1996 7 -0.82
1996 8 -0.76
2007 7 -0.76
2012 12 -0.76
2000 10 -0.72
2000 11 -0.71
2012 10 -0.71
*
Finally, a little comfort for the fans of the Honga Tonga warming :–)
There are at least 4 theories as to how Hunga-Tonga raised temperatures.
1. Radiative forcing from water vapor
2. The salt effect on stratosphere
3. The salt effect on ozone
4. The effect on Polar Vortex.
With proper research we may someday know which ones are valid.
Where are the sources for these ‘at least 4 theories’, Clint R?
… and let me add that I trust what an experienced scientist like Roy Spencer tells us 100% more than the superficial blabla of a guy like you, who is 100% scienceless, who discredits centuries of astronomical observation and data processing as ‘astrology’ and asks doggedly like a ten-year-old child about nonsense like ‘orbiting without spin’.
Thanks for the reminder, Bindi. Where’s your model of “orbiting without spin”. You need such a model to show that you understand what that motion looks like.
Right now, you’ve got NOTHING.
#2
Where are the sources for these at least 4 theories, Clint R?
Give me your viable model of “orbiting without spin” Bindi, and I’ll tell you where I heard of those 4 theories.
It shouldn’t be hard. You can use the Internet, and all your astrologers from centuries ago.
It’s time to put up, or shut up.
“Its time to put up, or shut up.”
I agree. Clint, shut up.
It appears Bindi has “left the building”.
He’s probably searching the Internet looking for a viable model of “orbiting without spin”, but only finding the ball-on-a-string!
Ken
People like Clint R never prove anything and never shut up.
Wrong again, Bindi.
I’ve proved you have no viable model of “orbiting without spin”. Which means you know NOTHING about the Moon issue.
A bit of citizens’ science to track the movement North of British Lepidoptera: https://www.theguardian.com/environment/article/2024/jul/12/big-butterfly-count-ask-public-track-migration
Holy mackerel, a Swiss ijit front-man for the Manchester Guardian fake news rag.
Mixed news on peak oil consumption. BP projects peak consumption in 2025, but a slower decline afterwards than previously projected.
https://www.theguardian.com/business/article/2024/jul/10/bp-predicts-global-oil-demand-will-peak-in-2025-emissions-wind-solar-gas
Why do you read fake news from the Manchester Guardian? No newspapers in Switzerland?
A visualisation of warming in the USA: https://www.theguardian.com/environment/article/2024/jun/27/us-summer-extreme-heat-map
I’m an American, a Canadian living in Vancouver, Canada, and I have not noticed the average 1.5C warming. In fact, we’ve had a decently cool June. July got a bit hotter for a few days but it’s back to a balmy 22C today.
Feeble-mindedness and poor eyesight was once blamed on sexually interfering with oneself. They know the cause today, and that is believing in climate alarm and reading rags like the Manchester Guardian.
One could have more Starship launches from Texas and/or Florida.
But to launch a lot Starships {a crazy amount} one should launch Starship far enough away from residential areas of people of these two State.
Or Florida and/or Texas should have launch site, close to the State, but be in the Ocean {far enough away from residential land housing}
Now, largest rocket ever designed was the Sea Dragon, it was planned to be made in ship building yards, and towed out to the ocean and launched in the ocean- so it didn’t need a launch site in the ocean- as it was in a sense a launch site in ocean. But once tested, one probably make a ocean site in the ocean, simply because one could make a lot of them, and would probably launch at same part of ocean where you first launched it.
Related
Thanks for the 5-day old “news”, Ark.
Yep. Just one more thing you were wrong about:
“it has lost energy and is now only a tropical storm, not likely to reach hurricane status again – probably because there’s not enough warm water….“
Nice try Ark, but no cigar.
Here’s the part you somehow forgot to quote:
Ark, if you’ve been tracking the storm you must have noticed how wrong the models have been. Three days ago, the storm was going to miss the Texas coast. Now, it’s heading straight in.
The comment was about the inaccurate models. And they were wrong again, as I hinted.
Forgot? That’s the best part!
Hurricane Beryl Three Day Forecast, July 5, 2024: https://ibb.co/MkJND63
The comment was about how your opinions are consistently wrong.
“Hurricane and Tropical Storm Watches will likely be issued later today.”
“…will likely…”
They didn’t even know if “Watches” would be for hurricane of TS.
Keep proving me right, Ark. I can take it.
So, you’re moving the goalposts already, huh?
You said: “Three days ago, the storm was going to miss the Texas coast.”
You were wrong.
Keep proving me right.
Sorry Ark, but July 4th comes BEFORE July 5th.
Keep making me look good.
Sorry but humility and self-awareness are important indicators of intelligence, hence the importance of acknowledging one’s mistakes.
You’re always wrong. Even a broken clock is right twice a day.
More proof that Clint R was wrong when he wrote “ Three days ago, the storm was going to miss the Texas coast.”
This from July 2, 2024: https://ibb.co/GcpmtZR.
Changing sources now, Ark?
Speaking of sources!
To sum up, Clint R was wrong about Beryl just like he’s wrong about everything he posts.
He will not admit his mistake, if that’s what it was although it’s just as likely that he lied since the models had the Texas coast in the cone of uncertainty from early on.
Still, it’s fun to watch him pretend playing at science.
A closing thought, if I was wrong about everything the way Clint R is all the time, I would just hang myself. I couldn’t bear it!
Ark, you used all the basic cult tactics, in your failed kamikaze attack.
But, you’re not the only cultist in full meltdown. You’ve got plenty of company….
ark…”that Beryls maximum sustained winds have increased to near 75 mph”
***
That’s hardly a hurricane, more like a strong wind. Don’t know why you’re quibbling over small potatoes.
My climate model is hot hot hot
https://youtu.be/RBgLZiMOl0Y
Is Apollo 11’s Lunar Module Still In Orbit Around The Moon 52 Years Later?
https://www.youtube.com/watch?v=dBHbLV7xEhc
Is Apollo 11 ascent module still in orbit around Moon?
Would anyone steal it? Would be better if crashed on Moon as compared to someone stealing?
Would NASA/US pay someone to bring it back to Earth or put it somewhere where in future it wouldn’t crash {or maybe it currently, never crash {never in sense that if no one steal it- which is unlikely unless we never become a spacefaring civilization {and space aliens don’t show up].
Historical artefacts can gain considerable value.
An 80 year old Spitfire in original condition will cost you several million dollars.
There’s also a market for items brought up from the Titanic.
If we last that long, one indication of a mature space economy will be when someone begins salvaging space debris such as the Eagle ascent module for sale to museums.
ent…” Except for the brief period of the maunder minimum 1645-1715 there is no evidence that solar insolation changed significantly before, during or since the LIA.
Are you talking about albedo? That would be odd because the LIA was followed by the Industrial Revolution and the latter caused albedo to increase, reducing the amount of sunlight reaching the surface”.
***
Ent…there is no direct evidence that a reduction of solar energy cause the LIA but what else could have caused it? Perhaps an orbital variation?
Neither is there direct evidence that the Pre-Industrial level of atmospheric CO2 was 270 ppmv, but that does not stop alarmists clinging to the anthropogenic theory.
Actually, the Industrial Revolution happened in the middle of the LIA, not at the end. The revolution is pegged around 1750 and the Dalton minimum occurred around 1790. Also, the Maunder does not explain the LIA beginning Sometime in the 1300’s.
What would explain two minima occurring within 100 years of each other? I don’t think volcanic aerosols could explain that? Sunspot activity might.
I’m not sure you even need a special explanation for the LIA, or the Mediaeval Warm period which preceded it.
Both cloud be short term variations in the longer term cooling trend which has been going on for the last 5000 years.
https://railsback.org/FQS/FQS22katoFutureTemps03.jpg
That is due to the orbital cycle changes as move away from the Holocene sweet spot towards the next glacial period.
In a way you are right. The Sun’s brightness has not changed, but the amount of sunlight received by high Northern latitudes in Summer is decreasing. Since that is what melts the snow and ice in Summer a decrease in Summer sunlight causes more ice to remain.
There’s also another of those positive feedbacks you don’t like. More ice cover reflects more sunlight, so the drop in temperature due the orbital changes leads to a further drop in temperature due to increased is cover. That is why a change in sunlight sufficient to cool the NH by 1.2C ends up cooling the planet by 5C.
This is irrelevant to modern temperatures because the slow natural cooling trend has been swamped by human induced artificial warming.
Entropic Man, please stop t-word-ing.
clint…”gordon, see, you can get some things right. And notice your comment was brief, to the point, and didnt involve your usual circuitous rambling.
Good job”.
***
Enough of the brown-nosing. I don’t even want an apology from you for ruthlessly attacking me initially in an unwarranted manner. All I ask is that you consider the cause and put it before your personal beefs.
I have no problem with you challenging my scientific views, but try to do it scientifically rather than coming across as one skeptic attacking another.
Don’t fret gordon, you won’t be getting any apology from me. I only apologize when I’ve done something wrong.
And I haven’t “ruthlessly attacked” you in an “unwarranted manner”. That’s a false accusation. I’ve pointed out when your opinions don’t jive with physics and offered constructive criticism about your numerous rambling comments.
But, you can’t handle reality.
For stubborn, all-time-everything-better-knowing ignoramuses, one of so many sources:
Atmospheric CO2 and the ratio of intercellular to ambient CO2
concentrations in plants
JAMES R. EHLERINGER and THURE E. CERLING (1983)
http://ecophys.utah.edu/uploads/3/1/8/3/31835701/191.pdf
And this paper also keeps far away from the typical CO2 ‘cult’:
Holocene carbon-cycle dynamics based on CO2 trapped in ice at Taylor Dome, Antarctica
A. Indermhle & al. (1999)
https://climatehomes.unibe.ch/~joos/papers/indermuehle99nat.pdf
Only egomaniacal dumbies doubt such information – because they can’t contradict it.
Indermühle of course, you bloody scanner.
Bindidon
You are pushing on an open door. Nobody would dispute that a change in temperature can drive a corresponding change in atmospheric CO2.
The problem comes when the more disingenuous sceptics push the logical fallacy that because temperature sometimes drives CO2 then CO2 can never drive temperature.
In fact both happen. There are examples of temperature driving CO2 and CO2 driving temperature. There is a natural equilibrium between temperature and CO2 concentration. Change either and the other adjusts.
Entropic man
” You are pushing on an open door. ”
No I’m not: this is merely a reply to egomaniacal nonsense written upthread.
Wrong again, Ent.
Temperatures can increase CO2, but CO2 can NOT increase temperatures.
There’s all kinds of evidence and mathematically inferred that temperature drives CO2. There’s scant evidence the other way around except for this nebulous theory with scant evidence the planet is actually 255K and GHE warms it to 288K. We just have to believe. And, if we don’t believe we’re deniers. Same thing with Evolution. All life started from one single-cell organism. If you don’t believe it you are a denier who doesn’t believe in science. Don’t worry about how the single-cell organism assembled itself. Just believe or you’re a denier. Something in common with these two sciences.
The most recent example of CO2 driving temperature is AGW.
You are Living through it while refusing to accept the evidence that it exists.
Entropic Man, please stop t-word-ing.
“All life started from one single-cell organism. If you dont believe it you are a denier who doesnt believe in science. ”
The main problem is that those who reject evolution replace it with a god, for whom there is no evidence whatever.
A (non-exhaustive) list of the major volcanic eruptions (VEI >= 5) before the Maunder Minimum
https://drive.google.com/file/d/1bh7NjyY970aHBuPn0xD2XP9cdogzvn2E/view
And between them, about 35 eruptions are known with VEI 3 or 4; sources for these are welcome, I don’t have them yet.
Volcanic eruptions might influence weather for a couple of years but the LIA was a major climate change, meaning global climates changed for 30+ years.
As always, ignoramus Robertson doesn’t understand the consequences of such an incredible series of VEI 5/6/7.
Hence he resorts his ignorant
” Volcanic eruptions might influence weather for a couple of years… “
From the surface of the Sun
https://youtu.be/OqLQyQtCNGg
Insect colouration is changing in response to climate change. But it’s complicated:
https://www.theguardian.com/environment/article/2024/jul/13/climate-insect-colours-sex-lives-study
It’s always complicated!
Yes, but we shouldn’t always talk about it. It makes the Three Stooges’ brains overheat. Which is danger enough already without AGW.
Do you know how much these ijits get paid for their studies?
As Will Happer claims, it’s all a scam.
All you have to do when applying for funding is mention support for anthropogenic global warming/climate change and money is thrown at you.
You don’t get rich in science. In England a scientist is paid half what a train driver earns.
I left science for teaching partly because the latter paid me enough to live on.
Entropic Man, please stop t-word-ing.
https://www.theguardian.com/us-news/article/2024/jul/10/heat-us-cities-study
Elliott can’t see reality.
Dr. Spencer has written a lot about UHI effect. It’s real, and likely distorts Earth’s actual natural warming trend.
But Elliott prefers to hide, cover his eyes and ears, and wear his tin-foil hat.
It seems that Clint R doesn’t read texts but merely scans them for presence of what he dislikes or absence of what he expects.
” Almost 34 million people in 65 major US cities, or 15% of the countrys population, are experiencing temperatures that are 8F higher than their surrounding areas, according to a new analysis from Climate Central, a non-profit research group.
That is largely due to built environments like parking lots and asphalt sidewalks, and a lack of trees, that contribute to whats known as the urban heat island effect. ”
Exactly what Roy Spencer discussed re: UHI (but Clint R never read, of course).
Bindi, I realize you have trouble with languages, but this is pretty clear: “Dr. Spencer has written a lot about UHI effect. It’s real, and likely distorts Earth’s actual natural warming trend.”
Maybe you need to try another online translator….
Clint R still didn’t understand.
Wrong again, Bindi.
I understand completely what a stalker you have become. You’re unable to support your false beliefs, so you resort to insults and false accusations.
There are several before you, get in line….
Current temperatures in Argentina.
https://i.ibb.co/QQhstj5/ventusky-temperature-5cm-20240713t1200.jpg
The winter 2024 in Argentina is pretty warm compared to 2022!
Absolute average June Tmin temperatures for Argentina (that’s like December in Poland, isn’t it)
1. Since 1908
1916 6 0.38
1971 6 0.46
1967 6 0.51
2022 6 0.59
1996 6 0.77
1984 6 0.90
2018 6 1.10
1964 6 1.17
1952 6 1.21
2007 6 1.37
2. Since 2000
2022 6 0.59
2018 6 1.10
2007 6 1.37
2002 6 1.65
2021 6 1.68
2016 6 1.84
2008 6 2.00
2012 6 2.08
2011 6 2.29
2020 6 2.54
2017 6 2.76
2000 6 2.84
2010 6 2.88
2014 6 3.02
2009 6 3.04
2024 6 3.09
Stop blaming fossil fuel companies – Climate Change is our own fault
https://youtu.be/iCMOzaudSe8
“…unfortunately, a lot of people mistrust physicists and their models.”
ark…”unfortunately, a lot of people mistrust physicists and their models.
***
It’s not physicists we mistrust, it’s hacker pretending to be scientists, especially those who program climate models.
A SpaceX rocket has failed, leaving the company’s internet satellites in an orbit so low that they’re doomed to fall through the atmosphere and burn up.
Is it over? It feels over. The majority of SpaceX employees are there less than a year; somebody’s losing their job over this.
NASA has proven beyond a doubt with SLS that one launch every three/four years leads to flawless performance, SpaceX should be forced to throttle back to this more sensible cadence.
Well as general thing, you want people to lose their jobs over this- though it’s a minor issue.
Launching rockets is hard. launching a rocket hundred times a year, would be considered “unrealistic”.
Musk wants to launch thousands of starships per year, and is almost finished with the factory to do it. But needs another thing, rapid turn around of the reusable rocket.
Any kind of usable rocket a decade or two ago, was considered unrealistic. Though before this, it was imagined the Space Shuttle, would fly once and week with just 5 “reuseable” and was toted it would lower launch cost to $25 per lb to LEO. And space Shuttle spent decades “proving it was impossible” so it had effect. If govt spends hundred of billions of dollars [in total over trillion dollars] over decades of time, it’s almost like proof it can’t be done {if you no idea of how utterly incompetent any government is or will ever be.]
It is very hot in Greece right now. Athens afternoon the temperature reaches 39C. At night it falls to 27C, so it is preferable to go out to grossery early in the morning.
Map of temperatures for the next week, from Tuesday and after till July 22-23 by meteorologist Ioannis Kallianos:
https://img-s-msn-com.akamaized.net/tenant/amp/entityid/BB1pUVPC.img?w=768&h=568&m=6
christos…can you buy Gatorade over there? It contains sodium and potassium, two essential elements required to replace electrolytes lost in very hot weather.
I tested this during soccer games in very hot weather. I made gallons of it for our team and it was clear by the end of the game that we were still fairly fresh while the other team was running out of energy due to heat prostration.
Of course, you can replace electrolytes naturally with food and liquids but it’s convenient to have a flavoured drink that does it immediately.
Thank you, Gordon.
Electrolytes are very important for life. Especially in the heat we experience in Greece.
I always wonder why doctors of medicine advice people to avoid salt.
The salt we use comes from sea. It has all the major necessary electrolytes, Sodium (NaCl), Potassium (KCl), magnezium (Mg) and Calcium (Ca).
Those electrolytes in salt are in a content of perfect combination needed for our health. After all life has initiated in the sea, so life is adapted to the salt.
Human life has been prolonged from ~ 40 years to ~ 80 years mostly because of introduction of use of salt as an everydays’ nutrient.
–
https://www.cristos-vournas.com
I think you mean, “it is preferable to do a grossoutery early in the morning”.
Elliott, please stop t-word-ing.
For those interested in how Greenland behaves: here is a Carbon Brief guest post, written by two scientists working at DMI, the Danish Institute for Meteorology, an institution not known for alarmism.
How the Greenland ice sheet fared in 2023
Dr Martin Stendel, Dr Ruth Mottram
https://www.carbonbrief.org/guest-post-how-the-greenland-ice-sheet-fared-in-2023/
Their report starts with
The Greenland ice sheet melt season 2023 is now over and it completes a 27th year in a row in which Greenland has lost ice.
The 2022-23 year saw both very high melt, particularly in July, but also higher than usual rain and snowfall in the late spring and early summer.
The increase in both melt and snowfall are exactly what scientists expect in a warming climate, and although they have tended to balance each other to some extent, Greenland has still ended up losing more ice than it gained.
As in previous years, while very high temperatures hit North America and Europe this summer, Greenland in between was comparably cool and wet. However, this was not enough to stop Greenland losing ice.
*
Nothing useful to Pseudo-skeptics, of course.
Bindi, sorry for bringing up reality, but Earth has been in a natural warming trend for about 40+ years.
For one of the dumbest of all Pseudo-skeptics I repeat:
Nothing useful to Pseudo-skeptics, of course.
Bindi, your childish attacks further reduce what’s left of your credibility.
Feel free to continue….
BREAKING NEWS
Gunshots reportedly fired at Donald Trump rally – as former president rushed off stage
https://news.sky.com/story/shots-fired-at-donald-trump-rally-as-former-president-rushed-off-stage-13177651
“Donald Trump was giving a speech in Pennsylvania when he appeared to fall to the ground – at which point he was surrounded by armed security staff.”
“Butler County District attorney Richard Goldinger told reporters that the suspected shooter is dead.”
He ducked, and quite rightly. Something seems to have zipped past his cheek and torn his ear.
Things are pretty miserable when people try to eliminate a presidential candidate via kangaroo courts and now shooting them. I blame the media for creating this madness and then fanning the flames. Their biased reporting and outright lies about Trump have surely help create the madness.
I blame the AR15.
Sorry, RLH, a gun is only dangerous when it’s in the hands of someone intent on causing serious injury. Most any common “deer rifle” would have been more deadly and more accurate than a generic AR-15. If you saw photos of the SWAT team stationed on the other roof, they were armed with bolt action rifles, likely high precision guns for which they probably had extensive training. No, the shooter is to blame and the fact that his choice of weapon did not produce the intended result was his fault, given the characteristics of the gun.
That is not to say that the shooter had a right to do what he did, even if Mr. Trump turns out to be as bad a president as some have projected. I’ve been reading John Bolton’s book describing his time in the first Trump White House and his presentation suggests that Trump was a seriously bad president. We are all living in interesting times…
–John Boltons book describing his time in the first Trump White House and his presentation suggests that Trump was a seriously bad president. We are all living in interesting times–
From point of view of republicans, Trump is New York Dem.
And Marxists {unions, class, etc, ideology} like him.
So, Trump ran in republican primary, because republicans allowed it {unlike the obviously rigged Dem primaries}.
The problem with Dem party, they gone so far Left {or so far totalitarian], it doesn’t even appear to be Left, it’s just insanity or machine politics insanity. So, like many dems, they didn’t leave the Dem party, but the Dem party left them.
Some republicans politicians and certainly many republican and independent voters, understand this.
“I blame the AR15”
A poor choice of weapon to snipe a target at over 100 meters.
I take pleasure in thinking the shooter knew he had failed before his miserable life was terminated.
gb…”John Boltons book describing his time in the first Trump White House and his presentation suggests that Trump was a seriously bad president”.
***
Bolton is an ingrate and an ijit.
John Bolton is an egomaniac and a typical swamp creature. Trump got things done. Bolton worried about diplomacy.
I blame the Supreme Court.
Their ruling that gave Trump immunity from prosecution for acts carried out in office legitimized political assassination.
Ironic that it has rebounded on the man who sought the ruling.
Anderson, Bolton has an ego? And, you think Trump doesn’t? In the chapter I just finished, it’s clear that Trump’s ego led to the North Korean dictator running all over him with regards to their programs for nuclear weapons and long range missiles. Bolton (and lots of other “swamp creatures”) think that failure to stop them was a seriously bad idea, but Trump had his own ideas.
The narrative in the book is of great interest for one who is interested in history. Of course, there are others involved who have written books and their differing points of view should be considered. Trump, however, didn’t read history before his election and probably hasn’t done any since. The last time around, there were people working for him that understood history and other situations beyond “making deals”, but should he be elected, the folks who wrote “Project 2025” will take over.
Nice try. Better luck next time.
Elliott, please stop t-word-ing.
BREAKING NEWS
Travel chaos and strict UEFA security measures await families of England players at Euro 2024 final.
The scramble to get flights is a stark difference to how things were earlier this week, with the families previously content with how easy it was to get flights prior to Wednesday’s semi-final win over the Netherlands.
But once the referee blew his whistle for the final time – confirming England’s place in this year’s final – it all changed. Literally within minutes of the final whistle all the direct flights to Berlin had gone, it’s a nightmare for us to get there now.
The families and friends who do make it to Berlin’s 71,000-capacity venue will watch Southgate’s men in a ‘neutral zone’ behind the dugouts to avoid being hit by flying beer. UEFA are thought to have responded to concerns raised by loved ones after they were “hit from all angles” at a previous game.
IT’S NEVER COMING HOOOOME! NEVER COMING HOME!!
Arkady, please stop t-word-ing.
While the Russian nomenklatura slaughters in Ukraine thousands of poorly trained and equipped soldiers every month (mostly from ethnic minorities in the most remote regions of the country), it watches indifferently as a million kilometers of forest burn down in Eastern Siberia.
Russia watched for 8 years before invading the eastern provinces in the Ukraine. They watched as the Kyiv government systematically repressed ethnic Russians trapped in the Ukraine due to being trapped there by an arbitrary drawing of a line on a map. They watched as the Kyiv government sent in the Azov battalion, a neo-Nazi battalion complete with swastikas and other Nazi paraphernalia on their flags, skin, and uniforms.
The US government had previously denounced Azov for their Nazi ideology but the current US government ignored that denouncement. The Russians finally said, “enough is enough” and went into eastern Ukraine at the request of the stranded former Russian citizens.
Of course, the fake-news western media, the same one that upholds the IPCC propaganda about climate change, reported the invasion as a Russian attempt to take over the Ukraine. Time has proved them wrong, the Russians have done exactly what they set out to do: eliminate the Azov battalion and secure the eastern region for ethnic Russians so they can vote on whether to remain in the Ukraine.
This could have been handled a lot better by an open-minded and democratic West, who should have noticed the unrest in Eastern Ukraine and sanctioned the Ukraine, rather than Russia. However, the plan was to enable Kyiv to the point of helping over-throw a democratically-elected pro-Russian president in 2014.
We in the West messed up big time in our hysterical anti-Russian stance. I have my own issues with Russia, such as backing the murderous regime in Syria, but the problem in the Ukraine is clearly different. There are obvious fascist, neo-Nazi leaders operating in the Ukraine, even sitting in their Parliament. They are armed and obviously backed by the police and army, who did nothing when the fascists openly ran off a democratically-elected president in a coup.
Don’t talk to me about Russian issues when we in the West clearly don’t care about democracy in the Ukraine. Democracy is not about a foreign country holding rallies in the Ukraine against a sitting leader then helping to run him off before helping appoint a new leader.
As always, Robertson the butt-kisser of Russia’s Nomenklatura utterly lies.
And the best part is that what he is telling us about Russia’s aggression against Ukraine, which supposedly only occurred because of the oppression of the Russian-speaking population, is EXACTLY the same discourse that the far-right parties in Germany, Italy, France and… the USA, openly supported by Russia, constantly cultivate and spread.
*
If Robertson had even a modicum of knowledge about what is happening in the world, then, instead of spouting egomaniacal stories here on this blog, he would know that the Russian invasion of Ukraine did not actually begin in the Russian-speaking areas, but first with an attempt to invade… Kiev.
The Russians in Moscow were so convinced of their superiority that they thought they would bring Ukraine to its knees within three days.
*
Instead, they have been fighting for weeks over individual villages in the Donbass and are dropping glide bombs on civilian targets every day; a few days ago they destroyed the children’s cancer hospital in Kiev.
*
Slowly but surely, I’m starting to enjoy the idea of some Ukrainian intelligence agents tracking down Robertson in Vancouver, dragging him to Kiev, and putting him in the fire department there to watch the Russians launch a first bombing raid on a residential area and then a second one 15 minutes later to kill as many helpers as possible.
Had time this morning to go back and check comments, and found sneaky child Nate at work. He came on 5 days after my comment!
https://www.drroyspencer.com/2024/07/uah-global-temperature-update-for-june-2024-0-80-deg-c/#comment-1677544
He falsely accuses me, where he believes I won’t see his comment. It’s the usual tactic of a cult child.
Then, he insinuated that I was wrong about the fact that all points on Moon are moving at the same velocity!
We can’t expect children to understand vectors….
Each point is not moving at the same velocity, but at the same angular speed.
Wrong again, gordon.
Each point is moving with the exact same velocity as Center of Mass. Like the cult, you’re confusing Kinematics with Orbiting. You’re choosing center of orbit as the reference. That’s wrong. The correct reference is Moon’s CoM. All points on Moon move with the same velocity vector. If they didn’t, you would know about it….
Each particle is not moving with the same velocity as the COG during orbital motion, the COG velocity being an average in a rigid body. If the motion was rectilinear, then all particles would have the same velocity.
If the body was not uniform, the COG would be determined by summing individual velocities. That’s how the COG is found.
If you have a uniform rigid body like the Moon, being tracked by a radial line from Earth’s centre and passing through the lunar COG, the individual particle velocity from the near side to the far side must increase. Each point must complete the orbit in the same time while covering a greater distance.
Sorry, still wrong gordon.
You’re confused about motions. All points on Moon have the same velocity vector.
You’re even wrong about angular speed. If Moon’s orbit were a perfect circle, then all points would have the same angular speed. But, the orbit is elliptical, resulting in different points having different angular speeds. We see this in “libration”.
I don’t expect you to understand….
A vector has both direction and a scalar quantity indicating the strength of the vector. The scalar quantity multiplies a unit vector by the amount indicated, making it longer or shorter. Of course, it’s counter-productive to draw vectors of significantly different lengths so the vectors are generally drawn the same length with the length marked. In engineering drawing, we often draw the vectors to scale.
The vectors representing each point on the Moon certainly have the same direction but the scalar quantities are different, making the vectors longer or shorter.
A vector representing a uniform rigid body like the Moon is placed at its COG since no one is interested in the individual velocity vectors of particles. The vector at COG is intended to represent all particles as a sum. We have broken the Moon into individual particles to illustrate they are all moving in parallel. However, you’d never find such a reference in engineering kinematics.
It would help immensely in your posts if you dropped the snarky attitude of knowing it all thus leading to snide remarks about the abilities of other posters in lieu of a scientific explanation. Of course, you lack the ability to offer valid scientific explanations hence the snarky attitude.
Stick with me and I’ll teach you basic physics from an engineering perspective.
Gordon,
The Moon is not a uniform rigid body.
It is deformed by the gravity of the Earth.
It has a lot of craters, and there’s the Man on the Moon.
gordon, when you start rambling incoherently, then I know I’ve won.
I’m glad you can look up what a vector is, but you need to understand it. Reading a definition is good, but you need to understand the vast ramifications. For example, you keep using COG, instead of CoM. Vectors here apply to Center of MASS.
Continually demonstrating you don’t understand is proof you’re no where near the level of an electrical engineer. You don’t even understand current flow….
Clint,
“Then, he insinuated that I was wrong about the fact that all points on Moon are moving at the same velocity!”
Of course you are wrong about that.
Use your head and your ball on a string to prove that the velocity of the far side is more than the velocity of the near side.
You’re throwing crap against the wall again, bob.
Are there any responsible adults in your cult?
Obviously not….
Which is longer? The radius formed by the far side or the near side relative to Earth?
RLH, are you saying your knowledge of orbital motion is even less than your knowledge of vectors?
Answer the question.
Gladly, RLH.
The answer is “Yes”. Your knowledge of orbital motion is less that your knowledge of vectors. You have a vague idea of what a vector is, but you have no clue what orbital motion looks like, specifically “orbiting without spin”.
But keep stalking me. You might learn something yet….
rlh…”Which is longer? The radius formed by the far side or the near side relative to Earth?
***
What does that have to do with what is being discussed? It’s not the length of the radial vector that is being considered, but the rate of change of angle of the entire radial vector with the x-axis.
Each point of that radial vector is moving parallel to any other point and all points collectively are moving at the same angular speed.
Clint,
It is basic trigonometry
There are two lengths, one to the near side (R) and one to the far side (R + D)
Where R is the distance to the near side, and R + D is the distance to the far side.
Assuming a circular orbit, for simplicity
The velocity of the near side is (Pi*R)/the lunar month.
The velocity of the far side id (Pi*(R+D))/the lunar month.
Another failing grade.
[RLH]
Which is longer? The radius formed by the far side or the near side relative to Earth?
[Clint] Yes
Comedy Gold.
Clint ATFQ
bob, your learning disability is likely affected by your immaturity.
Clint,
Are you going to answer the question or not?
“Which is longer?”
Is the question. ‘Yes’ is not the answer.
bob and RLH, the question I answered was the one RLH asked me to answer, which was my question to him. You kids need to learn how to follow the thread.
You also need to learn that I only answer responsible questions.
Clint,
Did you ask a responsible adult for the correct answer?
Where’s your “viable model”, bob?
Clint,
I’ll show you mine if you show me yours.
But then you don’t have one.
As I’ve said bob, you’re a child.
Thanks for proving me right, again.
Clint,
But a precocious on at that.
Try another insult, other than that you have nothing.
To summarize, Clint asked me to find a post where he got the physics wrong. Did that. His physics was spectacularly wrong.
Now he is just squirming.
Ahh yes.
The good old orbital motion debate.
Patriotism: “the last refuge of the scoundrel”
Orbital motion: “the last refuge of the disgraced climate change sceptic”
Bob…you are confusing velocity with angular speed. It is true that in a rigid body like the Moon, the further you move out along a radial line the higher the velocity must be. However, you are missing the obvious that each point along that radial line must complete an orbit in exactly the same time. Therefore, all point on that radial line are moving at the same angular speed.
Angular speed is a measure of the rate at which the angle between the radial line and the x- or y-axis changes per unit time. It has nothing to do with individual points along the radial line or their velocity. And, it is angular speed that determines the orbital mechanics of a rigid body, not the velocity of individual points.
With a uniform rigid body like the Moon, the velocity of the COG is used. At no time are the individual particle velocities considered.
It is obvious that the angular speed of all points on the Moon are the same, degrees per second, or radians per hour, but that is not velocity, which is meters per second, or miles per hour.
Watch a slow motion professional golfer swing a club.
Which would you rather be hit by, the handle or the club face?
Obviously the handle, the club face moves in excess of 100 miles per hour.
“With a uniform rigid body like the Moon, the velocity of the COG is used. At no time are the individual particle velocities considered.”
But who is stopping me from considering the velocity of the individual particles of the Moon.
When it leads to an undeniable proof that the Moon is rotating on an internal axis, just like any Astronomer will tell you.
Draw a vector from the center of gravity of the Moon to a point on the surface, does that vector point continuously in one direction?
bob…you are still missing the point, velocity of individual particles does not factor into the motion, or kinematics, of a rigid body. If the rigid body is uniform, like the Moon, the COG is used in lieu of summing the velocities of individual particles.
I introduced the individual velocity issue only to illustrate that all particles in the Moon are moving parallel to each other.
Secondly, the difference in individual particle velocity is a result of the motion of a uniform body in orbit, not a driver. In other words, it has no bearing on anything, just a curiosity.
The problem for you is this. The individual particle velocity does not prove the Moon is rotating it proves the opposite, that it is not, since all particles are moving in parallel.
Gordon,
The Moon moves in an elliptical orbit, nothing on the Moon is moving parallel to anything else.
To be parallel requires motion in a straight line.
bob…to analyze motion on an ellipse requires breaking the motion into instantaneous motions, unless of course, you simply want an average speed over the entire orbit or a significant part of it.
If you examine the instantaneous motion of all particles al0ng a radial line through the Moon, it is obvious they are all moving in parallel at any one instant. That means they are moving in parallel at every instant.
I know you disagree, but concentric circles, or ellipses, are parallel to each other.
bob…to prove my point, take any point on an ellipse. Draw a line to that point from each focal point, then bisect the angle formed. At the point where the bisector meets the point, draw a line at right angles to it and that gives you the tangent line.
If you do the same for any concentric ellipse, and find the tangent line for the equivalent point on that ellipse, you will see both tangent lines are in parallel.
Gordon state:
“If you examine the instantaneous motion of all particles al0ng a radial line through the Moon, it is obvious they are all moving in parallel at any one instant.”
and
“Therefore, all point on that radial line are moving at the same angular speed.”
Not quite. If these were precisely true, there would be no libration. (Specifically, no libration in longitude.)
Gordon,
Sorry but concentric does not equal parallel. You are getting them confused.
“In geometry, parallel lines are coplanar infinite straight lines that do not intersect at any point. Parallel planes are planes in the same three-dimensional space that never meet. Parallel curves are curves that do not touch each other or intersect and keep a fixed minimum distance.”
Parallel lines not parallel curves.
Gordon,
“If you do the same for any concentric ellipse, and find the tangent line for the equivalent point on that ellipse, you will see both tangent lines are in parallel.”
Except the Moon does not follow those parallel lines, it’s trivial to find a tangent line on one ellipse that is parallel to another tangent line on another ellipse.
That doesn’t prove anything.
bob..at any instant, all points on the Moon are moving in parallel. The next instant, same thing.
You are thinking in terms of rectilinear motion. Curvilinear motion is a sum of instantaneous rectilinear motions along a curved path.
tim…libration has nothing to do with orbital motion it has to do with the view angle from Earth of the near side. Due to the elliptical orbit, that view angle changes and creates an illusion of rotary motion.
As usual the question is “velocity relative to what?.”
What is more interesting is the consequences. The whole Moon is moving at the orbital velocity of its centre of gravity.
The surface nearest the Earth is moving slower than its proper orbital velocity and is trying to drop into a lower orbit.
The surface furthest from the Earth is moving faster than its proper orbital velocity and trying to move outwards to a higher orbit.
. This creates a force stressing and straining the Moon along the Earth-Moon axis. The result is that the Moon is slightly egg shaped because of these tidal forces.
If the Moon’s orbit dropped too close to the Earth (inside the Roche limit) the tidal forces would be stronger than the Moon’s gravity and it would disintegrate as its’s parts followed completely different orbits.
As usual:
https://www.drroyspencer.com/2024/03/uah-global-temperature-update-for-february-2024-0-93-deg-c/#comment-1639879
DREMT,
Facts matter, your opinions do not.
Points 1) – 4) are correct. 2) is mathematically proven, and you conceded it was correct yourself, only recently.
“timlibration has nothing to do with orbital motion …”
Yes, it does.
“it has to do with the view angle from Earth of the near side. ”
Exactly. The view angle changes because the angular speed of the moon around the earth is different from the angular speed of the moon around its axis. If the two angular speeds were identical, the same side of the moon would exactly face the earth all the time and we would not see libration.
Here, bob:
https://www.drroyspencer.com/2024/06/uah-upper-tropospheric-temperatures-corroborate-lt-temperature-trends/#comment-1676896
DREMT says: “correct … mathematically proven …”
This requires a clear, testable definition. WHich you have yet to give.
In math (and physics) “rotation” is defined as:
1) keeping a constant distance from defined line (known as the axis)
2) changing orientation relative to that axis.
If the axis is a vertical line through the center of the ball-on-a-string, then the ball is rotating about that axis.
If you have an alternate definition, feel free to give it.
Point 2) is mathematically proven, Tim. You’re talking about point 1), relating to the ball on a string. Once you can concede that point 2) is correct, like bob did, recently, we can move onto point 1).
Folkerts has tried this before: “If the axis is a vertical line through the center of the ball-on-a-string, then the ball is rotating about that axis.”
The axis changes direction as the ball changes direction, so there is NO spin.
They just keep throwing crap at the wall. If they had a viable model of “orbiting without spin”, that would be something. As it is, they’ve got NOTHING.
DREMT,
“Points 1) 4) are correct. 2) is mathematically proven, and you conceded it was correct yourself, only recently.”
Yes, but applying it to the Moon is incorrect.
It’s trivial, irrelevant, and not applicable to the motion of the Moon.
Link to the mathematical proof:
https://web.archive.org/web/20231016085906/https://www.drroyspencer.com/2020/12/uah-global-temperature-update-for-november-2020-0-53-deg-c/#comment-566034
DREMT,
“Once you can concede that point 2) is correct, like bob did, recently, we can move onto point 1).”
Point 1) is first, so we can address that point.
Put a toothpick through the ball on the string.
As you revolve the ball around one hand while holding onto the toothpick.
You will note that the toothpick rotates in your hand, telling you that the toothpick is rotating, therefor the ball is rotating around the toothpick, which represents an internal axis of the ball on a string.
bob keeps throwing the same crap against the wall.
The “toothpick” is NOT spinning. By moving the ball with your hand, you are attempting to replicate gravity, which changes direction of Moon (whereas the sting does the same for the ball).
bob doesn’t understand orbital motion so he keeps throwing crap against the wall to protect his cult beliefs. He MUST have a viable model of “orbiting without spin”, or he has NOTHING.
bob has conceded point 2) is correct. Let’s see if Tim can. It’s important to have a place of agreement to start from. Once Tim has agreed on 2), we can move onto 1).
“Curvilinear motion is a sum of instantaneous rectilinear motions along a curved path.”
What causes the curved path?
Clint,
“The toothpick is NOT spinning. By moving the ball with your hand, you are attempting to replicate gravity, which changes direction of Moon (whereas the sting does the same for the ball).”
You haven’t tried it, so you don’t know what you are talking about.
Of course the toothpick is spinning.
“bob doesnt understand orbital motion so he keeps throwing crap against the wall to protect his cult beliefs. He MUST have a viable model of orbiting without spin, or he has NOTHING.”
Of course I understand orbital motion, the Moon is tidally locked to rotate on its axis with the same period as it revolves around the Earth, as any Astronomer will tell you.
You don’t have a viable model of orbiting without spin, as your model is spinning.
I am glad to be in the cult with all the Nobel prize winners, your cult has none and can only build airplanes out of the available vegetation, which don’t fly, so you can’t get of the island.
Sorry bob, but that’s nothing new. You’re just regurgitating your cult beliefs.
You don’t understand orbital motion. You MUST have a viable model of “orbiting without spin” or you have NOTHING.
Clint,
Where is your model of orbiting without spin?
Oh, that’s right, you don’t have one.
Yes bob, you’re a child, as I’ve said.
Thanks for proving me right.
Clint,
More insults please.
While we wait for Tim to respond, a quick quiz for bob.
bob, you’ve conceded that point 2) is correct, which means you agree that one way to describe movement like the "moon on the left" (MOTL) is "rotation about an external axis with no rotation about an internal axis". At the end of point 2), I write:
"Don’t forget that nobody is saying the motion of the MOTL can’t be described in another way"
Can you remember what is the other way that movement like the MOTL can be described?
DREMT,
Yes, that would be revolving around the Earth while rotating on an internal axis.
Try this quiz, I’ll give you a clue, zero is not one of the answers.
https://www.free-astronomy-quiz.com/moon_q1.html
Incorrect, bob. The correct answer is:
Translating in a circle whilst rotating about an internal axis.
We’re nowhere near discussing "revolution" yet. We’re keeping it strictly about kinematics, for now. No need for any astronomical terms, yet.
Now, the movement of the MOTL can be described as either:
a) Rotation about an external axis with no rotation about an internal axis.
b) Translation in a circle with rotation about an internal axis.
It could be either…we’ll never know for sure because it’s just an animation. The underlying mechanics are not known, and cannot be known.
A ball on a string, however, is a very different beast. Back to our a) and b):
a) consists of only one motion.
b) consists of two motions.
Would you say the mechanics of the ball on a string are such that you can describe it as consisting of two motions, or is only one motion the appropriate description?
bob, if you feel insulted by reality, that should be telling you something….
DREMT,
The Moon is a discussion about Astronomy, not Kinematics, you are in the wrong building. Hint: it’s the building with a dome on top.
“Were nowhere near discussing “revolution” yet. Were keeping it strictly about kinematics, for now. No need for any astronomical terms, yet.”
You are not going to hold me back from discussion what I want to discuss, you are not the moderator, and not the censor.
You can discuss Kinematics all you want, but it does not apply to Astronomy, because Kinematics deals with rigid bodies, and the Moon is not a rigid body.
Since the ball on a string has both velocity and acceleration, how many variables does it take to describe the motion?
One, two, more than two?
A hint for bob, from his old pal Little Willy:
"What we can’t do is to pretend that one motion is actually two independent ones when mechanically they’re not"
The ball on a string makes only one motion. It’s swung about the central axis on a string.
Simple as that. a) is therefore the correct description for the movement of the ball on a string, and thus the ball itself is not rotating on its own internal axis.
Also, note that those two options, a) and b), are "absolute" descriptions. They apply to objects moving like the MOTL regardless of frame of reference.
So, that proves my point 3) correct, also.
Points 1), 2), and 3) should now all be agreed with, by bob.
Clint,
I am not insulted by reality, nor you, your insults are like water on a duck’s back.
You can’t win an argument, so you result to insults.
That’s all your cult has.
Now, back to work on the plane.
"you are not the moderator, and not the censor"
Absolutely, bob. I’d never want to be either. I despise censorship.
DREMT,
The Moon is not translating in a circle, because it revolves around the Earth in an ellipse.
Also not a rotation, because the Earth is at one of the focal points, not the center of the ellipse.
Wrong on both counts.
Maybe it’s time to discuss the motion of the Moon with respect to Kepler’s laws.
bob, I couldn’t really care less about the moon. I’m interested in points 1) – 4). From those points, you can certainly get to a very convincing argument that the moon doesn’t spin, if you’ll allow me to get there. However, whether the moon spins or not is probably the least interesting part about the moon discussion. Certainly I’ve spent 90% of my time in the moon discussion defending my points 1) – 4) in various ways from people who are convinced that they’re wrong, even though I know for certain that they’re correct…and those points 1) – 4) are correct whether the moon spins or not.
Try to focus on point 1), bob. I’ve just explained why the ball on a string is not rotating on its own internal axis.
Anything to say about the argument I made, or will it just be more evasion?
bob, if you’re not insulted by reality, then quit whining when I slap it on you.
DREMT,
“bob, I couldnt really care less about the moon.”
That’s where the whole mess started.
Also, that is why you have refused to define rotation.
“if youll allow me to get there.”
Well I won’t because 1 and 3 are wrong.
Stick a toothpick into the ball and as it revolves around notice the toothpick spins in your hand if you try to hold the toothpick.
Or try to revolve a baseball around a basketball, holding one face of the baseball towards the basketball, you will note that you have to rotate the baseball to keep the one face towards the basketball, again experimental evidence trumps your mind games.
Only inertial reference frames decide the matter, you have to use one to figure out what is happening.
Clint,
“bob, if youre not insulted by reality, then quit whining when I slap it on you.”
Damn, you missed again.
Next time try to hit me with your physics textbook.
bob goes for more evasion.
I made an argument for point 1) and you completely ignored it.
Sure, we can go with an inertial reference frame; it makes no difference, because the two options for describing the movement of the ball on a string are still:
a) Rotation about an external axis with no rotation about an internal axis.
b) Translation in a circle with rotation about an internal axis.
Option a) consists of only one motion, and option b) consists of two.
Mechanically, the movement of the ball consists of only one motion, as it’s being swung around a central axis on a string. That’s one motion. Not two.
So, option a) is the correct description.
Wrong again bob.
You got caught in full child-mode. You tried to whine your way out. But you don’t realize “truth” is part of reality.
What will you try next?
Time to stop playing with the mice, until they define what they mean by rotation about an internal axis, then we can continue the discussion.
And by the way, if something is rotating on an internal axis and you attach something to it, then that something is also rotating on an internal axis.
Clint,
One of your tricks.
I wasn’t whining about your insults, I was just pointing out that when you lose an argument you result to insults.
Reality bites.
More evasion from bob. He simply cannot deal with the argument that’s been made.
He obviously knows what is meant by “rotation about an internal axis” as he has already agreed to my point 2)! So that’s just another silly diversion attempt.
There you go again, bob.
You can’t speak truth. You just keep throwing crap against the wall.
What will you try next.
DREMT,
“He obviously knows what is meant by rotation about an internal axis as he has already agreed to my point 2)! So thats just another silly diversion attempt.”
That’s your example of no rotation, I want a definition of rotation about an internal axis.
A definition, not an example, pretty please.
You have agreed with point 2), thus you already know.
DREMT,
Your evasion is noted.
I want to know how you define internal rotation for a body in an elliptical orbit.
Your 2) does not apply to the question at hand.
We’re nowhere near ready for that, bob.
Your repeated evasion of my argument in favour of point 1) can only be seen as a direct concession. Thank you.
That means you have now effectively agreed to all four points.
DREMT,
This video shows that a ball on a string is rotating on its internal axis.
https://checkyourfact.com/2023/05/15/fact-check-astronaut-faking-space/
Reference frames do resolve the issue, from an inertial reference frame the Moon is rotating on an internal axis, from a rotating reference frame, say the surface of the Moon, the Moon appears to be stationary and everything else is revolving around the Moon.
4) Watch carefully from 0:30 to 0:40 as one motor rotate the Moon counterclockwise and one motor rotates the Earth counterclockwise at the same rate. Count the number of rotations the Moon makes as it orbits once. It is two rotations per orbit, so if the motor rotating the Moon internally was turned off, the Moon would still rotate around its internal axis once per orbit.
So in conclusion both videos prove that the Moon is rotating.
DREMT,
“Were nowhere near ready for that, bob.”
Censoring observed.
P1) Regardless of reference frame, the two options for describing the movement of the ball on a string are:
a) Rotation about an external axis with no rotation about an internal axis.
b) Translation in a circle with rotation about an internal axis.
P2) Option a) consists of one motion, option b) consists of two motions.
P3) Mechanically, the movement of the ball on a string is one single "swinging motion". Not two motions.
C) The ball on a string is not rotating on its own internal axis. Additionally, thanks to the "regardless of reference frame" in P1), my point 3) is also correct.
Dispute the premises, or accept the conclusions.
In conclusion, DREMT’s 10:51 am premises are easily disputable since all motion is relative.
DREMT doesn’t specify which ref. frame DREMT is observing from as DREMT skips between two frames (one inertial and one accelerated) without informing the reader. Correctly informing the reader:
P1) Depending on observation reference frame, the two options for describing the movement of the ball on a string are:
a) Rotation about an external axis with no rotation about an internal axis observed in an accelerated frame.
b) Translation in a circle with rotation about an internal axis observed in an inertial frame.
P2) Option a) consists of one motion observed, option b) consists of two inertial motions observed.
P3) Mechanically, the movement of the ball on a string is one observed single “swinging motion” in an accelerated frame. Not two observed motions as in an inertial frame.
C) The ball on a string is observed not rotating on its own internal axis in an accelerated frame. Additionally, thanks to the “depending on reference frame” in P1), my point 3) is also observationally correct.
Dispute these premises, or accept the conclusions.
The astronaut video shows that the ball on a string rotates on an internal axis.
Case closed.
… in an inertial frame.
The astronaut video is a nice demonstration that the ball on a string’s movement consists of one single, smooth, "swinging motion"…regardless of whether I observe that motion from outside the "orbit" of the ball, from the centre of the "orbit" of the ball, or even from the surface of the ball itself!
Nothing changes that reality. Not what happens to the ball after release, not changing your frame of reference…nothing. It’s movement consists of one single motion.
And, that settles both 1) and 3) in my favour (not that there was ever any doubt, anyway).
Unless bob has any objection to any of the three premises?
It’s movement consists of one single motion..in an accelerated frame. Can always tell from which frame DREMT is observing when he omits to tell the reader his position which then settles both 1) and 3).
Ball4, simply changing my words to suit yourself is not an acceptable way to debate. Just so you know.
Adding to DREMT’s words to include position of observation settles the issue once and for all. As bob writes, that closes the case since all motion is relative.
…but you’re not doing that, because I already specified: "that the ball on a string’s movement consists of one single, smooth, "swinging motion"…regardless of whether I observe that motion from outside the "orbit" of the ball, from the centre of the "orbit" of the ball, or even from the surface of the ball itself!"
You see, Ball4, you’re changing my words. Not adding to them. You’re changing them. If you disagree that the movement consists of one motion regardless of where you observe it from, say so. Don’t just respond by changing my words to what you want to hear.
Yes, I changed DREMT’s words where correction was necessary since “regardless of reference frame” is simply wrong in that all motion is relative. Then I added to DREMT’s words to clarify the position of DREMT’s observations of the ball on string.
Let me try to help DREMT with some artificial intelligence; just enter into google this string:
is all motion relative?
Ball4 doesn’t seem to understand that "is all motion relative?" is not relevant to the discussion, because we’re talking about the number of motions a movement consists of.
… which varies depending on the observation’s frame of reference.
I see DREMT hasn’t yet learned from applying some artificial intelligence.
"…which varies depending on the observation’s frame of reference."
No, Ball4, it doesn’t. You seem to think absolutely everything is dependent on the observation’s frame of reference.
It’s not a question of relative motion. It’s a question of how many motions are present.
It’s like you think "translation in a circle" can become "rotation about an external axis" dependent on frame of reference!
Not everything, DREMT, just all motion is relative.
Try using some artificial intelligence to comment correctly on all motion. All means ALL, no exceptions.
Do you think "translation in a circle" can become "rotation about an external axis" dependent on reference frame, Ball4?
Your comments suggest you do, I just want to hear you explicitly say so.
DREMT 1:29 pm drops out the object being discussed & tries in vain to change the subject while ignoring the help offered from employing artificial intelligence. Get back to the point of a ball on string DREMT so dispute these premises, or accept the conclusions:
P1) Depending on observation reference frame, the two options for describing the movement of the ball on a string are:
a) Rotation about an external axis with no rotation about an internal axis observed in an accelerated frame.
b) Translation in a circle with rotation about an internal axis observed in an inertial frame.
P2) Option a) consists of one motion observed, option b) consists of two inertial motions observed.
P3) Mechanically, the movement of the ball on a string is one observed single “swinging motion” in an accelerated frame. Not two observed motions as in an inertial frame.
C) The ball on a string is observed not rotating on its own internal axis in an accelerated frame. Additionally, thanks to the “depending on observation reference frame” in P1), my point 3) is also observationally correct.
To dodge the question is to concede, Ball4.
Thx.
DREMT 1:43 pm doesn’t dispute these 1:42 pm premises, so by DREMT’s own words must then accept the conclusions. Thank you.
I have disputed your premises, though.
You’re wrong when you argue that the number of motions there are in a certain movement depends on frame of reference.
You’re also wrong when you apparently think “translation in a circle” can become “rotation about an external axis” dependent on frame of reference.
No dispute of the 1:42 pm premises at either 1:43 pm or 2:02 pm.
Thank you, DREMT, for accepting the 1:42 pm conclusions. DREMT’s acceptance is the correct choice of the two options since all motion is relative.
DREMT,
After the Astronaut lets go of the ball, it is moving in a straight line and rotating on its internal axis, that’s two motions.
Since it is still spinning, that means it was spinning before it was let go, according to Newton’s first law, an object at rest will stay at rest until a force acts on it, and an object in motion will stay in motion until a force acts on it.
So before being let go the ball was rotating on its axis and revolving in a circle, that’s two distinct motions.
So you are just going to lie? I told you what I disputed.
bob: you can see that, mechanically, there is only one motion for the ball before it is released. Not sure why you are in denial of what your own eyes show you.
Yes, it moves in a straight line and spins after release…and, that has been discussed before. So, you already know what my response would be, if I could be bothered to repeat myself. Which I can’t.
Sure, at 1:29 pm, DREMT changed to a new unnamed object premise which has not been discussed. I’m happy to discuss DREMT’s 1:29 premise in light of DREMT has accepted the 1:42 pm premises without dispute twice now and thus the conclusions. I’m happy to apply the 1:42 pm conclusions to the new 1:29 pm DREMT challenge.
Just add in specifically what physical motion is the unnamed 1:29 pm object observed doing in the new DREMT challenge of “”translation in a circle that can become “rotation about an external axis” dependent on reference frame”?
DREMT,
If your premise is the ball on a string is only one motion, then yes I object.
It has two motions, one is its velocity, and the other is its acceleration.
If you remember your basic physics, those properties have different units, thus they must be different motions.
It’s the same object, Ball4, the ball on a string, being swung in a circle. In your premise 1) you state:
“P1) Depending on observation reference frame, the two options for describing the movement of the ball on a string are:
a) Rotation about an external axis with no rotation about an internal axis observed in an accelerated frame.
b) Translation in a circle with rotation about an internal axis observed in an inertial frame.”
Which suggests to me you don’t realise that “translation in a circle” and “rotation about an external axis” are two completely different motions, regardless of reference frame. Which is why you need to add rotation about an internal axis to the former to get movement like a ball on a string, but not the latter.
bob:
https://www.quora.com/What-is-the-difference-between-motion-and-velocity#:~:text=Whereas%20Velocity%20is%20the%20speed,time%20in%20a%20perticular%20direction.&text=Speed%20is%20known%20as%20a,magnitude%20(distance%20%2F%20time).
DREMT 2:36 pm, as you note what I realize, and you now agree without any dispute so far, is specifically this:
“P1) Depending on observation reference frame, the two options for describing the movement of the ball on a string are:
a) Rotation about an external axis with no rotation about an internal axis observed in an accelerated frame.
b) Translation in a circle with rotation about an internal axis observed in an inertial frame.”
This should NOT suggest to DREMT I realize anything different. At all.
If DREMT wants to discuss something with different wording than the 1:42 pm quote he clipped such as a “suggests to (DREMT)” 1:29 pm worded situation, then fine, fill in the BOS details for that motion.
Ball4, your first premise is wrong because “rotation about an external axis” and “translation in a circle” are two different motions, regardless of reference frame. Your second and third premises are wrong because the number of motions there are in a particular movement does not depend on reference frames. Clear enough?
That “rotation about an external axis” and “translation in a circle” can be different motions, regardless of reference frame is not a dispute of the words in DREMT’s 1:42 pm clip, they are selected words taken out of context with the clip.
Your dispute that the number of motions doesn’t depend on reference frames means DREMT disputes all motion is relative. DREMT’s dispute fails since all motion IS relative.
DREMT has again no valid dispute of the 1:42 pm premises. Therefore, the 1:42 pm conclusions stand.
Thank you, DREMT, for again having no valid dispute so DREMT remains accepting of the 1:42 pm conclusions. DREMT’s acceptance is the correct choice of the two options since all motion is relative.
Let me once again try to help DREMT with some artificial intelligence; just enter into google this string:
is all motion relative?
A ball on a string either moves with one motion, or it moves with two. That is not decided by a choice of frame of reference, as much as you wish it was.
You have "rotation about an external axis", and you have "translation in a circle", as one of the two potential motions. The other potential motion is "rotation about an internal axis".
If the ball on a string is moving with "rotation about an external axis", then there is no way it can also be "rotating about an internal axis". That was demonstrated by Ftop_t, in the mathematical proof that I linked to, further upthread.
If the ball on a string is moving with "translation in a circle", then it could also be "rotating about an internal axis". That would be two motions, then.
However, the ball on a string is not moving with two motions. The ball has only one. It’s being swung about a central pivot point on the end of a string. We know that "rotation about an external axis" is the correct choice of motion, because that is what is happening to the ball. It’s quite literally being swung about an axis that is external to the ball. It couldn’t be more clear cut.
DREMT,
https://www.drroyspencer.com/2024/07/uah-global-temperature-update-for-june-2024-0-80-deg-c/#comment-1679218
You answered a question I did not ask.
You can search for the difference between velocity and acceleration.
And read up on Newton’s laws, you are running afoul of them.
You said velocity was a motion, bob. The link corrects you on that, spelling out the difference for you.
No problem with Newton’s first law of motion. The ball is in motion before release, and the ball is in motion after release. Both sides can agree there. The question of whether there are two motions before or only one is, of course, not something that the law covers.
DREMT,
Your source says velocity is the speed of motion.
So velocity is a motion.
You characterize a motion be measuring its speed and velocity, they are components of the motion, or part of the motion.
That you have to split hairs this fine says something.
If the ball is rotating after it is released, then by Newton’s laws, which you claim to be fine with, it was rotating before release.
Because there was no force acting on it to stop the rotation.
bob, the types of motion referred to throughout this are “rotation about an external axis”, “translation in a circle” and “rotation about an internal axis”. That you would try to obfuscate the issue with anything else says something. It says you are desperate.
The ball is rotating beforehand…just not on its own internal axis. Still, that means the tangential velocities of parts of the ball will be different, and so, when the transition from circular motion to linear motion occurs, the ball will then rotate on its own internal axis.
DREMT does get some of the BOS motion right, “a ball on a string either moves with one motion, or it moves with two” depending on frame of reference (inertial or accelerated) in which the observation of the motion is made.
DREMT 4:00 pm, again has not put up a valid dispute; since all motion is relative DREMT must remain in acceptance of the 1:42 pm conclusions. DREMT’s acceptance is the correct choice of the two options.
DREMT still skips between two frames (one inertial and one accelerated) without informing the reader. Correctly informing the reader:
P1) Depending on observation reference frame, the two options for describing the movement of the ball on a string are:
a) Rotation about an external axis with no rotation about an internal axis observed in an accelerated frame.
b) Translation in a circle with rotation about an internal axis observed in an inertial frame.
P2) Option a) consists of one motion observed, option b) consists of two inertial motions observed.
P3) Mechanically, the movement of the ball on a string is one observed single “swinging motion” in an accelerated frame. Not two observed motions as in an inertial frame.
C) The ball on a string is observed not rotating on its own internal axis in an accelerated frame. Additionally, thanks to the “depending on reference frame” in P1), my point 3) is also observationally correct.
DREMT can’t validly dispute these premises, so has to accept the conclusions. Thanks.
“DREMT does get some of the BOS motion right, “a ball on a string either moves with one motion, or it moves with two” depending on frame of reference (inertial or accelerated) in which the observation of the motion is made.“
False, it does not depend on frame of reference.
Let’s make it even simpler. To “Non-Spinners”, “orbit without spin” is movement like the MOTL, and to “Spinners”, “orbit without spin” is movement like the MOTR…nothing to do with reference frames.
"False, it does not depend on frame of reference."
…and, to make it clear what it does depend on…that would be your choice of "base motion" – either "rotation about an external axis" or "translation in a circle". If you go with "rotation about an external axis" as your "base motion", then the movement of the MOTL consists of only one motion (as proven mathematically by Ftop_t). If you go with "translation in a circle" as your "base motion", then the movement of the MOTL consists of two motions.
However, with the ball on a string, the choice is made for you. The ball is being swung about a central axis on the end of a string. Thus, "rotation about an external axis" is your "base motion".
DREMT,
” the transition from circular motion to linear motion occurs, the ball will then rotate on its own internal axis.”
Where is the force that starts the ball rotating on its own internal axis?
Your claim runs afoul of Newton’s laws.
Please revise and resubmit.
I’m happy with my explanation, bob.
DREMT,
Yes, I see you are happy.
However, you have ignored Newton’s laws.
Therefore you are happy and wrong.
bob, Newton’s first law of motion applied to circular motion only leads to the conclusion that the ball on a string will fly off in a straight line on release, e.g:
https://homework.study.com/explanation/how-does-newton-s-first-law-explain-circular-motion.html#:~:text=During%20circular%20motion%2C%20the%20velocity,according%20to%20Newton's%20first%20law.
“During circular motion, the velocity of the object is tangent to the circle. The object will want to continue in its trajectory of velocity unless acted on by an unbalanced force, according to Newton’s first law. You can observe this if you swing a ball attached to a string and let go. Without your force pulling the ball in a circle, the ball follows the path of its velocity and flies away.“
Note that it says nothing about whether the ball is rotating on its own internal axis before release.
Further, giving you the benefit of the doubt that perhaps you meant to say Newton’s first law for rotation, rather than motion, i.e:
https://www.webassign.net/question_assets/buelemphys1/chapter10/section10dash9.pdf
“Newton’s First Law for Rotation: an object at rest tends to remain at rest, and an object that is spinning tends to spin with a constant angular velocity, unless it is acted on by a nonzero net torque or there is a change in the way the object’s mass is distributed.”
I’d argue that the ball on a string is not at rest before release, it is rotating, just not on its own internal axis. Basically, I would repeat my argument from earlier:
https://www.drroyspencer.com/2024/07/uah-global-temperature-update-for-june-2024-0-80-deg-c/#comment-1679244
Which I’m happy with, and which doesn’t break any of Newton’s laws.
DREMT,
Rotation around an internal axis is a motion.
If it is rotating after release, then either it was rotating before release or there was a force causing the rotation.
Since there was no such force starting the rotation, then it was rotating on an internal axis before release.
Denied.
Sorry, bob, but you are reading things into Newton’s laws that just aren’t there…extrapolating wildly to the answer you want to get. It’s just another clever way for you guys to trick yourselves into believing what you want to believe. Nothing about what happens to the ball upon release can possibly turn the preceding single motion into two motions.
Before swinging the ball around the central pivot point, stretch the string taut. Is the ball free to rotate on its own internal axis? No, of course not. So, can the ball be rotating on its own internal axis when the ball is swinging around the central pivot point, and the string is taut? No. The string prevents it from doing so.
It’s one single “swinging motion”.
DREMT,
The string is rotating, when swinging the ball around.
Yes, bob. The string is rotating about an axis at one end of the string (where it meets the central pivot point). The ball is attached to the other end of the string, thus it is also rotating about the same pivot point, a central axis that is external to the ball.
Artificial intelligence is more hip to relativity & beats DREMT again since DREMT 3:45 am makes no mention of learning from AI. And even no ftop_t proof example is provided, it’s just made up.
Thus, “rotation about an external axis” is your “base motion” as ball spinner DREMT observes from his accelerated frame having the choice made for him.
If you go with “translation in a circle” as your “base motion”, then the movement of the MOTL consists of two motions as DREMT skips to another frame and observes from his new inertial frame with the choice made for him from there.
Let’s make it even simpler as ftop_t showed some time ago as I recall. To “Non-Spinners”, “orbit without spin” is movement like the MOTL observed from their accelerated frame on Earth, and to “Spinners”, “orbit without spin” is movement like the MOTR as observed from their inertial frame … so as usual, motion observed depends on reference frame.
All motion is relative. As usual, DREMT remains silent whenever he moves to a new observation location.
Ball4:
https://www.drroyspencer.com/2024/07/uah-global-temperature-update-for-june-2024-0-80-deg-c/#comment-1679059
Do not falsely accuse me of making things up. I will expect an apology, or the discussion goes no further.
No apology necessary DREMT, you just made up what DREMT thought ftop_t wrote since I correctly recalled as shown in your link.
I and ftop_t successfully showed an animation that is correct for the Earth/moon/sun wherein ftop_t showed an object such as the moon rotating once on its own internal axis while orbiting on an external axis of the center object with the same lunar object face pointing to the center object for the whole orbit and the lunar day/night cycle in place as observed from the inertial frame. Showing Moon has two motions about two independent axes in the inertial frame.
Good memory & re-read, thx. ftop_t learned all motion is relative; just use the AI source I showed to DREMT for learning also.
So, you’re not going to apologise, you’re going to lie about what the linked comment is about, and you’re going to lie and pretend Ftop_t agrees with you.
Obviously, the discussion is over. There was no point, anyway – all you do is take my words, and add “as observed from x reference frame” at various points, regardless of whether or not it’s appropriate, or even if it makes sense! You stopped listening to what I tried to explain a long time ago.
Go and attempt to irritate somebody else, you tedious t-word.
No lie, as shown by reading the linked thread wherein ftop-t showed an animation that agrees with me as I just wrote.
Again, thanks DREMT, for accepting the conclusions at 11:18 am, since DREMT has not presented a valid dispute with the premises.
How can an animation agree with you, you demented goon?
Plus, I didn’t link to the entire set of comments for you to sift through and try to find something that in your bizarre, twisted little brain somehow agrees with you; I linked to one specific comment which does not even involve an animation! You obviously can’t dispute the proof, and so you try and switch to something else. Anything else! You’re such a joke.
DREMT,
By the way, Newton did not make up those laws for rotational motion.
And you have mass, velocity, and force for the original laws.
For the laws of rotational motion you have moment of inerta, angular velocity and torque.
So if the ball has angular velocity after release, it had angular velocity before the release.
…but not about its own internal axis, bob.
The joke’s on a clearly irritated DREMT not noticing that ftop_t’s linked 11:13 am math comment “models the moon’s rotation” as “a single rotation (orbit) around an external axis.” (per ftop_t 7:07 am). Thus ftop_t’s math is a proof in an accelerated frame such as viewed from Earth & ftop_t makes no mention of, or correction to, an inertial frame as pointed out later in the thread.
When ftop_t does correct to an inertial frame, the animation models two lunar motions: a lunar spin on its own internal axis, and a lunar orbit of Earth (central object orbited) on an external axis while keeping the same lunar face pointed at Earth during each orbit.
“Thus ftop_t’s math is a proof in an accelerated frame such as viewed from Earth”
False. The rest of your comment falls apart, accordingly.
Thx.
DREMT obviously needs to re-read the whole thread again since I used exact ftop_t quotes and DREMT didn’t. Good to read though that DREMT has presented no valid dispute with my 4:23 pm premises, so must be reluctantly accepting the conclusions. Thank you, DREMT.
Ftop_t indeed “models the moon’s rotation” as “a single rotation (orbit) around an external axis.”
One single motion.
Your claim that this means he’s using an accelerated frame is false, and a non-sequitur. It does not logically follow that since he’s modelled the moon’s motion as one single external axis rotation that he is using an accelerated frame. That’s just your confirmation bias in action.
I also think it means you don’t understand kinematics. I don’t think you actually understand what “rotation about an external axis” even is.
“That’s just your confirmation bias in action.”, no bias I read the whole linked thread & it’s from DREMT’s own link since DREMT misses that ftop_t down-thread corrects to model lunar motion in an inertial frame after being told to do so and shows with ftop_t’s own work inertially: two lunar motions, a lunar spin on its own internal axis, and a lunar orbit of Earth (central object orbited) on an external axis while keeping the same lunar face pointed at Earth during each orbit.
DREMT has shown confirmation bias after not reading the whole thread he linked & claiming something only about DREMT’s linked comment. That’s another fail, so no valid dispute of any premises yet, DREMT reluctantly has to agree with the conclusions. Thanks.
What Ftop_t went on to produce was a Desmos animation, which showed an object representing the moon orbiting an object representing the Earth, with the Sun shown to the right of the two. I remember it well, Ball4. He programmed it such that the moon’s motion was a single external axis rotation about the Earth object. Proving you wrong, again.
Ftop_t’s proof that I linked to shows that you cannot have an object rotating about an external axis and simultaneously rotating about its own internal axis and have it move overall like the ball on a string. It’s just not mathematically possible. The external axis rotation, alone, produces movement like the ball on a string. One single motion.
Sure Ftop_t’s math that DREMT linked to is about cannot have an object rotating about an external axis and simultaneously rotating about its own internal axis and have it move overall like the ball on a string as viewed from the central object’s (spinners) accelerated frame. One single motion in that specific frame. is correct as our lunar view from Earth shows. Good work ftop_t.
Now correct that to an inertial frame as ftopt_ did down-thread after being told in DREMT’s linked comment in “Ftop’s depiction the rotating viewing box is an accelerating non-inertial reference frame” and find two modeled lunar motions once ftop_t (and I) went on to produce a view from an inertial frame developed from that math.
All motion is relative. DREMT still has no valid dispute with that premise, so must reluctantly accept the conclusions. Thanks, DREMT.
“…as viewed from the central object’s (spinners) accelerated frame“
False, Ball4. Ftop_t shows in my linked comment that you cannot rotate an object about an external axis and about an internal axis and have it move as per the ball on a string…as viewed from anywhere. Nobody refutes that proof.
Plus, these words:
“Ftop’s depiction the rotating viewing box is an accelerating non-inertial reference frame”
Were not said about my linked comment. You are such a lying sack of human garbage.
…and finally, your narrative that you and Ftop_t worked together ultimately to prove you correct is a total fabrication. The truth is as I already stated:
“What Ftop_t went on to produce was a Desmos animation, which showed an object representing the moon orbiting an object representing the Earth, with the Sun shown to the right of the two. I remember it well, Ball4. He programmed it such that the moon’s motion was a single external axis rotation about the Earth object. Proving you wrong, again.“
I fully expect you to keep repeating your lies, but doing so won’t make them become truths.
Quoting yourself is funny, DREMT. Won’t work since you have as yet shown no valid dispute.
No lies, I quoted ftop_t verbatim. Ftop-t first used math & programmed in an accelerated frame; when the accelerated frame was pointed out as I noted verbatim, ftop_t then programmed in an inertial frame and illustrated the differences in motion in the very thread DREMT linked. The internet accurately remembers; irritated DREMT can’t seem to do so.
Ftop_t’s work thus supported all motion is relative. DREMT still has no valid dispute with ftop_t’s premise(s) or his work, so DREMT must reluctantly accept the conclusions. Thanks, DREMT.
My prediction was proved correct! Thanks Ball4 for proving me right, yet again.
The internet will indeed never forget that you are a liar. Anyone reading through the linked thread will see that.
… is wrong except for DREMT. Still DREMT has no valid dispute to all motion is relative as illustrated by ftop_t so DREMT has reluctantly accepted the conclusions. Thanks.
Keep proving me right, Ball4. Thanks.
DREMT,
“but not about its own internal axis, bob.”
That’s why you need to define rotation on an internal axis.
The ball is rotating around an axis, perpendicular to the string, and perpendicular to the direction of travel.
Two motions: revolving and rotating.
bob forgets that he has already conceded point 2). That means he cannot claim that the ball on a string has two axes of rotation.
DREMT,
Point 2 is not about the ball on a string.
“b) Translation in a circle with rotation about an internal axis.”
Is one of the correct ways to describe the ball on a string.
Another is revolving around while rotating on an internal axis.
I have shown you where to find that axis, not my problem that you have no spatial awareness because you can’t see that the ball on a string is rotating on its internal axis.
If you put a toothpick into the ball on that axis as described and replicated the swinging around while holding the toothpick you would feel the toothpick rotate.
Real experiments trump your thought experiments.
bob, point 2) applies generally, to all objects moving as per the MOTL. So, that includes the ball on a string. You cannot describe the ball on a string as having two axes of rotation.
You’ve already agreed to that.
DREMT,
I only agreed with point 2 on very specific instances, not to point 2 in general terms.
It is irrelevant to the motion of the Moon.
And I can change my mind.
Remember: Orbits are not rotations, period paragraph.
DREMT,
I agreed to your theory, but then I did an experiment and found out that your theory is wrong.
Sorry Chump.
Nine days later!? OK, bob. Sorry, but your agreement on point 2) is a matter of record now.
troubleshooting…
binny..To anyone who has a basic understanding of war tactics, it was obvious that the fake attack on Kyiv was to draw Ukrainian forces north and away from the intended attack area. A basic clue was in the use of obsolete tanks in the Kyiv maneuvre.
Only a blithering ijit would believe, given developments in the Ukraine, the western fake news that Russia intended to take over the Ukraine. The rest of that bs goes that once they take over the Ukraine thy will try to take over Latvia, Lithuania, and Estonia.
If I was not so thick-skinned, I would feel embarrassed by the abject propaganda issued by the West to justify propping up a country as corrup.t as the Ukraine.
As proof that nationalists run the country, in 2016, the sitting president was coerced by them to pass into law a bill recognizing WW II war criminals as heroes. Today, some Ukrainians hold a candlelight vigil to honour war criminals.
I have no desire to support Putin and his regime, and I don’t. However, there comes a time when your own side become such liars that you have to call attention to their lies. That is especially true when their actions could lead to a nuclear war which most of us likely won’t survive.
Your desire to see me abducted by Ukrainians sounds a lot like neo-Nazi thinking.
Derp
Anyone involved in that war is dead or is going to be dead of old age soon.
Trying to connect the political situation in WWII to the political situation today is absurd except in the context that there are some who think all of history of Russia interaction with Ukraine is relevant. Its not.
“Anyone involved in that war is dead or is going to be dead of old age soon.”
Joe Biden is pretty old. Putin is pretty old, too.
US Senate was and is old, as is US congress {in terms of old people leading it]
Obviously Putin planned the war, due to his perception of what Europe and US would respond to his action. And part of plan was just to threaten to invade {and so it wouldn’t have much costs involved with it} and would score major political victory.
And roughly one could say, Putin had a good plan and Europe and US reacted roughly in way he predicted.
Of course with Putin threatening and the lack of much response, was kind of a “trap”, because then he had to show the world how badly his military actually functioned.
The war being over in 3 days was from the Russia govt- not something made up by corporate news media to get more news coverage.
In terms of US international military arms sales, it could only be good. And was also very good for France.
Now, if Russia military worked better, it would been better in terms sales, but they did quite well, despite Russia’s flop.
Number of days with sunspot counts above various thresholds
(SC25 to 15/7/24 – SC24 to 15/7/13)
100+ … 552 – 324 (338)
125+ … 365 – 150 (155)
150+ … 207 – 52 (52)
175+ … 88 – 8 (8)
200+ … 34 – 1 (1)
225+ … 10 – 0 (0)
(Numbers in brackets are for SC24 up to Oct 8, after which its second surge begins)
Live fast, die young, and leave a good-looking corpse.
RIP Evan Wright, we hardly knew ye.
Arkady, please stop t-word-ing.
Why were the 1930s so hot in North America?
Are you suggesting the 1930’s dustbowl event was somehow caused by human activity?
LOL
Interesting that that’s what you get from reading the article.
LOL
Another post of alarmist drivel by Ark…
“The bare landscape allowed for maximal warming from the summer sun, which in turn helped reinforce the deep atmospheric heat that prevailed. Day-to-day weather patterns sometimes pushed the dust and heat all the way to the East Coast.
Theres ample evidence that the heat of the 1930s was partially the result of the parched landscape that itself was stoked by overeager planting and plowing”.
***
The ijits are a bit confused on basic physics/thermodyamics.
Then…
“1936 heat records…
Note…1936 was not even the hottest year…
The heat was especially brutal during July and August 1936, as chronicled in detail by extreme weather historian Christopher Burt in a 2018 write-up at Weather Underground. Dozens of U.S. states and cities set all-time high temperatures (i.e., the highest readings ever officially observed at a given site). The heat extended into south-central Canada, where Winnipeg, Manitoba, soared to its still-standing all-time high of 108 degrees Fahrenheit. Below are a few of the still-standing all-time highs set or tied in July 1936 at major U.S. cities:
New York City, New York: 106F (July 10)
Baltimore, Maryland: 107F (July 10)
Columbus, Ohio: 106F (July 14)
Louisville, Kentucky: 107F (July 14)
Des Moines, Iowa: 110F (July 25)
Minneapolis, Minnesota: 108F (July 14)
Bismarck, North Dakota: 114F (July 6)
Omaha, Nebraska: 114F (July 25)
The following states also set all-time highs in July 1936, each of which stands today:
Indiana: 116F (Collegeville, July 14)
Iowa*: 117F (Atlantic and Logan, July 25)
Kansas: 121F (Fredonia, July 18, and Alton, July 24)
Maryland: 109F (Cumberland and Frederick, July 10)
Michigan: 112F (Mio, July 13)
Minnesota: 114F (Moorhead, July 6)
Missouri: 118F (Clinton, July 15, and Lamar, July 18)
Nebraska: 118F (Hartington, July 17, and Minden, July 24)
New Jersey: 110F (Runyon, July 10)
North Dakota: 121F (Steele, July 6)
Oklahoma: 120F (Alva, July 18, and Altus, July 19)
Pennsylvania: 111F (Phoenixville, July 10)
West Virginia: 112F (Martinsburg, July 10)
Wisconsin: 114F (Wisconsin Dells, July 13)
Weekly ENSO 3.4 for past three months:
14/4 – 20/4 +0.7
21/4 – 27/4 +0.8
28/4 – 04/5 +0.5
05/5 – 11/5 +0.3
12/5 – 18/5 +0.2
19/5 – 25/5 +0.2
26/5 – 01/6 +0.1
02/6 – 08/6 +0.1
09/6 – 15/6 +0.0
16/6 – 22/6 +0.3
23/6 – 29/6 +0.4
30/6 – 06/7 +0.3
07/7 – 13/7 +0.3
(A certain person will now perform his usual trick of posting a link to the false ENSO graph without bothering to comment.)
“IMPORTANT USER ALERT (2 July 2024): This past weekend, a storage server at NOAA’s Center for Satellite Applications and Research, which delivers the NOAA Coral Reef Watch data, suffered a hardware failure. The issue is being addressed, and we hope to have the NOAA Coral Reef Watch data back up and running as soon as possible.”
Which has nothing to do with the false ENSO graph you usually link to.
Antonin, please stop t-word-ing.
From Theodoros Kolydas, Director of Greece National meteorological Agency:
“While Western Europe is experiencing temperatures below normal levels of 1-2C (Iberia), Eastern Europe is experiencing temperatures 10 to 12C above normal. We should be considered “lucky” with positive deviations not exceeding 5 to 7 C from normal.”
–
So here in Greece we should be considered “lucky”!!!
Link to the temperatures map for to-day July 15, 2024 for Europe:
https://pbs.twimg.com/media/GSh2j7wWEAAkomN?format=png&name=small
christos…the question is why???
What would cause one side of Europe to have lower than normal temps and the other side to be 10C – 12C above normal?
Surely no one is so naive as to think it is caused by human emissions?
Thank you, Gordon.
“What would cause one side of Europe to have lower than normal temps and the other side to be 10C 12C above normal?
Surely no one is so naive as to think it is caused by human emissions?”
–
Of course not!!!
–Webb infrared spectroscopy detects differences between morning and evening on tidally-locked exoplanet–
https://behindtheblack.com/
“Researchers using NASAs James Webb Space Telescope have finally confirmed what models have previously predicted: An exoplanet has differences between its eternal morning and eternal evening atmosphere. WASP-39 b, a giant planet with a diameter 1.3 times greater than Jupiter, but similar mass to Saturn that orbits a star about 700 light-years away from Earth, is tidally locked to its parent star. This means it has a constant dayside and a constant nightsideone side of the planet is always exposed to its star, while the other is always shrouded in darkness.”
gbaikie
Tidally locking is a forbidden, misleading thought, is heresy by the cult, and should therefore be punished by burning at the stake if repeated constantly.
Be careful! This blog has eyes and ears, you are already being monitored.
Nice to see you trying some snark Bindi, rather than your usual vile hatred.
But, if you’re trying to be responsible, you need to be honest. Being honest is a large part of reality, and reality is key to being responsible. So, only use the word “cult” where it correctly applies. It this case, the Moon “Spinners” make up the cult. In your attempted snark, your cult would be supporting the “tidal locking” nonsense.
You don’t want your snark to backfire on you….
“Tidal locking” is just the process by which a celestial body ends up moving like the MOTL. It says absolutely nothing about whether movement like the MOTL consists of one motion, or two, and so it changes absolutely nothing about the overall debate.
We know from basic physics that “tidal locking” is a scam, probably started in astrology. It’s just more crap the cult throws against the wall because they have no viable model for “orbiting without spin”.
DREMT and Clint need to get a room and decide whether tidal locking is a scam or an observation.
We can’t move on until you two decide.
We disagree, but since the “tidal locking” issue doesn’t affect the debate either way, there seems little point discussing it. More than we have already, in the past, anyway.
I’ll stick to my points 1) – 4) until all “Spinners” are in agreement on them.
DREMT,
Tidal locking is the heart of the issue.
The Moon rotates on an internal axis with the same period as the period of its orbit.
Tidal locking is not the heart of the issue, bob, as already explained.
Tidal forces show that the ball-on -a-string model of lunar motion is wrong.
The ball experiences an inward force pulling all particles of the ball towards the centre of the orbit.
Those parts of the Moon further from the Earth than the Moon’s CG experience an outward force as their excess velocity relative to their normal orbital velocity tries to move them into a higher orbit.
Those parts of the Moon closer to the Earth than the Moon’s CG experience an inward force as their low velocity relative to their normal orbital velocity tries to move them into a lower orbit.
The ball on a string is not intended to be a model of lunar motion. It is a model of “orbit without spin”.
That must have been explained, what, a hundred times now? More?
DREMT,
That the Moon rotates on an internal axis is the heart of the issue.
But you refuse to discuss that, because of your kung-fu death grip on your incorrect points 1) and 3).
So you are effectively evading the discussion of the issue.
What’s the matter, chicken of Astronomy 101.
–Tidal locking is just the process by which a celestial body ends up moving like the MOTL. It says absolutely nothing about whether movement like the MOTL consists of one motion, or two, and so it changes absolutely nothing about the overall debate.–
Well, one could count Mercury as Tidal locking or quasi tidal locking or partial tidally locked, but you could say Mercury does spin upon it’s axis.
But something {anything] tidally locked is not spinning upon it’s axis.
One could argue about the spinning of molten core.
Though neither our Moon nor Mercury has much of magnetic field.
bob, points 1) and 3) are correct. You resisted point 2) initially…for years, in fact. You’ll come round on 1) and 3) eventually, in the same way.
DREMT may disagree with me about “tidal locking”, but I bet I could convince him before the third mug of beer.
That’s because he has a brain that works….
DREMT,
I allowed 2) as a special case for circular motion, which is irrelevant to the matter at hand.
I also accept it in the case of a point rotating around another point.
You’ll come around on 1) and 3), in time.
He’s a witch, we’ll have to test him to see if he floats.
Then we’ll burn him at the stake.
We must stamp out the heresy.
That is indeed the sort of attitude we get from you guys. Trying to pretend it’s the other way around is funny, due to how obviously wrong that is.
ESCAPADE on schedule for launch this fall
Jeff Foust July 15, 2024
https://spacenews.com/escapade-on-schedule-for-launch-this-fall/
“BUSAN, South Korea A NASA smallsat mission to Mars remains on track to launch this fall, although without a specific launch date yet.
In a presentation at the Committee on Space Research (COSPAR) 45th Scientific Assembly here July 15, Rob Lillis of the University of California Berkeley Space Sciences Laboratory said the Escape and Plasma Acceleration and Dynamics Explorers (ESCAPADE) mission was still scheduled to launch within a few months on the inaugural flight of Blue Origins New Glenn rocket. “
Solar wind
speed: 339.7 km/sec
density: 1.26 protons/cm3
Daily Sun: 16 Jul 24
https://www.spaceweather.com/
Sunspot number: 205
The Radio Sun
10.7 cm flux: 233 sfu
Thermosphere Climate Index
today: 23.74×10^10 W Warm
Oulu Neutron Counts
Percentages of the Space Age average:
today: -2.4% Low
12 numbered spot, no spots leaving to farside within a day.
And two spots coming from farside
gbaikie
As I often told you, your Space Weather source behaves a bit strange.
It’s now 22:47 at GMT+2, and from SILSO I obtain
2024 07 16 2024.540 285 22.5 22 25
But from
https://www.spaceweather.com/
I obtain the same value as 12 hours ago:
Sunspot number: 205
A thing about spaceweather.com is they have archive and all spot numbers of the days- and I assume it’s the official sunspot number of a days.
You could sum all numbers of last month, and see if aligns with NOAA numbers {assuming you accept these numbers].
https://www.swpc.noaa.gov/products/solar-cycle-progression
Anyways everyone accepts it’s arbitrary system or as I said, it’s like the rules of American Baseball. Or there is not a right way to play baseball {though most accept the American started it- though some might argue about that} .
Or NAAA said June was 164.2
Spaceweather has the numbers of June. You can check it.
Total them and average them
But I have not checked it.
But as I noted, they post the number of the day, and then hours later changed it {by small amount]. Why they did this I don’t, maybe mistyped or people which make the call, argued about the call or something.
Like they do in Baseball.
June May Feb
Sunspot number: 135
194
186
208
224
193
149
8th of june: Sub total: 1289
150
143
148
146
95
145
124
15th June: 951 + 1289 = 2240
117
134
152
171
150
181
138
22nd June: 1043 + 2240 = 3283
133
139
176
141
129
135
146
29th June: 999 + 3283 = 4282
162
205
367 + 4282 = 4649 divided by 30 = 154.966666667
NOAA said 164.2 So seems to be some difference, I was going to do May cause had 31 days and Feb cause it had 28 days.
But it’s boring. And I don’t know the rules, as I said.
gbaikie
Below the daily number (today: 250 vs. currently 281 from SILSO), there is a link
https://spaceweather.com/glossary/sunspotnumber.html
pointing to a document which tells about the difference between NOAA and SILSO.
Btw, there picture, still hasn’t changed.
Hitcher guide was accessible and slightly cheaper [but not good or dependable]- sort of like, https://www.spaceweather.com/ for me.
As said most interested in Neutron counts, and I don’t a lot faith
it what getting. but my view/opinion is -3 is not good, or -5 is better.
So this cycle would be ok to send crew to Mars, but during Solar grand maximum there were much better times of a lot less GCR radiation. So this exercise is about having some rough guess of GCR in the future 2 [or more] years.
And sort of like watching corporate media news, mostly a waste of time.
gbaikie
Below the daily number (today: 250 vs. currently 281 from SILSO), there is a link —
My problem is they didn’t change the picture, when they “normally” change picture.
At another site, they got the two spots coming from farside numbered, 3756 and 3757 but they don’t 3738, they counting it as left the nearside, but total numbered spots is 17 numbered spots:
https://www.spaceweatherlive.com/en/solar-activity/sunspot-regions.html#3759
I will continue wait for spaceweather.com to put up their new picture.
Solar wind
speed: 351.4 km/sec
density: 1.22 protons/cm3
Daily Sun: 18 Jul 24
Sunspot number: 275
The Radio Sun
10.7 cm flux: 224 sfu
Thermosphere Climate Index
today: 23.42×10^10 W Warm
Oulu Neutron Counts
Percentages of the Space Age average:
today: -2.4% Low
Got the new picture. 17 numbered sunspots. None coming nor leaving within a day
Solar wind
speed: 370.1 km/sec
density: 3.69 protons/cm3
Daily Sun: 16 Jul 24
Sunspot number: 250
The Radio Sun
10.7 cm flux: 233 sfu
Thermosphere Climate Index
today: 23.55×10^10 W Warm
Oulu Neutron Counts
Percentages of the Space Age average:
today: -2.4% Low
Their picture of sun hasn’t changed yet. But as said above, I could see two spots coming, so probably at least 14 numbered spots.
Solar wind
speed: 298.4 km/sec
density: 4.13 protons/cm3
Daily Sun: 19 Jul 24
Sunspot number: 276
The Radio Sun
10.7 cm flux: 276 sfu
Thermosphere Climate Index
today: 23.34×10^10 W Warm
Oulu Neutron Counts
Percentages of the Space Age average:
today: -2.0% Low
18 numbered sunspot. None coming or leaving.
Solar wind
speed: 363.0 km/sec
density: 1.82 protons/cm3
Daily Sun: 19 Jul 24
Sunspot number: 269
The Radio Sun
10.7 cm flux: 276 sfu
Thermosphere Climate Index
today: 23.30×10^10 W Warm
Oulu Neutron Counts
Percentages of the Space Age average:
today: -2.0% Low
Again didn’t change the picture {as they seemed to do- previously, as habit]. If look elsewhere:
https://www.spaceweatherlive.com/en/solar-activity/sunspot-regions.html
There are 12 numbered spot, with one coming from farside, and one leaving. But I don’t do that.
Their picture [spaceweather.com] still has 18 numbered sunspot.
Solar wind
speed: 315.1 km/sec
density: 1.81 protons/cm3
Daily Sun: 21 Jul 24
Sunspot number: 212
The Radio Sun
10.7 cm flux: 207 sfu
Thermosphere Climate Index
today: 23.17×10^10 W Warm
Oulu Neutron Counts
Percentages of the Space Age average:
today: -2.1% Low
13 numbered sunspots
ken…”Trying to connect the political situation in WWII to the political situation today is absurd…”
***
Some Ukrainians fought on the side of the Nazis in WW II, and in 2016, sympathizers co-oerced the sitting president to pass into law a bill that made those collaborators and war criminals modern Ukrainian heroes. Descendants of those war criminals are currently active in the Ukraine, some sitting in the Ukrainian parliament.
What kind of government would pass such a law in a democratic country unless those same modernists were literally holding a gun to the head of the president? The same mob had a democratically-elected president run out of town in 2014 and they were supported by the West. That action in 2014 is what prompted the Russians to act, 8 years later.
You see, Russians don’t like Nazis due to the horrendous experience they had fighting them. Unlike our Nazi apologists in the West, they did something about it.
When the Canadian government stoopidly try to honour a Ukrainian Nazi sympathizer from WW II, they had to quickly retract the honour for fear of being run out of their own country. Yet, this same government is supporting and condoning the same situation in the Ukraine.
Come on, man, shake your head. My understanding from reading your previous posts condemning the assault on the truckers’ convoy and the hysterical reaction to covid, gave me the impression you were opposed to fascist tactics.
The interesting stuff on Youtube lately has been about the treatment of women, both in the military, and those unfortunate enough to be on the losing side of the conflict.
Germans were brutal, particularly on the eastern front. Not just the Nazis; although the Nazis earned the reputation to go the ‘extra mile’ to engage in atrocities.
Russians, on their drive to Berlin would tie German women onto the front of their tanks. The defenders would then have to kill their own in order to destroy the tank.
The behavior of Russians in occupied Germany was atrocious. Any woman from 10 to 75 was a target for ‘fun’. The lawlessness continued for a couple of years following the war and was condoned by the leadership as ‘spoils of war’.
The behavior towards women in lands being invaded on the Allied side was more constrained but the raping that did occur was often overlooked and sometimes condoned too.
There isn’t much difference between Nazis and soldiers in any other uniform.
After the COVID we learned how easily a country can be taken over by totalitarians.
Ukrainians in WWII weren’t the problem. To try and tie the current regime to WWII Nazis is absurd.
rlh…”[GR]Curvilinear motion is a sum of instantaneous rectilinear motions along a curved path.
[RLH]What causes the curved path?
***
Combination of the body’s linear momentum and an external force deviating the body. A body with only rectilinear motion has its linear momentum acting along a straight line. Curvilinear motion is a resultant between that linear momentum and an external force acting transversely.
If the balance between momentum and external force are just enough to deviate the body enough to match the curvature of the external body supplying the gravitational force, the body will remain in orbit. That presumes a frictionless environment.
So, if you have a body, like the Moon, performing rectilinear motion, and you supply an attractive force from an external body, and the applied force is just enough to deviate the Moon to match the curvature of the Earth, the Moon will remain in orbit.
If you agree that the Moon moving only in a straight lime would keep the same face pointed at an observer, you should have no problem seeing the same for an elliptical orbit. No local rotation required.
“an external force deviating the body”
I.e. Gravity.
Which works both ways. See Newton.
Gordon,
“If the balance between momentum and external force are just enough to deviate the body enough to match the curvature of the external body supplying the gravitational force, the body will remain in orbit. That presumes a frictionless environment.”
Except the path of the Moon does not match the curvature of the Earth.
You have two different ellipses at work there.
The difference between lunar apogee and perigee is 27,655 miles.
The diameter of the Earth is 7900 miles.
bobdroege, please stop t-word-ing.
bob d…””The Moon is not translating in a circle, because it revolves around the Earth in an ellipse”.
***
Same thing.
Gordon,
Are you saying a circle and an ellipse are the same thing?
tim.f…”In math (and physics) rotation is defined as:
1) keeping a constant distance from defined line (known as the axis)
2) changing orientation relative to that axis”.
***
Never seen rotation defined as such. If it’s a solid body rotating around an internal axis, like the Earth’s N-S axis, rotation requires a torquing motion about that axis. Therefore, all points on a radial line wrt the axis are rotating about the axis as long as they have an angular momentum about the axis. Ergo, angular momentum for a solid body is requisite in the definition.
On the other hand, if a rigid body like the Moon is rotating about an external axis like Earth’s N-S axis, it can orbit without a torquing action. No torque is required about the Earth axis, only a curvilinear motion.
If I read you correctly in 2) you are bringing relativity into the description. You seem to be claiming that rotation is relative to the human observer. That’s a philosophical argument and not required in real-time rotation.
Gordo wrote:
No, Gordo, there’s no need for any torque to keep the Earth rotating. Your term “torquing motion” conflates the rotational motion in an inertial reference frame with a torque which might change that rotation by some amount in three dimensions. Angular momentum can only be defined wrt inertial space. The Moon rotates once an orbit. The rotation of the Earth and the Moon are based on identical dynamics.
Swanson, please stop t-word-ing.
clint…”Im glad you can look up what a vector is, but you need to understand it. Reading a definition is good, but you need to understand the vast ramifications. For example, you keep using COG, instead of CoM. Vectors here apply to Center of MASS”.
***
Clint manages to reply to a post on vectors with an amazing red-herring argument related to a distinction between COG and COM. Since Clint is applying vectors only to a COM he must be in a weightless environment where no gravitational field is acting. That may explain why he seems so spaced-out.
Wrong again, gordon.
Moon is definitely “weightless”, but is in a gravitational field. The vectors act on CoM, NOT center of gravity. The center of gravity has NOTHING to do with Moon’s motion. In fact, the center of gravity actually changes slightly as Moon’s orbit is slightly elliptical. Center of mass does NOT change.
I don’t expect you to understand.
The earth’s gravity acts on ALL the moon’s mass.
These forces sum to a total force that acts as if the moon’s mass were concentrated at its centre of GRAVITY (in the earth’s gravitational field).
This creates a torque about the moon’s natural centre of motion – it’s centre of mass.
Apparently you believe that if there was a hypothetical 1000 km long vertical stick above the earth, that the upper half of the stick would experience the same gravitational force as the lower half.
Your failure to study a tertiary physics course is showing.
Wrong, Ant.
Moon’s CoM and CoG are ALWAYS in line, so there would be NO torque. Maybe you never got to “tertiary physics”….
Clint,
The center of mass of the Moon, and the Moon’s center of gravity define a line.
However that line does not always intersect with the center of gravity of the Earth.
That means the force on the center of mass of the Moon and the force on the center of gravity of the Moon are different and that produces a torque on the Moon.
You can’t use your physics textbook to play cornhole, it won’t fit through the hole.
Indeed – that is true – NOW.
The moon, like any solid celestial object, does not have a uniform distribution of mass. So in general the centre of gravity is not precisely directly between the two centre of masses. The moon has very slowly, over billions of years, aligned itself.
But thanks for admitting by omission (the only way you EVER admit something) that you were wrong about the force due to earth’s gravity being focused on the moon’s centre of mass.
Wrong again, Ant.
Moon’s distribution of mass does not change anything. It STILL has a Center of Mass. That CoM is constant, so as Newton proved, the gravitational effect is always acting on the CoM. For Moon, the distribution of mass is not a factor. It’s the CENTER of mass that is affected.
The “tidal locking” nonsense is prevalent in astronomy/astrology. But, it’s wrong. Earth can NOT produce a torque on Moon.
The fact that Moon is not spinning means it is likely it NEVER spun.
Sorry, your cult has misled you again.
“Gravity does not necessarily act directly on the center of mass123. While the center of mass is a point at which mass distribution is equal in all directions, the center of gravity is the point where the force of gravity can be considered to act2.”
https://phys.libretexts.org/Bookshelves/Conceptual_Physics/Body_Physics_-_Motion_to_Metabolism_(Davis)/05%3A_Maintaining_Balance/5.03%3A_Center_of_Gravity#:~:text=Actually%2C%20the%20force%20of%20gravity%20acts%20on%20all,those%20tiny%20forces%20we%20get%20your%20total%20weight.
Clint, gravity acts on each bit of mass, not on the CoM. In some cases — like a spherically symmetric object — we can accurately calculate the total force by treating it like all the mass is at the CoM. Ie, this this case the CoM = CoG. This is a result that must be proven using calculus.
For objects like the moon or a long thin rod, then calculus will show that CoM is NOT the same as CoG, and CoG must be used to determine where the effective gravitational force acts.
Here is a simple exercise. Consider a hypothetical rod who’s length = radius of the earth (r(e)) and who’s mass is m(r). Stand it on end with the bottom on the surface of the earth.
Trying to type a rough approximation: ◯
The CoM is the center of the rod.
The CoG is lower, close to the surface of the earth.
If you want to calculate the gravitational force on the rod, you must not use 1.5 r(e) = (distance from center of earth to center of rod) in your calculation, This number will be too small.
And since CoG ≠ CoM for the rod (and for the non-spherical moon), gravity can exert torques on both of these shapes.
Folkerts you should have learned by now, from gordon, Norman and other cultists, that long tangled distractions ain’t science.
Science would be a viable model of “orbiting without spin”. Without a viable model, you’ve got NOTHING.
“…long tangled distractions aint science”
Yep.
Y’all dang darn dern tootinright there my boy.
Those varmints and their fancy talkin’ are as useless as tits on a bull.
Clint … please pull out your trusty copy of Principia and QUOTE Newton saying that gravity acts on the centre of mass.
Ant, the best way to avoid confusion is for you to quote me exactly.
Clint … so sorry to hear about your confused state. Happy to help you out in your current state of distress.
“as Newton proved, the gravitational effect is always acting on the CoM”
Please pull out your trusty copy of Principia and QUOTE Newton saying that gravity acts on the centre of mass.
No problem Ant — right after you provide a viable model of “orbiting without spin”.
I won’t hold my breath….
So you’ve never looked at Principia. Got it.
Ever considered to admitting to your lies instead of deflecting to something else?
Let me help you out.
English translation by Andrew Motte.
Proposition 88, Theorem 45.
“If the attractive forces of the equal particles of any body be as the distance of the places from the particles, the force of the whole body will tend to its centre of gravity; and will be the same with the force of a globe, consisting of similar and equal matter, and having its centre in the centre of gravity.”
Or a much more recent translation by Ian Bruce:
“If the attractive forces of the equal particles of some body shall be as the distances of the places from the particles : the force of the whole body will tend towards the centre of gravity of this ; and it will be the same as with the force of a globe agreed upon from the same material and equal in all respects, and having the centre of this at the centre of gravity.”
Ant, I’ll explain that to you right after you provide a viable model of “orbiting without spin”.
Everything else is just a distraction, isn’t it?
Good … it’s settled then:
Newton states (and he doesn’t need to state it because it is damn obvious) that the net gravitational force on a solid body acts on its centre of gravity.
Happy to do business with you. I hope your state of confusion has been remedied.
Some researchers relate Newton’s development of calculus to his conclusion that Moon’s gravitational attraction could be considered as only acting on its Center of Mass. He had to first develop calculus to prove that.
We also know that you have NOT provided a viable model of “orbiting without spin”. So everything else is just a distraction from the fact that you have NOTHING.
Except Newton didn’t prove that. He proved that it could be considered as acting only on the centre of GRAVITY. Which “researchers” are you referring to?
It seems you are pretending not to be able to see my post below where I give an example of orbiting without spin.
Antonin, please stop t-word-ing.
The Saturn V rocket.
“Anyone who sits on top of the largest hydrogen-oxygen fueled system in the world; knowing they’re going to light the bottom, and doesn’t get a little worried, does not fully understand the situation.”
On this day in 1969, Apollo 11 was launched from Kennedy Space Center on Merritt Island, Florida, using a Saturn V rocket. The mission landed first humans on the lunar surface.
Arkady, please stop t-word-ing.
After 54 months, Solar Cycle 25 looks quite healthy compared to its two predecessors, SC 23 and SC24:
https://drive.google.com/file/d/1c5UEqEHMt7Qegj0r8A1gf0NBtZzw8wJ4/view
Later in cycle 23, it crashes to 152.5 smoothed monthly value, then goes back up with a peak of 179.7 a year later.
And cycle 24, later goes to peak reaching 116.4 about a year later.
And I am kind of interested in what happens in next 6 months with this cycle. This month seems will be enough to keep the experimental forecast alive. And last couple last months it did, what was needed to keep alive, for this month.
What is the “experimental forecast”?
https://testbed.swpc.noaa.gov/sites/default/files/2024-01/solar_cycle_experimental_prediction_validation.pdf
First hit from goggle search:
NOAA cycle 25 experimental forecast
It’s looking like a reasonable shot at at least the low end of that prediction.
If the next 8 months (starting this month) go:
170, 160, 150, 140, 130, 120, 110, 100
then the SSN will go:
130, 132, 135, 137, 140, 141, 141, 139
If the next 8 months go:
170, 155, 140, 125, 110, 95, 80, 65
then the SSN will go:
130, 132, 134, 135, 136, 136, 133, 129
-If the next 8 months (starting this month) go:
170, 160, 150, 140, 130, 120, 110, 100–
What if it’s:
160, 100, 110, 130, 150, 120, 170, 140
Then it seem NOAA original is better than it’s experimental.
And since we tend think the 8 months is within max peak and I am using all your numbers-just changing sequence
….
But with your sequence, it would do more than keep, the experimental “alive”:
Just the first 3: 170, 160, 150… validates it.
Or it was worth the effort.
But doesn’t do anything about whether we still in a solar grand min- or not- need a lot more months.
The best of this blog is that a few people manage to write, without providing any really scientific proof:
” The fact that Moon is not spinning means it is likely it NEVER spun. ”
Instead, they bore us day after day with their nonsense a la ‘curvilinear translation’, ‘model of orbiting without spin’ or other MOTL/MOTR blah blah.
And finally, the very very best is their endlessly repeated pseudo-argument:
” Since we see always the same side of the Moon, it can’t rotate about any internal axis. ”
*
A few centuries ago, it was a fact that the Sun orbits Earth.
And still these days, it is a fact for some that Earth is flat.
This is these few people’s mental level.
Bindi, are you working on a viable model of “orbiting without spin”?
You obviously know what “spin” is, by your comments. But, you need “orbiting without spin”….
Comme prévu, la réponse la plus bête qui soit.
Flatearthism has many faces.
we have supplied you with plenty of scietific evidence that the Moon cannot rotate on a local axis but you deny the science by using claims from ancient astrologers that the Moon does rotate.
One more face of flatearthism and its typical mix of arrogance and ignorance, shown by persons opposing trivial pseudo-arguments to real science whose today’s results, despite obtained by completely different observations tools and observation data processing methods, are exactly the same as those obtained over 250 years ago.
What else could we expect from a Putin cocksucking dumbass who thinks that time does not exist, that Newton never claimed that the Moon spins, that Einstein’s relativity is wrong, that GPS doesn’t need its corrections, that NOAA uses only 1500 stations to calculate surface temperatures – and above all, that a crazy liar named Lanka was given right by Germany’s Bundesgerichtshof that the measle virus doesn’t exist, what this German Supreme Court never did.
binny…”What else could we expect from a Putin cocksucking dumbass…”
***
All we need to know about Binny, a major ijit who resorts to foul language out of his frustration re being proved wrong time after time.
People who use such language especially with a homosexual content, are often speaking from experience related to what they call others. .
You, Robertson, ‘forget’ that you are yourself the person insulting the most on this blog, hence deserves my insults.
And you never proved me wrong at any time about anything, especially re. weather stations and the processing of their data a domain in which you are merely a credulous believer of what contrarians post on their blogs.
Basta ya, Robertson!
Gordon was the first person to attempt to insult me here on this site … shortly before Mike Flynn ambled in. He dishes it out then whines when he gets it back. Apparently there is a “way” to insult someone, and it just happens to be designed to be the way he does it.
Antonin, please stop t-word-ing.
Lest we forget, Alarmist calls for the assassination of American politician.
https://www.drroyspencer.com/2024/06/uah-upper-tropospheric-temperatures-corroborate-lt-temperature-trends/#comment-1676356
A little postcard:
https://youtu.be/FUHkTs-Ipfg?si=-HnO37EacRFKEIvq
See you soon.
Moon turns once in 27,3 days wrt the stars.
Also Moon orbits Earth once in 27,3 days.
If Moon were rotating about its own axis once in 27,3 days, Moon would turn wrt stars once in 13,65 days.
–
https://www.cristos-vournas.com
Not correct.
If the moon were rotating about the sun without revolving on its own axis then it wouldn’t be rotating with respect to the stars.
In a similar way, the axis of the earth maintains the same orientation over a year with respect to the stars (ignoring the 26000 year precession cycle). So the earth’s axis is not rotating (again ignoring precession).
What you describe is not rotation about an axis, it is a change in orientation of the inner face as observed from the Sun. Nothing is rotating.
That’s right Gordon, nothing is rotating when the earth’s axis maintains the same orientation relative to the stars. But if, say, the northern hemisphere were to point at the sun year round then the axis would be rotating.
Ant says: “If the moon were rotating about the sun without revolving on its own axis then it wouldn’t be rotating with respect to the stars.”
There is so much wrong in Ant’s sentence that I don’t have time to correct this morning. But, it needs to be addressed — maybe this weekend.
Antonin Qwerty
” … ignoring the 26000 year precession cycle… ”
That’s the reason why near references like the First Point of Aries no longer are in use. They had to be replaced by much more distant points like quasars or pulsars.
Such increased precision is required, for example, in the calculation of the Ephemerides, which are used by all groups planning, for example, translunar journeys with n orbits around the Earth and Moon landings within a radius of a few kilometers.
*
Every time I write about this Vernal Point, I am reminded of the incredible accuracy of Tobias Mayer, who is regularly discredited and vilified as an ancient astrologer by absolutely ignorant dumbies like Robertson, Clint R and a few other geniuses.
At the end of Chapter 14 of his treatise on the rotation of the moon, one reads with a slightly dropped jaw that he made a final correction to his calculation of the lunar rotation period: Due to the terrestrial precession of the equinoxes, the Vernal Point appears to move around the Earth and the Moon in about 25,700 years, and the lunar rotation period must therefore be corrected by… 6 seconds and 49 sixtieths of a second.
This gave a final result of 27.321665 days, compared to today’s value of 27.321661 days, computed since 40 years out of lunar laser ranging data.
That was in… 1750!
Haha – Clint is trying to pretend he suddenly has a job which keeps him busy.
christos…that’s right. If the Moon is rotating on a local axis, it must rotate physically. That means by half-orbit it must have rotated 180 degrees. So, the near side at 0 degrees of orbit must be the far side at 180 degrees of orbit.
That’s not the case, therefore the Moon is not rotating on a local axis.
BTW…curvilinear motion produces the same effect. Consider a car being driven around an oval (elliptical) track. If you are an observer within the oval, all you see is one side of the car. If you move into the grandstand, you see all sides of the car.
Consider the inside of the oval to be the Earth perspective and the view from the grandstands to be the view from the stars.
Very good Gordon. At least Gordon announces moving to a new location of observation.
Moon is observed not spinning on its own axis when observed from “the Earth perspective” but Moon is spinning inertially on its own axis when observed “from the stars” just like Gordon’s car.
Ball4, please stop t-word-ing.
Earlier Moon was a planet orbiting sun. And at those times Moon rotated.
–
https://www.cristos-vournas.com
God must be a good snooker/billiards player to have the Moon collide with another object of sufficient mass to knock the Moon into orbit around Earth with such an exact momentum, and to do so without the Moon spinning on its axis.
Make that ‘great’ snooker player.
Earlier Moon was a planet orbiting sun. And at those times Moon rotated.
Moon never collided with another object to get knocked into orbit around Earth.
Earth and Moon just came closer to each other and then, eventually, Earth and Moon went on orbiting Sun together.
Since planets and moons in solar system were rotating anti-clockwise, both Earth and Moon were rotating in the same direction.
In time the tidal phenomenon slowed the rotational rate for both of them (Earth and Moon) until it stopped the smaller Moon’s rotation completelly.
–
https://www.cristos-vournas.com
… as viewed from Earth in an accelerated frame.
Ball4, please stop t-word-ing.
Before internet there was radio
https://youtu.be/zLQNRwT3fX8
Don’t forget the BBS and x- and z-modem with its blazing 1200 baud rate.
That’s one serious babe in the opening scenes. She could certainly whittle one’s interest in radio.
clint…”Moon is definitely weightless, but is in a gravitational field. The vectors act on CoM, NOT center of gravity. The center of gravity has NOTHING to do with Moons motion. In fact, the center of gravity actually changes slightly as Moons orbit is slightly elliptical. Center of mass does NOT change”.
***
That’s not what I mean by weightless. A mass does not have a weight per se. It is simply a quantity of matter. If it is acted upon by a gravitational force, the force given to the mass via gravitational acceleration is its weight.
That is, weight is a force exerted by a mass acting in a gravitational field.
A COM applies only to a mass, not to a force. Once it is in a gravitational field, it develops a centre of gravity as well and the force it exerts in a uniform rigid body is represented by a vector quantity.
Essential a COM is a distribution of “MASS” where a gravitational field is not relevant. A COG is a distribution of “weight” where a gravitational field is acting on a mass. Gravity exerts a force on all particles in a uniform mass (eg. sphere) and the resultant force produced by all particles act through a COG.
Furthermore, a COM or COG is the point where a force acts in a uniform rigid body. That does not mean a force is acting in a line through that COM/COG they are simply a representation of the sum of resultant forces acting.
swannie…”No, Gordo, theres no need for any torque to keep the Earth rotating. Your term torquing motion conflates the rotational motion in an inertial reference frame with a torque which might change that rotation by some amount in three dimensions. Angular momentum can only be defined wrt inertial space. The Moon rotates once an orbit. The rotation of the Earth and the Moon are based on identical dynamics”.
***
Angular momentum is a torquing action. It does not have to be applied externally, that force has already created the angular momentum.
Are you saying, that if you could connect the Earth’s axis at the South Pole to a socket, that the socket could apply no torque to a nut?
The Earth is like a rotating motor and all motors supply torque.
Angular momentum can only be defined as an internal process to a body rotating about an internal axis. The reference frame has no bearing on the angular momentum, the mass is either turning or it is not.
And, no, the Earth and Moon are not based on the same dynamics. The Earth has both curvilinear translation and angular momentum. The Moon has only curvilinear translation with no angular momentum.
“the mass is either turning or it is not”
Turning relative to what? All motion is relative (see Newton).
All motion is relative when changing position from other objects but the spin is only relative to the object itself
… the mass is either inertially turning or it is not.
Gordon just leaves out an important physics term.
Eben, as I said, all motion is relative. The only real question is ‘to what’.
Ball4
All rotation is non-inertial.
RLH
All velocities are relative.
All accelerations are relative if you care only about the value of acceleration itself. As soon as you care about forces then acceleration is absolute.
Eben
The motion (translation or rotation) of any object relative to itself is always ZERO.
Gordon
Just so many things wrong with your comment.
Angular momentum is not a “process”. It is not an “action”. Your poor use of language betrays your lack of understanding of physical concepts.
Angular momentum IS relative, because angular velocity is relative. If two observers measure different angular velocities for an object then they measure different angular momenta. It is a merely a conserved quantity (in a closed system), NOT an absolute quantity.
However, angular acceleration can be considered absolute or relative, depending on the same considerations as those for linear acceleration in my comment to RLH above, where “forces” is replaced by “torques”.
Regardless of your chosen frame of reference, you cannot rotate an object about an external axis and an internal axis and end up with movement like the ball on a string.
https://www.drroyspencer.com/2024/07/uah-global-temperature-update-for-june-2024-0-80-deg-c/#comment-1679059
“All velocities are relative.”
Agreed.
rlh…”All velocities are relative.
Agreed.”
***
We can take this to the point of absurdity. If I am driving down a rod at 100 kph, is it not enough to realize I am moving at such a speed relative to the scenery, or someone standing beside the road? Do I have to factor into the equation that the Earth is moving several thousand km/hr and that the galaxy is moving at the same sort of speeds?
When I studied engineering, no one directed me to state a frame of reference when I worked out kinematic problems from a textbook problem set. The reason is obvious. the context is understood. No reference frame required.
My context is called an inertial reference frame but I live in such a context. I have no interest in reference frames outside that context nor do any engineers building structures or designing electric motors.
Reference frames, in general, are for dweebs in physics who must complicate matters by bringing philosophy and thought-experiments into real situations. Einstein became so immersed in such thought experiments that he had to redefine time to make it fit his thought experiment. However, his thought experiment had fatal errors in it, such as time being a real, physical reality that could be manipulated as to duration. The second in his fantasy world was variable but in reality it is tied to the very real rotation of the Earth, an essential constant.
The “real rotation of the Earth” is not constant. See https://www.nature.com/articles/s41612-024-00616-2
“Length of Day (LOD), or the Earths rotation rate, does not remain constant but varies in time at the scale of up to a few milliseconds”
richard… the rate of rotation of the Earth is close enough to constant to be called that. Sure, there is an error margin but a few milliseconds is hardly anything to write home about.
Even atoms clocks, with their tremendous accuracy, output a second interval that is based on the Earth’s rotation.
All motion within an enclosed loop is "absolute", in a sense…in that there are only ever two possible ways to describe such motion. For example, the Earth could be spinning 366.25 times per orbit, or it could be spinning 365.25 times per orbit. Or, the moon could be spinning once per orbit, or it could be spinning zero times per orbit.
Or, to put it another way, movement like the ball on a string’s could be comprised of two motions, or only one.
Movement like the ball on a string could be:
a) Rotation about an external axis with no rotation about an internal axis.
b) Translation in a circle with rotation about an internal axis.
a) is one motion, b) is two.
However, in the ball on a string’s case, we know that mechanically it is moving with only one single motion. The ball is being swung about a central pivot point on the end of a string.
Why it then needs any further discussion is beyond me. Why people feel the need to endlessly divert with reference frames is a mystery.
The question about the moon (or any other orbiting object) is simply: is "orbit without spin" movement like the MOTL, or the MOTR? Nothing to do with reference frames.
Why a) & b) then needs any further discussion is beyond DREMT because a viewer of the BOS in an inertial frame observes the ball “b) is two” motions. The BOS twirler, only sees one motion in the accelerated frame. Everything to do with reference frames; they have to be accounted.
All motion is relative & that includes our Moon’s motion and the BOS.
Here’s what people like Ball4 lack the ability to understand…
…let’s say we quantify the Earth’s spin rate wrt an inertial (translating) reference frame. So that’s 366.25 times per orbit. In so doing, we are automatically assuming that "orbit without spin" is as per the MOTR. That doesn’t mean, however, that "orbit without spin" actually is as per the MOTR!
…let’s say we quantify the Earth’s spin rate wrt an accelerated (rotating) reference frame. So that’s 365.25 times per orbit. In so doing, we are automatically assuming that "orbit without spin" is as per the MOTL. That doesn’t mean, however, that "orbit without spin" actually is as per the MOTL!
The question, still, is always…is "orbit without spin" motion like the MOTL, or the MOTR?
Nothing to do with reference frames, which do not resolve the moon issue.
dremt…I learned a while back that another motion is required with a BOS. While twirling the ball on the string, the twirler has to subtly apply an upward forced to counteract gravity. Therefore the plane of the orbital motion is likely, at least slightly, angled upward.
B4 is now furiously and deeply into a red-herring argument about accelerated reference frames. He will never concede the obvious, that the ball simply cannot rotate about a local axis because the string won’t let it.
That’s true, the simplest arguments are usually the best…I’d never have thought, before commenting here, that people would get so deeply in denial about the fact that the string prevents axial rotation of the ball. It’s nuts…these same people think a chalk circle drawn towards the outside edge of a merry-go-round platform is rotating on its own axis, just because the platform is rotating!
…but Ball4 stalks me from thread to thread, chiming in whenever I say something that triggers him. Then he won’t leave me alone for days, and he just sort of…lies. Like, he said that Tesla was actually a “Spinner”, and it was just the editor of the magazine he wrote his articles on the moon in that was putting a “Non-Spinner” slant to the articles! Recently, he’s been saying that a commenter called Ftop_t, who was a “Non-Spinner”, and mathematician, had collaborated with him to produce an animation that proves the “Spinner” position correct! I remember the animation, and it was actually programmed in such a way that it demonstrated the “Non-Spinner” position…I don’t know if Ball4 is del.usional or just a compulsive liar, but his behaviour always makes me more certain that I’m correct about something.
Ocean warming and deoxygenation.
Dissolved-oxygen concentrations in our planet’s waters have rapidly and substantially declined in recent decades across all aquatic ecosystems: from streams and rivers, lakes, reservoirs and ponds, to estuaries, coasts, and oceans.
The causes of aquatic oxygen loss are global warming due to greenhouse gas emissions, and pollutants resulting from land use.
As water temperatures rise, the solubility of oxygen in the water decreases. Global warming also enhances stratification of the water column, because warmer, low-salinity water with a lower density lies on top of the colder, saltier deep water below. This hinders the exchange of the oxygen-poor deep layers with the oxygen-rich surface water.
Additionally, nutrient inputs from land support harmful algal blooms, which lead to more oxygen being consumed as more organic material sinks and is decomposed by microbes at depth.
Compounding this issue are microbiotic processes in oxygen-depleted regions which increasingly produce potent greenhouse gases such as nitrous oxide and methane leading to a feedback loop of more global warming and increased oxygen depletion.
It’s okay, we should do nothing and maybe things will change for the better?
Ark, let’s try to drive more, releasing more CO2 into the atmosphere. That means more food for plants and the oceans phytoplankton, the start of the food chain.
We’re then “saving the planet”!
What makes you think “the planet” needs “saving“?
I don’t, Ark.
Look up the word “facetious”.
Facetious: “Treating serious issues with deliberately INAPPROPRIATE humour”.
Exactly Ant, your cult treats your false beliefs as “serious issues”.
Look up the word “facetious”.
Facetious: birdbrained, childish, ditzy, dopey, featherbrained, flip, flippant, farcical, flighty, harebrained, inane, indecorous, juvenile, lightheaded, puerile, ridiculous, scatterbrained, silly, superficial, vacuous, vapid, zany.
Yep. That’s you alright!
Ant and Ark, when you finish your nonsense, how about trying some science.
For example, how do 15μ photons from the sky warm a 288K surface?
Prove that a trace gas making up 0.04% of the atmosphere can cause such catastrophic effects.
This Climate Graph has a Nasty Secret
https://youtu.be/77RobHGXR5I?t=63
Yeah, but she is still worried about our icehouse global climate, getting warmer.
But, I am not worried about it getting colder, either.
In what sense is it a secret, and in what sense is it “nasty”?
See the video.
Antonin Qwerty
” See the video. ”
What else could we expect from this RLH guy I have enough reasons to call ‘Blindsley H00d’ ?
*
Recently I saw on his graph
https://climatedatablog.wordpress.com/wp-content/uploads/2024/07/uah-global-1.jpeg
that while the green ’12 mean low pass’ series gave a good match to my 12 month cascaded triple running mean
https://drive.google.com/file/d/1umE0x_ObQqkafV33CqwRkzXHwMVQWJEJ/view
his red median series did not at all.
{ By the way, his blue ‘5 year low pass’ series also gives a good match to my green 60 month cascaded triple running mean
https://drive.google.com/file/d/1TJt1g7mgvXgvM1hBwCncwknUIC1vFQoy/view }
*
Well I thought he would try to prove me wrong.
Instead, he answered with his typical wimp tone:
” You have no data for the lines you show on the monthly data. Only for the ends of them. As I show. ”
*
That was really the styupidest answer in a long time.
Why doesn’t he have the courage to say this to Roy Spencer and the thousands of scientists who plot time series the same way I do?
https://www.drroyspencer.com/wp-content/uploads/UAH_LT_1979_thru_June_2024_v6_20x9-scaled.jpg
Poor Blindsley H00d…
Indeed – he can’t explain it, so he pretends it is explained in the video. He has gotten into the habit of providing short say-nothing responses because he knows he can’t explain anything.
Richard…don’t know why you are promoting a video by this alarmists propagandist. Her argument about the problem with models being one of anamolies versus absolute temperatures is typical of her misunderstanding of the entire problem.
She is an uber-alarmist and she is not going to point out the actual scientific problems with models and that their projections are invalid.
The projections are based on two fallacies:
1)that the warming factor for CO2 is 9% to 25%, while we know from science that it is closer to 0.06%.
2)that positive feedbacks exist that can warm the atmosphere internally beyond what it is heated by solar energy.
Take those away and the models would be projecting no catastrophes.
Sabine Hossenfelder is now the “WOKE Joke” of the cult.
New Space Documentary Tells Untold Story of Rocket Lab
Ellie in Space
https://www.youtube.com/watch?v=zLWw2S2KFCI
“We just getting started..”
troubleshooting post…
RLH…”the mass is either turning or it is not
Turning relative to what? All motion is relative (see Newton)”.
***
I am sur.prised you buy into this philosophical nonsense about relative motion as applied to angular momentum.
Reference frames are human inventions and have no place in the real, physical world. If a physical body is turning about an internal axis, it is turning…period…due to internal properties! I does not need to be turning in reference to anything else, it is turning because it’s mass has a momentum about an axis. The momentum is absolute and local, having no relationship to a human observer and his reference frames.
troubleshooting post…
AQ…”Angular momentum is not a process. It is not an action. Your poor use of language betrays your lack of understanding of physical concepts”.
***
You are claiming that a body rotating in one reference frame magically stands still when view from another reference frame. There is nothing wrong with my use of language, a spinnig body has nothing to do with language, philosophy, or any human mental process.
It is you who is living in an illusion. You think that if a human observer is living in a parallel universe so that his motion makes the Earth appear to be not rotating that it is actually not rotating. I am trying to convey to you that a spinning Earth is spinning no matter how the human mind sees it. It is spinning because physical actions related to rotation are local and absolute. It’s only when the human mind becomes involved, with its natural distortions, that things go awry.
“However, angular acceleration can be considered absolute or relative, depending on the same considerations as those for linear acceleration in my comment to RLH above, where forces is replaced by torques”.
***
How can acceleration be either relative or absolute yet velocity cannot?
“Angular momentum IS relative, because angular velocity is relative. If two observers measure different angular velocities for an object then they measure different angular momenta. It is a merely a conserved quantity (in a closed system), NOT an absolute quantity”.
***
Angular momentum describes a body with mass physically rotating about an axis. How can that be relative except to the human mind?
The obvious mistake you are making is bringing the human mind into the equation as a valid observer as part of reality. Forget the human mind and look at the problem as it is. That’s the amazing thing about the mind, it is capable of distorting reality and at the same time being aware that it is doing it.
It appears to me that somewhere along the line you have bought into the philosophy, as did Einstein, that thought itself is a valid and intelligent form of analysis. The human mind relies on insight, a form of intelligence that lies beyond thought.
The ‘no lunar spin | no GHE | no evolution’ cult will never manage to grasp that
– if the Sun was not a hot star but a cold, giant planet
and
– if Earth’s spin period would be 365.25 days, exactly the same as its orbit period
then people watching Earth on the Sun planet very probably would never see it spinning.
Like the Moon viewed from Earth, Earth would show them always the same face.
Why is that so difficult to understand?
It’s not difficult to understand that you see it that way because you believe "orbit without spin" is as per the MOTR.
Whereas, if you instead saw "orbit without spin" as being as per the MOTL, then:
Earth’s spin period being the same as its orbit period would mean that people watching Earth on the Sun planet definitely would see it spinning.
Once you can get your head around that, you might be up to speed on the debate.
P.S: and no, I don’t have any problem with evolution.
I don’t have a problem with evolution either. It’s nonsense, just like the GHE.
The only ones with a problem are the Evolutionists. They can’t even define it. Just like with the GHE, they want so bad to believe in something that can’t hold up to basic science.
Lol, well, I also don’t have a problem with people who have a different opinion than me on scientific theories. It’s called “not being a bigot”. The Cult wouldn’t understand…
Evolution theory depends on the myth that life formed from non-living material (abiogenesis) billions of years ago. However, humans and their complexities have apparently only been around 50,000 years at best, according to anthropologists.
One of the favourite evolution tales is that human came from the oceans. Therefore fish had to shed their gills and learn to breath through lungs while developing legs and learning to walk. All in a measly 50,000 years.
Sure!!! They tell us life evolved from Africa but native Africans have black skin. Where did all the Whiteys come from?
The basis of evolution theory is natural selection. It suggests an ultimate intelligence that governs how life forms, or adapts to its environment. For me, it makes far more sense that some form of intelligent design is at work, meaning some entity was involved.
Of course, when that is suggested, the evolutionists start screaming ‘Creationist’!!! without even considering the question. Much the same as the woke crowd scream ‘Homophobe’!!! when anyone criticizes homosexuality, not matter how scientific the critique may be. Suddenly, anyone who criticizes the status quo has become phobic.
Anyone who speaks out against anthropogenic warming is an automatic denier.
I’m happy to admit that agreeing to the theory of evolution requires some "belief". It’s just something that made sense to me at the time, though.
Evolution is well defined. It is simply a change in the relative frequencies of alleles or of genotypes in the population.
That’s one of the funniest “definitions” I’ve ever seen.
Ant is trying to avoid all of the pitfalls of claiming what his cult actually believes.
Pseudomod
” Whereas, if you instead saw “orbit without spin” as being as per the MOTL, then:
Earths spin period being the same as its orbit period would mean that people watching Earth on the Sun planet definitely would see it spinning.
Once you can get your head around that, you might be up to speed on the debate.
*
Will you understand one day that ‘orbit without spin’, Pseudomod, is YOUR debate, and not mine?
Orbiting without spin has NO SENSE for me. Get YOUR head around that!
“Orbit without spin” is the debate. Not only do you need to accept that your position requires that “orbit without spin” be as per the MOTR, you need to find a viable physical model for it, too. As Clint R keeps reminding you.
Pseudomod
” It’s not difficult to understand that you see it that way because you believe ‘orbit without spin’ is as per the MOTR. ”
This is a pure lie, Pseudomod.
I asked you long time ago to keep me off your ridiculous, pseudo-scientific MOTL/MOTR discussion.
The motion of the Moon (orbit plus spin) is far too complex to be described by such trivial models as MOTL/MOTR, MGR, oval train tracks, ball-on-a-string, or any curvilinear translation.
Newton knew this and explained it already in 1675 to the German astronomer Niclaus Kaufman alias Mercator, who published Newton’s wording in 1676 in his treatise ‘Institutionum Astronomicarum Libri Duo’.
*
Pseudomod: maybe you have no problem with the evolution. Good for you.
But you have problems in accepting what people like Newton definitely wrote.
Bindidon…do you think an object that is orbiting, without spinning, always keeps the same face oriented towards some distant star?
Pseudomod
” … do you think an object that is orbiting, without spinning, always keeps the same face oriented towards some distant star? ”
*
This word ‘think’ is exactly the trademark of most Pseudo-skeptics.
I don’t think about it but, if it seems sensible to me, I look for sources that indicate it.
And from my personal experience with many texts, your question makes just as little sense as the complementary question
” Do you think an object that always keeps the same face oriented towards an observer on Earth, is orbiting without spinning ? ”
*
Apparently, you are so completely unable to escape this MOTL versus MOTR blah blah that you can’t discuss anything else.
binny resorts to red-herring arguments when stumped.
Bindidon, your position only makes any sense if you answer "yes". It’s OK if you don’t really understand your own position, though.
I see: the usual Robertson / Clint R / Pseudomod blah blah.
No need to continue discussing.
Your answer, seriously, must be “yes”, though. Otherwise you wouldn’t think the moon spins once per orbit. Unless you’re just not mentally able to add two motions together. In which case, nothing is ever going to get through to you.
binny…”then people watching Earth on the Sun planet very probably would never see it spinning”.
***
They would see it spinning 365 times per year. Which face you saw would vary with your position on the cold Sun. However, no matter where you are on Earth, you only see the same side of the Moon.
ps. you actually wouldn’t see anything since without sunlight, everything would be dark.
… and of all three, Robertson is clearly the dumbest.
Yes, they would see it spinning 365 times per year, despite the fact it is actually rotating 366 times per year relative to the stars.
If the earth were rotating retrograde then our year would actually have 367 days.
In a similar way, the moon rotates prograde once per revolution about the earth, so it gets no days per rotation. If it rotated retrograde at the same rate it would have two days per revolution about the earth.
“if Earth’s spin period would be 365.25 days, exactly the same as its orbit period…”
DREMT … What exactly is the point of your quote? It certainly has no connection to what I said.
Yes, that’s the problem.
Thanks for admitting to your problem.
If you had read Bindidon’s original post properly, in the first place, what you said might have had some connection to my quote from that post.
I wasn’t replying to Bindidon. I was replying to Gordon.
Hope that helps.
Yes, Gordon got it wrong, and then, because you hadn’t bothered checking the original post, so did you.
My comment was entirely correct, and even if it wasn’t it had no connection to the original post.
The lack of connection to the original post, in both Gordon’s response and your own, was what prompted me to quote the relevant part of that post in the first place. You then asked me what the point of quoting it was! Well, now you know.
Radio Gaga
https://youtu.be/mE5NQoHLS1A
aq…”Evolution is well defined. It is simply a change in the relative frequencies of alleles or of genotypes in the population”.
***
You are talking about genetics, not evolution. Genetics involves the study of one species only.
The basis of evolution is abiogenesis, a theory that life began on Earth due to inert elements like oxygen, nitrogen, carbon, etc., coming together in primeval muds to form life. The fact that no one has been able to replicate such a process in a lab is of no concern to evolutionists.
Even if it was true, there would be little in the way of overt intelligence involved, simply covalent bonds being formed. So, you mix oxygen, nitrogen, carbon, hydrogen and phosphorous in a mix and it forms a molecule. Where is the life?
Evolutionists would have us believe that more complex models lead to something like DNA. Still, where is the life? You can have strands of DNA growing in a lab, still no life.
Life is something special, especially higher life forms like humans. Evolutionists can’t even begin to explain how humans are formed from 2 cells. They can watch it happen, but they cannot explain the intelligence behind the formation.
How is consciousness formed? How does a living being formed from 2 cells become aware of its environment? How does something so complex form by sheer fluke as suggested in natural selection?
No, I am talking about evolution. That is PRECISELY how evolutionary scientists define it.
“Genetics involves the study of one species only.”
Oh really? And which species is that?
Evolution has NOTHING to do with the origins of life. Why do you people continue to conflate two different ideas despite being repeatedly corrected?
How about YOU explain those things … without waving the “god” wand.
The species under study. Genetics does not deal with propaganda about one species evolving into another, that is sci-fi and part of evolution theory. Genetics theory applies to any one species at a time.
The evolution losers have tried to redefine what Darwin meant and they have failed. What they have done is try to divorce evolution from abiogenesis, the theory that explains how life allegedly began on Earth. Then they dreamt up the sci-fi of natural selection, a Mother Nature analogy trying to explain who evolution works using metaphors.
When you come right down to it, evolution explains nothing, it is nothing more than a bad guess.
You seem to be trying to claim that Darwin connected his theory to the origins of life.
“how life allegedly began on Earth”
Allegedly? Now you are claiming that life didn’t begin on earth?
Natural second is not a dream. It is the way it MUST work.
Are you saying that you don’t believe in mutations?
Are you saying that different mutations won’t have different chances of producing viable offspring in a particular environment?
Are you saying that this won’t lead to an increasing fraction of offspring with a ‘good’ mutation over this with a ‘bad’ one?
If you accept genetics, where exactly does your denial begin in that process?
How I got “second” instead of “selection” is beyond me.
binny…”I see: the usual Robertson / Clint R / Pseudomod blah blah.
No need to continue discussing”.
***
Translation…Binny is licked. We can expect his girlfriend to start posting soon.
No one is licked here, Robertson.
The opposite is the case: you pseudo-skeptics are all so fixated on your opinion, which is based on nothing real, that you lack any imagination, and even would hide it if it ever came to overshadow your nonsensical opinion.
And if there is one who lacks any imagination, that’s you:
” … you actually wouldnt see anything since without sunlight, everything would be dark. ”
Anyone with a functioning brain would have understood that I meant human-like beings coming from far away, landing on the dark planet Sun and observing the other planets orbiting it.
Robertson apparently never heard of techniques allowing us to ‘see’ in the dark.
How would you see anything without light?
Antonin Qwerty
Your replies dated July 18, 2024 at 9:35 PM
” Yes, they would see it spinning 365 times per year, despite the fact it is actually rotating 366 times per year relative to the stars.
If the earth were rotating retrograde then our year would actually have 367 days. ”
and July 18, 2024 at 10:09 PM
” In a similar way, the moon rotates prograde once per revolution about the earth, so it gets no days per rotation. If it rotated retrograde at the same rate it would have two days per revolution about the earth. ”
*
I thought you would have understood what I mean: Earth’s synchronous rotation around the Sun perfectly replicating the situation ‘Moon wrt Earth’.
I was not interested about its cause, let alone about details like how long the same period for Earth’s orbit and spin would be, or whether Earth then spins prograde or retrograde.
Your distraction with these details has let my comparison disappear in the background: to show that under the very same situation, the same effect (Earth facing observers all the time) should prevail.
Huh? My comment was directed at Gordon. I don’t think I even read yours.
Yes, such misunderstandings happen.
And… what do you think about the fact that in the case of a synchronous orbit/rotation, each celestial body shows the same side to the body it orbits?
A synchronous orbit, if there is any such thing, would require exactly one rotation per orbit. That means the body would have to turn through 360 degrees per orbit, meaning that at half orbit the near face would need to point away from the orbited body.
The only valid explanation for the Moon is curvilinear translation without local rotation. A perfect analogy is a car being driven around an oval. An observer representing the Earth would have to be inside the track and from that position all he’d see is the same side of the car. If that car, at any time, turned about its COG, it would lose control and stop going straight ahead.
Gordon,
“A perfect analogy is a car being driven around an oval.”
and
” If that car, at any time, turned about its COG, it would lose control and stop going straight ahead.”
Is the car going around the oval or is it going straight ahead?
bobdroege, please stop t-word-ing.
Who will still be here to watch cycle 26
https://youtu.be/9yNnlBMndlw
I see you’ve given up on SC25.
Pity Zharkova couldn’t come through for you.
AntOnan needs his bite
“Let’s randomly change one letter of his name, then randomly capitalise another … that’ll get him”
Antonin, please stop t-word-ing.
ESAs Juice probe to Jupiter prepares for first Earth+Moon slingshot fly-by
July 19, 2024 10:35 am Robert Zimmerman
https://behindtheblack.com/
“The European Space Agencys (ESA) first first mission to Jupiter, dubbed Juice (Jupiter Icy Moons Explorer) is about to do the first ever back-to-back fly-bys of the Moon and then the Earth immediately afterward in order to slingshot it forward on its long journey to the gas giant.”
I have “always” been interested in using the Moon for gravity assists- it’s rarely done.
But a couple of things…
This something that save Delta-v at a cost of time, and once we have gas stations in LEO, there was be less obsession in saving delta-v at the cost of added time.
Another thing, if one did a lot of these gravity assist, it would slightly change the lunar orbit.
Are you sure you haven’t been using a little blue pill for gravity assists? Or is that anti-gravity assists.
Is there a connection between gravity assists and coffee?
Gravity assists are largely about changing a vector. And coffee is coffee. I am just starting to drink some- or said differently at moment I have not had enough coffee.
Anyhow, was going back to get more coffee, and it was taken, I had to make more, and not wanting to wait, it’s stronger coffee.
Anyhow, hohmann require the least amount of delta-v to get somewhere and roughly it’s not changing a vector. And Mercury is hard to get to, because it requires changing a vector. And gravity assists are mostly about changing your vector {without using rocket fuel to change the vector- which can be costly in terms of the rocket fuel used}.
Getting to Mars with hohmann takes about 8 months, and if you change your vector, it typical takes about 7 months. And Musk wants to crash into Mars atmosphere {to change the vector} to get their in 6 months.
Venus orbit is better than Earth orbit, mainly or for a reason, it’s easier to change your vector. Venus is better place to get to our solar system than Earth is.
And there are lots of other reasons why Venus orbit is better.
It has been said, God gave us the Moon, so we can be a space faring civilization. But God also gave us, Venus, which not mentioned, very much.
Getting enough coffee, I was writing something. And it seemed amusing:
…”How about 960″ [80 feet] or 24.384 meters outside diameter:
Again wall thickness of 1/4 of inch or .00635 meters.
The pipe will be 200 meter long [7874.02″ or 656.1683 feet]. And will have hemispheric ends [a 80 foot outside diameter sphere cut in half].
So pipe made of common type of stainless steel [304] which is 900″ in diameter or a sphere with 900″ outside diameter which has .25″ thick wall
is calculate with safety factor of .72:
Internal Pressure at Minimum Yield (psi): 16.7
Ultimate Burst Pressure (psi): 41.7
Maximum Allowable Pressure (psi): 12
https://www.engineeringtoolbox.com/barlow-d_1003.html
Now using structural elements one can “improve things” but sphere or cylinder are roughly strongest in terms of tensional forces [or also in terms compressive forces].
But one can use better material and roughly stainless steel is cheap and good enough if talking about a lifetime of a decade within a marine environment and you might
agree with Elon Musk, that it’s the best in terms of experimental projects. But 304 stainless steel may not be best stainless steel, other than it’s common and so is made
in large amounts. I am using it, as it’s “useful baseline” or average, sort of thing. A safety in numbers- one might venture to say.
Let’s start with the sphere. And just use google, surface area of sphere, radius, 40 feet: 20106.19 square feet. Or in meters: 12.192: 1867.93 square meter, outside diameter
Inside diameter with thickness of .00635 meter, x 2 = 0.0127 And 12.192 – .0127 is 12.065 meter. inside surface area is: 1829.21
But middle of it: 12.192 – .00635 = 12.18565 square meter. And since it’s .00635 meter thick, times .00635 by 12.192 is 0.077378878 cubic meter.
Steel density is about 8000 kg per cubic meter, 0.077378878 x 8000 = 619.03102 kg of stainless steel.
if put that on water, filled with air, it floats oddly. It’s huge sphere which doesn’t sink in water much, and wind blow it around a lot- and it 80 feet tall,
or as high as 8 story building, or high and wide thing blowing in the wind upon the waters. Or a big steel balloon. And would float better then huge rubber walled
balloon- cause steel is stronger than rubber, it would have to be much thicker rubber to be spherical shape. And anyway this is a “balloon tank structure” used in rockets.
And need some pressure or it collaspes from it’s weight [in 1 gee gravity}. It should appear, magical or impossible.
Anyhow instead of air, going to fill with something more dense, and freshwater is less dense than seawater. Seawater is about 1020 kg and fresh is 1000 kg per cubic meter.
And filled with freshwater, it will still look sort of impossible/alien in a different way. But I won’t be as scary like huge ball charging across the ocean.”
As usual, Robertson’s completely dumb blah blah:
” The only valid explanation for the Moon is curvilinear translation without local rotation. A perfect analogy is a car being driven around an oval. An observer representing the Earth would have to be inside the track and from that position all he’d see is the same side of the car. If that car, at any time, turned about its COG, it would lose control and stop going straight ahead. ”
*
Robertson is egotistic enough to believe that inventor Tesla, a couple of Serbs led by the paranoid Vujicic, and a few ignoramuses who endlessly post nowadays their Newton text manipulations, their MOTL/MOTR, curvilinear translation, oval tracks and ball-on-a-string nonsense on this blog could ever surpass the results of so many completely different observation tools and calculation methods done by so many astronomers.
*
The primitive text above shows that none of them understands that yes: the Moon shows us the same face every day, but… is every day at a different place, and that if you want to see how a point on the Moon really moves in space, you have to
– track that point several times during over a year and note its apparent positions
and
– transform step by step these apparent positions, from trivial points on a flat disk viewed from Earth, to points on a sphere cut at its center by a plane parallel to the Ecliptic and oriented toward the First Point of Aries. A big, big, big job.
*
Robertson and his denier gang aren’t even able to read German, let alone to understand – and above all – technically contradict, for example, Tobias Mayer’s computations of selenocentric lunar crater coordinates, spin axis inclination wrt the Ecliptic and lunar spin period based on spherical trigonometry.
Mayer’s treatise
https://www.e-rara.ch/download/pdf/913790
Pictures referred to in the treatise
https://www.e-rara.ch/download/pdf/913769
Bindi, Mayer was measuring orbital period. He didn’t understand that Moon does NOT spin.
You’re trying to support your false beliefs by clinging to ancient sources. Even NASA appears to now be backing away from the spin nonsense. They’ve removed Youtube videos since this discussion began here. They told Gordon that Moon’s spin is “as it appears from the distant stars”. Notice no one from NASA comes here to defend the spin nonsense, and you know NASA people lurk here.
You can’t provide a viable model of “orbiting without spin”. Endless blah-blah ain’t science.
Clint R
YOU STATE: “You cant provide a viable model of orbiting without spin. ”
I have already given you one but you reject it. Why do you keep saying that posters have not provided you with a viable model of orbiting without spin.
You are not doing the model I told you about because it would show how wrong you are and with your inflated ego, you can’t accept any information except your own deluded cult beliefs.
Take two cans (you have some I am assuming). Put one in the center (to represent the Earth). Take the other one (represents Moon) and move it around the center can (represents an orbit). Move the Moon can around the center can without rotation. Do not twist your hand as you move it around the “Earth can”. In an orbit without spin all sides of the “Moon can” will at some point face the “Earth can”. If you would take the time and investigate (which we all know you will never do) you will find that in order to keep the “Moon can” same side facing the “Earth can” you will have to rotate the “Moon can” as you move it in an “orbit” around the “Earth can”.
Norman, your ignorance matches your immaturity.
You have no clue what “orbiting” is, and you can’t make a comment without insulting and falsely accusing.
Grow up and learn some science.
Take an ordinary coat hanger and cut the horizontal part into two pieces so you have a straight stiff piece of wire.
Put the wire into a drill.
When you turn the drill on, the wire spins, so put a ball on the free end with a dot to represent the face.
So the ball is spinning around the axis through the ball.
Stop the drill and bend the wire 90 degrees at one point near the drill, and then bend the wire back near the ball.
Turn on the drill and watch the ball revolve while keeping the dot facing towards the center of the “orbit”
Also note the ball is still rotating around its internal axis as it was before the wire was bent.
That should be the end of it.
But no, some people have no spatial awareness.
Norman, your model is not viable because you have nothing in it to represent gravity.
bob, on the other hand, produces a viable physical model of “orbit without spin”. However, since the ball is moving as per the MOTL, his model supports the “Non-Spinners”.
More incompetence from bob.
After the bends, the ball would no longer be “spinning”. It would only be “orbiting”.
Obviously bob didn’t actually perform the experiment, and he can’t visualize it. He has NO knowledge of the issue. He just keeps throwing crap against the wall.
That should be the end of it.
But no, bob will just try some more crap.
Bob just showed that the ball on a string is rotating on an internal axis, same as the Moon.
Bending the wire doesn’t stop the wire from spinning.
If it is spinning on one end, it is spinning on the other end.
bob, before bending the wire, the axis of rotation aligns with the centre of the ball, so it’s fine to say the ball is rotating on its own internal axis. Once you bend the wire, however, the axis of rotation is still in the middle, where the drill is, but now the centre of the ball doesn’t align with it. The axis of rotation is now external to the ball. So, the ball is rotating about an external axis, not about its own internal axis. Think point 2), again.
DREMT,
Nope
Bending the wire separates the two axes that were always there.
That’s wrong, bob…and by agreeing to my point 2), you’ve already agreed it’s wrong. There are not two axes of rotation in your “bent wire” scenario.
DREMT
Your hand moving the can around the other one would simulate gravity. At least can you see that it is possible for an object to move around a center and keep one side facing the center but rotating one time as it moves around the circle. I do understand that Clint R will not understand it. His mind is in elementary school with his obsession with a ball on a string.
As you can understand. A ball on a string is a worse analogy for orbiting object than using your hand to move it around. The string and ball are one unit. The unit itself is rotating around the center (or your finger). Ball on a string only represents rotation of an object around a center point. It is not a valid description for the moon orbiting. However your hand moving the can in a circular motion is a valid description of orbit with or without rotation. If you do not rotate the moon can around the center all sides will be seen by the center view.
Norman, that’s just not how gravity works. You have to have some kind of physical connection between the two bodies in your model, to even get close to simulating it.
Norman demonstrates his ignorance once again: “It is not a valid description for the moon orbiting.”
Even being told numerous times, poor Norman STILL believes the ball-on-a-string is a model of Moon. WRONG! It is a model of “orbiting without spin”.
Norman, like his cult, just can’t learn.
DREMT
I am not sure why you feel that moving an object around in a circular motion does not represent an orbit. Gravity is not like a string attached to the Moon. It just bends the Moon around a circular path like your hand would do to the can.
I am certain that Clint R is unable to comprehend what I posted. He is not an intelligent person. Mostly just a belligerent drunk who drinks alcoholic beverage and posts. Drunks think their ideas are intelligent.
I do not think you are of his low intellect and hope you are able to at least see the potential of how the Moon can keep the same side facing Earth and yet still rotate one time on its own axis as it completes and orbit. It does explain Libration quite well.
https://www.youtube.com/watch?v=3hmhwy4mSOg
This shows how an object can move around a center object rotating on its axis one time per complete motion and continue to show the same side to the center.
Not sure why you are stuck on the gravity aspect. Just look at the video and think about it. It is something you can do.
At least consider your current view is not correct and all the scientists are not wrong and actually do understand what they are saying.
Norman, I can see both sides of this argument, always have been able to, and I’m sure Clint can, too. For me, gravity is much better represented by a string attached between the bodies than it is by a giant hand physically grabbing the object and moving it in a loop, where there is then nothing representing the force of attraction between the objects.
If one end of a stiff wire is rotating, then the other end is also rotating.
…about the same, single axis of rotation. There is only one axis of rotation in your “stiff wire” scenario, not two.
Norman has found another video he can’t understand.
That video, and his “can”, are nothing more than Ent’s “passenger jet flying backward”. The cult can’t understand the basic physics because they can’t understand vectors.
The Internet is full of such nonsense. And poor Norman can’t sort out the crap from reality.
Oh yes, almost forgot about that:
https://www.canva.com/design/DAGEEJSpSi4/qZ0QwpIqz7FeMW1IBycWyw/view?utm_content=DAGEEJSpSi4&utm_campaign=designshare&utm_medium=link&utm_source=editor
DREMT,
“about the same, single axis of rotation. There is only one axis of rotation in your stiff wire scenario, not two.”
Sorry DREMT, as usual you are bending rules of mathematics and physics to match your deluded world view.
An axis of rotation is defined as a straight line.
When the wire is bent, it is impossible for a straight line to follow the bends. Both ends of the wire are rotating on internal axes.
You should be able to note that a ball placed on the end of the wire opposite from the drill end, always faces to the center of the revolving ball.
Just like the ball on a string, proving the ball on a string is rotating on an internal axis.
"An axis of rotation is defined as a straight line.
When the wire is bent, it is impossible for a straight line to follow the bends."
bob, the axis of rotation isn’t following the bends. The axis of rotation remains in the centre, where the drill is. It remains as a straight line.
There is only one axis of rotation in your "stiff wire" scenario, not two.
DREMT,
“bob, the axis of rotation isnt following the bends. The axis of rotation remains in the centre, where the drill is. It remains as a straight line.
The axis of rotation goes where the wire goes.
All parts of the wire are spinning.
Another one bites the dust.
False, bob, but your catastrophically ignorant comments about rotation are always amusing. Thank you for the chuckles.
There is only one axis of rotation in your "stiff wire" scenario, not two.
DREMT,
I proposed an experiment that shows if a wire is spinning on one end you can feel the wire turning or rotating on its own axis through the local center of the wire.
If you tried it, you would see that.
You could just bend a wire in a dogleg and hold both ends and rotate either end of the wire.
You can pick any straight line to rotate around.
Note in your experiment log the results.
Then put one end back in the drill and a ball on the other end.
Turn the drill on and note the direction the ball faces.
Not that in your logbook.
There is only one axis of rotation in your "stiff wire" scenario, not two.
DREMT,
You just can’t declare the results of an experiment to be wrong.
You have to prove the results are wrong.
Which you haven’t done.
The experiment shows that an object always facing the center of the orbit is rotating once per orbit.
I wins again.
DREMT,
Buy one of these.
https://www.northerntool.com/products/proto-1-4in-drive-flexible-socket-extension-6-1-4in-model-j4765-104232?cm_mmc=Bing-pla&utm_source=Bing_PLA&utm_medium=Hand%20Tools%20%3E%20Sockets%20%2B%20Socket%20Sets%20%3E%20Adapters%2C%20Extensions%20%2B%20Joints&utm_campaign=Proto&utm_content=104232&cmpid=53403384&agid=3200075895&tgtid=pla-4577335631945433&prdid=104232&ogmap=SHP|PLA|BING|STND|c|SITEWIDE||Hand%20Tools%20-%20SC|Hand%20Tools||53403384|3200075895&gclid=d3628923c2bb1fd042c2ef8465cacaa8&gclsrc=3p.ds&msclkid=d3628923c2bb1fd042c2ef8465cacaa8
#2
There is only one axis of rotation in your "stiff wire" scenario, not two.
DREMT,
With the flexible socket extension there are an infinite number of axes of rotation.
Sorry DREMT, I win again.
#3
There is only one axis of rotation in your "stiff wire" scenario, not two.
… observed in some particular DREMT reference frame.
bob is correct once reference frames are properly taken into account since all motion is relative.
Incorrect. There is only one axis of rotation for movement like the MOTL, regardless of reference frame.
Nope. Properly observed from the inertial frame, MOTL is both orbiting the center circle on R and observed inertially rotating about its own axis on r. All motion is relative.
There is only one axis of rotation for movement like the MOTL, regardless of reference frame. It is mathematically impossible for there to be two axes of rotation for such movement.
Nope. R and r are easily measured and observed. Ftop_t long ago showed an animation in the inertial frame with distances R and r enumerated which DREMT simply ignored. The wiki MOTL is also an animation where R and r are observed and easily measured.
#2
There is only one axis of rotation for movement like the MOTL, regardless of reference frame. It is mathematically impossible for there to be two axes of rotation for such movement.
Already disproved by observing wiki page and ftop_t inertial animations. Got anything new? No? I thought so.
#3
There is only one axis of rotation for movement like the MOTL, regardless of reference frame. It is mathematically impossible for there to be two axes of rotation for such movement.
Clint R
” Bindi, Mayer was measuring orbital period. He didnt understand that Moon does NOT spin. ”
*
No he wasn’t, ignoramus Clint R.
You never would ever be able to scientifically disprove Mayer, and resort to completely ridiculous allegations based on your knowledge-less meaning, which is keeping all the time at the poor level of your ‘orbiting without spin’ nonsense.
*
And above all, you don’t say the truth when posting:
” Youre trying to support your false beliefs by clinging to ancient sources. ”
No. I have shown often enough that sources ranging from the end of the XIXth century to nowadays uniformly show the same results obtained from methods totally differing from earlier, from fixed-star photography up to lunar laser ranging, two techniques you know NOTHING about.
Furthermore, you also don’t when posting:
” Even NASA appears to now be backing away from the spin nonsense. ”
WHERE do they show that, Clint R?
Show us a valid source confirming:
” They’ve removed Youtube videos since this discussion began here. ”
Never did Robertson write any email to NASA about Moon’s spin, let alone would they ever have replied:
” Moons spin is ‘as it appears from the distant stars‘. ”
Simply because outside of this blog, no one on Earth uses such a meaningless discourse, Clint R.
These words (see my emphasis) were used only by Swen*son, and credulously posted by Robertson and… YOURSELF.
From the ancient past, over Newton’s Principia, till today: you see only the wording ‘with respect to the fixed stars’ which has a scientific meaning.
Scienceless people we recognize whenever they write ‘as it appears from the distant stars’ which only uneducated people use.
Bindi, I need to remind you again — Endless rambling blah-blah ain’t science.
You don’t have a viable model of “orbiting without spin”, so you’ve got NOTHING.
Rɒdʒə!
It’s important to address this nonsense from Ant: “If the moon were rotating about the sun without revolving on its own axis then it wouldn’t be rotating with respect to the stars.”
That statement is so incorrect it must be corrected before it can be corrected!
Ant confuses the words “revolving” and “rotating”. So what he’s trying to say is: “If the moon were revolving about the sun without rotating on its own axis then it wouldn’t be rotating with respect to the stars.
Ant is STILL wrong after the first correction. The moon would STILL be showing all sides to the stars, just as Moon now shows different sides to the stars. Moon just shows one side to the inside of its orbit.
Ant is full of nonsense, just like his cult. I don’t have time to always correct them, but I try to catch their most egregious errors.
Another example is from one of my stalkers, Ball4. He always jumps in to support his moon spin nonsense with “reference frames”. Like his cult, he beliefs “reference frames” mean something. More often than not, “reference frames” only confuse the issue, leading to false conclusions.
For example, the distance across the connected US, east to west, is about 3000 miles. But on a map (different reference frame), the distance may only be a few inches. Ball4 would have us believe the correct distance across the US is only a few inches! That’s an example of “throwing crap against the wall, hoping something will stick”.
They can’t come up with a viable model of “orbiting without spin”, because they understand NOTHING about orbital motion.
“But on a map (different reference frame), the distance may only be a few inches.”
Lol. Humorously uninformed Clint 7:04 am misses the legend on his map that shows how many map inches = geographical US miles. Clint also misses that a viable model of “orbiting without spin” is our single Moon face seen as viewed from Earth which Tesla pointed out long ago.
True, though, many commenters do know it really is time consuming correcting the blog laughing stock Clint R.
Ball4 admits a “frame of reference” is useless, without meaningful information to go with it.
Trying to use distant stars as the “frame of reference” for Moon omits the fact that Moon is orbiting Earth.
Its important to address this nonsense from Clint:“But on a map (different reference frame) … “
That is NOT a “different reference frame”! A “different reference frame” would be something like setting the prime meridian at Paris instead of Greenwich. Or measuring latitude from the ecliptic instead of the equator.
A “different reference frame” would be using an x-y coordinate system fixed to a merry-go-round instead of fixed to the ground. Or aiming the x-axis down a ramp instead of horizontally.
In all frames of reference, LA and NYC are the same distance apart.
I can easily understand and forgive accidentally reversing two similar words like “rotate” and “revolve”. But to boldly, actively misunderstand “reference frame” shows that Clint doesn’t even have a elementary understanding of the issues here!
P.S. For anyone who wants to see a cool, old-school (60 year old!) video about frames of reference, check this link:
https://www.youtube.com/watch?v=bJMYoj4hHqU
Sorry Tim, reference frames do not resolve the moon issue, as you’ve already agreed.
DREMT is wrong. There has been no moon issue DREMT has ever commented that cannot be resolved through the proper use of a reference frame for the observation since all motion is relative. All means ALL, no exceptions.
Shhhhhh.
The cult is in full meltdown. Theyve lost on the Moon issue, and theyve lost on the GHE nonsense.
In trying to discuss science, I constantly get insulted and falsely accused. Im constantly accused of not knowing physics. No one has been able to show where I got something wrong, yet they keep falsely accusing.
Whenever I present a simple physics problem, NONE of then can get the right answer. Yet they falsely accuse me of not understanding physics.
The most fragrant false accusers are Norman, Nate, bobdroege, Folkerts, Bindidon, Gordon, and Ball4, with Ken, Ant, barry following close behind.
So, its time for another physics problem
No need to present new problems until you correct your wrong answers to previous problems.
We can start with your wrong solution to the green plate problem if you wish.
Unless you can provide your qualifications to teach physics, I won’t be taken in by your crap.
Thanks for proving me right, bob.
bs. problem requires no solution. When you can see the flaws in the problem why bother trying to reach a solution? And why get involved with a gotcha from a pure ijit?
Thanks for proving me right, gordon.
“so that each side of the sphere receives 500 W/m at its disk.”
Well, first off, spheres don’t have ‘sides’, I think we can infer you mean something like 4 uniform beams of 500 W/m^2 are aimed straight down at the equator at longitudes of 0, 90, 180, and -90 (and later two more uniform beams are aimed at the poles). I.e. the point directly facing the beam receives 500W/m^2, and that value drops off to 0 W/m^2 as you move 90 degrees away along the surface of the sphere.
If this is what you meant, then the sphere receives and absorbs 4 x 500 W/m^2 x (pi)r^2 = 6280 r^2 watts of power. At steady-state it also emits 6280 r^2 W from a surface area of 4(pi)r^2, which works out to 500 W/m^2 uniformly from the sphere. 500 W/m^2 is easily converted to 306 K.
If you increase the incoming light by 50%, the outgoing radiation will increase proportionately, or 750 W/m^2. This converts to 339K.
This is really not that tricky. I don’t know why you think anyone with a passing knowledge of physics would struggle with it. It will be fascinating to see if you get the right answer.
[Also, It doesn’t actually matter where the beams are aimed, since you postulated perfect thermal conductivity. The answer would be the same if a single 2000 W/m^2 beam was aimed at the sphere for 1a, and a single 3000 W/m^2 beam was aimed at the sphere for 1b.]
Sorting through all the tedious blah-blah, I found this for what appears to be Folkerts’ answer to problem 1a:
“500 W/m^2 is easily converted to 306 K.”
That is [surprisingly] correct!
(Note Nate, gordon, bob, or anyone else was unable to solve it.)
But Folkerts should have stopped there.
The two additional sources would be unable to raise the temperature beyond 306K. The sphere is already emitting 500 W/m², so an arriving flux with the same, or lesser, value would not increase the temperature. This is what Folkerts, and his cult, can not understand.
Believing that ANY arriving flux will increase the temperature of the surface is one of the major flaws in the GHE nonsense. If that were true, you could boil water with ice cubes.
This proves, once again, that the cult doesn’t understand the basic physics.
“But Folkerts should have stopped there.”
Sorry, but I am correct and you are wrong.
By definition, any flux arriving at a surface with emissivity =1 will be absorbed. All of the power of all the 6 fluxes will be absorbed. All of the power must be emitted again, which is 339 K.
“If that were true, you could boil water with ice cubes.”
This proves, once again, that Clint doesnt understand the difference between radiant exitance (emitted flux) and irradiance (arriving flux). He confuses the flux EMITTED by ice (or other material) with the flux RECEIVED by some other surface.
Folkerts, making up definitions to violate the laws of physics won’t work.
Just as confusing “arriving” with “emitting” won’t work.
You don’t have a clue about radiative physics or thermodynamics.
“You dont have a clue”
A teacher who cant explain why the student’s answer is wrong would be fired.
Ur fired.
Clint is adding fluxes in the first problem, but refused to add fluxes in the second problem.
Totally wrong, bob. Actually, Tim and Clint agree that fluxes don’t add in the first problem, but then, randomly, Tim decides that an additional two fluxes will add to the first four, in the second problem!
DREMT,
Go ahead and stick your foot in it again.
The problem has 4 sources equally spaced at 90 degree intervals around the sphere.
Each illuminates half the sphere, so with 4 sources there is overlap, such that each point on the sphere is illuminated by two sources.
Clint is adding fluxes to get to his 500 watts per square meter.
you guys got a good circle jerk going, what happens when someone turns the light on.
Agree to disagree.
How Will SpaceX Starship Overcome This Problem?
https://www.youtube.com/watch?v=U18lle1xBAA
Well, this is useful video.
It say, liquid Methane is a lot easier than Liquid Hydrogen- which was mentioned in video.
But I would add there was an obsession regarding LH2 and rocket fuel depots. Hydrogen [and LH2] have great specific heat. So great specific heat and best rocket fuel in space, helps make people stubborn about using LH2. But Liquid Methane doesn’t need too as cold and it’s cheaper to make.
Or if the moon has frozen CO2, it makes mining lunar water, to make rocket fuel, at lot easier/cheaper. Or CO2 on Moon will make lunar H20 “more” mineable.
But an aspect not mentioned is have a gas station in lunar orbit. So in space or lunar orbit, it’s easy to make stuff cold {or hot}. And it terms of thermal control, lunar orbit should be easier than Earth orbit {depending where one has it, etc, but with lunar orbit, one could say, one has more practical choices of where in orbit with the Moon vs with Earth orbits.
It’s always amazing to watch Pseudoskeptics running plain right into a blind-alley:
” For me, gravity is much better represented by a string attached between the bodies than it is by a giant hand physically grabbing the object and moving it in a loop, where there is then nothing representing the force of attraction between the objects. ”
Apparently, the Pseudomod forgot that a ‘string attached between the bodies’ is exactly the same as a ‘ball-on-a-string’.
And the latter ‘concept’ is used by all Pseudoskeptics to show that the Moon cannot spin about an internal axis.
But… if ‘gravity is much better represented by a string attached between the bodies’: how then does Earth rotate about its polar axis whilst orbiting our Sun?
Does the ‘string attached between the bodies’ Earth and Sun suddenly, incidentally differ from the ‘string attached between the bodies’ Moon and Earth?
Interesting.
*
But… wait.
The most delicious detail of the matter is the functionality of this ‘string attached between the bodies’ in the case of an apple falling from a tree :–)
As we all know, Newton’s law of gravity is of a completely general nature; its validity does not depend on the masses involved, however small they may be. Hmmmh.
The law is so general that, if photons had mass, it would make it possible to calculate their deflection by very heavy masses (which is now explained by the equivalence of mass and energy).
*
But as we have known for as long as they have existed, pseudo-skeptics always manage to invent a back-pedal with which they can maneuver themselves out of any imaginable dead end.
Sure, Bindidon, the ball on a string is a model of “orbit without spin”. The fact that the ball is unable to spin (because it’s constrained by the string) is kind of the point. That’s part of how we know it’s “orbit without spin”. And, if that model is correct, then the Earth is rotating 365.25 times per orbit of the Sun, not 366.25 times.
Bindi seldom attempts science. He usually relies on ancient astrologers. But, when he does attempt science, it’s always funny:
<I<"But… if gravity is much better represented by a string attached between the bodies: how then does Earth rotate about its polar axis whilst orbiting our Sun?"
Earth has “spin angular momentum”, as it orbits. Moon has NO “spin angular momentum” as it orbits.
… as viewed from Earth.
As was 100% predictable:
– the Pseudomod carefully dodged around the facts I quoted, thereby turning my arguments by 180 degrees and pulling the wool over the blog’s eyes with completely irrelevant 36x.yz details;
– the worldwide renowned ‘ball-on-a-string’ specialist Clint R didn’t understand even a bit of what I wrote.
So are they, these genial Pseudoskeptics…
Bindi, speaking of a “ball-on-a-string”, have you found a viable model of “orbiting without spin”, yet?
No?
You’ve got all those links to ancient astrology, but NOT one can describe orbital motion?
Maybe you should switch to some other false science….
“… Pseudoskeptics…”
Nice Pseudoskeptics of the cargo cult which are talking about the Moon.
When are going to Moon and will find anything interesting?
Last time we played on the Moon- mostly activity related to Cold War,
it changed our world.
One thing bad about it, was politicians would say such things as, if we can go to moon, we can have a war on Poverty and later a war of Drugs.
Both didn’t work.
And now governments imagine they could control global CO2 levels- and other than increase global CO2 level, it hasn’t been successful, unless wasting trillions of dollars of public’s money is a mark of success.
Bindidon, I was talking to Norman about how gravity should be represented in a physical model of “orbit without spin”, and I said using string was preferable to just using your hand, as then there’s nothing to represent the attraction between bodies. That doesn’t somehow mean that I actually think gravity works like a piece of string, as your counter-arguments suggest. If anyone’s trying to pull the wool over the blog’s eyes, it’s you.
Pseudomod
” I was talking to Norman about how gravity should be represented in a physical model of ‘orbit without spin’… ”
Pseudomod, Newton’s gravity law has nothing to do with your trivial ‘élucubrations’ about ‘physical models’, as we use to name pseudo-arguments like yours in my native tongue.
Rɒdʒə!
You refuse to engage on any relevant subject relating to the moon issue, and when I show your own arguments to be bunk you just spit abuse and false accusations. If you don’t want to discuss it, stop starting new threads about it.
” You refuse to engage on any relevant subject relating to the moon issue… ”
Me, refusing that?
This is a lie as always, Pseudomod.
Your subject relating to the moon is not relevant at all – except for a small, irrelevant troop of lunar spin deniers.
More false accusations from Bindidon, to ignore.
Armada to Apophisscientists recycle old ideas for rare asteroid encounter
“It will miss the Earth. It will miss the Earth. It will miss the Earth.”
Stephen Clark – 7/19/2024, 5:26 PM
https://arstechnica.com/space/2024/07/armada-to-apophis-scientists-recycle-old-ideas-for-rare-asteroid-encounter/
Linked from instapudit
“For nearly 20 years, scientists have known an asteroid named Apophis will pass unusually close to Earth on Friday, April 13, 2029. But most officials at the world’s space agencies stopped paying much attention when updated measurements ruled out the chance Apophis will impact Earth anytime soon.”
…
“An asteroid this large comes this close only once per 1,000 years, or less frequently,” Binzel told Ars. “This is an experiment that nature is doing for us, bringing a large asteroid this close, such that Earths gravitational forces and tidal forces are going to tug and possibly shake this asteroid. The asteroid’s response is insightful to its interior.”
Your endless “ball on the string” debate is scientifically retarded from both sides. you apparently cant figure out in this argument the ball is attached the wrong way in only one point which applies angular momentum on the ball and forces it into synchronized orbit and spin preventing any other type of motion.
Now attach the ball correctly at two points on sides through friction-less axle perpendicular to the earth the string will not transfer any torque on the ball and your ball will face in the same point in space when spun’
Clint R foled you with the wrong model long enough, you can drop the nonsense now.
The ball on a string has only one axis of rotation:
https://web.archive.org/web/20231016085906/https://www.drroyspencer.com/2020/12/uah-global-temperature-update-for-november-2020-0-53-deg-c/#comment-566034
… as viewed from an accelerated frame such as observing from Earth.
No, Ball4. Regardless of frame of reference. It’s an “absolute” statement, since in both the possible descriptions of the movement:
a) Rotation about an external axis with no rotation about an internal axis.
b) Translation of the ball in a circle with rotation about an internal axis.
There is only one axis of rotation.
I explained why frames of reference don’t resolve the moon issue here:
https://www.drroyspencer.com/2024/07/uah-global-temperature-update-for-june-2024-0-80-deg-c/#comment-1679420
and here:
https://www.drroyspencer.com/2024/07/uah-global-temperature-update-for-june-2024-0-80-deg-c/#comment-1679429
You fled the scene.
The DREMT 4:55 pm comment contains nothing substantive; the 9:44 am comment was debunked. DREMT has put up no comment with a valid dispute thus must accept the conclusions concerning reference frames as did ftop_t. Thanks, DREMT.
Got anything substantive to comment?
Ball4, your “reference frame” nonsense went up in flames when you admitted you had to have a “legend” to make a map useful.
A map, reference frame, by itself is useless.
Just like you….
Ball4 simply lies, as usual.
Eben doesn’t realize the ball would then be ROTATING around his frictionless bearings!
Eben has been a crackpot for years. Now he clearly reveals his incompetence.
One down, bazillion to go….
Eben
” Your endless ‘ball on the string’ debate is scientifically retarded from both sides. ”
The debate IMHO is not about this bloody ‘ball on the string’, nor about oval tracks, merry-go-round, curvilinear translation, etc etc.
It is not even about the trivial idea that if we always see the same face of the Moon, then it can’t spin i.e. rotate about an internal axis; thus, only ‘orbiting without spin’ or, for some, rotation about an external axis can be meaningful.
The heart of the debate is mainly about the incredibly arrogant behavior of some incompetent people,
– who dismiss hundreds of scientifically based results as the ‘work of ancient astrologers’, although they themselves would never be able to scientifically refute these results;
– who even try to twist the words of a scientist like Newton until they fit into their absurd, egomaniacal narrative.
Bindi in your “hundreds of scientifically based results”, are there any examples of what orbiting is? For example, a viable model of “orbiting without spin”?
If not, then your cult has NOTHING.
Sure, those 100s explain inertia. A viable model of “orbiting without spin” is our Moon observed having no rotational inertia from Earth, an accelerated frame, as the 100s explain.
Humorously uninformed and/or misinformed Clint R could pick one of the reliable 100s and learn about inertia. No going to happen since Clint prefers remaining the blog laughing stock.
Ball4…when Tim Folkerts brings his “libration in longitude” argument up, for the thirtieth time, will you tell him that he is only arguing the moon’s movement is composed of two motions from an inertial reference frame, whereas from an accelerated frame he is arguing that it’s composed of only one? I’d love to see you two argue about that.
Tim, unwittingly arguing for my point 3) whilst Ball4 endlessly confuses himself about frames of reference. That would be a fun one to watch. Please say you’ll challenge him next time he mentions it.
DREMT, a BOS has no longitudinal libration since the translation of the BOS cg does not vary in speed during its circular orbit as does the lunar cg orbiting Earth in an ellipse. Your point 3) is for a BOS motion not the lunar motion. Correctly your point 3) for the BOS:
P3) Mechanically, the movement of the ball on a string is one observed single “swinging motion” in an accelerated frame. Not two observed motions as in an inertial frame.
I wasn’t talking about the ball on a string, and my point 3) is “reference frames do not resolve the moon issue”. 0 for 2 on that one, Ball4.
DREMT’s 10:51 am verbatim BOS point 3) is correct as observed from the accelerated frame of the ball twirler:
“P3) Mechanically, the movement of the ball on a string is one single “swinging motion”. Not two motions.”
DREMT fails 2:15 pm in an obvious attempt to rewrite his comment history since the internet remembers that DREMT really was “talking about the ball on a string.” in DREMT’s point 3).
This point 3, Ball4:
https://www.drroyspencer.com/2024/03/uah-global-temperature-update-for-february-2024-0-93-deg-c/#comment-1639879
That is what I was referring to. Going to start telling me what I was referring to?
DREMT now demonstrates can’t keep his stories straight. Not being able to keep stories straight often happens when a commenter doesn’t have a decent grasp on science fundamentals such as DREMT in the fields of kinematics, relativity, and climate.
Quoting points that DREMT is referring to verbatim will help DREMT keep his stories straight.
You made a mistake. That’s not my problem.
No mistake by me; readers can easily find above my 2:28 pm is not mistaken. Perhaps DREMT can clarify his 1:29 pm point by verbatim quotes to which DREMT is referring from Tim and DREMT.
I linked to the points 1) – 4), Ball4. I regularly mention points 1) – 4). You made a mistake, and thought I was referring to “P3”, which is short for “Premise 3”, from an argument made further up-thread.
Next time Tim makes his argument about libration in longitude, I’ll expect you to turn up and argue with him.
To properly do so, instead of searching long ago blog posts for vernacular issues, perhaps DREMT can just go ahead and clarify his 1:29 pm point by posting up verbatim quotes to which DREMT is referring from Tim and DREMT.
No need to quote myself, as I already linked to points 1) – 4) so that anybody, including you, Ball4, can just go ahead and read my point 3). It’s as I said, “the moon issue is not resolved by reference frames”. That’s the crux of my point 3)…
…and Tim, and all those who support him, tacitly agree to it every time he makes his “libration in longitude” argument. In that argument, he is saying that the moon’s movement is composed of two motions, not one, because the change in orientation of the moon is relatively constant, whereas the orbital speed varies. In all the times he has made that argument, he has never once said, “so the moon’s movement is composed of two motions wrt an inertial reference frame, and only one motion wrt an accelerated frame”, because that is not what he is arguing. It’s an “absolute” statement – he is saying that the moon’s movement is composed of two motions. “Orbiting” and “spinning”. Of course, he’s wrong on that, but he’s right to tacitly agree with my point 3).
So, I’ll expect you to harass him, in the same manner you harass me, next time he makes that argument.
No need shown by DREMT yet to “harass” him since Tim F is physically correct in each of his 11 comments on this 7/2 blog post; DREMT should learn from Tim F. Please support DREMT’s 1:29 pm point with a verbatim quote & context of Tim F commenting on an earlier blog post writing: “It’s an “absolute” statement”. For now, that is just DREMT’s imaginative writing.
Wait and see next time he brings it up, Ball4. Maybe you can squirm your way out of it then, like the wriggly little worm that you are.
Next time? DREMT can’t even post up a first time of Tim F’s “absolute statement” because there isn’t one unless it’s posted.
Talk about imaginative writing.
Ball4 has lost touch with reality to such an extent he can’t even accept the “Spinner” argument is that the moon both orbits and spins, two motions.
Ball4 has lost touch with reality to such an extent he can’t even accept the “Spinner” argument is that the moon both orbits and spins, two motions.
DREMT, you need to clarify what you mean by “composed of two motions “.
A) At one level, all motions are trivially “composed of one motion”. The object has one location at some instant, and is moving with one velocity, angular velocity, etc.
B) At another level, there are many ways mathematically to describe some particular “one motion”. You might describe it as a combination of x and y velocities. You might describe it as combination of translations and rotations.
These are two very different concepts.
“he is saying that the moons movement is composed of two motions.”
I am saying that the one observed physical motion (A) can be accurately described mathematically as the sum of a translation of the CoM along an ellipse and a rotation about the internal axis (B) in the non-rotating frame centered at the earth-moon barycenter. Furthermore, that mathematical description follows directly from the laws of gravity and conservation of angular momentum, AND that description accurately explains libration.
So far, you have not given any mathematical description of the motion (B) that accurately describes the motion of the moon. Let alone one that follows from the laws of physics.
“Its an absolute statement”
The ‘absolute’ statement is that there is an absolute rotation of the moon. The moon *IS* rotating with respect to the ‘fixed stars’.
“DREMT, you need to clarify what you mean by “composed of two motions”.”
“Orbiting” and “spinning”, Tim. Got it?
“The ‘absolute’ statement is that there is an absolute rotation of the moon. The moon *IS* rotating with respect to the ‘fixed stars’.”
The movement of the MOTL animation can be described as either:
a) Rotation about an external axis with no rotation about an internal axis.
b) Translation in a circle with rotation about an internal axis.
If you still dispute a), argue with this:
https://web.archive.org/web/20231016085906/https://www.drroyspencer.com/2020/12/uah-global-temperature-update-for-november-2020-0-53-deg-c/#comment-566034
By the way, Tim directly contradicted Ball4 over on the other thread, as I explain in this comment:
https://www.drroyspencer.com/2024/07/an-unusually-warm-year-or-two-cannot-be-blamed-on-climate-change/#comment-1679949
DREMT 9:17 am, there is no “Tim directly contradicted Ball4” since in part the BOS is in a circular orbit where Tim’s quote you use is for elliptical orbits.
Try to keep your stories straight by getting a better grasp on the fundamentals of relativity.
Tim would say that describing our moon’s movement as being composed of one motion (“orbiting”) wrt an accelerated frame “fails for elliptical orbits”. Given that the moon’s orbit is elliptical, he’s saying that’s a no-no for our moon. You, on the other hand, Ball4, would be quite happy to say that our moon’s movement is composed of one motion (“orbiting”) wrt an accelerated frame. That is a direct contradiction.
Not from Tim though. 9:45 am is from DREMT. Still no “Tim directly contradicted Ball4” is correctly quoted in context by DREMT.
This was the discussion, Ball4:
DREMT: So, yes, your argument is that the moon’s movement is composed of two motions. What would you say to someone that argued that from an accelerated frame of reference, the moon’s movement was composed of only one motion?
TIM F: I would say that their description — like your description — fails for elliptical orbits.
Great to see you wriggling.
No wriggling out necessary, as I already pointed out, still no “Tim directly contradicted Ball4” is correctly quoted in context by DREMT since DREMT & I were discussing BOS which is in a circular orbit then DREMT switches stories to “the moon’s movement”. DREMT again can’t keep DREMT stories straight.
Better to keep DREMT stories straighter by DREMT getting a decent grasp on the fundamentals of relativity.
So you think it’s fine to say the ball on a string’s movement is composed of one motion (“orbiting”) wrt an accelerated frame, but not the moon’s. Is that what you’re saying, Ball4?
“not the moon’s.”
To help keep DREMT stories straight, which moon? MOTR, MOTL, BOS analogy all in circular orbits, or our physical Moon in an elliptical orbit of the Earth? Even that clarification might have left out some story specifics.
Our physical moon in an elliptical orbit around Earth.
Then, again, for like the 3rd or 4th or more times, there is no “direct contradiction” (DREMT term) in DREMT’s out of context quote of Tim writing “fails for elliptical orbits”. DREMT should study up on the field of relatively to explain why.
OK, well, if there’s no contradiction, I’ll assume you agree with Tim that for our moon, a choice of reference frame makes no difference as to how many motions its movement is composed of. Or, to put it another way, I’ll take it you agree that the moon issue is not resolved by reference frames.
All motion is relative so choice of reference frame does matter for observing and counting kinetic motions as Tim also points out.
DREMT just needs to further study up on field of relativity to do so correctly.
The implication was clear from the exchange between Tim and I, Ball4. If using an accelerated frame rather than an inertial one makes no difference to how many motions the moon’s movement is composed of, as Tim claimed, then reference frames do not resolve the moon issue, according to Tim.
Again, for nth time, those are DREMT’s 12:11 pm words, not Tim’s. Using an accelerated frame rather than an inertial one does make a difference if the accelerated frame motion is not accounted for, which is Tim’s 8:43 am claim in his words verbatim:
“there are many ways mathematically to describe some particular one motion”. You might describe it as a combination of x and y velocities. You might describe it as combination of translations and rotations.”
All motion is relative. DREMT just needs to further study up on field of relativity.
Keep wriggling, clown.
The Moon’s exhibits at least two motions, even if you try to claim it is not rotating, which is false.
It is orbiting and that orbits is exhibiting precession.
bob’s a thousand miles away from the point, as usual.
bob 9:14 am is proven correct by proper choice of reference frame, DREMT, since, as Ive told you many times before, in the inertial frame our Moon rotates about its own axis on r and orbits Earth on R. Two very different inertial angular velocities. Two inertial lunar motions in that frame.
Yawn.
DREMT goes sleepy sleepy instead of trying for a rebuttal.
Rebutted a thousand times before.
… and all attempted DREMT rebuttals were subsequently shown to fail.
Incorrect, as recently settled.
Debating lunar spin is a ridiculous waste of terabytes.
Are you lunar spin deniers that desperate for something to do? Who even cares enough about lunar spin to contest it?
Get a life, lol.
Who even cares enough about lunar spin to defend it? Is what you could have also asked.
John W’s bigotry is on display again.
John W, the funny thing is it doesn’t matter. It doesn’t matter if people believe Moon spins. It affects nothing. So keep believing in nonsense, if you want.
Just don’t try to tell us it’s “science”. Beliefs ain’t science.
If you believe Moon spins, but don’t have a viable model of “orbiting without spin”, then you’ve got NOTHING. And are just spewing crap, like Bindi.
John W
” Debating lunar spin… ”
We are not debating lunar spin.
We are debating about century old science performed by hundreds of scientists versus the absurd, egomaniacal ‘opinions’ of a few denying Pesudoskeptics.
Bindi, it’s not much of a debate. We present science and reality, and you present your invalid opinions. You have NOTHING. You keep referring to “century old science performed by hundreds of scientists”, but you can’t even provide a viable model of “orbiting without spin”.
Didn’t any of your ancient astrologers know what “orbiting without spin” looked like?
Bindidon, you don’t even understand what the debate is about. You seem to think that because extremely accurate measurements of the moon’s movement have been made over centuries, that the moon must be known to be spinning. However, none of those measurements help to answer the question of whether the moon’s movement is composed of one, or two motions. I don’t disparage or denigrate the work of these people at all. I just point out that it doesn’t settle the issue. If you understood what the issue was, you would get that. Any time I try to explain it to you, you just fly off the handle and say it’s beneath you to discuss it! To which I’d say fine, stop discussing it then…but you won’t ever stop bringing it up!
Nobody likes my simple experiment. Place a floating object onto a cup or bowl of water. Hold that in front of you and start rotating. Do not spin too fast or you will get dizzy (some here already are dizzy). Now observe the object. Does is stay facing you, or does it do something else? Report your results.
Tim S, you clearly have no clue what this issue is about.
If you want to support the lunar spin nonsense, provide a viable model of “orbiting without spin”. We’ve got such a model. Your cult has NOTHING.
Clint R,
Your lack of self-awareness is truly something to behold. You’ve managed to convince yourself that you’re some kind of significant scientific authority here.
Your belief in the superiority of your ideas is so inflated that you resort to attacking others, even when they are being polite. This behavior just reflects more on your own insecurity and lack of class than on anything else.
Or you are just tro+lling. It’s truly gross either way.
John W, why are you stalking me with insults and false accusations? Do you hate the reality and science I bring?
If you were a responsible adult who wanted to learn science, I’d be happy to help. But, you obviously have no interest….
The Center of the Universe
https://www.youtube.com/watch?v=Z0qx_1xMW7Y
Dennis: “I am not Secular”
But he loves fountain pens.??
So goggled:
“Secular things are not religious. Anything not affiliated with a church or faith can be called secular. Non-religious people can be called atheists or agnostics, but to describe things, activities, or attitudes that have nothing to do with religion, you can use the word secular.”
–Can Christians be secular?
Secular means not participating in religion, or not involving religion. So a person who accepts the divinity of Jesus, but doesn’t go to church or pay much attention to religious doctrine , could be called a secular Christian. They believe in Christ (Christian) but don’t participate in religion (secular).–
Hmm, it seems to me, space is not secular, yet.
Solar wind
speed: 293.0 km/sec
density: 2.06 protons/cm3
https://www.spaceweather.com/
Daily Sun: 22 Jul 24
Sunspot number: 200
The Radio Sun
10.7 cm flux: 198 sfu
Thermosphere Climate Index
today: 23.17×10^10 W Warm
Oulu Neutron Counts
Percentages of the Space Age average:
today: -2.2% Low
12 numbered spots. I see one coming from farside. And 3 leaving within a day.
Solar wind
speed: 298.9 km/sec
density: 3.38 protons/cm3
Daily Sun: 23 Jul 24
Sunspot number: 173
The Radio Sun
10.7 cm flux: 185 sfu
Thermosphere Climate Index
today: 23.11×10^10 W Warm
Oulu Neutron Counts
Percentages of the Space Age average:
today: -2.3% Low
10 numbered sunspots.
–Highlights of Solar and Geomagnetic Activity
15 – 21 July 2024
Solar activity was at moderate to high levels. High levels were
observed on 16 and 17 Jul due to an X1.9/1B flare at 16/1326 UTC
from Region 3738 (S09, L=213, class/area Fkc/1140 on 14 Jul) and an
M5.0/2b flare at 17/0639 UTC from Region 3743 (S08, L=162,
class/area Dai/220 on 13 Jul). The X1 flare had accompanying Type II
(398 km/s) and Type IV radio bursts, a Castelli U radio signature,
as well as a CME of the W limb that was not Earth-directed. Region
3753 (N12, L=170, class/area Dai/100 on 16 Jul) and 3744 (N16,
L=144, class/area Dso/180 on 12 Jul) produced a pair of M1 flares at
16/2124 UTC and 16/2206 UTC. Two associated partial halo CMEs were
observed after 16/2312 UTC. Modelling of the pair indicated an
arrival beginning at midday on 20 Jul followed by a secondary
arrival early on 21 Jul. At 21/1610 UTC, a disappearing solar
filament was observed in the vicinity of Region 3757 (N18, L=061,
class/area Hax/060 on 17 Jul). An associated halo CME was observed
at 21/1648 UTC. Initial analysis indicated an arrival on 24 Jul.
Further analysis is in progress at the time of this writing.
No proton events were observed at geosynchronous orbit.
The greater than 2 MeV electron flux at geosynchronous orbit was at
normal to moderate levels.
Geomagnetic field activity ranged from quiet to unsettled levels.
Weak transient activity was evident on 15-16 Jul and possibly 19-20
Jul, however weak solar wind speeds in the 300-400 km/s range as
well as a predominant northward Bz component led to only isolated
unsettled periods on 15-16 Jul. Quiet conditions prevailed through
21 Jul.
Forecast of Solar and Geomagnetic Activity
22 July – 17 August 2024
Solar activity is expected to continue at moderate levels with
M-class flares (R1-R2, Minor-Moderate) levels likely and a slight
chance for X-class (R3, Strong) through 27 Jul as Regions 3751 (S08,
L=092, class/area Ekc/410 on 19 Jul) and 3761 (S10, L=081,
class/area Dki/300 on 21 Jul) rotate across the visible disk. Low to
moderate levels are likely from 28 Jul through 17 Aug.
There is a slight chance for a greater than 10 MeV proton event
exceeding the S1 (Minor) levels through 29 Jul due to the flare
potential of Regions 3751 and 3761.
The greater than 2 MeV electron flux at geosynchronous orbit is
expected to continue at normal to moderate levels.
Geomagnetic field activity is expected to be at mostly quiet levels
through 17 Aug barring any inbound CME activity. A potential for
G1-G2 (Minor-Moderate) levels is likely for 24 Jul due to the
arrival of the 21 Jul CME, however analysis is still in progress.
—
https://www.swpc.noaa.gov/products/weekly-highlights-and-27-day-forecast
Solar wind
speed: 330.7 km/sec
density: 3.49 protons/cm3
Daily Sun: 23 Jul 24
Sunspot number: 167
The Radio Sun
10.7 cm flux: 185 sfu
Thermosphere Climate Index
today: 23.21×10^10 W Warm
Oulu Neutron Counts
Percentages of the Space Age average:
today: -2.3% Low
No picture, yet
Global Greening Becomes so Obvious That Climate Alarmists Start Arguing We Need to Save the Deserts!
https://wattsupwiththat.com/2024/07/21/global-greening-becomes-so-obvious-that-climate-alarmists-start-arguing-we-need-to-save-the-deserts/
“The world is greening at an astonishing and rapidly growing rate and deserts are shrinking almost everywhere you look. All due, it seems, to a natural rise in carbon plant food dioxide, not forgetting the small annual 4% portion contributed by humans burning hydrocarbons.”
Well Mars has a lot deserts, as I said the cargo cult just wants to live on Mars.
No shortage of desert area. And no hot or cold temperatures.
That’s what you get for frequenting WUWT. In reality, the Sahara’s growth is only being halted by a tree-planting effort spanning the width of Africa.
Offshore wind whale deaths indicated by statistical analysis
https://wattsupwiththat.com/2024/07/22/offshore-wind-whale-deaths-indicated-by-statistical-analysis/
“I have repeatedly pointed out that the overall Humpback Whale death rate doubled when sonar blasting began. Gerasoulis finds that in the region where the surveying was most active, the death rate jumped to an astonishing five times greater.”
…
“Unfortunately, the incredibly loud pile driving that is now starting at the offshore wind construction sites is even worse than the sonar blasting.”
Is it worst than fracking?
It seems when operating the giant wind mills would problem.
Suppose you living under a lake would you want wind mills on top of the lake. {or say you were living on Mars}.
A darkness and dankness:
**
Biden: I am not mentally capable of making important decisions.I think Kamala Harris should be president.
**
Indeed, Joe Biden put his nation’s well-being before his personal ego. The Republicans could sure learn from this experience.
No chance they will.
One could hope.
It’s not good to have politicians learning from other politicians.
It makes perfect sense. They are using sound logic. In order to defend democracy, it is necessary to suspend democracy. They could have sorted this out in the primary process, but there is a better way for the party to bypass the voters and take charge. What do a bunch of silly voters know anyway?
I gets worse. This is nonpartisan criticism that cuts both ways. At her first press appearance today, rather than play straight and dispel the accusation that she is not serious, she spent more time laughing with that really creepy cackle, than making substantive comments. This is her prime criticism and she failed the test.
” … and she failed the test. ”
Really?
If there is one person who failed the test for the umpteenth time, then that’s the Trumping boy, who found nothing better than to say about her:
” She is crazy, she is a nut. ”
I prefer the laughing lady because, despite her reticence as Vice President, she has had much more meaningful things to say over the years than a sex-obsessed, lying, convicted criminal who, despite court findings, still claims today that the 2020 election was rigged.
More than one thing can be true at the same time. For the record, Gavin Newsom vs Nikki Haley would be an interesting race. That did not happen. Even now, someone with executive experience such as one of the many Democrat Governors could still be selected, and win easily over Trump.
Tim S
Thank you for the convenient reply, now explaining better what I feel you actually wanted to say.
As you imagine, I lack any knowledge about the US.
*
You wrote above:
” Even now, someone with executive experience such as one of the many Democrat Governors could still be selected, and win easily over Trump. ”
This is very certainly true.
But… from this site
https://ballotpedia.org/Democratic_National_Convention,_2024
I read
” As of July 22, 2024, the following candidates have been mentioned in media reports as possible presidential candidates. Also included is whether the individual said he or she does not plan on seeking the presidential nomination or whether he or she endorsed another candidate for the nomination: ”
Below this paragraph you will find the list of all these people.
Apart from outsider Manchin, who declined due to his age (76), you will find no less than 14 candidates – including even Newsom, Buttigieg, Whitmer and Shapiro – who ALL endorsed Harris.
This collective decision is certainly not, in my opinion, due to the fact that these 14 people suddenly feel unable to challenge her.
Maybe we don’t know enough about how much some Vices may be involved in their respecticve President’s daily activity.
The simple answer is that 6 months ago there would have been a primary process and the people would have selected who they want to run. Most of those Democrat candidates would win easily against Trump. The current process is the classic smoke filled room, except without the smoke or the room because we have the internet.
My opinion is that the debate performance convinced the party leaders that Biden would lose for certain. Now they have nothing further to lose with this scheme which avoids a convention floor-fight. The image is unity, but Kamala Harris is probably the worst possible candidate.
Keep in mind that the Electoral College process produces statewide winners. Most states are either very conservative or very liberal. The election will be decided by fewer than 100,000 “swing-voters” in 4 or 5 states with a competitive mix of voters. National polling numbers are meaningless. The big states with large cities have very large populations and lean heavily to the Democrats.
A further comment is needed. To the people who say we should have a national popular election because the states have too much power, I say that fact is already backed into the Electoral College. California gets 54 votes, Texas 40, Florida 30, and New York 28. Kansas gets 6, Alabama 9, Indiana 11, etc. Conservatives have more numbers of states, and Liberals have the larger population states.
Tim S
Thank you for your precise information.
Who will still be here for cycle 26
https://youtu.be/kXlviOetu0g
“Despite the gearing up of Cycle 25 to its peak, it looks like Cycle 26 just can’t wait to tag in. The rumblings of the onset of the next 11-year-long solar cycle came in the form of “starquakes,” sound waves ricocheting through the interior of the sun detected by researchers from the University of Birmingham.”
https://www.space.com/sun-next-solar-cycle-beginning
“It’s exciting to see the first hint that the pattern will repeat again in Cycle 26, which is due to start in about six years,” team leader Rachel Howe from the University of Birmingham said in a statement.”
Ok. So, who going to be here in 6 years?
Solar wind
speed: 318.2 km/sec
density: 5.32 protons/cm3
Daily Sun: 24 Jul 24
Sunspot number: 167
The Radio Sun
10.7 cm flux: 176 sfu
Thermosphere Climate Index
today: 23.21×10^10 W Warm
Oulu Neutron Counts
Percentages of the Space Age average:
today: -2.3% Low
“THE VENUS CLOUD DISCONTINUITY: A towering wall of acid clouds is racing through the atmosphere of Venus. Luigi Morrone photographed it from Agerola, Italy, on July 17th…
“It’s called the Venus Cloud Discontinuity,” says Morrone, who is part of an international network of amateur astronomers who have been tracking the massive structure. “This is the first time I’ve seen it since 2022.”
The Venus Cloud Discontinuity is a relatively new discovery, photographed by Japan’s Venus orbiter Akatsuki in 2016 and first spotted by JAXA scientist Javier Peralta. The massive structure cuts vertically across Venus’s equator, stretching almost 5000 miles from end to end, and circles the planet faster than 200 mph, making one lap every ~5 Earth days. “…
https://www.spaceweather.com/
New picture: 10 numbered spots. One numbered spot, leaving within a day.
Solar wind
speed: 321.0 km/sec
density: 0.97 protons/cm3
Daily Sun: 25 Jul 24
Sunspot number: 160
The Radio Sun
10.7 cm flux: 175 sfu
Thermosphere Climate Index
today: 23.21×10^10 W Warm
Oulu Neutron Counts
Percentages of the Space Age average:
today: -3.5% Low
10 numbered spots
Solar wind
speed: 484.4 km/sec
density: 0.60 protons/cm3
Daily Sun: 26 Jul 24
Sunspot number: 171
“Sunspot AR3762 has a ‘beta-gamma-delta’ magnetic field that harbors energy for X-class solar flares.” -It’s facing Earth.
The Radio Sun
10.7 cm flux: 167 sfu
Thermosphere Climate Index
today: 23.16×10^10 W Warm
Oulu Neutron Counts
Percentages of the Space Age average:
today: -3.4% Low
11 numbered spots. Just at edge [northern hemisphere] it looks like large spot coming from farside, and will be numbered. One numbered spot leaving and another appears to fading [before it gets to farside].
Solar wind
speed: 447.1 km/sec
density: 0.08 protons/cm3
Daily Sun: 27 Jul 24
Sunspot number: 181
The Radio Sun
10.7 cm flux: 176 sfu
Thermosphere Climate Index
today: 23.02×10^10 W Warm
Oulu Neutron Counts
Percentages of the Space Age average:
today: -3.4% Low
11 numbered spots
What is the average temp in C used as reference in the graphs?
Depending upon the time of year, it’s around -10 deg. C.
https://www.drroyspencer.com/2016/03/uah-v6-lt-global-temperatures-with-annual-cycle/
So about 25C lower than the average surface temperature.
In the grid data of the four atmospheric layers observed by Roy Spencer and his team
https://www.nsstc.uah.edu/data/msu/v6.0/
you see for each layer a 12 month climatology file (currently based on the averages for the reference period 1991-2020) out of which the anomalies were generated.
For LT the file is
https://www.nsstc.uah.edu/data/msu/v6.0/tlt/tltmonacg_6.0
The average of all months for this period gives ~ 264.09 K i.e. -9.06 C.
When reconstructing absolute temperatures back out of anomalies and climatology, the average for Jul 2023 till Jun 2024 gives ~ 264.96 K i.e. -8.19 C.
A 3-year running average comparison between SC24 and SC25:
https://tinyurl.com/SC24vs25-3-year
Remember that a 3-year running average lags the present by 18 months, yet SC25 has already passed SC24.
Thanks, sounds good.
I anticipated the July SSN a bit with 190… the EISN’s average is now at 195.
https://drive.google.com/file/d/1c5UEqEHMt7Qegj0r8A1gf0NBtZzw8wJ4/view
Until recently I showed SC24/23 till their end, but this distorted the comparison.
By stopping all three at SC25’s end, we can better see how they behave at the same time; however, this newer view hides the fact that SC23 and SC24 both had a second peak one year later.
Don’t forget that the 13-month average is designed for people who have no interest in climate, rather communications interference or just the sun itself. Anyone who claims that the solar cycle significantly affects climate should be interested in a much longer average. Hence the running 3-year average. If there really is a climate effect, I doubt individual peaks make a difference. Getting rid of those peaks was the point.
I agree, this is obvious, I made such long range comparisons years ago:
https://drive.google.com/file/d/1d70-k06I_jfziFHvLLraXl-mhUvJbUAB/view
But I wish to present for the recent cycles the same kind of info as that provided each month by SILSO.