
 Home/Blog
In a recent post I used our new Urban Heat Island (UHI) warming estimates at individual U.S. GHCN stations having at least 120 years of data to demonstrate that the homogenized (adjusted) GHCN data still contain substantial UHI effects. Therefore, spurious warming from UHI effects is inflating reported U.S. warming trends.
The data plots I presented had considerable scatter, though, leading to concerns that there is large uncertainty in my quantitative estimates of how much UHI warming remains in the GHCN data. So, I updated that post to include additional statistics of the regressions.
A Simple Example: High Correlation, But Low Confidence In the Regression Slope
The following plot of a small amount of data I created shows what looks like a pretty strong linear relationship between 2 variables, with a regression explained variance of 82% (correlation coefficient of 0.91).
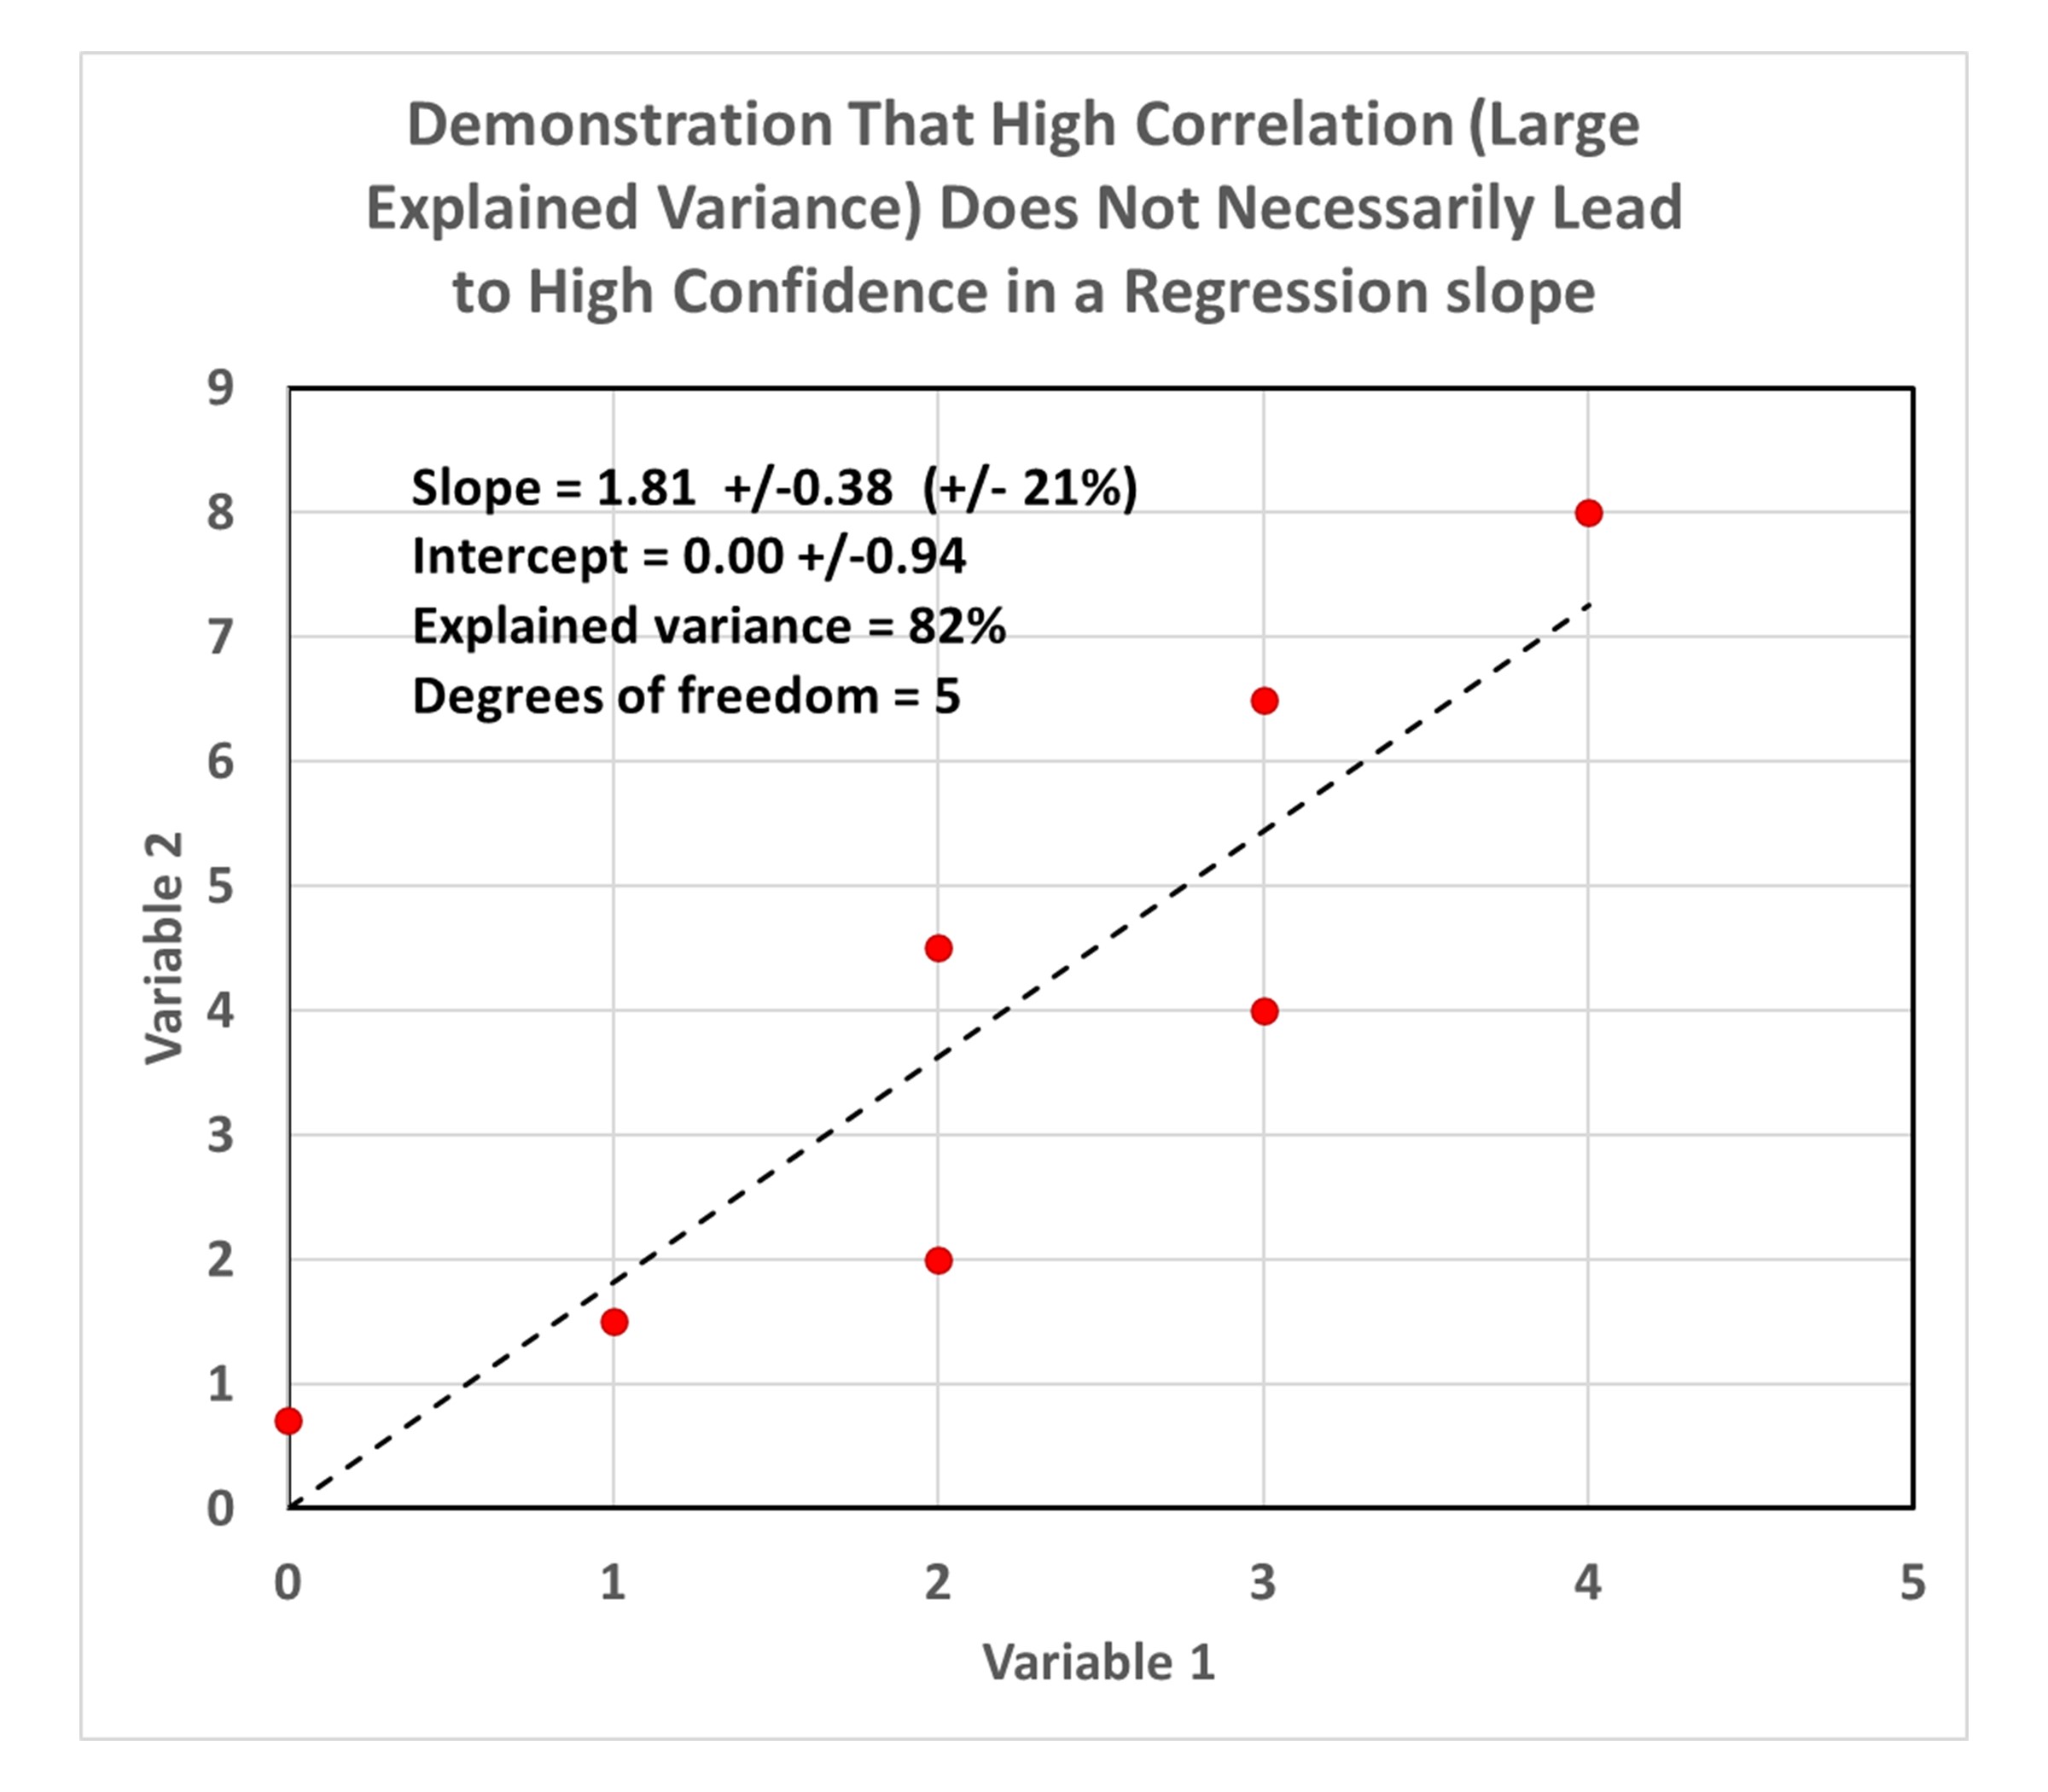
But because there are so few data points, there is large statistical uncertainty in the resulting diagnosed regression slope (21% uncertainty), as well as the regression intercept (which is diagnosed as 0.0, but with an uncertainty of +/- 0.94).
Now let’s look at the third data plot from my previous blog post, which demonstrated that there is UHI warming in not only the raw GHCN data, but in the homogenized data as well:
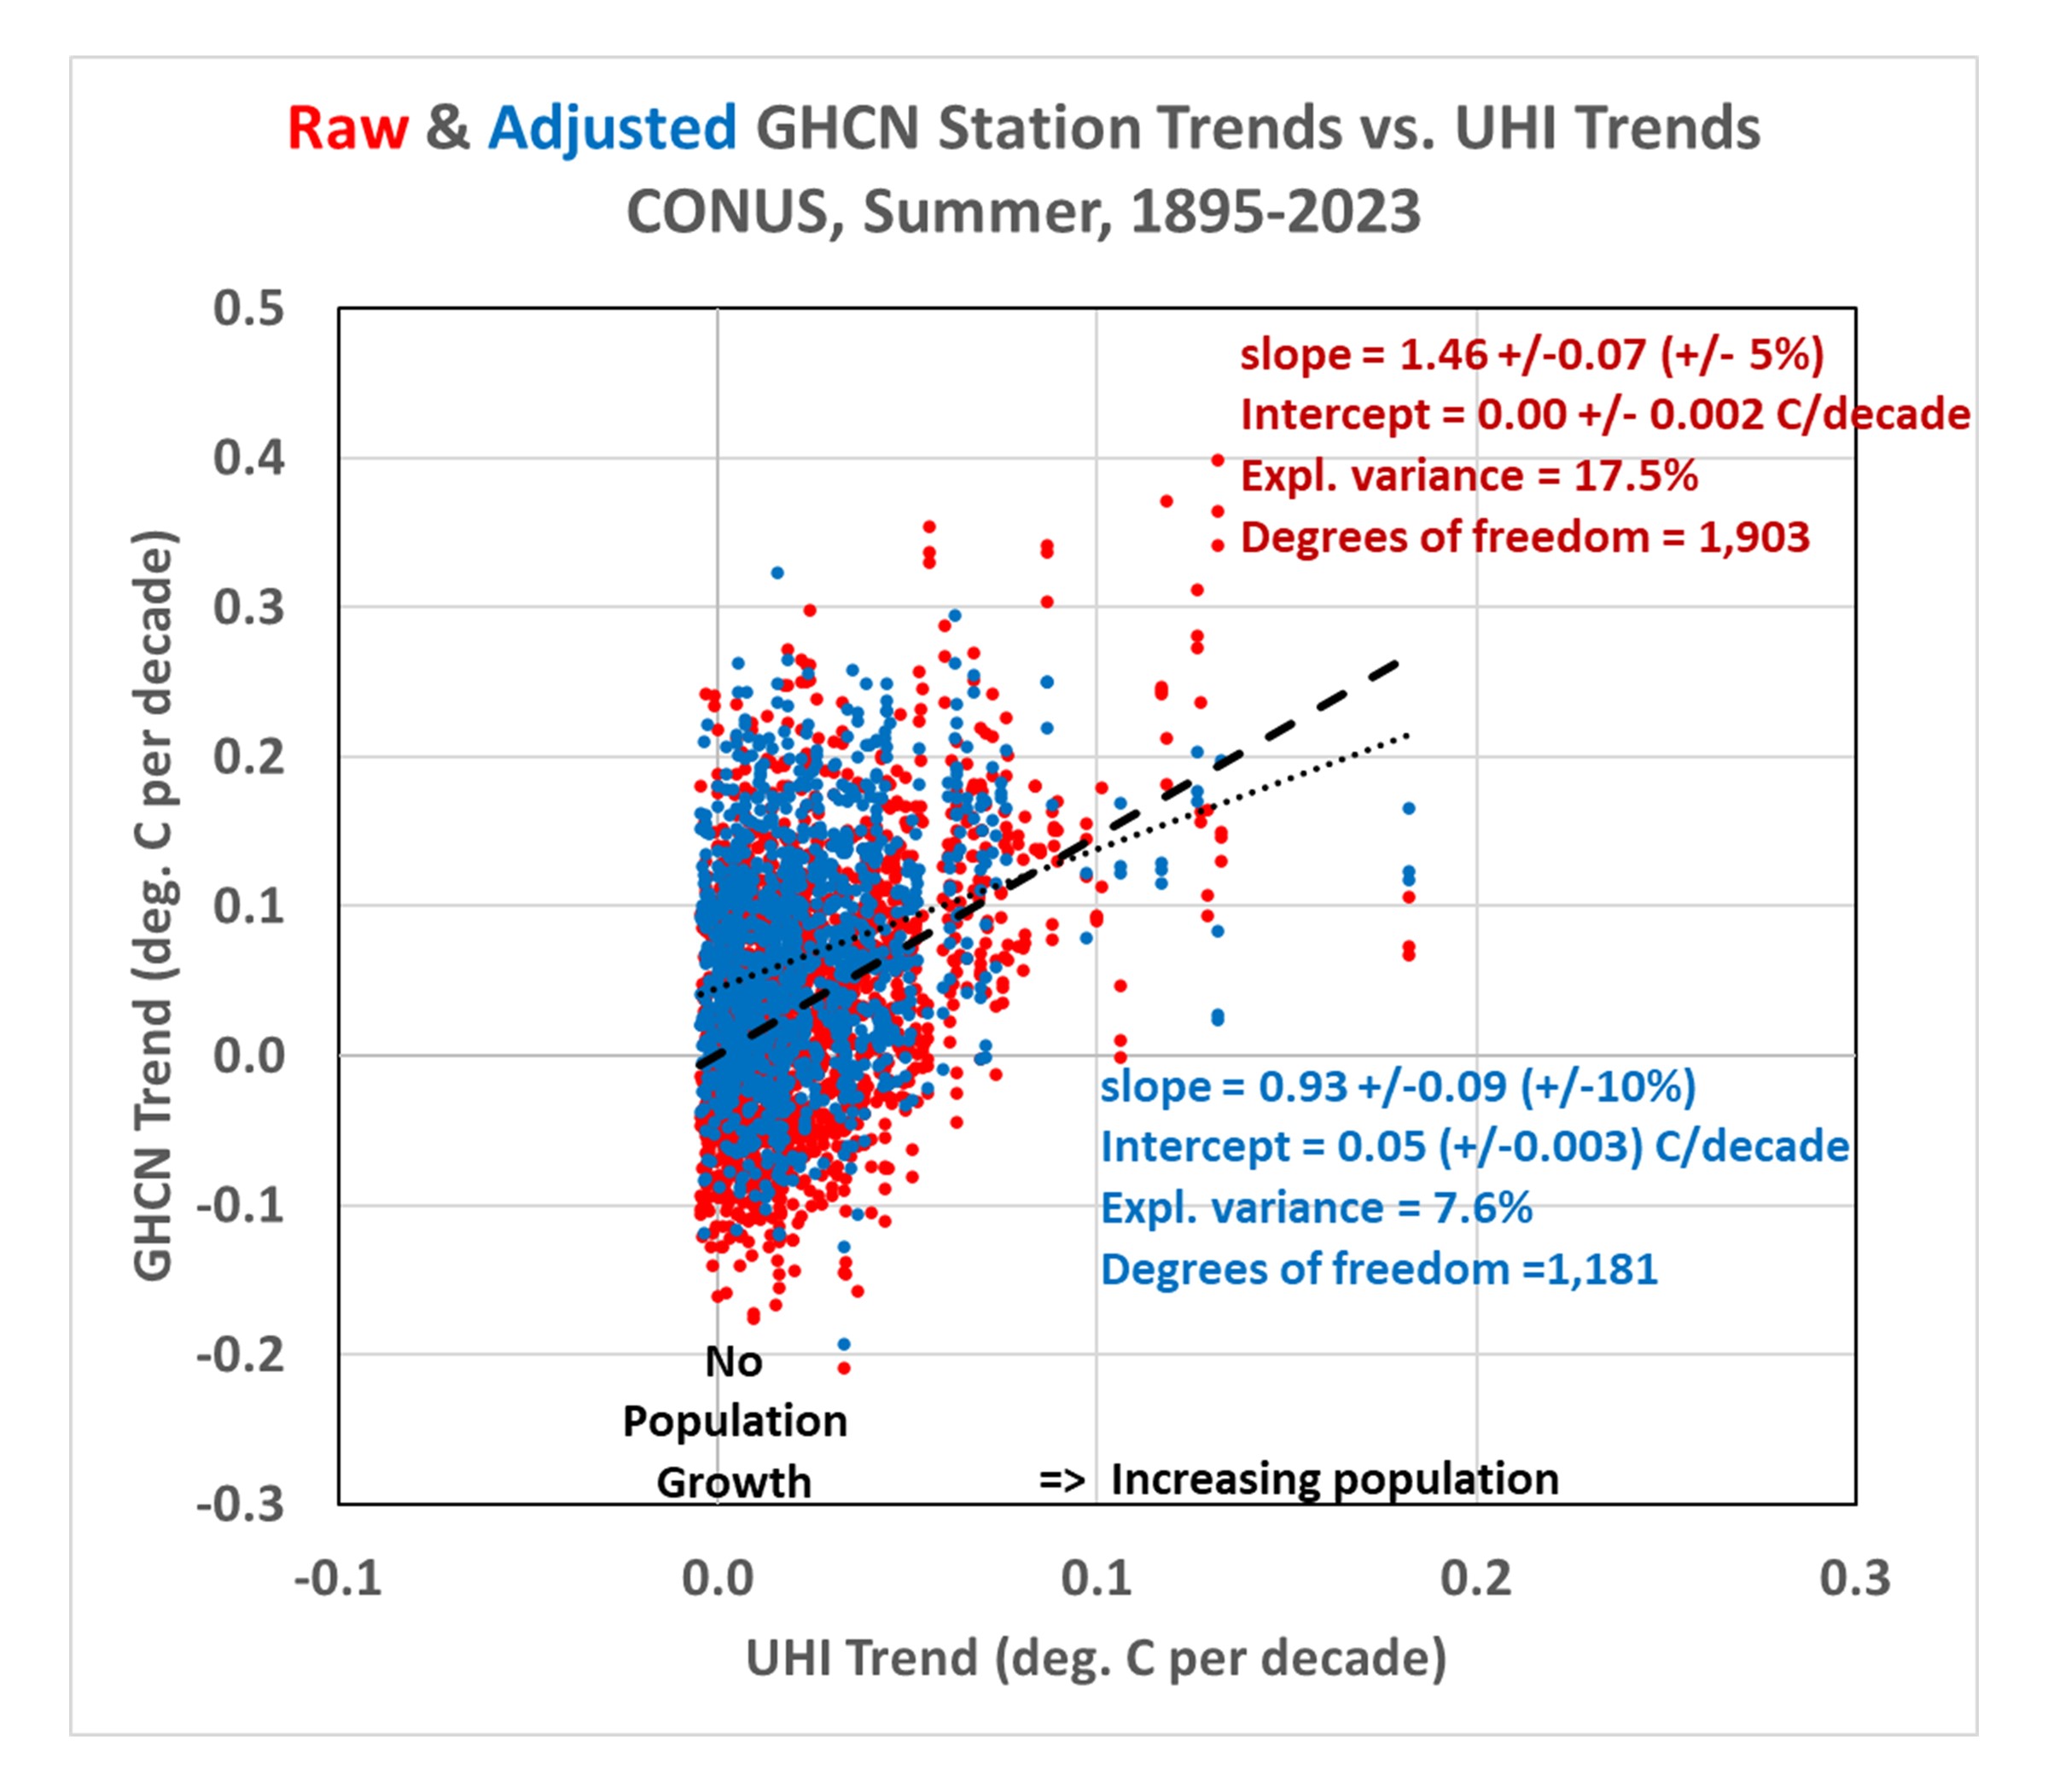
Importantly, even though the regression explained variances are rather low (17.5% for the raw data, 7.6% for the adjusted data), the confidence in the regression slopes is quite high (+/-5% for the raw GHCN regressions, and +/-10% for the homogenized GHCN regressions). Confidence is also high in the regression intercepts (+/-0.002 C/decade for the raw GHCN data, +/-0.003 C/decade for the homogenized GHCN data).
Compare these to the first plot above containing very few data points, which had a very high explained variance (82%) but a rather uncertain regression slope (+/- 21%).
The points I was making in my previous blog post depended upon both the regression slopes and the regression intercepts. The positive slopes demonstrated that the greater the population growth at GHCN stations, the greater the warming trend… not only in the raw data, but in the homogenized data as well. The regression intercepts of zero indicated that the data, taken as a whole, suggested zero warming trend (1895-2023) if the stations had not experienced population growth.
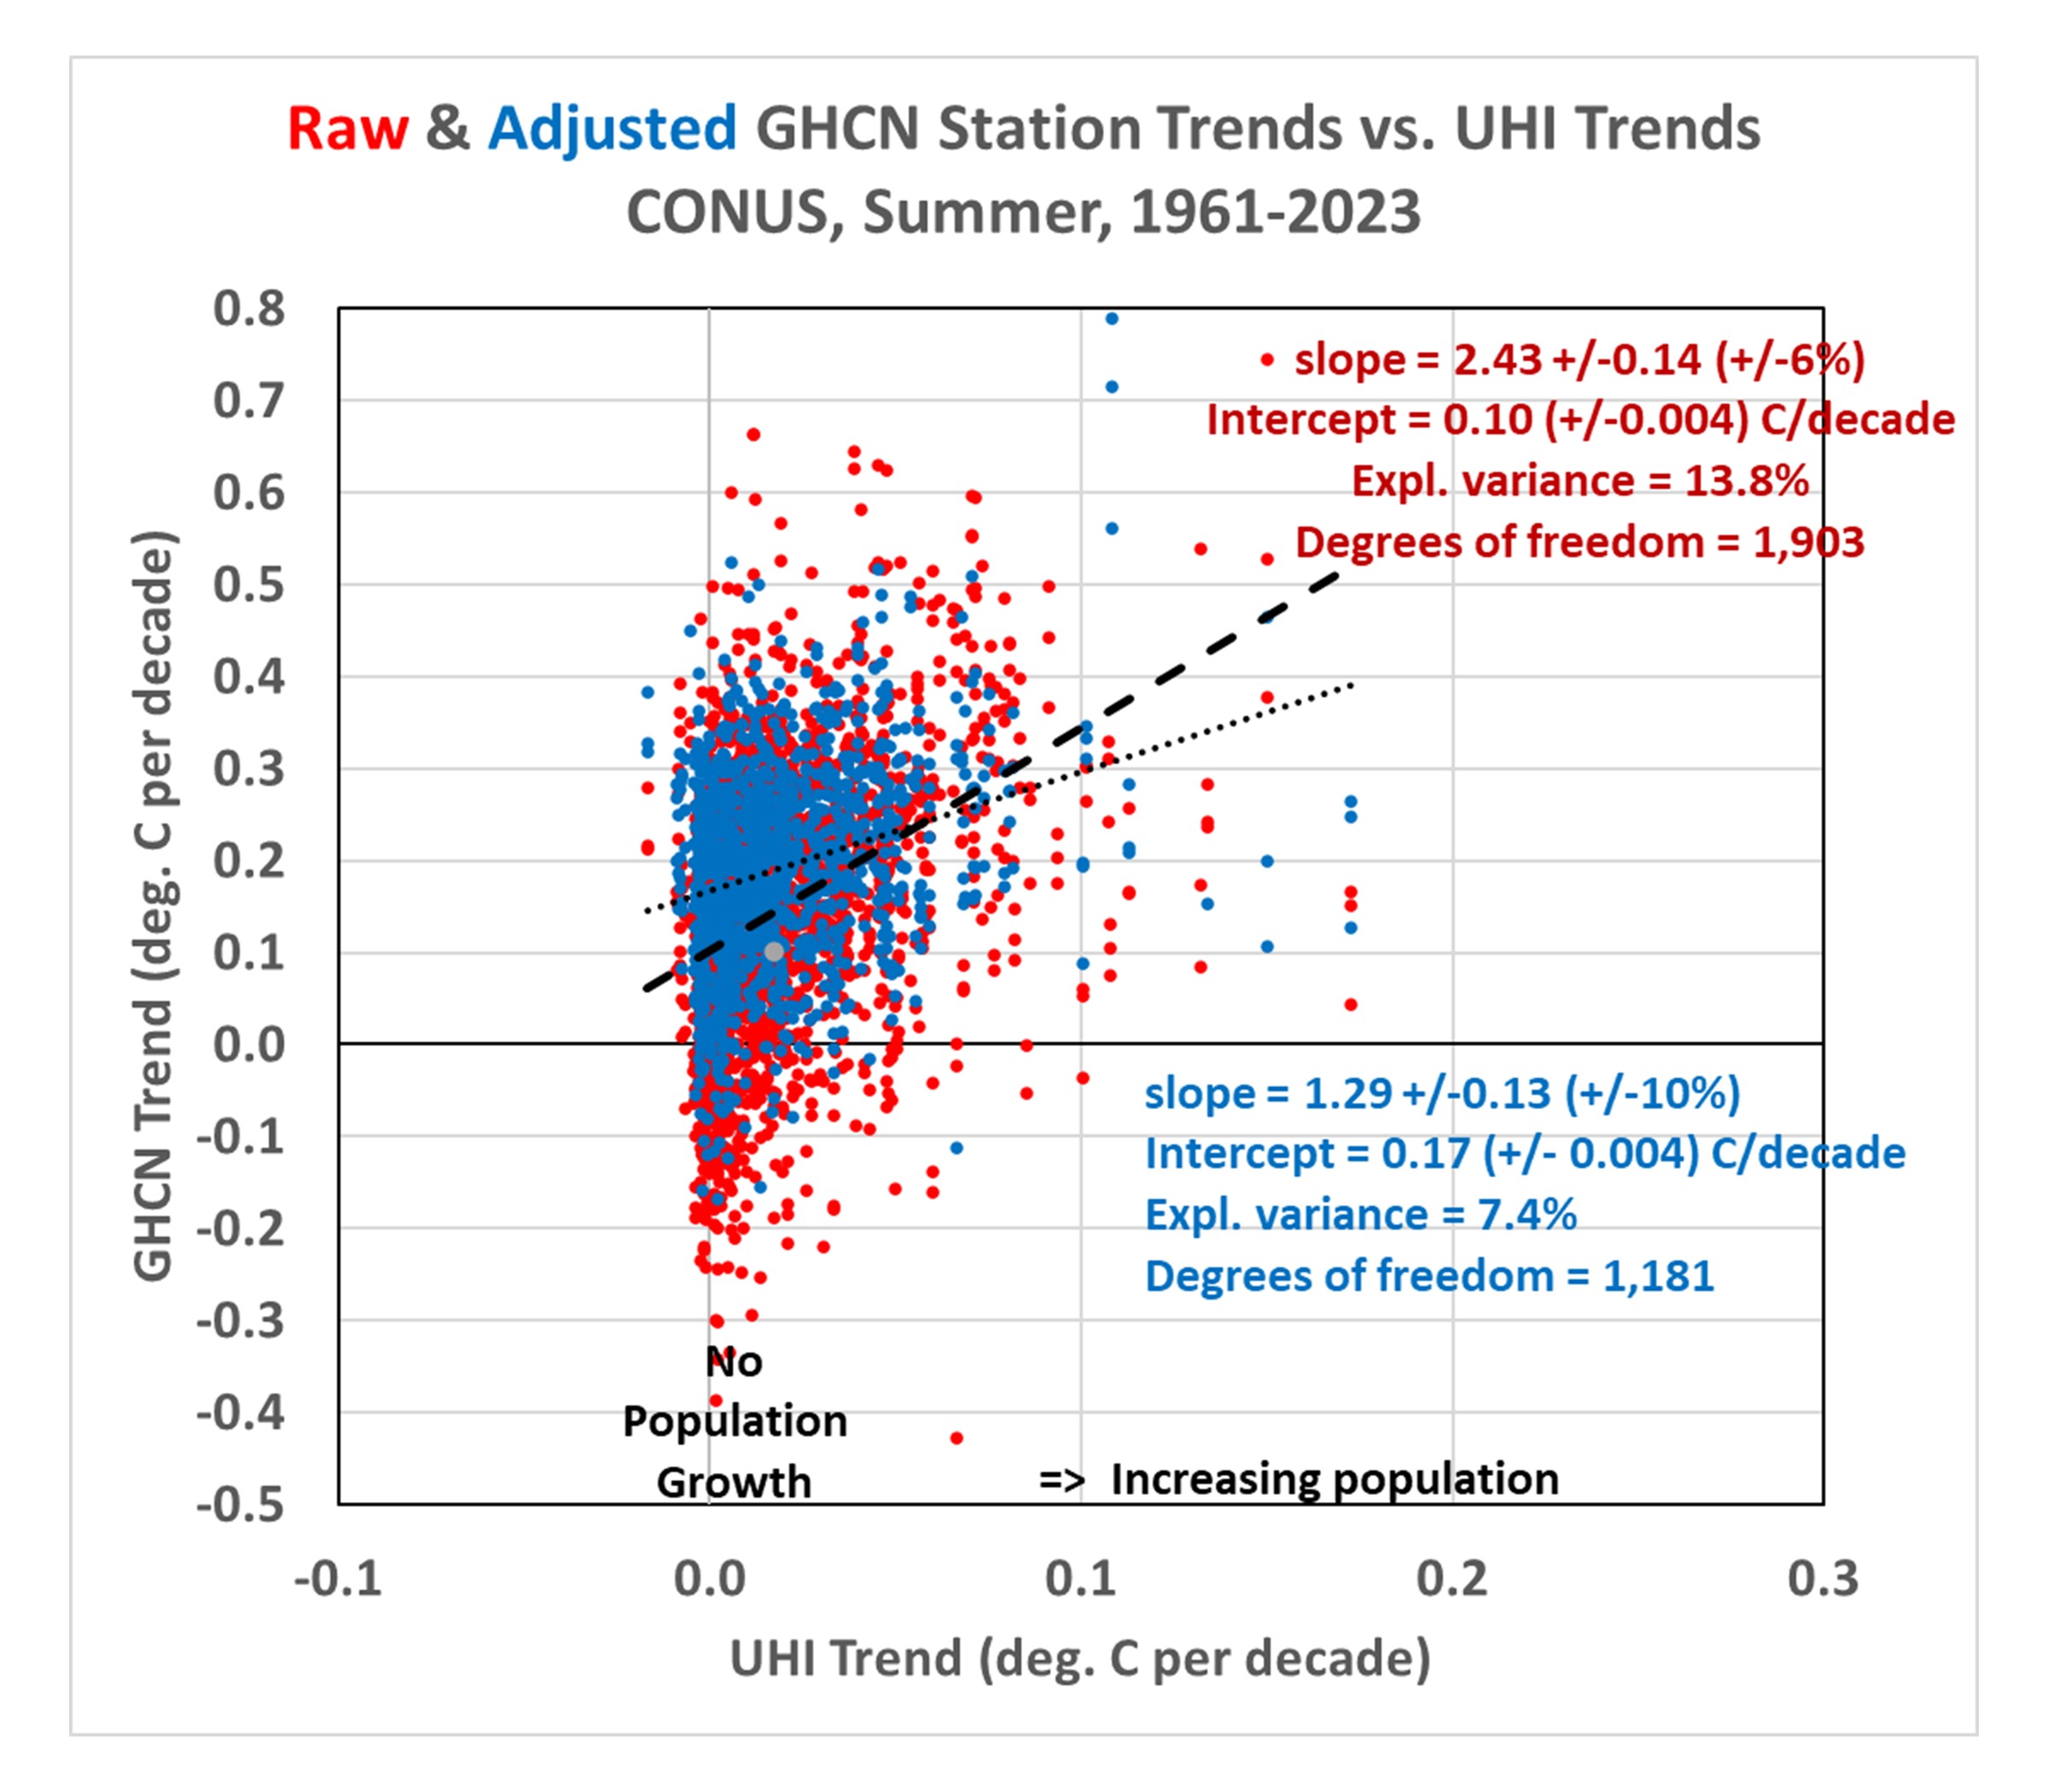
But it must be emphasized that these are all-station averages for the U.S., not area averages. It is “possible” that there has (by chance) actually been more climate warming at the locations where there has been more population growth. So it would be premature to claim there has been no warming trend in the U.S. after taking into account spurious UHI warming effects. I also showed that there has been warming if we look at more recent data (1961-2023).
But the main point of this post is to demonstrate that low correlations between two dataset variables do not necessarily mean low confidence in regression slopes (and intercepts). The confidence intervals also depend upon how much data are contained in the dataset.


Could there possibly be a UHI in the Antarctic? Nature recently brought a story over strong warming there..
“A fast-warming region of Antarctica is getting greener with shocking speed”
https://www.nature.com/articles/d41586-024-03219-2
As you will know the South Pole is barely warming at all and that is a thing. So there are different strategies to cope with it. One is quote a single location with “extreme warming”.
This specific place around the small Ardley Island is interesting because it is so denesly populated. There is the “Great Wall Station”, “Villa Las Estrellas” (a permanent settlement wich ~150 residents plus airport) or the Artigas Station, all in walking distance.
If you introduce that many houses and people (including heating) into a remote location, what might be the impact on the local climate?
*** Good question! One of the things we demonstrated is that the largest rate of warming happens at the most rural locations… once you start adding a few people (and associated buildings, pavement, etc.) you get the greatest warming per increase in population. This isn’t a new finding, it was demonstrated by Oke in his original 1973 paper on UHI. So, what you are suggesting is possible. -Roy
e. schaeffer…the notion of Antarctic greening is alarmist propaganda. I knew immediately they were talking about a region on the Antarctic Peninsula which is at a latitude near the southern top of South America.
It appears the apparent warming in the region is not due to global warming but due to warmer oceans currents bringing warming just as ocean current moderate temperatures on the west coast of Europe and North America.
Another bit of propaganda is that glaciers are melting in Antarctica. When that question was put to polar expert, Duncan Wingham, himself an alarmist, he replied that it is far too cold for glaciers to melt in Antarctica.
That about sums it up, it is far too cold on Antarctica, including the peninsula, for warming to e a consideration.
When uber-alarmist, Michael Mann, claimed that Antarctica had warmed the past 50 years, he was liberally mixing warmer regions in the Peninsula with much colder temperatures on the mainland. One of the stations he used was under 4 feet of snow at the time.
Climate alarmists are good at science fiction.
Yes, the more points the more confidence in the slopes. I keep having to argue this on WUWT, with people who have convinced themselves that the more data the less certainty there is in the regressions line.
One question though, is whether the stated uncertainties are assuming independence of the data points. If two stations are close together they will have similar temperature and population changes. This seems likely when you look at the sparser data on the right, where there a number of stations with similar UHI and temperature deviations.
Roy…the lack of response to your articles is the Denial of Services being experienced by many of us. We cannot log on to your site with normal browsers like Firefox, Opera, or Chrome, receiving a ‘403 Forbidden’ error.
The problem is likely due to third party mediators like Cloudfront, who are hired by site owners to monitor their traffic and filter out what they deem to be undesirables. In fact, Cloudfront can ban certain IP addresses. They seriously messed up recently when they shut down a good part of the Net with a faulty update.
Those using a VPN seem to get through and anyone using a configurable browser like the free Tor browser can get through. The latter requires resetting the browser identity.
A work around for some might be to reset their wifi router. I mean a ‘soft’ reset which simply resets the dynamic IP address of the router. Since Cloudfront operates by marking certain IP addresses as dangerous, changing the IP address of the router gets the router address a reprieve.
Robertson
” I mean a soft reset which simply resets the dynamic IP address of the router. ‘
Please stop filling this blog with your usual, incompetent pseudo-information.
1. The dynamic IP address stored in your router is the end of a chain.
Behind this address is the static IP address of your provider’s server responsible for your Internet and eventually VoIP phone connection.
And because those servers communicating with your provider’s server have always access to the entire chain starting with your dynamic IP address, they will have no problem to lock the IP address behind yours.
Even using TOR I have to let the browser switch its current transfer channel because after 5 or 6 posts I get a 403 again.
*
2. You don’t know anything real about CloudFront and polemically discredit this interface.
The origin of the blocking problem is probably due to the arrival of a major firewall update on the server hosting Roy Spencer’s blog, which in turn requests an update of the black/white list specifications.
Roy,
Low correlation accompanied by high confidence in the slope indicates that the model as a whole does not capture most of the factors that affect the dependent variable, and thus has low predictive ability.
IIRC, your original goal was to find a “new method for calculating the multi-station average urban heat island (UHI) effect on air temperature.” This falls short of that goal, no?
*** What you say is true for *individual* stations. We recognize, and I have mentioned, that the method works for the average of the many stations from which the regression coefficients were computed from, but its accuracy for individual stations is unknown. There is no known way to calculate the UHI warming at thousands of individual stations… or at least it would not be easy. Therefore, the method does indeed “calculate the multi-station average urban heat island (UHI) effect on air temperature.” -Roy
Roy,
The method explains 7.6% (adjusted data) of the variability in station data vs UHI effect; in other words it leaves 82.4% of the variability unexplained. Other factors are obviously at play here and left unaccounted for.
Regards.
For over 10 years I had – together with lots of other customers in Europe and Africa – big problems with accessing the server of our common provider.
It turned out that the server had recently been equipped with comprehensive cybersecurity software from the US-Japan firm Trend Micro.
The software allowed only communication with static IP addresses, and therefore all customers who had dynamic IP addresses had to be added to a white list.
” For over 10 years”
should of course read
” Ten years ago “.
Testing.
Monster.
https://i.ibb.co/nC9RW6f/himawari9-ir-meso.gif
The eye of the typhoon is headed between Luzon and Taiwan.
https://i.ibb.co/Rzpps1F/himawari9-ir-23-W-202410291650.gif
test
binny, the blog’s propagandist, and artist in charge of bs, misses the point and fails hacking 101…
“The dynamic IP address stored in your router is the end of a chain.
Behind this address is the static IP address of your providers server responsible for your Internet and eventually VoIP phone connection.
And because those servers communicating with your providers server have always access to the entire chain starting with your dynamic IP address, they will have no problem to lock the IP address behind yours”.
***
If that was the case, all hackers would be out of business since they could be easily localized and arrested. Obviously that is not the case. In order for a site to be localized, the local IP address must be located and that is simply not possible if the sending IP address is hidden behind several other IP addresses.
But that is not what we are talking about here, we are talking about changing a dynamic IP in a local modem, which supplies the local IP address dynamically. It is that address used by outfits like Cloudfront that is used to ID the sender and block him/her, an act which needs to be made illegal. Cloudfront has already caused major havoc on the Net due to a faulty update in their software and now they seem to be illegally blocking many posters on this blog alone.
Cloudfront does not have ‘access’ to the static IP addresses from a provider, only the sending dynamic IP from each local IP. Only governments can demand that static IP of a provider.
Dynamic IPs were provided to local LAN’s so the outfit using those LAN’s could re-assign local IPs as required. That provision is built into most wifi routers and other routers used locally by users.
A local dynamic IP is only a node point in a Local Area Network. The nodes themselves are fixed by the wiring in the building hence are static. However, if an IT professional wants to reassign the identity of that static node he/she can do so using dynamic IP addresses. Otherwise if Jane Doe, located in the building physically by a hardwired node, moved to another static node, all her correspondence within the LAN and outside on the Net, would have to be changed. In other words, her physical position within the building is defined by the building wiring. If she moves, moving her IP with her makes more sense.
The Net is no different. It is a series of nodes on a huge LAN, or WAN (wide area network), where each node is physically defined by a static IP address. There is no way that Cloudfront could detect a change in those static IPs.
—-
“Even using TOR I have to let the browser switch its current transfer channel because after 5 or 6 posts I get a 403 again”.
***
The main problem here is that you don’t know how to use TOR. It is a browser operated by volunteers around the planet. It can hide local IPs by routing them through a myriad of computers in other countries, while erasing the sending IP at each computer.
Ironically, major hackers make use of a system set up for corporations, which do the same thing, and have been used long before TOR. The corporations had set up proxy servers which served to erase the sending IP, replacing it with a meaningless IP. By routing the sending IP through several of these proxy servers, it is impossible to find them.
TOR has options to enhance the hiding of an IP address although that is not why I use it. However, the fact that it can get through when normal Net transports are blocked suggest either hackers at work or legitimate outfits like Cloudfront illegally blocking legitimate users.
I know enough about Cloudfront to realize they have proved incompetent. One of their updates resulted in a large part of the Net being denied service.
Thank you, Gordon !!!
Conclusions:
1). We have written the theoretically exact the planet mean surface temperature equation as a very much reliable theoretical formula:
Tmean = [ Φ (1-a) S (β*N*cp)∕ ⁴ /4σ ]∕ ⁴ (K) (3)
The theoretically calculated planets temperatures (Tmean) are almost identical with the measured by satellites (Tsat.mean).
2). We shall now compare the theoretically calculated Earth’s (without-atmosphere) the average surface temperature (Tmean) with the satellite measured one, the (Tsat), because we are very much interested to estimate the magnitude of the atmospheric greenhouse effect.
Planet……Te……Te.correct….Tmean.Tsat.mean
Mercury….440 K……364 K……..325,83 K..340 K
Earth…255 K……210 K……..287,74 K..288 K
Moon..270,4 K….224 K……..223,35 Κ..220 Κ
Mars.210 K……174 K……..213,11 K..210 K
The planet mean surface temperature New equation is written for planets and moons WITHOUT atmosphere.
When applied to Earth (Without Atmosphere) the New equation calculates Earth’s mean surface temperature as 287,74K, which is very much close to the satellite measured 288K.
3). Thus for the planet Earth the 288 K 255 K = 33 oC difference does not exist in the real world.
There is NO +33C greenhouse enhancement on the Earth’s mean surface temperature.
Both the calculated by equation and the satellite measured Earth’s mean surface temperatures are almost identical:
Tmean.earth = 287,74K = 288 K.
…………………..
Also, there is not any +33C atmospheric greenhouse effect on Earths surface.
Because we have written a Universal Equation which is valid for all planets and moons in solar system.
Earth is a planet, thus when the Equation calculates for Earth’s surface the mean surface temperature Tmean = 287,4 K and the satellite measured the Earth’s average surface temperature
Tsat =288K,
Then there is no room for any significant atmospheric greenhouse effect, much more there is not any +33C atmospheric greenhouse effect on Earth’s surface.
–
Link: https://www.cristos-vournas.com
Does your “Universal Equation” apply to Phobos?
Probably but it definitely applies to the planet Pluto which some nobs have tried to degrade due to some kind of mental disorder.
Thank you, Arkady, for your response.
“Does your “Universal Equation” apply to Phobos?”
–
Yes, the Universal Equation applies to Phobos and to Deimos.
Please visit my site at the page:
–
Link: https://www.cristos-vournas.com/443927831/444426911
Why don’t you show it in the table above?
Arkady, yes, thank you.
“Why dont you show it in the table above?”
I have shown for every planet and moon in separate pages the performed calculationa. The above table is an introduction to the whole.
–
https://www.cristos-vournas.com
Christos Vournas,
Faith: Finding answers for which there are no questions.
Gordon Robertson
There are many Kuiper Belt objects similar to Pluto.
If you decide Pluto is not a planet then there are eight planets.
If you decide that Pluto is a planet, then so are all the hundreds of Kuiper Belt objects.
Choose. Eight planets or hundreds!
“Earths mean surface temperature as 287,74K, which is very much close to the satellite measured 288K.”
Not sure where you get this erroneous idea. Earths Te measured by satellite is NOT 288 K. It is ~ 255 K.
Thank you, Nate, for your response.
“Not sure where you get this erroneous idea. Earths Te measured by satellite is NOT 288 K. It is ~ 255 K.”
–
The Earth’s mean surface temperature 287,74K – it the theoretically calculated by the use of the Tmean equation the average surface temperature.
The 288 K is the Earth’s average surface temperature. When satellites measure the Earth’s surface average surface temperature, they measure exactly that – the average surface temperature.
–
https://www.cristos-vournas.com
And how do they measure it?
If they just measured the IR emitted by the Earth they find it to be much less than expected for a near-blackbody at 288 K.
And this reduction IS due to the reality that there is a GHE. You cannot honestly ignore it.
Nate,
“And how do they measure it?
If they just measured the IR emitted by the Earth they find it to be much less than expected for a near-blackbody at 288 K.”
–
“much less than expected for a near-blackbody at 288 K.”
–
Earth’s surface temperature is not a uniform surface temperature at 288 K. The 288 K is Earth’s average surface temperature.
Of course, if 288 K were Earth’s uniform surface temperature, Earth would had emitted much more IR than Earth emits now.
–
The Stefan-Boltzmann emission law doesn’t apply to planets and moons emitting behavior. The S-B law is for previously warmed, or with inner source of heat bodies, which have a uniform surface temperature.
It doesn’t apply to the planets and moons, because the incident solar energy when hitting the solar lit side, the solar energy doesn’t bear heat, the solar energy interacts with surface’s matter.
The matter has a quality to spontaneously emitting EM energy, and the matter does so by transforming the available in the matter heat into EM outgoing energy.
When matter being hit by the incident EM energy, the matter doesn’t “harry” to absorb the incident EM energy transforming it into heat.
The matter instead reflects some of it as SW outgoing energy, without changing the incident EM frequencies.
Also another portion is transformed into IR outgoing energy. It is a kind of reflection too, but for this portion the incident SW EM frequencies change into the LW EM frequencies.
And only, what amount, during the SW frequencies into LW frequencies transformation, the amount of energy (because the transformation is not perfect) the amount of energy which “is lost as heat”, it is the energy which is conserved as heat.
The conserved as heat energy gets absorbed in inner layers, it is stored, it warms a planet or moon, and it is re-emitted in dark hours.
************
************
There is not Earth’s 288 K blackbody emission curve, because the 288 K number is the average surface temperature.
Earth doesn’t emit according to the blackbody 288 K, because it is not a physical temperature. It doesn’t exist, it is a result of averaging.
–
https://www.cristos-vournas.com
Christos,
“The Stefan-Boltzmann emission law doesnt apply to planets and moons emitting behavior. The S-B law is for previously warmed, or with inner source of heat bodies, which have a uniform surface temperature.”
False. It is a universal law that applies to any surface when including the surface’s emissivity.
“It doesnt apply to the planets and moons, because the incident solar energy when hitting the solar lit side, the solar energy doesnt bear heat, the solar energy interacts with surfaces matter.”
None of this is true. You already already agreed that SW IS converted to heat in the surface before the surface emits IR. I already showed you how heat in the surface DOES conduct to deeper layers warming them.
In the case of the ocean (70% of surface) the SW is energy deposited well below the surface.
We KNOW that the dark side of the Earth cools only 5-10% at night, demonstrating that heat has been stored during the day.
You are shamelessly trying to change established physics while not supporting it with evidence.
Come back only when you can show EVIDENCE to support your bizarre claims.
Thank you, Nate.
“We KNOW that the dark side of the Earth cools only 5-10% at night, demonstrating that heat has been stored during the day.”
–
Of course heat is stored during the day.
–
https://www.cristos-vournas.com
Roy,
Here are 45 Australian sites selected for long temperature data and candidates for for most pristine sites re UHI studies. The Tmin raw daily data are shown, smoothed by the graphical software. The actual peaks and troughs are larger.
If you assume for your UHI work that most or all of the variation you plot above is due to population change, how do you explain the variation in these pristine sites?
Much as I would like your method to work, I cannot suggest how to overcome this variation within and between pristine sites. I have failed to find any systematic cause for the variation. It is not likely to be caused by population change.
The magnitude of pristine trends in deg C/century equivalent overlaps another set of stations chosen to be urban and I cannot distinguish between them using my methods.
Geoff S
https://www.geoffstuff.com/pristtmin.jpg
Geoff,
Roy is just showing that by flooding the graph with data points, you can increase confidence even though your explained variances go down the toilet.
In the immortal words of W.C. Fields ‘If you can’t dazzle them with brilliance, baffle them with bullshit.’
skeptikal,
No, that is not what Roy is telling us.
Roy this is telling us that it is possible, even when there is weak correlation between the two variables, to have confidence in the slope or direction of the correlation.
This distinction allows us to use the slope confidently to understand the direction and relative strength of the effect of one variable on another, despite weak predictive power due to other contributing factors.
The most important question now is why the production of ozone in the upper stratosphere in the tropics is declining, as evidenced by the temperature drop on about 5 hPa at an altitude of 35 km. At this level, the temperature can only rise as a result of photolysis of O2 into oxygen atoms by UV radiation shorter than 242 nm. We don’t realize what kind of disruption this can cause to the circulation of the stratospheric polar vortex.
https://www.cpc.ncep.noaa.gov/products/stratosphere/strat-trop/gif_files/time_pres_TEMP_ANOM_ALL_EQ_2024.png
https://www.cpc.ncep.noaa.gov/products/stratosphere/strat-trop/gif_files/time_pres_TEMP_ANOM_ALL_NH_2024.png
Should be read by anyone reading / posting on / managing the blog:
https://sysdig.com/learn-cloud-native/aws-cloudfront-security/
And yet, posting via a VPN gets through.
binny fails to grasp that Cloudfront and Amazon, the owner, are the problem. It is plainly obvious that Amazon has found a way to intercept information, process it, and sell it to the highest bidder. In doing so, through invitation from naive providers, they can do it legally while messing up the Net with their incompetent software.
They are all at it these days, stealing information from users. Microsoft does it by offering Windows 10 free then blatantly spying on users, going so far as to monitor keystrokes on a keyboard, even when the user is doing delicate financial transactions.
A polar vortex center has formed over Russia in the upper troposphere (5 km ), bringing air from the north to Poland as well. This situation may last for quite a long time, as the tendency to block the western circulation is seen.
ent…” There are many Kuiper Belt objects similar to Pluto.
If you decide Pluto is not a planet then there are eight planets.
If you decide that Pluto is a planet, then so are all the hundreds of Kuiper Belt objects”.
***
Problem is, Pluto is not a random, jagged object tumbling through space, it has a uniform spherical shape like the other planets. It has been ingenuously excluded as a planet simply because it is part of a ‘defined’ region called a Kuiper Belt. In other words, it does not fit the limited minds of many astronomers as a planet even though to meets all the requirements of a planet.
You are giving astronomers far too much credit for intelligence. Many of them were not smart enough to be physicists. Then again, many physicists are frustrated philosophers who profer inane theories like the Big Bang, black holes, evolution, space-time and blackbody theory.
That philosophical approach has spread to astronomy where they lack the instruments to measure therefore must fall back on inane philosophical theories. One of those is why Pluto has been excluded as a planet, simply because it is in the region of a philosophically defined region called a Kuiper belt.
The theory is that other planets have absorbed all debris in their region. Not a shred of evidence to support that theory. Astronomers somehow believe that the planets formed from an accretion disk left by the Sun as it formed into a ball of plasma. The theory fails to explain the spherical structure of the planets and their diversity of structure. It also fails to explain why the planets are essentially in the same plane.
Some astronomers believe the Moon was ejected from the Earth. They are not smart enough to calculate the force required to raise an object the size of the Moon into space and have it go into orbit around the Earth.
Astronomy is little better than anthropology in that scientists are forced to offer opinions from the human mind as to what has happened or is happening. When I took a year of astronomy as an elective I had visualized an interesting year of studying the universe. Much to my chagrin, most of it was pure theory with little to support the theory.
I am starting a campaign to reclassify the neutron as a proton.
Like a proton a nucleus has a mass of 1amu and is found in the nucleus of atoms. The neutrons lack of charge is irrelevant.
Yet another red-herring response from Ent.
Lack of charge is irrelevant. Nice to know.
God, you two are dense!
Do you not recognise sarcasm when you see it?
Must I write /sarcon and /sarcoff every time for your benefit?
Dunning-Kruger strikes again.
The definition of a planet adopted by the IAU says a planet must do three things:
It must orbit a star (in our cosmic neighborhood, the Sun).
It must be big enough to have enough gravity to force it into a spherical shape.
It must be big enough that its gravity has cleared away any other objects of a similar size near its orbit around the Sun.
Only the four rocky inner planets and the four gaseous outer planets meet these criteria.
Pluto meets the first two criteria but
not the third. It has therefore been classified as a dwarf planet along with Ceres in the asteroid belt and Haumea,Makemake, and Eris in the Kuiper Belt.
This is how the IAU classifies bodies in the solar system. Note that some bodies can be in more than one category.
https://en.m.wikipedia.org/wiki/Dwarf_planet#/media/File%3AEuler-Diagram_bodies_in_the_Solar_System.jpg
Never mind your Dunning-Kruger ad hom, try thinking for yourself and comprehending what I wrote.
You said…
“It must be big enough to have enough gravity to force it into a spherical shape”.
***
This is a theory lacking proof. It is assumed that a planet forms into a sphere due to gravitational force. Not a shred of proof to back that theory, no one has ever seen a planet form. Plus, it is illogical.
The IAU are a load of theorists who claim Pluto is not a planet based on their illogical theories.
—
“It must be big enough that its gravity has cleared away any other objects of a similar size near its orbit around the Sun”.
***
More nonsense from the IAU. What objects are they referencing? How many objects were sitting near the orbit of any planets and which ones were assimilated?
You are a biologist, try to differentiate the IAU from paramecium. Not much difference intellectually.
“The International Astronomical Union (IAU) was founded in 1919. Its mission is to promote and safeguard the science of astronomy in all its aspects, including research, communication, education and development, through international cooperation. Its individual Members structured into Divisions, Commissions, and Working Groups are professional astronomers from all over the world, at the Ph.D. level and beyond, who are active in professional research, education and outreach in astronomy.
https://www.iau.org/administration/about/
One must be of considerable intellect to be able to convincingly trash this venerable institution.
barry’s appeal to authority knows no bounds. I have justly critiqued the claims of the IAU re planetary definition, as if the planets give a hoot about their definitions.
They seem to be OK with defining Pluto as a dwarf planet, at least, NASA thinks so. The criterion upon which they have demoted Pluto is Pluto’s location in the Kuiper Belt. The IAU seems to think Pluto needs to assimilate the entire belt into one large planet, even though their is no evidence that any other planet has done that.
Where does the IAU get that idea from? They state that planets are formed via gravity into a sphere but there is one problem. No one has ever seen a planet form. Also, it is highly unlikely that solar gravity would form a molten rock into a sphere. It is far more reasonable that the forming planet would need to be molten and spinning on a local axis at a high rate of speed.
But where did the molten material come from?
Where is the evidence for any of that?
I am re-instating Pluto as a formal planet and to heck with the IAU and other ego-based institutes.
“barry’s appeal to authority knows no bounds.”
There was no appeal to authority, any more than saying Roy Spencer is an astrophysicist is an appeal to authority. It’s a statement of fact about expertise.
You do not appear to understand what a fallacy is.
“I have justly critiqued the claims of the IAU re planetary definition”
No, you have harrumphed and harangued and made very little in the way of cogent analysis. Your process of argument is as capable as your understanding of logic fallacies.
The bit I bolded was in response to your shot-in-the-dark announcement that the IAU are “a load of theorists.” No, they are active researchers and educators.
You are simply a guy with a hyper-inflated ego.
“I am re-instating Pluto as a formal planet and to heck with the IAU and other ego-based institutes.”
And possibly some projection issues.
barry…”The bit I bolded was in response to your shot-in-the-dark announcement that the IAU are a load of theorists. No, they are active researchers and educators”.
***
You fail to grasp the problems facing astronomers and astrophysicists. They have very limited instrumentation, forcing them to live in a world of theories. The main instrument for observing the universe is a radio-telescope which is based on detecting gas spectra from stars. Optical telescopes, even Hubble, is seriously limited wrt detail.
Furthermore, they have to guess at how stars and planets are formed and the exclusion of Pluto as a legitimate planet is based on such a guess. My reclaiming Pluto as a legitimate planet has nothing to do with ego, even though a good amount of humour goes into my claim. I have as much right as the IAU to claim Pluto as a legitimate planet since they have provided no proof, other than consensus, that it is not.
Hubble has the advantage of ‘seeing’ outside the distortions produced by the atmosphere. Therefore it’s advantage is better clarity. However, it cannot see to a significantly greater resolution that ground based telescopes at great distances.
Here is Jupiter from Hubble and it’s just down the road compared to the stars….
https://s3.amazonaws.com/images.spaceref.com/news/2019/oo208307_web.jpg
The same Jupiter from a land-based telescope…
https://scx2.b-cdn.net/gfx/news/hires/2012/imageofjupit.jpg
Forget optical telescopes for detail from a star a few light years away.
The low will now tend to stay below southern Greenland. This is the kind of circulation that occurred during the Little Ice Age.
A strong temperature drop in November will start from Russia and Scandinavia.
https://www.star.nesdis.noaa.gov/GOES/sector_band.php?sat=G16§or=na&band=GEOCOLOR&length=24&fbclid=IwY2xjawGUDL5leHRuA2FlbQIxMAABHZHnx1A_SwMfh65r1PXm3c9husW3Pnw5vsS_DmY2pZJHjNY_Fz9nbrPChA_aem_e4mGA8chy-QHqfetC_fJ1A
In the coming days, the center of the polar vortex will be over northern Russia, which means a sharp frost in Russia in November.
https://i.ibb.co/3fLDz9j/gfs-z100-nh-f120.png
https://www.youtube.com/shorts/g27EFsH0uII?feature=share
People aren’t happy (not surprising). They threw mud and shouted insults and the President (Pedro Sanchez) and President of Comunidad Valenciana (Carlos Mazon) as they arrived in Piaporta, Valencia, Spain.
Denial coming home to roost.
Wow Ark! Very interesting……yawn.
stephen p anderson,
Save yourself some grief, you need an IQ of at least 120 to understand my posts.
“Denial coming home to roost.”
Huh? That’s one of the best non-sequiturs in years.
No one knows what you are talking about… you bloviate even more than Kacklelot Harris.
The Great Walrus,
Save yourself some grief, you need an IQ of at least 120 to understand my posts.
A few answers to Robertson’s usual load of crap and trash…
https://www.drroyspencer.com/2024/10/a-demonstration-low-correlations-do-not-necessarily-lead-to-low-confidence-in-data-regressions/#comment-1693870
*
” If that was the case, all hackers would be out of business since they could be easily localized and arrested. Obviously that is not the case. ”
Indeed. But hackers don’t use their IP address to communicate: they fake IP addresses to do that. Hackers know how to fabricate IP packets.
*
” In order for a site to be localized, the local IP address must be located and that is simply not possible if the sending IP address is hidden behind several other IP addresses. ”
Absolute nonsense. Robertson never has seen the list of all IP addresses between his WAN IP and that of the target he wants to access. Years ago I had a tool on Win XP showing such complete IP chains.
Moreover, the WAN IP obtained by our Internet access boxes from our Internet supplier is not a ‘local’ IP: it is global.
*
Each device accessing the Internet to obtain or to upload information needs a worldwide unique IP address.
This IP address – e.g. in IPv4 format: 162.142.125.93 – can be either static and never changes, or it is dynamic, subject to change each time our Internet box is restarted or each time the supplier’s server responsible for our Internet and telephone connection sends a new dynamic address by itself, sometimes even daily.
Static IP addresses are mostly used by enterprises or Web servers, but anyone can buy or rent one if useful.
Most users however obtain worldwide unique dynamic addresses maintained by the suppliers in pools.
Here is the major drawback of dynamic IP addresses: users obtain them from pools containing dynamic addresses previously used by other users who possibly misused them for dirty purposes (spam etc).
Such dirty activities are often recognized and registered in black lists from which they can be retrieved by any software protecting computers from access by blacklisted IP addresses.
Even if you were not the origin of this blacklisting, you nonetheless can’t then access such protected computers: this has nothing specifically related to Amazon AWS’ Cloudfront, which is only one of dozens of such protection suppliers, e.g. Trend Micro and many others.
This is currently the case for my WAN IP address, and is the reason why I can’t access Roy Spencer’s blog (I could restart the box and thus obtain a new IP address but this causes other problems).
*
A local area (LAN) IP address is something completely different from what ignoramus Robertson thinks it to be.
Such addresses are local to the box which either dynamically provides them to local devices connected to the box (computers, printers, scanners, VoIP telephones etc), or uses info stored in a LAN table containing fixed LAN IPs together with the devices’ MAC address.
*
For example, the LAN IP addresses of our two laser printers/scanners are fixed and known to the box as e.g. ‘192.168.1.501’ and ‘192.168.1.502’; these addresses are entered in device descriptions in my lady’s Windows 11 or in my Linux system.
Whenever we enter these LAN IP addresses in our browsers, the corresponding printer/scanner reacts with a status description.
*
Finally, a special IP address ‘127.0.0.1’ (localhost) is dedicated only to the computer you currently use.
*
Wifi has primarily nothing to do with IP addresses: it is a MAC address based protocol.
*
All the crap told by Robertson you simply can forget.
binny…”Finally, a special IP address 127.0.0.1 (localhost) is dedicated only to the computer you currently use.
***
127.0.0.1 is a loopback address which send data back to the sending machine. It is used in a Windows file called ‘hosts’ to block apps from sending unwanted data outside the machine. If you list an IP address in hosts with the 127.0.0.1 IP address it loops the data back to the machine while the sending app thinks it has sent the data home.
***
Binny loves to opine on matters he does not even begin to understand. The irony is that he claims that about me.
Example…”Wifi has primarily nothing to do with IP addresses: it is a MAC address based protocol”.
***
A MAC address is a hardware address that identifies a piece of hardware on a network. If the wifi router had no IP address it would be useless since it could not receive wifi data from machines and send the data onto the Net.
A wifi router receives wireless data from machines within a network and converts the transmitted data into a format the Internet understands.
Furthermore, a machine in the network can be connected directly to the wifi router with a CAT5 cable, bypassing the wifi feature. Since the router is a main node in the network, it needs an IP address.
Further furthermore, each wifi station needs to e identified to the network hence an IP address for each piece is mandatory.
Whether you are using a pure wifi system, or a pure wired system, each device in the network requires an address to identify it. Otherwise, the router has no idea where to send the data for a particular device.
A typical network is connected like a ring or a mesh. Data runs from node to node in the network and as it passes each node, the header is read to see if the data is for that node or not. The IP address identifies the node and the header on each data packet has the required IP address in it.
Computers and smart devices communicate on a network using a protocol (RS-232 for example). The protocol uses what is called handshaking, a language by which smart devices tell each other when it is safe to send data and when and if it is received.
On my Windows system, if I want to connect two computers I need an IP address for each one even though it’s obvious who is talking to who. In a large business office using a LAN, there may e 50 or 100 computers talking to each other. Without an IP address it simply would not work.
That’s a hardwired network. If I replace the cables with wifi stations, I have the same problem, each station must have an IP address as well as a MAC address.
I’ll get back to you later as time permits.
I have already pointed out that hackers hide their IP behind other IPs. That’s what Tor does, it routes your IP through other nodes on the Net and that hides your IP address.
Hackers route their IP through proxy servers that strip their IP and add another. The can stack the proxy servers several deep, removing any change of being traced.
The 192.168.xxx.xxx address given to local LAN’s does not appear on the Net. It is assigned by Windows or Linux. Some routers now use a 10.xxx.xxx.xxx address locally and you can use dynamic ip addressing locally to change 192.xxx.xxx.xxx to 10.xxx.xxx.xxx. While you are at it, you can change your DNS server IP.
For example, I can use the 192.168.000.001 address locally on Windows and you can use the same address, as can millions of others, on their machine.
If you ever have trouble connecting to the Net, and you have changed to another dynamic IP, on a local LAN, the first thing to check is that Windows has not reverted to the 192.168.xxx.xxx format.
You are a bit wet on dynamic IP addresses. A local IP address must be a subset of your Net IP address. Therefore, it does not come from a pool of IP addresses but from a subset assigned to you. If you re-assign an IP address within your domain, no one can see it from outside your domain therefore no one will have used it for nefarious purposes.
binny blowhard…”Absolute nonsense. Robertson never has seen the list of all IP addresses between his WAN IP and that of the target he wants to access. Years ago I had a tool on Win XP showing such complete IP chains”.
Try tracert with an IP (may be ‘traceroute’ in Linux). In Windows, I open a command prompt, type in tracert with IP address, and it traces the route. Ping does the same thing but tracert is more configurable.
Note that the first address is 10.0.0.1 for my wifi modem. That is a standard IP for any modem connected to my Internet provider. The next IP is the actual IP address issued by the Internet provider for the modem and the next is the IP address of the provider. The provided IP address can be changed by rebooting the modem.
Internally, I can change 10.0.0.1 to any IP address I want as long as it is internal.
You have to distinguish the inner LAN IP addresses from the wider WAN addresses.
Roy…my last post was flagged for approval. I am posting using the Tor browser because I can’t connect using Firefox. Still getting a ‘403 Forbidden’ error.
Someone needs to talk to Cloudfront about blocking legitimate posters.
The statistical results are puzzling because both the standard error of the estimated slope and R^2 depend on the error sum of squares. Are you reporting plus or minus the standard error of the estimated slope or the 95% confidence interval of the estimated slope? Can you please share your data points (x, y), with one column for x and one column for y?
*** Stu, this should not be puzzling. Take these three (x,y) datapoints and regress them: (1,2.4) (2, 3.6) (3, 6.4) The explained variance is 95%, but the 1-sigma uncertainty in the regression slope is +/-23%. It’s because there are only 3 data points. If you have hundreds (or in my case, many thousands) of datapoints, a low R-squared can be “traded off” against a large amount of data when it comes to reducing the uncertainty in the regression slope.
Robertson
” I’ll get back to you later as time permits. ”
Please, Robertson! Please spare us your permanent urging to teach people about what they know since decades.
You have demonstrated so often that your ‘knowledge’ is exclusively based on what you nowadays find on the Internet, and NOT on any professional experience.
I wrote my first email in 1978 from Munich University via the Dortmund backbone to Amsterdam.
Did YOU, Robertson, work at that time on a DEC PDP computer already?
Did YOU, Robertson, connect a cluster of UNIX workstations (one server, three clients) using a local IP network at the beginning of the 1980’s?
Will YOU, Robertson, now have the brazenness to teach me about Internet? Maybe you are even brazen enough to explain to me how to use NFS?
*
You are ridiculing yourself, exactly as when you try to teach the blog about C and C++ – programming languages you never used in your entire life, let alone would you have ever heard of Simula67 or SMALLTALK.
*
Please stop boring the blog with your irrelevant pseudo-knowledge.
binny…you are a great source of amusement. Did you say the DEC PDP??? It was obsolete by 1980, just before Microsoft stole the CP/M operation system and created DOS. Then they stole the GUI idea from Apple and created Windows.
The PDP8 was a hulking beast developed first in 1965. The only language available to it was Unix and that’s why they went with that obsolete monstrosity. Anyone who dares to look under the hood of Linux will experience the ugliness of Unix, and ancient language created for teletype machines.
What does that ancient art have to do with the modern communications I have been talking about? I have noted how you avoided responding to the info I provided. Obviously, someone has to teach you about Internet protocol simply because your understanding of it is slim to none.
The reason we hear nothing about Simula67 and Smalltalk is their unpopularity. More ancient languages.
As for C and C++. anytime you want to test my understanding of either I am always available.
One can get sad of reading Robertson’s mix of arrogance and ignorance.
Not only does he endlessly try to teach you about what you know anyway; no, that’s not enough.
Look at this:
*
” You are a bit wet on dynamic IP addresses. A local IP address must be a subset of your Net IP address. Therefore, it does not come from a pool of IP addresses but from a subset assigned to you. If you re-assign an IP address within your domain, no one can see it from outside your domain therefore no one will have used it for nefarious purposes. ”
*
This is absolutely incredible.
I get since far over ten years dynamic IP addresses from different providers which often enough caused problems when having to communicate with export professionals in France.
Suddenly, overnight, you no longer can communicate with your French exporter because the dynamic IP address you recently obtained from your provider is rejected because it was entered in a global spam database.
It’s easy th check: simply enter your own dynamic IP into e.g.
https://search.dnslytics.com/cidr
and soon you see what happened: the IP address you obtain from the spupplier is for example ‘DNSbacklisted’, what leads several firms protecting enterprises to deny your access to the enterprises’s server(s).
*
Do you think Robertson would care aboput what you wrote?
You are wrong.
He knows better.
And he writes dozens and dozens of such crap…
*
” The only language available to it was Unix and thats why they went with that obsolete monstrosity. ”
It’s at least the third time I see Robertson posting such crap: apparently, he doesn’t know that Unix isn’t a language but an operating system, whose very first revision was implemented in 1970 in assembler by Ritchie & al. who somewhat later developed the B and then the C programming languages allowing them to write system software independent of the hardware architecture they were running on.
From the beginning, C was a programming language that, despite its simplicity, offered a complex type system based on Algol 68 and, now based on Simula67, the very first concepts of object-oriented programming – by allowing data structures and type definitions to contain references to procedures and functions.
*
” As for C and C++. anytime you want to test my understanding of either I am always available. ”
*
It is evident since the beginning that Robertson never obtained the least experience in even simplest programming, let alone was involved in any multi-person software specification, development and validation processes, e.g. connecting IP-based ftp I/O with a huge SQL database.
*
All he ‘knows’ about C and C++ he obtains from Internet sources which however he never explicitly mentions, in order to appear on this blog as a knowledgeable, experienced person.
*
I just got a 403 despite using TOR, and let it switch its data transfer channel (Robertson of course also knows it’s not necessary).
Hint…
Don’t forget to save your reply before the switch!