
 Home/Blog
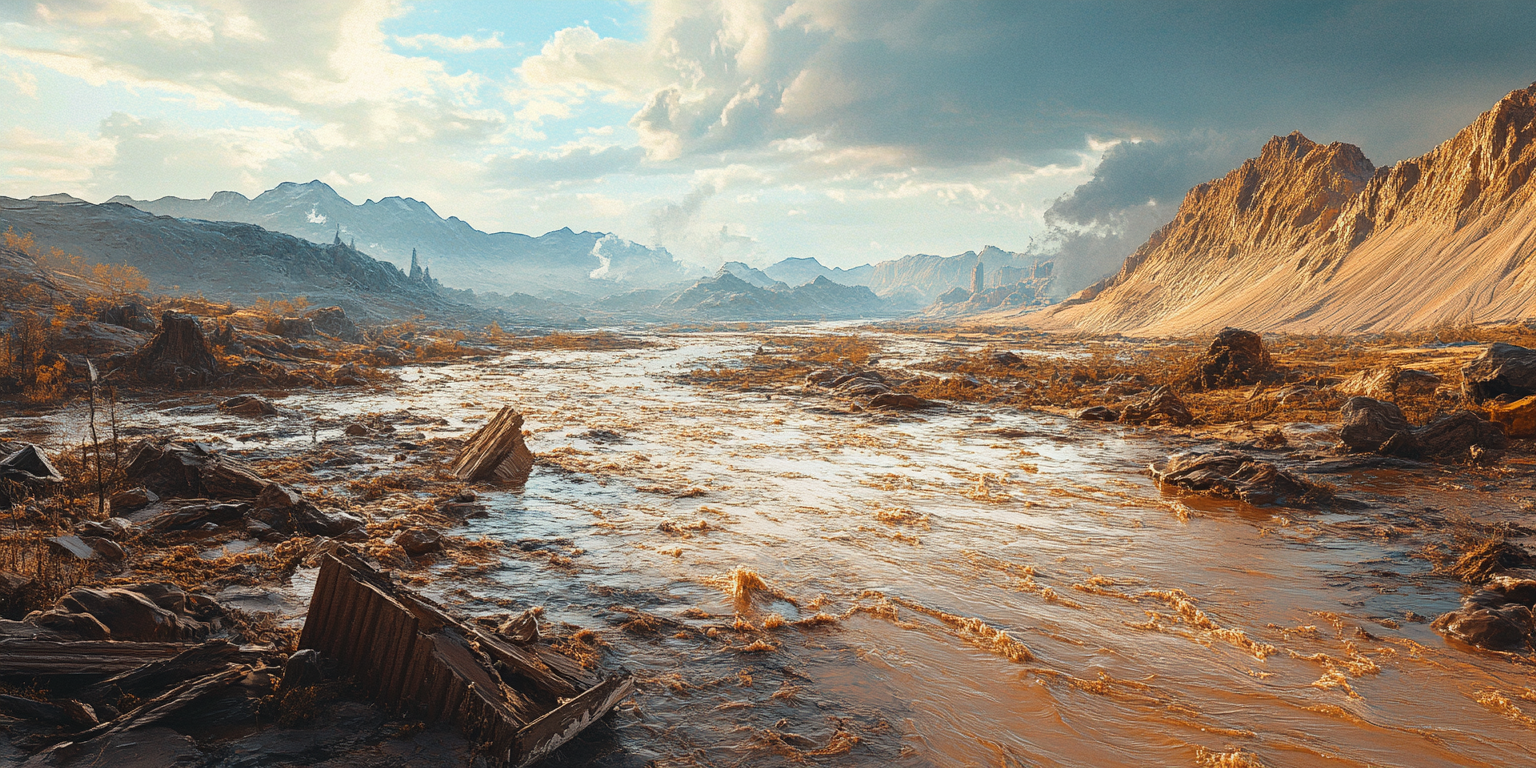
The recent devastating floods in western North Carolina were not unprecedented, but were certainly rare. A recent masters thesis examining flood deposits in the banks of the French Broad River over the last 250-300 years found that a flood in 1769 produced water levels approximately as high as those reported in the recent flood from Hurricane Helene. So, yes, the flood was historic.
Like all severe weather events, a superposition of several contributing factors are necessary to make an event “severe”, such as those that led to the NC floods. In that case, a strong hurricane combined with steering currents that would carry the hurricane on a track that would produce a maximum amount of orographic uplift on the east side of the Smoky Mountains was necessary in order to produce the widespread 12-20 inch rainfall amounts, and the steering currents had to be so strong that the hurricane would penetrate far inland with little weakening.
Again, all severe weather events represent the somewhat random combining of amplifying components: In the case of Hurricane Helene, they produced the unlucky massive flooding result that the region had not seen in hundreds of years.
The Random Component of Precipitation Variability
The rare superposition of several rare contributing factors, or the more common superposition of more common factors, can be examined through statistics when one examines many events. For example, it has long been known that precipitation statistics gathered over many years exhibit a log-normal frequency distribution. Simply put, the lowest precipitation amounts are the most frequent, and the highest amounts are the least frequent. This is the statistical result of the superposition of contributing factors, such as (in the case of excessive rainfall) abundant humidity, an unstable air mass, low-level convergence of air, a stationary or slow-moving storm (In western NC, the mountains providing uplift are stationary), etc.
Extreme precipitation events are (of course) the most rare, and as such, they can exhibit somewhat weird behavior. This is why hydrologists disagree over the usefulness of the term “100-year flood”, since most weather records don’t even extend beyond 100 years. One would probably need 1,000 years of rainfall records to get a good estimate of what constitutes a 100-year event.
Simulating Extreme Rainfall Events through Statistics
It is easy in Excel to make a simulated time series of rainfall totals having a log-normal distribution. For example, the following plot of hypothetical daily totals for the period 1900 through 2024 shows an seemingly increasing incidence of days with the heaviest rainfall (red circles). Could this be climate change?
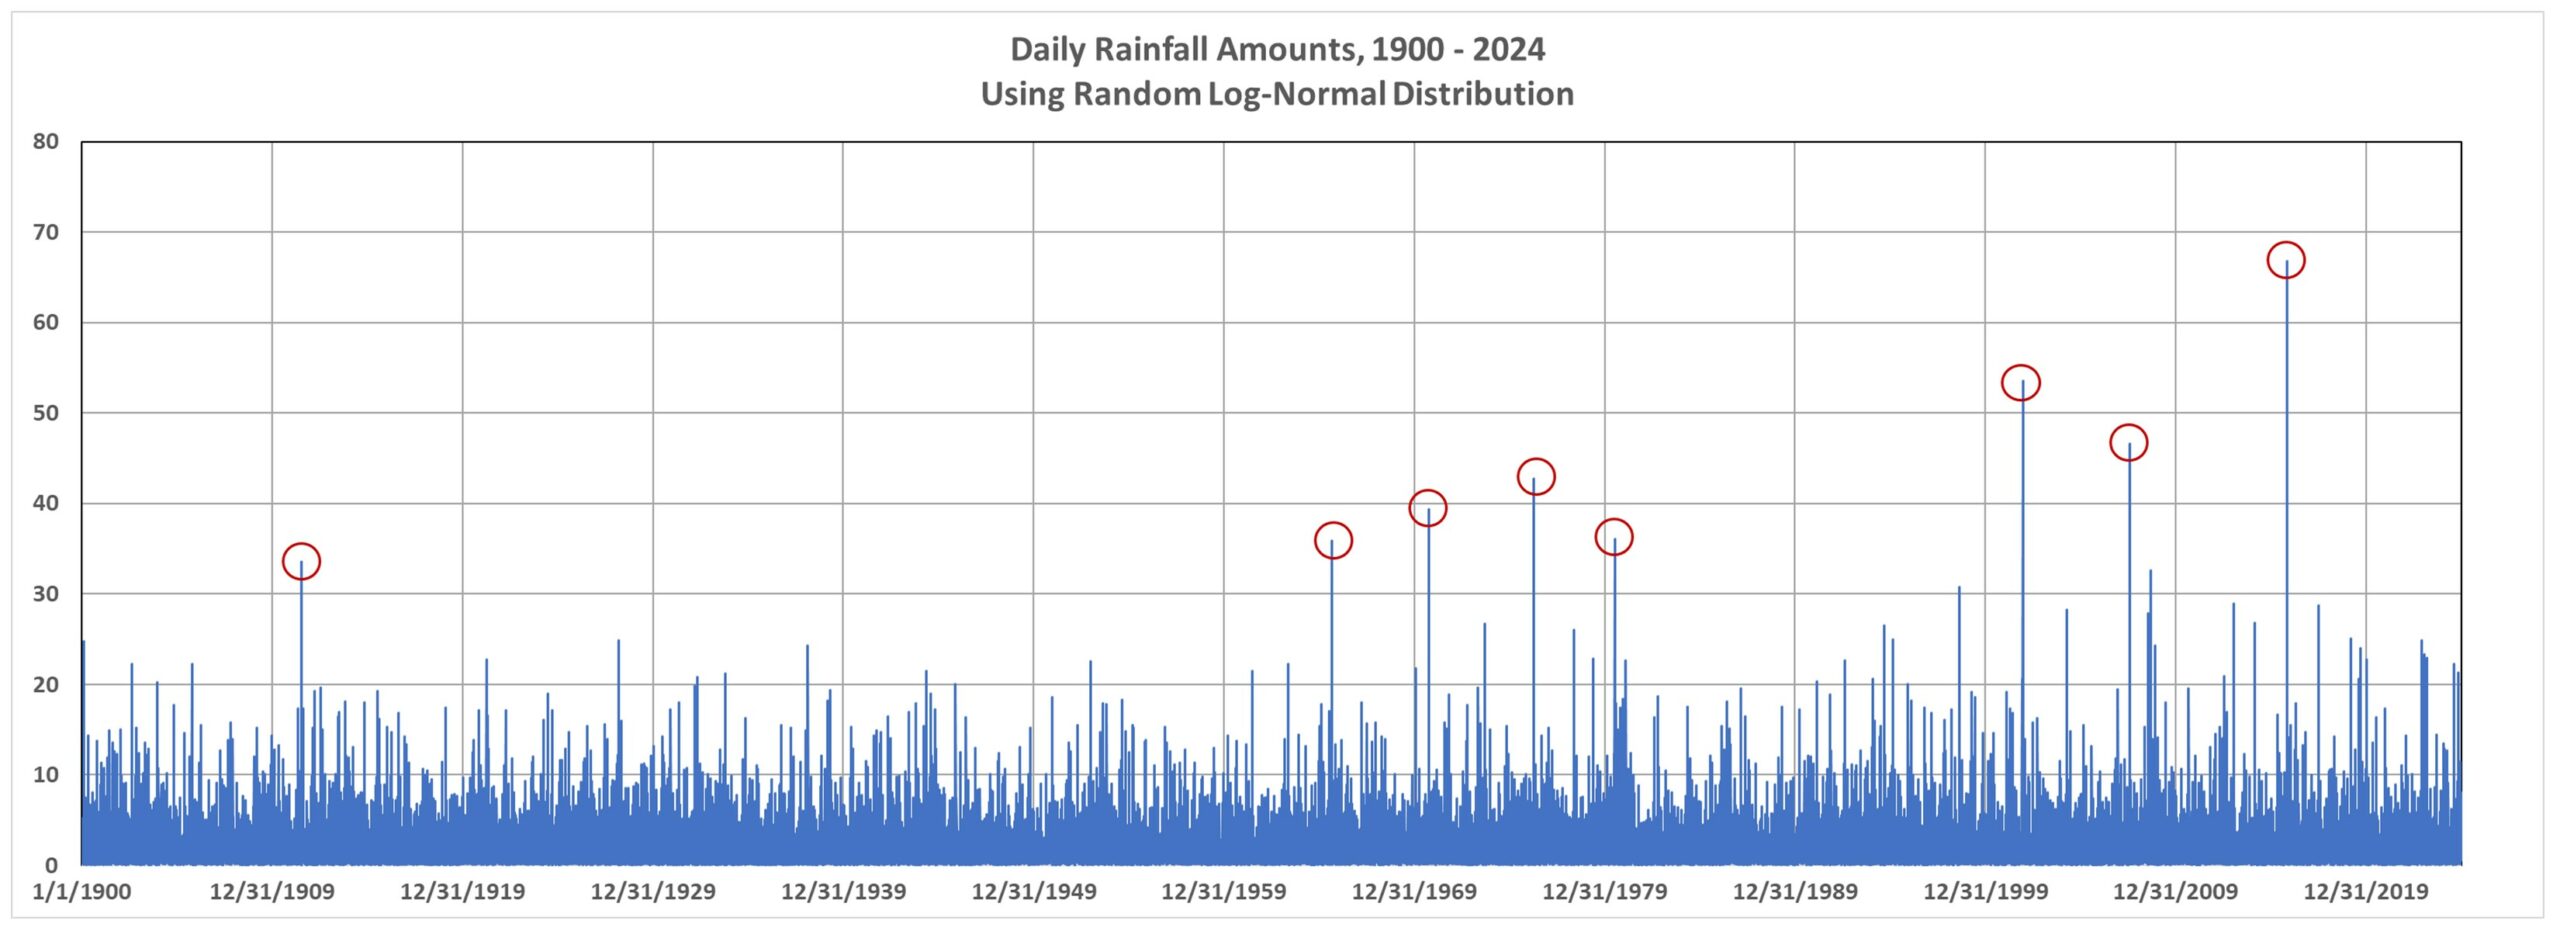
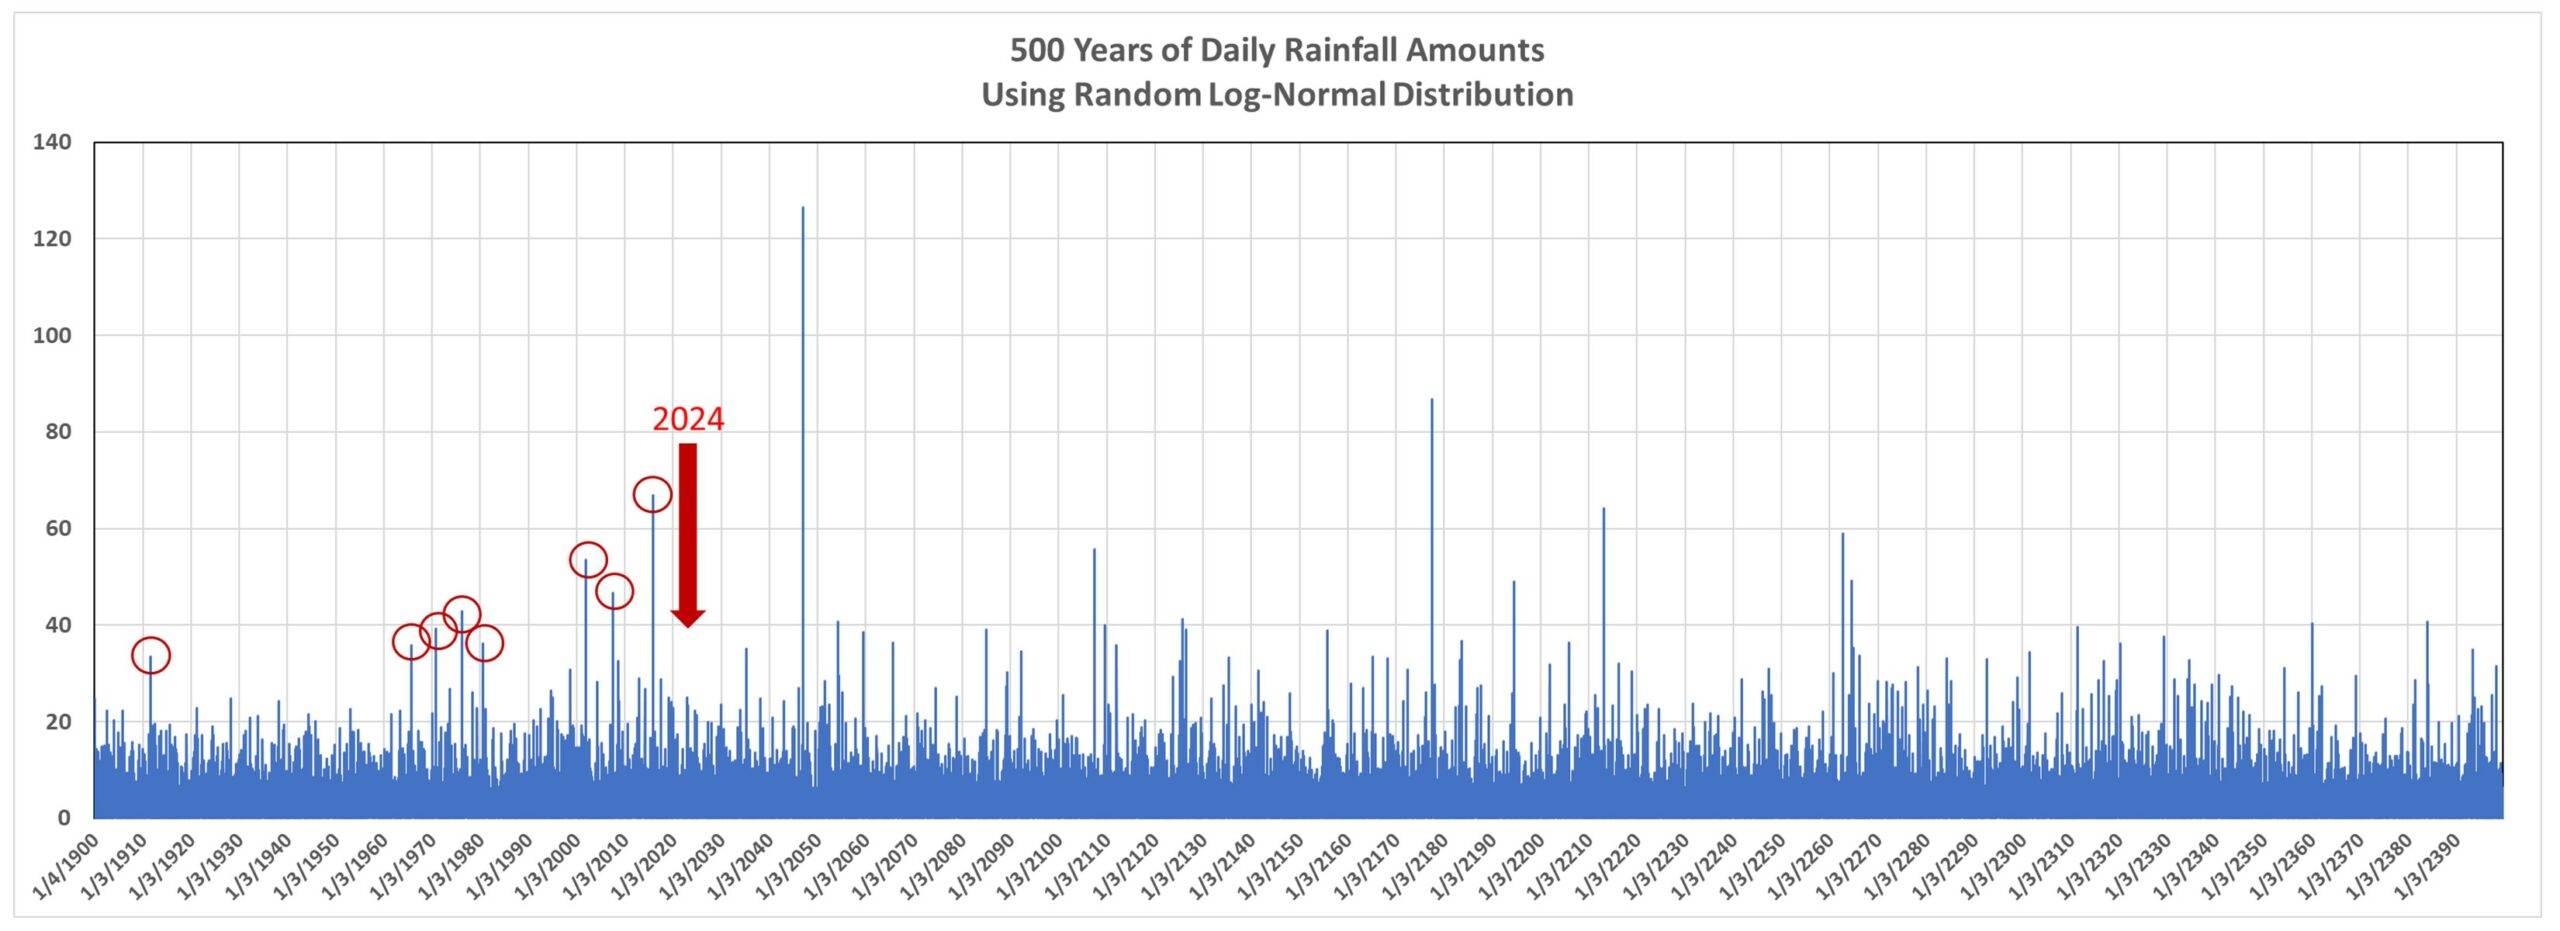
But remember, these are randomly generated numbers. Just like you can flip a coin and sometimes get 4 heads (or 4 tails) in a row doesn’t mean there is some underlying cause for getting the same result several times in a row. If we extend the above plot from 125 years to 500 years, we see (following plot) that there is no long-term increasing trend in heavy rainfall amounts:
Black Swan Events
Or, how about this one, which I will call “The Great Flood of August 28, 2022”?:
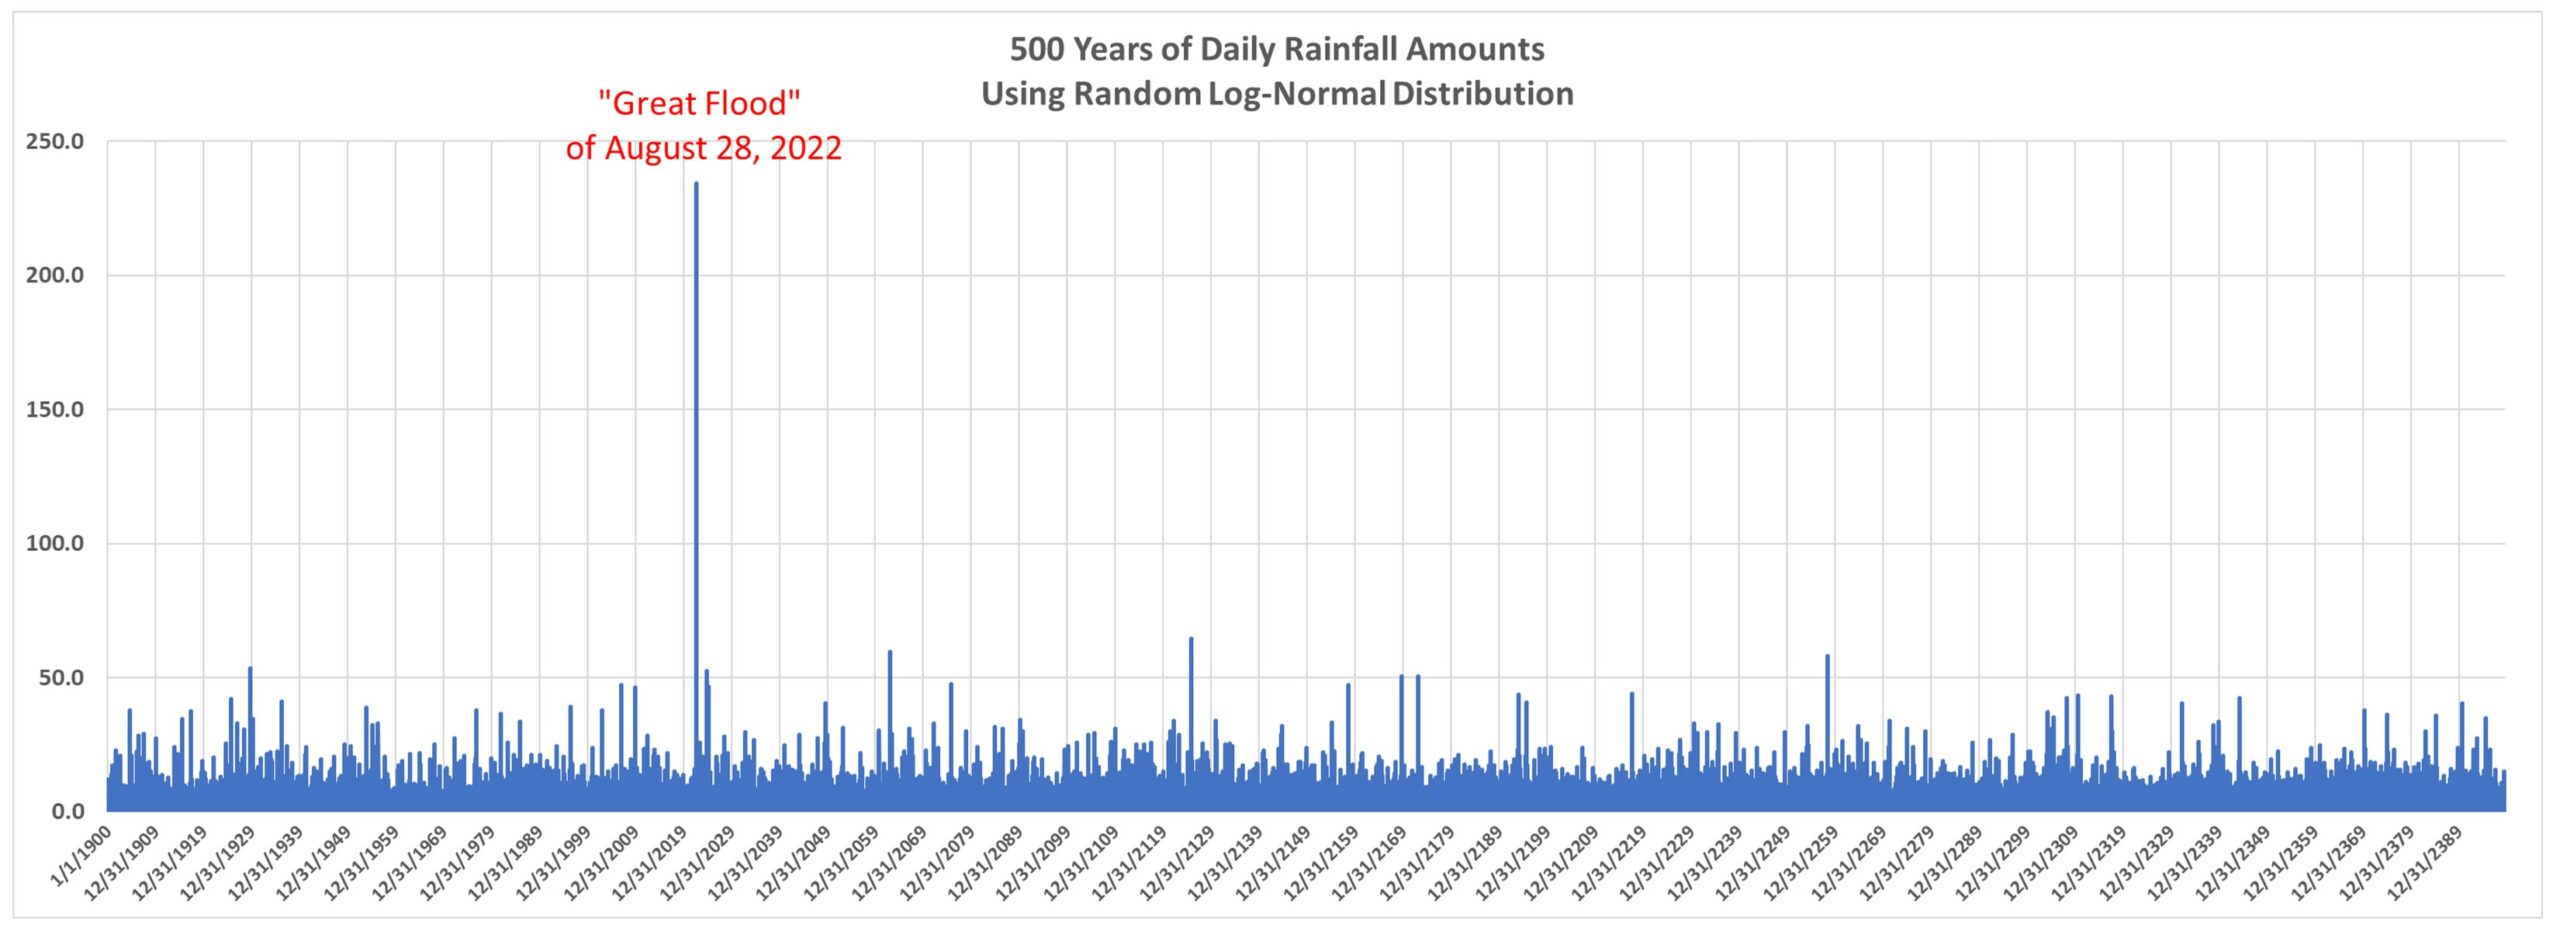
Note that this event (generated with just log-normally distributed random numbers) far exceeds any other daily event in that 500-year plot.
The point here is that too often we tend to attribute severe weather events to some underlying cause that is emerging over time, such as global warming. And, I believe, some of the changes we have seen in nature are due to the (weak and largely benign) warming trend most regions of the world have experienced in the last 100 years.
But these events can occur without any underlying long-term change in the climate system. To attribute every change we see to global warming is just silly, especially when it comes to precipitation related events, such as flood… or even drought.
A “Random Drought”
Now changing our daily random log-normal precipitation generator to a monthly time scale, we can look at how precipitation amounts change from decade to decade. Why monthly? Well, weather variations (and even climate cycles) tend to have preferred time scales. Several days for synoptic weather patterns, quasi-monthly for some kinds of persistent weather patterns, and even yearly or decadal for some natural internal climate cycles.
When I generate random log-normal time series at monthly time scales, and compute decadal averages over the last 120 years, seldom is the long-term trend close to zero. Here’s one what shows low precipitation for the most recent three decades, just purely through chance:
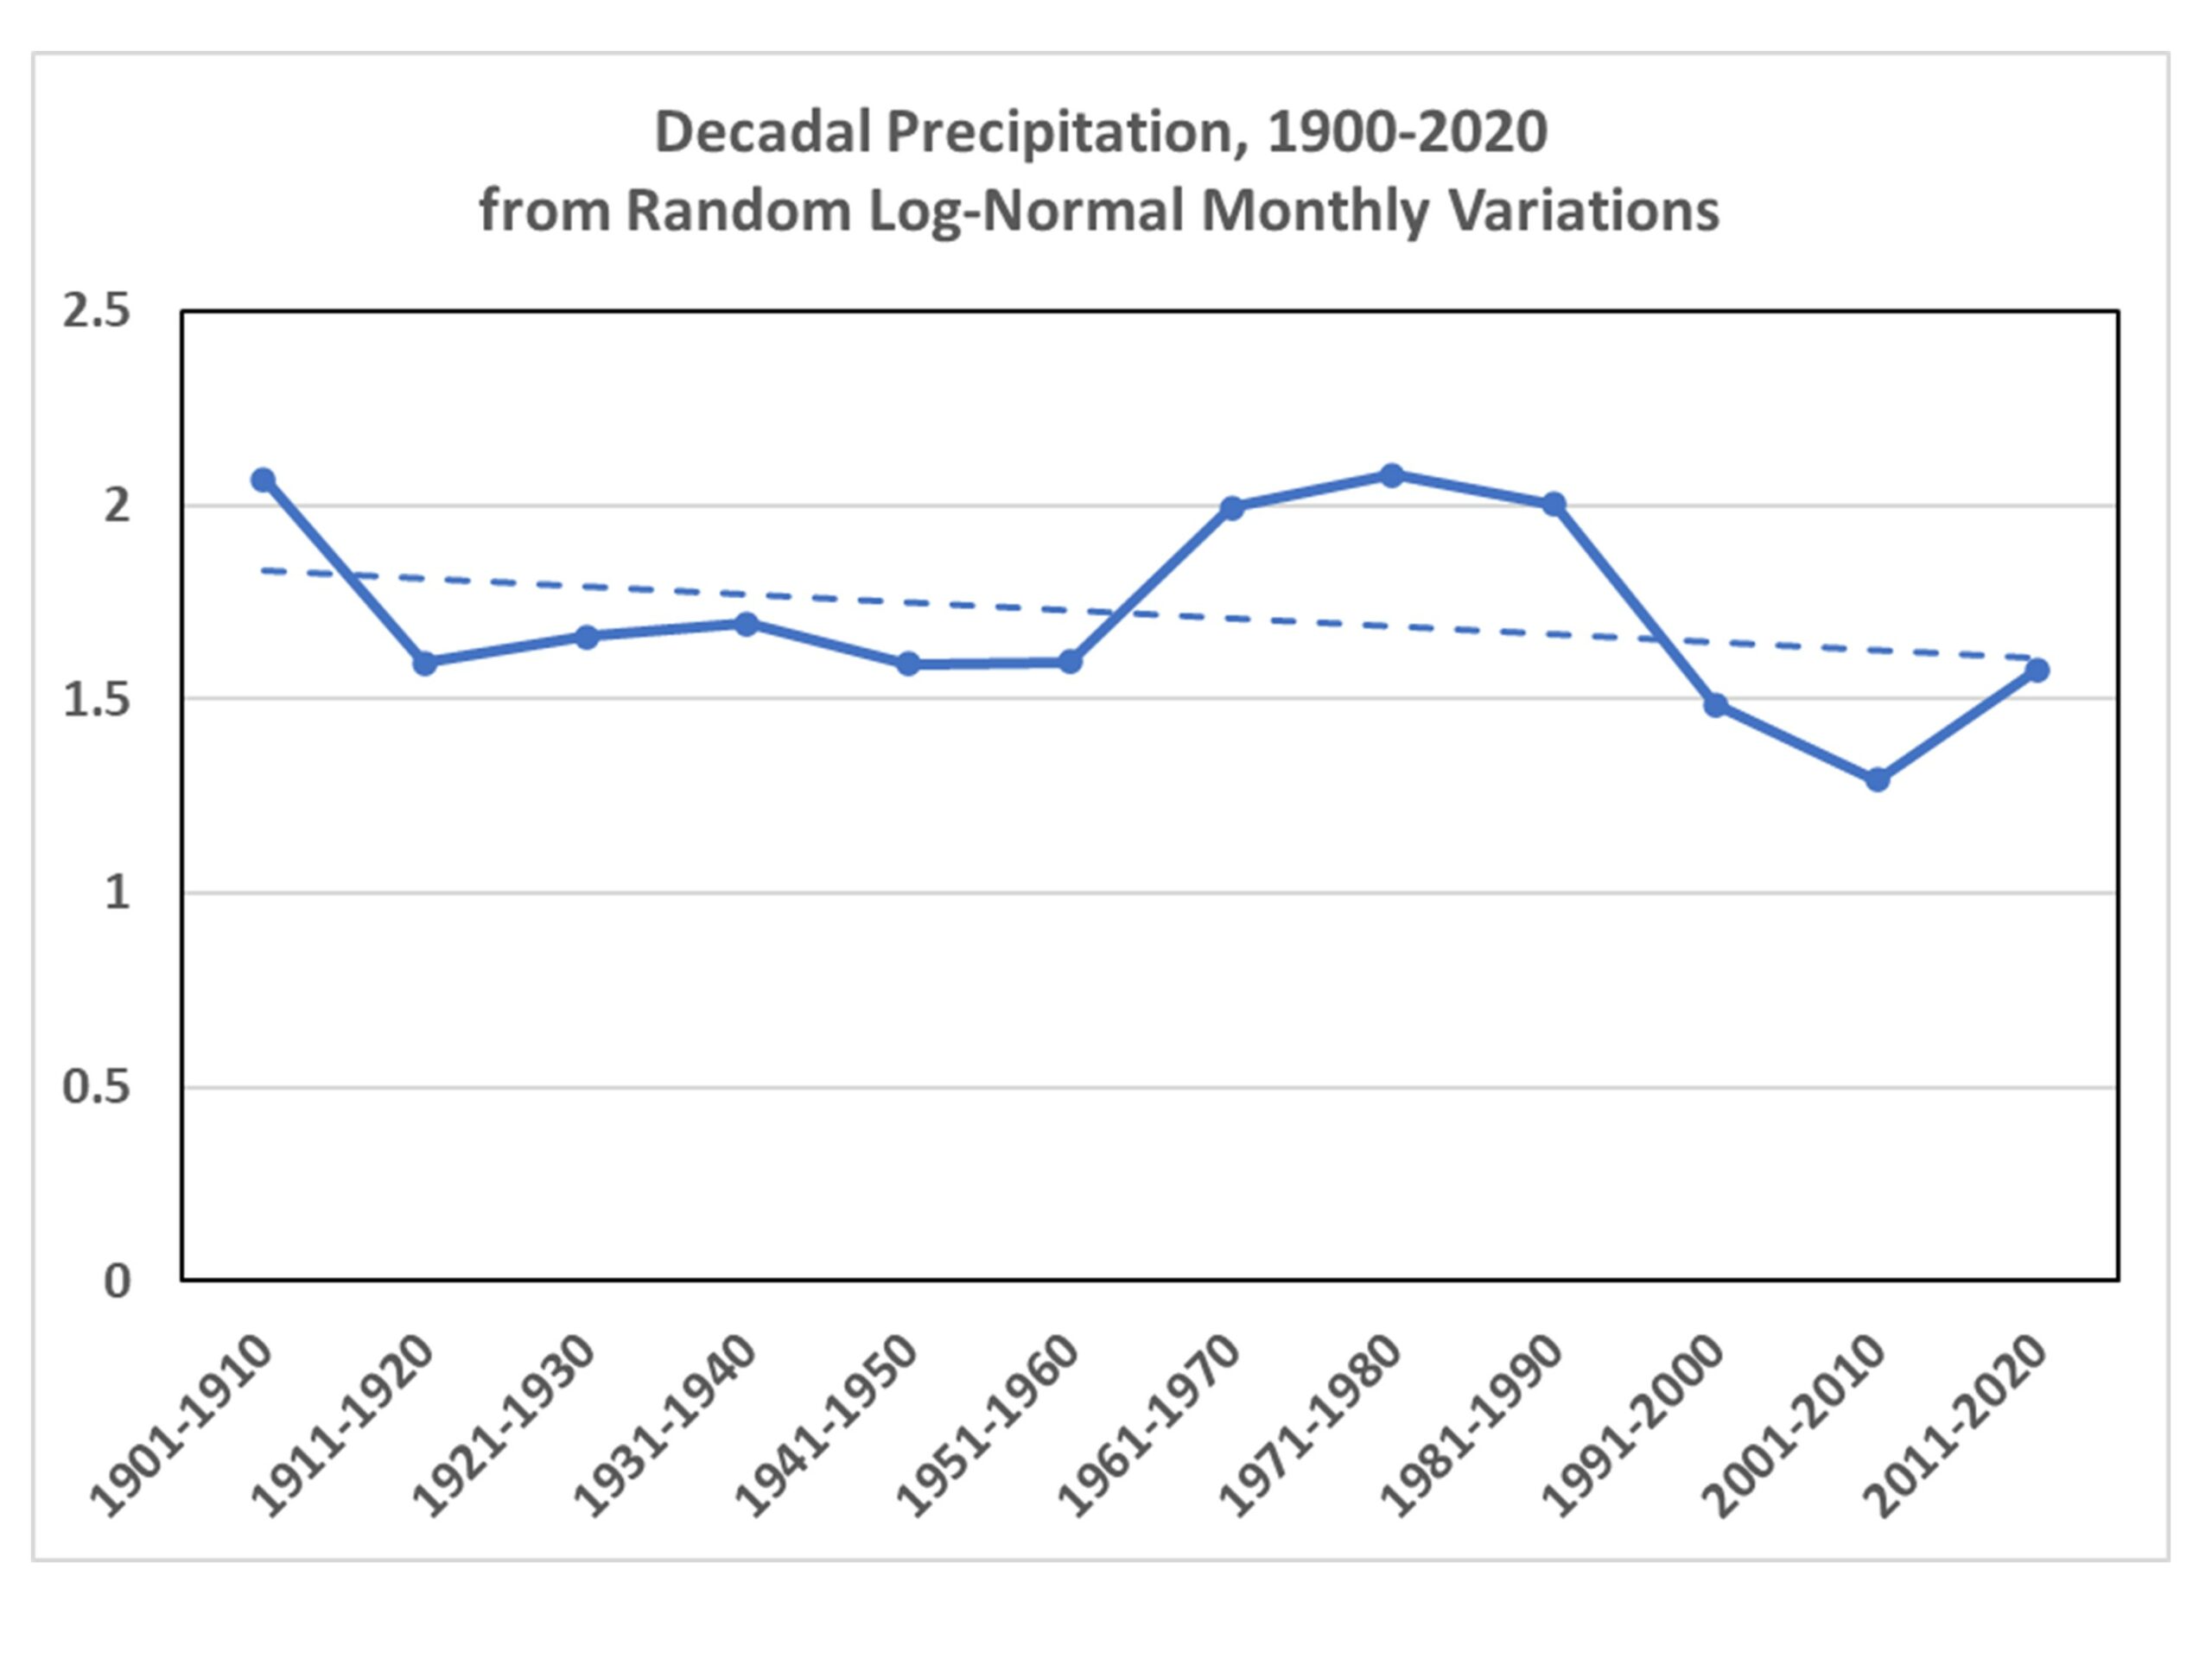
That looks like something we could attribute to drought in California, right? Yet, it’s just the result of random numbers.
Or, we can choose one of the random simulations that has an increasing trend:
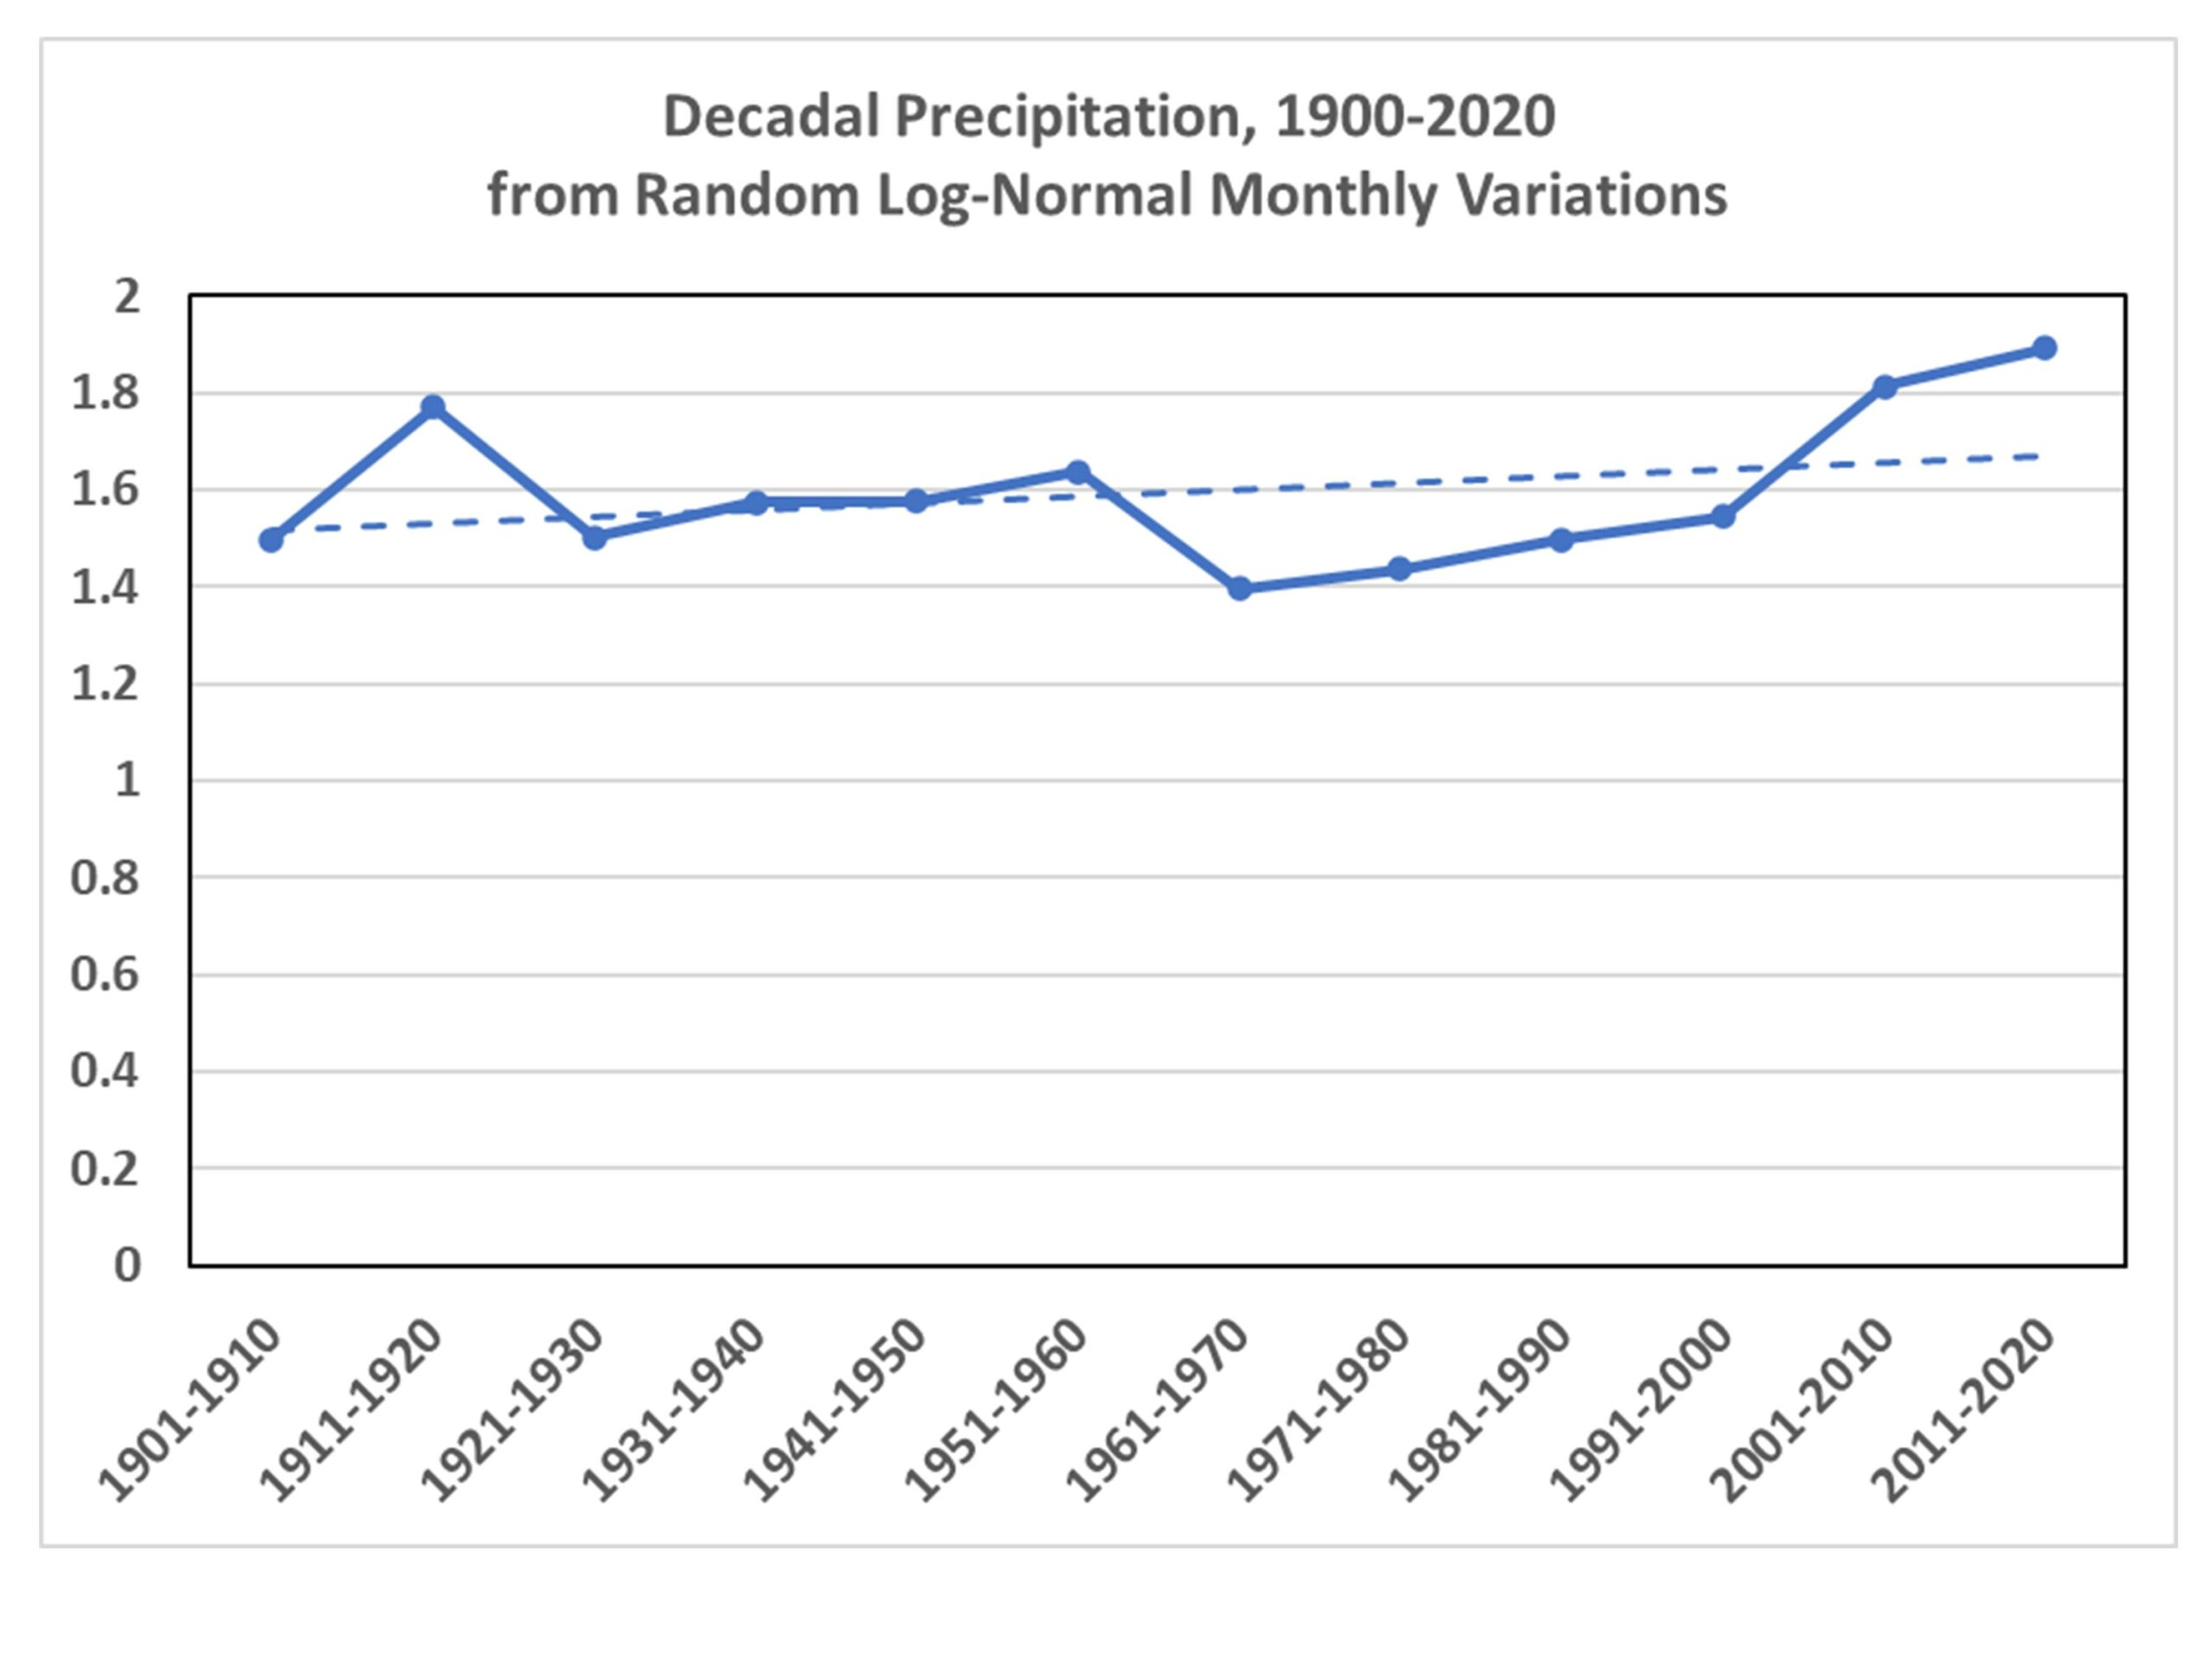
I’m sure someone could tie that to global warming.
A Final Word About 100-Year Flood Events
There seems to be some misunderstanding about 100-year events. These almost always apply to a specific location. So, you could have 100-year events every year in the U.S., and as long they are in different locations, there is nothing unusual about it. A 100-year flood in western North Carolina this year could be followed by a 100-year flood in eastern North Carolina next year. That doesn’t mean 100-year floods are getting more frequent.
I’m not claiming that all severe weather is due to randomness. Only that there is a huge random component to it, and that’s what makes attribution of any kind of severe weather event to climate change essentially impossible.


Back in olden days, global warming was when sea level rose more than 100 meters, and it followed a very cold period, called the glacial Maximum.
And Earth become warm very quickly, very warm compared to how cold it was during Glacial Max, but also warm as compared to most of the time of interglacial period. Or warmer than the present time and all the time during the last 5000 years.
So in last 100 years, or recently, it was predicted that our ocean sea level would rise by many meters {and quickly} and it didn’t.
If our sea level rose by 3 meters, then it would one could get away with saying we are having “global warming”, but not as impressive as “real” global warming.
A 3 meter rise in sea level is not getting us out of our Ice Age, but if happened within a few decades, one might hope if it continued with this trend, we might get us out of the Late Cenozoic Ice Age, eventually.
The only thing important about a 3 meter rise in sea level, is a lot people livon the the beach and nobody is living in ocean settlements.
Humans live on land, rather then most of the Earth surface, which is ocean- we are backwards/primitive in that way.
…so…. any comments on the current post?
I was going to talk about global weather, but also was going to explain global climate. But I ran out time- I was late, as it was, but in terms global weather.
Global weather is very complicated, and it part of centuries up and downs of “global warming and global cooling” which most assume has to with oceanic circulation.
We have huge waterfalls under the oceans and huge amount cold arctic water flowing around the world- it’s mentioned a lot, but not a lot time or money is spent understanding it.
It seems a lot of housing developers, buyers, and mortgage companies have ignored those 100 year flood zones on the maps.
Is Paleoclimate Cyclic? Its a Mystery to Me
https://wattsupwiththat.com/2024/10/23/its-a-mystery-to-me/
It seems if had been on target of landing crew on Moon, we could have gotten some answers.
Moon’s surface holds a record of billions of years, and it could be read.
This leads to a fundamental question I have. If we assume for the sack of discussion that increasing CO2 is increasing the greenhouse effect, does that also mean that instability in the atmosphere is increasing, or is the whole atmosphere warming at the same rate? If instability is increasing will that only affect thunderstorms, or all types of rain events such as frontal passage?
I can see three possible scenarios. Instability in the atmosphere is increasing, staying the same, or decreasing leading to more likelihood of severe rain events, the same, or less likelihood.
That would be for the “sake” of discussion. How did I write sack? Sorry!
Dr Spencer
You’ve described a random distribution of extreme events over time. This assumes that climate change is not affecting extreme events and makes a good null hypothesis.
The alternative hypothesis would be that the frequency and/or intensity of extreme events is changing over time.
How would you test which of the two hypotheses is happening?
How would you test that the frequency or intensity of extreme events is changing over time?
Basic statistics are the only way to verify such claims. In statistics, you’d usually need a large sample set, typically a thousand events.
The data is proving the null hypothesis. See the examples shown in the article.
” The data is proving the null hypothesis. ”
At present there’s not enough evidence to be confident in either direction.
The problem is that the sample size is not yet large enough to make a significant choice between the two hypotheses.
.
Until the data shows otherwise, the only valid assumption is the null hypothesis.
“The data is proving the null hypothesis.”
Failing to disprove the null does not prove the null.
Statistics 101.
“Until the data shows otherwise, the only valid assumption is the null hypothesis.”
Absolutely wrong.
“In a hypothesis test, failing to reject the null hypothesis means that we do not have enough evidence to support the alternative hypothesis. However, it does not imply that the null hypothesis is true. Reasons behind failing to reject the null hypothesis include the actual truth of the null hypothesis, small sample size, errors in data collection or measurement, and a stringent choice of significance level. It is crucial to consider these factors and the limitations of hypothesis testing when interpreting the results of a study.”
https://www.vaia.com/en-us/textbooks/math/statistics-learning-from-data-2-edition/chapter-10/problem-84-explain-why-failing-to-reject-the-null-hypothesis/
Entropic man says:
Dr Spencer Youve described a random distribution of extreme events over time. This assumes that climate change is not affecting extreme events and makes a good null hypothesis.
The alternative hypothesis would be that the frequency and/or intensity of extreme events is changing over time.
–
How would you test which of the two hypotheses is happening?
–
EM You miss the point.
You made a hypothesis out of the fact that the frequency and/or intensity of extreme events is changing over time.
The alternative [opposite] hypothesis is not what Dr Spencer was describing.
The alternative hypothesis in your words would be the frequency and/or intensity of extreme events never changes over time.
Which one hopes you would realize is impossible.
Read his words again.
“Im not claiming that all severe weather is due to randomness. Only that there is a huge random component to it, and thats what makes attribution of any kind of severe weather event to climate change essentially impossible.”
angech says:
October 22, 2024 at 5:19 PM
Entropic man says:
“Dr Spencer You’ve described a random distribution of extreme events over time. This assumes that climate change is not affecting extreme events and makes a good null hypothesis.”
–
Rubbish.
Needs saying.
–
Dr Spencer would agree with the hypothesis “that the frequency and/or intensity of extreme events is changing over time” with the caveat “in a random manner”.
How would you test this hypotheses is happening?
Read his words again.
Im not claiming that all severe weather is due to randomness. Only that there is a huge random component to it, and that’s what makes attribution of any kind of severe weather event to climate change essentially impossible.
Entropic man says:
“The fact is the frequency and/or intensity of extreme events is changing over time.”
“How would you test this fact is happening?”
–
One could look out the window.
12 hours of sun.
12 hours of dark.
Large temperature drop and rise over a mere 24 hours.
Now that is extreme yet changes over a short time interval.
Angech
You force me to be pedantic.
I said “The alternative hypothesis would be that the frequency and/or intensity of extreme events is changing over time.”
The word ” fact” never appeared.
Perhaps you would prefer “The alternative hypothesis would be that there is an increasing trend in the frequency and/or intensity of extreme events over time.”
I might even add the codicil “due to anthropogenic global warming”.
Entropic Man, if you were being pedantic then you would have used “an” not “The” to describe your preferred alternative hypothesis. Which makes you a total Willard for your strawman argument.
Thank you for bringing some reality to all the alarmism, Dr. Spencer.
About 20 years ago, I saw a similar approach used with the stock market. A 100 year chart of weekly price ranges could be prepared from the same statistics as the real values. Within that chart, there were clear up and down trends.
Randomness is a science of its own, often called “Chaos Theory”.
https://en.wikipedia.org/wiki/Chaos_theory
Read your own link.
Chaotic systems such as climate tend to stable states known as strange attractors. Conditions will oscillate unpredictably around that value, but large samples will form a frequency distribution bell curve.
When you force conditions away from one strange attractor conditions become more unstable and the extremes of the bell curve become more likely.
At some critical point the system tips over to a new strange attractor and a new frequency distribution.
This may be happening to our climate. We are forcing our climate away from the Holocene interglacial attractor (true temperature 14C) towards the next warmer attractor (19C?) and seeing the instability expected during the change.
If I understand your point, Dr Spencer explained that the 100 year events are occurring at different places. So the question has to be whether there are more 100 year events relative to the number of places these events might be recorded. For example, Las Vegas, Nevada was mostly open desert 100 years ago, so a 100 year record is meaningless. Only forty years ago, the airport at Las Vegas was literally out in the desert. Now the city has grown up around it. On the other hand, more 100 year events in the same place where there is a long record with little change in the hydraulic character could be statistically significant.
Sorry Ent, but you’re wrong again.
Earth’s climate is only chaotic within a certain range. The range is limited by the Laws of Thermodynamics. It’s called a “control system”.
You’ll get to see an example of the control when temperatures return to 288K over the next few years as the HTE fades completely.
You’ve got to learn that your beliefs ain’t science.
We? really?how do you reach that conclusion?
I would that politicians making false claims about climate change should be forced to read articles like this one.
On the west coast of BC we’ve had an atmospheric river event. The usual crap artists are making the false claims … and unfortunately too many people believe. Its just Grand Popular Delusion in the tradition of Charles MacKay.
Great article! Thank you for taking the time and effort to publish material such as this article. I get so tired of everything being an existential crisis.
“A recent masters thesis examining flood deposits in the banks of the French Broad River over the last 250-300 years found that a flood in 1769 produced water levels approximately as high as those reported in the recent flood from Hurricane Helene”
Or as the press would have it, “unprecedented since 1769”.
“There are five operational dams in the French Broad River basin, including three on the French Broad River, one on Ivy Creek, and one on the Pigeon River.”
Were there 5 dams present in 1769?
That was the reason for all the TVA dams. Control the flooding and provide jobs and cheap power.
From the North Carolina State Climate Office:
“It’s no coincidence that these extreme events are becoming both more common and more intense”
Unpresented since 1769.
‘unprecedented’
Ark finds articles about fears of “increases in atmospheric water vapor content”, yet he denies the HTE.
To call something a 100 year flood causes many people to think it can only happen once in 100 years. I found it helpful to also say “what this means is there is a 1% chance your house will be destroyed this year”
Dr Roy,
First a couple notes about statistics. These are kind of technical and don’t address your overall point.
1) “Simply put, the lowest precipitation amounts are the most frequent, and the highest amounts are the least frequent.”
Not quite. In the log-normal distribution, the lowest values drop to zero probability. There is some intermediate value that is actually most common (around 0.37 for the standard log-normal distribution), and then the higher values drop and become less and less frequent.
2) This paper suggests that other distributions are better than log-normal. Simulations with other distributions https://hess.copernicus.org/articles/22/6519/2018/
3) That paper also says these fits are for “wet-day precipitation” which is only about 1/3 of the days in NC, so your excel simulation should only have ~ 120 points per year for the days when it actually rains. (Or alternately, your “500 years” would more accurately be “1500 years”)
**************************************************
Back to your key point, which seems to be: “Im not claiming that all severe weather is due to randomness. Only that there is a huge random component to it, and thats what makes attribution of any kind of severe weather event to climate change essentially impossible.”
This seems flawed on two counts.
1) I don’t recall scientists ever definitively attributing an single extreme event to climate change, but rather discussing probabilities; that a particular extreme event is more likely with climate change.
For example with North Carolina: “For the Appalachian region, where rainfall events this severe don’t appear in our records, they are likely to now be a once-in-every-70-years event thanks to climate warming (with an uncertainty of between 20 and 3,000 years).”
https://arstechnica.com/science/2024/10/helenes-carolina-rainfall-made-70-percent-more-likely-by-climate-change/
2) The field of statistics is quite mature and even with ‘a huge random component’ small underlying trends or changes can often be robustly distinguished. Your statements like “looks like something we could attribute to drought” or “Im sure someone could tie that to global warming” or “shows an seemingly increasing incidence of days with the heaviest rainfall” seem overly pessimistic. There are ways to statistically analyze the data which are much more robust than ‘looks like it could just be random’.
Folkerts, what a lot of meaningless blah-blah.
You’ve been able to completely avoid Dr. Spencer’s point. You reveal yourself when you mention that scientists are discussing probabilities. That’s what is done in randomness.
I think I can make the case that this is circular logic. We do not have actual data “with and without the carbon dioxide we’ve added to the atmosphere”. We have only the measured data that is known to have other effects such as ENSO cycles and various ocean cycles. Have these models correctly removed every effect other than CO2? Or, are they calibrated to the measured data assuming 100% attribution to increasing CO2 levels? If so, then the calibration is faulty. There is no reliable modeling without reliable calibration.
From your link:
[The quick analysis was done by the World Weather Attribution project, which has developed peer-reviewed methods of looking for the fingerprints of climate change in major weather events. In general, this involves identifying the key weather patterns that produced the event and then exploring their frequency using climate models run with and without the carbon dioxide we’ve added to the atmosphere.]
But this level has occurred before.
Two other germane comments.
1) The data collected for the master’s thesis referenced in the top post is perhaps 60-80 miles downstream from Asheville, which means we don’t have a direct comparison. We all know that flooding can change dramatically over 60 miles of a river.
2) The thesis also ties earlier large floods to the end of the Little Ice Age, in statements like “This event also corresponds well with the ending of the LIA, again supporting the idea that extreme floods are occurring during periods of climate transition.” and
“flood magnitude has likely decreased over time since the 1700s.”
To get this sort of flooding in a climate era of decreased flooding makes it all the more interesting and exceptional.
Here’s something that isn’t random:
https://bsky.app/profile/oremus.bsky.social/post/3l76on5kfrb24
Have a gift link.
As said in the comments
“Respectfully, if I have to enter my email in order to read this, its not a gift link.”
It’s a gift link when you enter an email address.
We have not been around long enough with reliable global weather data to claim what is normal and what is not. We have only been studying globality since the late 1980’s when Hansen began the hysteria in North America about climate change.
The PDO was not discovered till 1977, when it was first called the Great Pacific Climate Shift. The acronym PDO was coined in the 1990s to replace it. The AMO was not discovered till 1994. ENSO was not discovered till the late 1960s and terms like La Nina were coined only in the 1980s. ENSO is intertwined with the PDO yet no one knew that till recently.
Essentially, we know little about the drivers of long term weather and climate. Tsonis et al did a study that concluded we should stop pursuing the climate change ideology and start examining how the ocean oscillations interact. His study revealed that when the oscillations are in phase, the planet warms and when out of phase, it cools.
Anyone else getting a 403 FORBIDDEN when posting from Firefox?
I have some questions. What if climate change actually is real and already happening? What if solid evidence of a climate change “signature” existed? How many skeptics are ready to accept that, and how many will just think it is more hype?
I am reminded of Aesop and The Boy Who Cried Wolf. I am not accusing anyone of being dishonest, but at times it seems that the hype is just out of control. There clearly are those in the science community who are pushing an agenda. Some in the news media are obsessed with climate stories, and the news story lead-in stating that “with climate change we can expect”…
There have been many predictions that have failed already. I think lower Manhattan was supposed to be flooded by now. This Hurricane Helene flooding story seems to fall into the rallying cry that no good tragedy should go to waste.
My biggest concern is the hype that “we must act now while we still have a chance to prevent the worst effects”. That is the worst kind of hype, but it reveals the agenda. No serious observer can possibly think that China is influenced by these claims.
India is very close to Russia and most likely getting a discount on crude oil. They have a long way to go in their journey to become an economic powerhouse, but they have that ambition and their need for energy will increase.
Anyone who is genuinely concerned about carbon emissions should be pushing forcefully for the next generation of nuclear power technologies. Instead, many environment organizations remain strongly opposed to nuclear power.
The fact remains that humanity is doing a massive science experiment on the ability of the earth to accommodate increased CO2 in the atmosphere. It is not the established industrial countries that are the main drivers anymore. It is the developing nations that want to have some of the economic power and comforts we have. The producing countries that want the cash flow from their carbon resource are leading the charge. Any different point of view seems to be either incompetent or dishonest from my perspective. Take your pick.
“we must act now while we still have a chance to prevent the worst effects.”
It is more like ramp up to renewables soon, over a reasonable short period.
Because the atm does not recover easily from extra CO2. And more warming produces more, and ice sheet loss becomes irreversible.
The game has been revealed Nate. Climate change is pure hype. If responsible people want to reclaim the topic, they need to start being honest and rational. If it is a statistical game with computer simulation as its driving force, then admit that. Don’t talk about certainty based on “consensus”.
The notion that humanity will just cover the world with solar panels and windmills that only have a service life of 20 to 30 years, and then install massive batteries in every home and business, is just nuts. It makes no sense.
Whatever effect is going to happen from increasing CO2 will be driven by the 85% of the world’s population that live outside the first world countries. Anyone who really believes there is a climate crisis or emergency needs to act with the same urgency to promote nuclear power. That is the only ration answer.
The only other alternative is a massive reduction in the comfort and standard of living that is possible with fossil fuel. What a minute. Is that the real objective? Do people think we have too much comfort and freedom of travel in our lives?
“The only other alternative is a massive reduction in the comfort and standard of living that is possible with fossil fuel.”
The usual strawman and black and white thinking from you.
Tim in 1840:
“The notion that humanity will just cover the world with rails that only have a service life of 20 to 30 years, and then put dozens of engines and railroad cars in every town is nuts”
Tim 1900: same but with roads and cars or power-plants and power lines.
It always sounds nuts to those like Tim lacking imagination or having a vested interest in the status quo.
Let the record show that Nate is grasping at straws — possibly from that imaginary strawman he sees.
It is all in good fun Nate. I realize you are compelled to do this, but we could have a rational discussion if you really want. I will accept the fact that you do not really have a defense for the hype in climate. It may work for the general public, but I think respect for science and the scientific process loses in the long run. I remember a guy named Dr Dean Edell who did a nationally syndicated radio call-in show about health in the 1990’s.
“A major claim requires a major proof.”
We have this from Nate:
[The only other alternative is a massive reduction in the comfort and standard of living that is possible with fossil fuel.
The usual strawman and black and white thinking from you.]
Here is the full quote. Isn’t it strange that they like to take things out of context.
[The only other alternative is a massive reduction in the comfort and standard of living that is possible with fossil fuel. What a minute. Is that the real objective? Do people think we have too much comfort and freedom of travel in our lives?]
So I did a search to see if there is any truth to my assertion about the real climate agenda, and I found this:
https://insideclimatenews.org/news/11022023/warming-trends-world-without-fossil-fuels/
[What, then, can be done? Stoll asks, near the end of the book. How do we get off the treadmill of consumer capitalism, when so much of modern life as its currently configured depends on it? How do we design a different future, when capitalisms greed seems so embedded in human nature? The best we can do is to focus on the people who are trying to come up with solutions, Stoll said in our interview.
For ideas about how to exit what Stoll calls the accelerating merry-go-round, we might look to reformers, visionaries, inventors, philosophers, Indigenous leaders and artists of the past and present. We might also remember that adaptation, compassion and creativity are deeply ingrained in human nature, too. Maybe oil companies cant imagine a world without an endless supply of petroleum productsbut that doesnt mean it isnt possible.]
Tim proves that it is always possible to find extremist views in any field.
Nate proves that he will call out and stereotype opinions he does not like, but does not want to own the opinions of people on his side.
I say again, politics is a dirty business. Hypocrisy is never good. If use of a stereotype for one side is wrong, then it should not be used for any side.
Hyperbole is ok. Strawmen are ok. Misrepresenting your opponents views is ok. Because whataboutism is ok.
“The notion that humanity will just cover the world with solar panels and windmills that only have a service life of 20 to 30 years, and then install massive batteries in every home and business, is just nuts. It makes no sense.”
Your man Elon is betting heavily on utility-scale battery storage.
https://www.tesla.com/megapack
Even subsidized all these years, nuclear is more expensive.
Have you lost faith in capitalism to choose the best way to address this need?
“What if climate change actually is real and already happening? What if solid evidence of a climate change signature existed? How many skeptics are ready to accept that, and how many will just think it is more hype?”
Here in Campbell River our City government has drunk the koolaid. The City claims there will be 1 meter sea level rise by 2100. The source of the claim has provenance of several documents that ultimately are derived from UN IPCC claims of doom.
The City ignores the tide gauge data. The NOAA compilation shows sea level is dropping 1.82 mm per year since the gauge was installed mid 1960s. Land is rising twice as fast as the global sea level rise of 1.8 mm per year.
So why did the City spend a gazillion dollars improving our waterfront? The claim is to protect low lying areas, already prone to flooding, (aka land that should never have been built on) from Sea Level Rise of 1 meter by 2100. Note that most of the land being protected is private ownership of waterfront that most of us cannot afford.
“I am not accusing anyone of being dishonest, but at times it seems that the hype is just out of control.”
I am accusing the whole polyglot of bureaucrats pushing the climate change narrative of being dishonest. Not just a little bit dishonest but flat out malfeasant.
Thanks, Tim. You say:
“What if climate change actually is real and already happening?”
Umm climate has been changing since there was climate, so clearly it’s real and actually happening.
So obviously, you mean something else by “climate change”, but what that is and how we would determine if it is “real” are unanswered.
If you mean “what if there is a human effect on the climate”, obviously there is. For example, when we cut down a forest, the local climate changes.
If you mean “what if increasing CO2 is actually the secret temperature control knob”, geological records of temperature and CO2 make that unlikely.
The problem is in Willis’s First Law of Climate, which states:
“In the climate, everything is connected to everything else which in turn is connected to everything else except when it isn’t”.
And as Dr. Roy says, thats what makes attribution of any kind of severe weather event to climate change essentially impossible.
w.
> what that is and how we would determine if it is real are unanswered.
It’s AGW, and it’s answered here:
https://www.ipcc.ch/
You’ve been playing Climateball for about 20 years, Willis.
Why play the hard of hearing?
Willis sys: “If you mean what if increasing CO2 is actually the secret temperature control knob, geological records of temperature and CO2 make that unlikely.”
Wrong. “CO2 is the dominant driver of Phanerozoic climate, emphasizing the importance of this greenhouse gas in shaping Earth history.”
https://www.science.org/doi/full/10.1126/science.adk3705
Interesting to note the strong correlation between CO2 concentration and temperature over the last 70 million years.
https://skepticalscience.com/pics/CO2climateRaeetal20211600px.jpg
I wonder why?
ent…can’t help a pure ad hom reply. Skepticalscience is among the sewer dwellers of the alarmist crowd.
Gordon Robertson,
the fact that you must conjure ad hom arguments is indicative of your inability to debate scientifically.
https://www.drroyspencer.com/2024/10/florida-major-hurricanes-1900-2024-what-do-the-statistics-show/#comment-1693287
ark…this is basic science as related to quantum theory. I always specify that heat cannot be transferred, as heat, via radiation. For one, heat cannot move through a medium like space because it requires atoms to do the transfer. Certainly solar particles ejected from the Sun like protons and neutrons can transfer heat as heat but that is hardly enough to raise the temperature on Earth.
We rely on solar radiation, which is an electric field orthogonal to a magnetic field. It has no mass therefore it cannot transfer heat, as heat. What we call a transfer is a two step energy conversion from heat to EM and back to heat. At no time does thermal energy leave the Sun, move 93 millions miles to Earth and heat it as thermal energy.
Ergo, those claiming heat is trapped by GHGs in the atmosphere are misinformed. Surface heat does not move beyond the surface. If it is converted to EM/IR, at the instant of conversion, the heat is lost. There is nothing to trap with regard to heat. New heat can be created but that heat has nothing to do with surface heat.
Gordon Robertson.
Heat transfer occurs in three modes: conduction, convection, and radiation. In space, where conduction and convection are impossible due to the absence of a medium, radiation is the primary means by which energy, including thermal energy, travels. Energy transfer by radiation is one of the most well-established principles in thermodynamics.
“At no time does thermal energy leave the Sun, move 93 millions miles to Earth and heat it as thermal energy.”
An object that emits EM radiation is doing so because of its thermal energy. In fact, the EM radiation emitted is strongly dependent on the temperature of the object.
Energy is converted from thermal to radiative and back again in its journey from Sun to the Earth.
Radiation is not heat. As you rightly point out, Gordon.
Therefore, when an object (like the surface of the Earth) receives more EM radiation, it is not receiving ‘heat’. It is receiving energy, which is converted into heat.
It is the NET result of energy gained/energy lost that determines the flow of heat, and because the Earth’s surface is warmer than the atmosphere on average, heat flows from surface to atmosphere.
If energy gained by the surface from the atmosphere causes the surface to warm, that is not a transfer of heat. EM radiation is not heat.
That is a result of more energy being received at the surface, which is still warmer than the atmosphere, and therefore the flow of heat remains surface to atmosphere, even if the surface warms.
An object receiving continuous energy will warm if its rate of energy loss is slowed.
It is not until the average temperature of the surface is greater than the average temperature of the atmosphere that heat would then flow the opposite way.
“…Williss First Law of Climate, which states:
In the climate, everything is connected to everything else which in turn is connected to everything else except when it isnt”.
***
Apt comment, Willis. The word climate is currently being used in a dishonest manner and obviously aimed at scaring people.
Since weather is often descried as an average of weather, generally over a 30 year period, we need to ask what is meant by weather. In relation to climate, it generally means rainfall, or precipitation (Including snow). It’s the amount of water delivered to regions by weather systems that generally defines the climate in those regions.
Alarmists are using the word climate in reference to one-day events that produce flooding and other damage, or even severalweek events involving a heat wave. If you have a hurricane come through a region in one day, or several days, or a heat dome parked over a region, that can hardly be related to climate.
No alarmist has ever explained how such temporary events can possibly be related to a trace gas in the atmosphere. There is zero correlation.
Gordon
You are projecting your dishonesty on to others.
sig…it’s one thing to state an uncorroborated opinion and quite another to prove it using science. Rebut my statement and show why you think it is dishonest.
sig…btw… which browser are you using? I can’t post on Firefox or Opera and Nate seems to e having problems posting as well.
“[weather] generally means rainfall, or precipitation (Including snow).”
No, weather means precipitation, temperature, wind, and cloudiness. All of those are part of “weather”. Weather includes how these change from hour to hour and day to day.
“Its the amount of water delivered to regions by weather systems that generally defines the climate in those regions.””
No, again. For example, the common Kppen climate classification includes multiple factors BESIDES precipitation that define the climate.
“Since [climate] is often descried as an average of weather, generally over a 30 year period …”
Climate is more than just averages — it is also distributions. Does rain come in one season or throughout the year; in a few big storms or many little storms? Does the region experience monsoons? hurricanes? tornadoes? hail? Are temperatures fairly steady through the year, or vary widely from summer to winter?
“If you have a hurricane come through a region in one day, or several days, or a heat dome parked over a region, that can hardly be related to climate.”
Of course it is ‘related’ to climate. And related ‘both ways around’.
* The hurricane or heatwave becomes part of the data used to define the climate.
* Changing climate enhances or suppresses different events.
“No alarmist has ever explained how such temporary events can possibly be related to a trace gas in the atmosphere. ”
Water is a trace gas. I am pretty sure everyone agrees that water in the atmosphere correlates with temporary events like storms.
But even assuming you mean CO2, there is a clear connection. CO2 ‘is related to’ temperature, and temperature ‘is related to’ formation of hurricanes. Hence CO2 ‘is related to’ hurricanes.
test
Got one post in with Firefox then back to 403 Forbidden error. Tried from both W7 and W10 platforms, no difference.
Anyone else having issues? This is being posted from another browser.
Yes.
confirmed that I cannot post on Opera browser either.
Either there is DDOS attack going on, WordPress is having problems, or Roy’s site is having problems.
nate…I can post using the Tor browser.
That could mean that Cloudfront or one of the newer protection outfits is blocking WordPress or Roy’s site.
Roy,
Regarding your A Final Word About 100-Year Flood Events.
The phrase “100-Year Flood” refers to a statistical concept and does not mean that such a storm will only occur once every 100 years. It indicates that, in any given year, there is a 1% chance of a storm of that magnitude occurring.
Since probabilities do not reset each year or depend on previous years, it is possible to have multiple 1 in 100 year storms in consecutive years, or even in the same year. The occurrence of such events in one year does not affect the probability for the following year, and each year’s storm event is an independent occurrence.
When an area experiences multiple “100-Year Floods” over a short time span, it raises questions about whether underlying environmental or climatic conditions have changed, affecting the frequency and intensity of such events. This pattern might suggest that the assumptions used to calculate historical storm probabilities- based on past climate data- are no longer valid under current or evolving conditions.
“This pattern might suggest that the assumptions used to calculate historical storm probabilities- based on past climate data- are no longer valid under current or evolving conditions.”
Or valid under any circumstances.
When an area experiences multiple “100-Year Floods” over a short time span, it raises questions about whether underlying environmental or climatic conditions have changed, affecting the frequency and intensity of such events. This pattern might suggest that …
Test
VPN via UK
Here is a link to an actual study of some observed rainfall amounts.
https://agupubs.onlinelibrary.wiley.com/doi/10.1029/2018WR024067
The conclusion was in the study area the frequency of extreme events has a positive trend but he magnitude was not pronounced.
This is what science does try to do, find answers in available data.
Here is the abstract of a paper citing the paper above:
https://iopscience.iop.org/article/10.1088/1748-9326/ad300c
Insert your favorite epilogue about how science and scientists ought to work.
If x% of extra water vapor is deposited in the atmosphere, how much is the temperature reduced by that action? The science says that is what happens.
The water cycle is part of the Earth’s energy/heat flow.
Sunlight and back radiation warm the surface.
Water evaporates and soaks up latent heat to become water vapour. This cools the surface.
When the water vapour condenses into clouds the latent heat is released and warms the atmosphere.
The heat ends up radiating to space or back radiating to the surface.
Ultimately the system reaches equilibrium. The temperature of the surface depends on the amount of energy it receives and the amount of water evaporating depends on the temperature.
In practice evaporation of water is one of several processes which cool the surface. The surface temperature causes the evaporation rate, but the rate of evaporation does not, on its own, control the surface temperature.
“Water evaporates and soaks up latent heat to become water vapour. This cools the surface.”
By how much?
“The surface temperature causes the evaporation rate, but the rate of evaporation does not, on its own, control the surface temperature.”
But it does have an effect.
Of the 503W/m^2 lost by Earth’s surface about 90W/m^2 is from latent heat of vapourisation of water vapour.
All of that ultimately becomes latent heat in the atmosphere which will reradiate to space or back radiate to the surface. I doubt that the amount of evaporation makes any difference to the amount of heat lost to space.
In terms of surface temperature I note that a hot desert can reach 50C while a tropical rain forest maxes out around 30C. Evapotranspiration is cooling the surface by 20C.
I was thrilled by the blog’s wonderful response to my recent attempts to submit comments:
https://i.postimg.cc/Dz9VhjnF/403-forbidden.png
sent by
https://www.drroyspencer.com/wp-comments-post.php
Very nice indeed…
Try a VPN.
VPN in the USA.
Suggest a free VPN, RLH?
It’s obvious that someone is trying to block access to Roy’s site.
Works on Chrome, not on Firefox.
Chill.
Np, something’s up. I couldn’t post on Chrome. I had to use a VPN located in the US.
I am not in the USA.
Ah well. Not the first time there are problems here. Roy should check his error logs.
It is worth bearing in mind that there are two assumptions about the charts posted; One is obvious, that rainfall amounts follow a Lognormal distrbution ( i.e when the rainfall amounts are logged , they apppear to be normally distributed), the second is that the rainfall amounts occur randomly. The times between truly random events are exponentially distributed.
Such things are testable; monthly rainfall amounts (for Central England UK) after they have been ‘logged’ pass tests for ‘normality’
Rainfall amounts or the occurence of extremes of rainfall, can be tested with a ‘Runs test’. The rainfall series that I have looked at pass this test too 🙂
test 002
It works!
Hello from Japan!
Hello from Singapore!
OK. Specific ranges of IPs are getting banned.