
 Home/Blog
UPDATE (28 Oct. 2024): In response to concerns regarding the large amount of scatter in the data plots presented below, and the claims I make based upon those regressions, I have replaced all plots which now contain additional regression statistics. These statistics demonstrate high confidence. What many people don’t realize is that diagnosed regression slopes (and regression intercepts) can have high confidence despite low correlations (large scatter) if there are many data points. I will be posting a new article today showing an example of this.
Our paper (co-authored by John Christy and Danny Braswell) on computing the urban heat island (UHI) effect as a function of population density (PD) is now in the final stages of review after a 3rd round of edits, and I’m hopeful it will be accepted for publication soon. So far, I’ve only used Tavg data (the average of daily maximum and minimum temperatures) in developing and testing the method, and the paper uses only contiguous U.S. summertime data (June, July, August), which is what I will address here.
The method allows us to compute UHI trends using global gridded PD datasets that extend back to the 1800s. These UHI trends can then be compared to GHCN station temperature trends. If I do this for all U.S. GHCN stations having at least 120 years of complete monthly (June, July, or August) data out of 129 potential years during 1895-2023, the following plot shows some interesting results. (I begin with the “raw” data so we can then examine how homogenization changes the results.) Note the following plots have been updated to include regression statistics which demonstrate, despite low explained variances, the resulting regression slopes and intercepts have high confidence, due to the large number of data points (GHCN stations) contained in the plots.
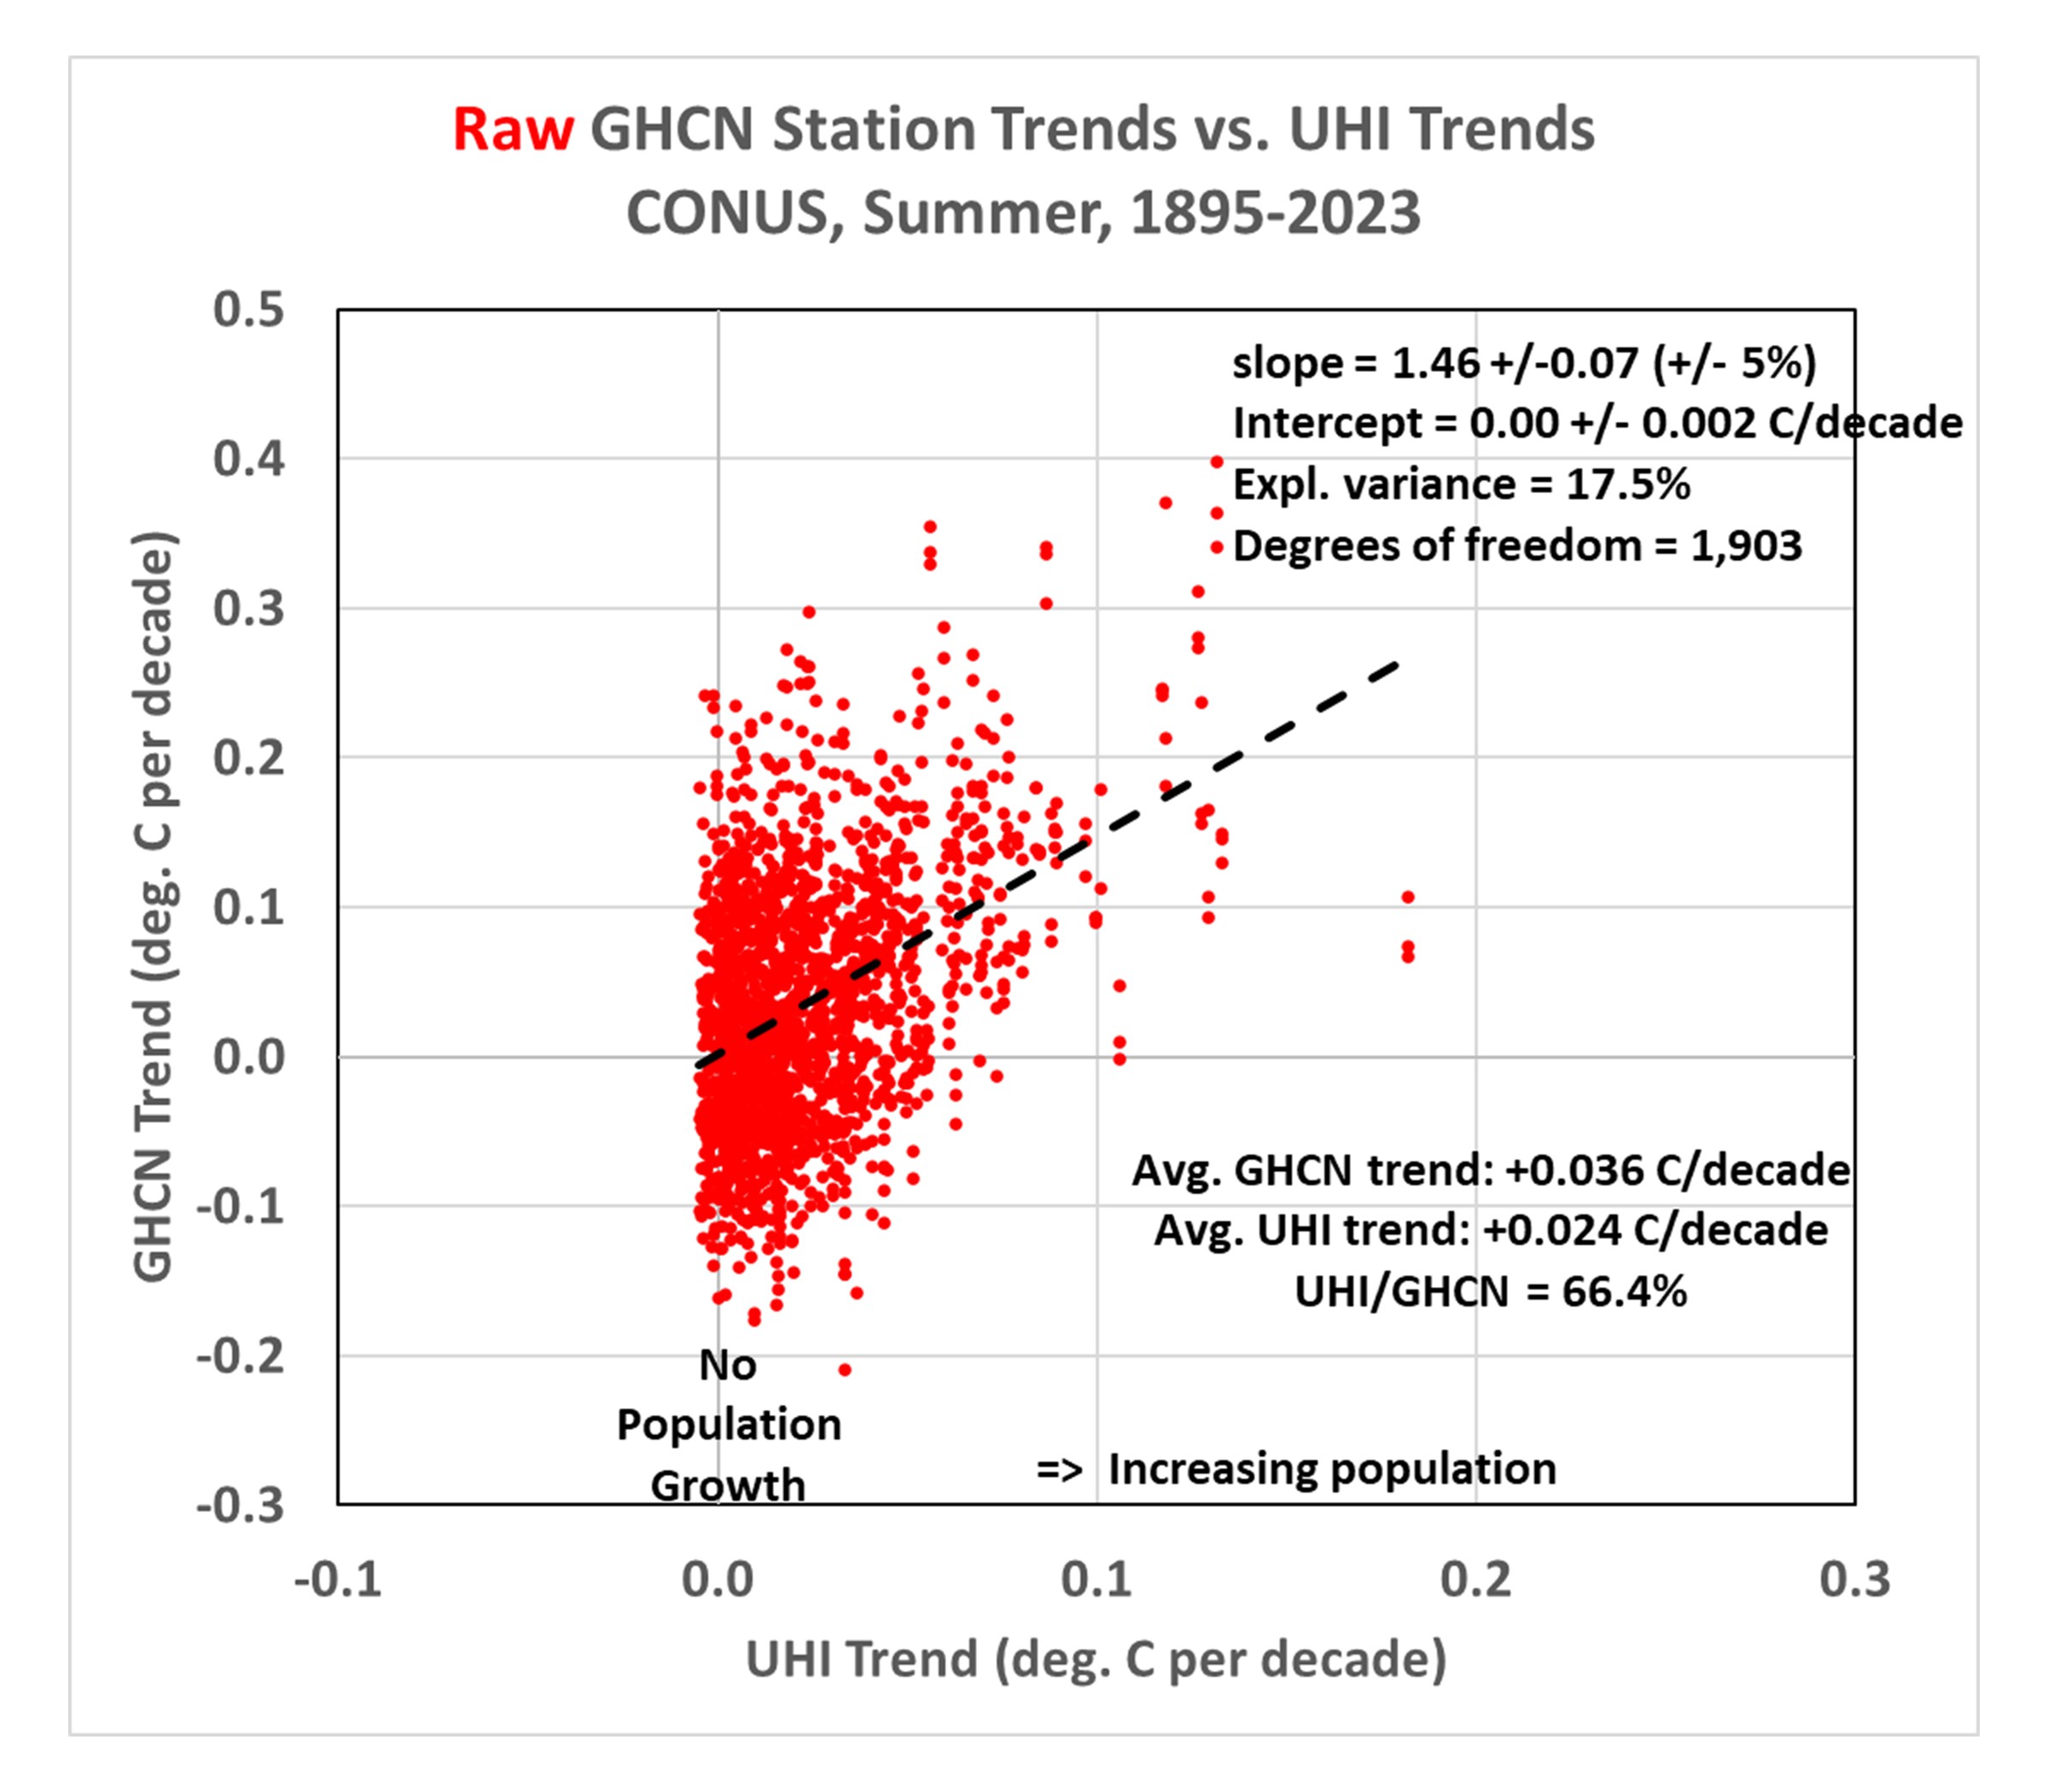
- The greater a station’s population growth, the greater the observed warming trend. This is pretty convincing evidence that the raw GHCN data has substantial UHI effects impacting the computed trends (probably no surprise here). Note the UHI temperature trend averages 66% of the raw temperature trends.
- The regression line fit to the data intercepting zero shows that those stations with no population growth have, on average, no warming trend. While this might lead some to conclude there has been no net warming in the U.S. during 1895-2023, it must be remembered these are raw data, with no adjustments for time-of-observation (TOBS) changes or instrumentation type changes which might have biased most or all of the stations toward lower temperature trends.
Since most of the rural stations (many of which have experienced little population growth) are in the western U.S., and there can be differences in actual temperature trends between the eastern and western U.S., let’s look at how things change if we just examine just the eastern U.S. (Ohio to the Florida peninsula, eastward):
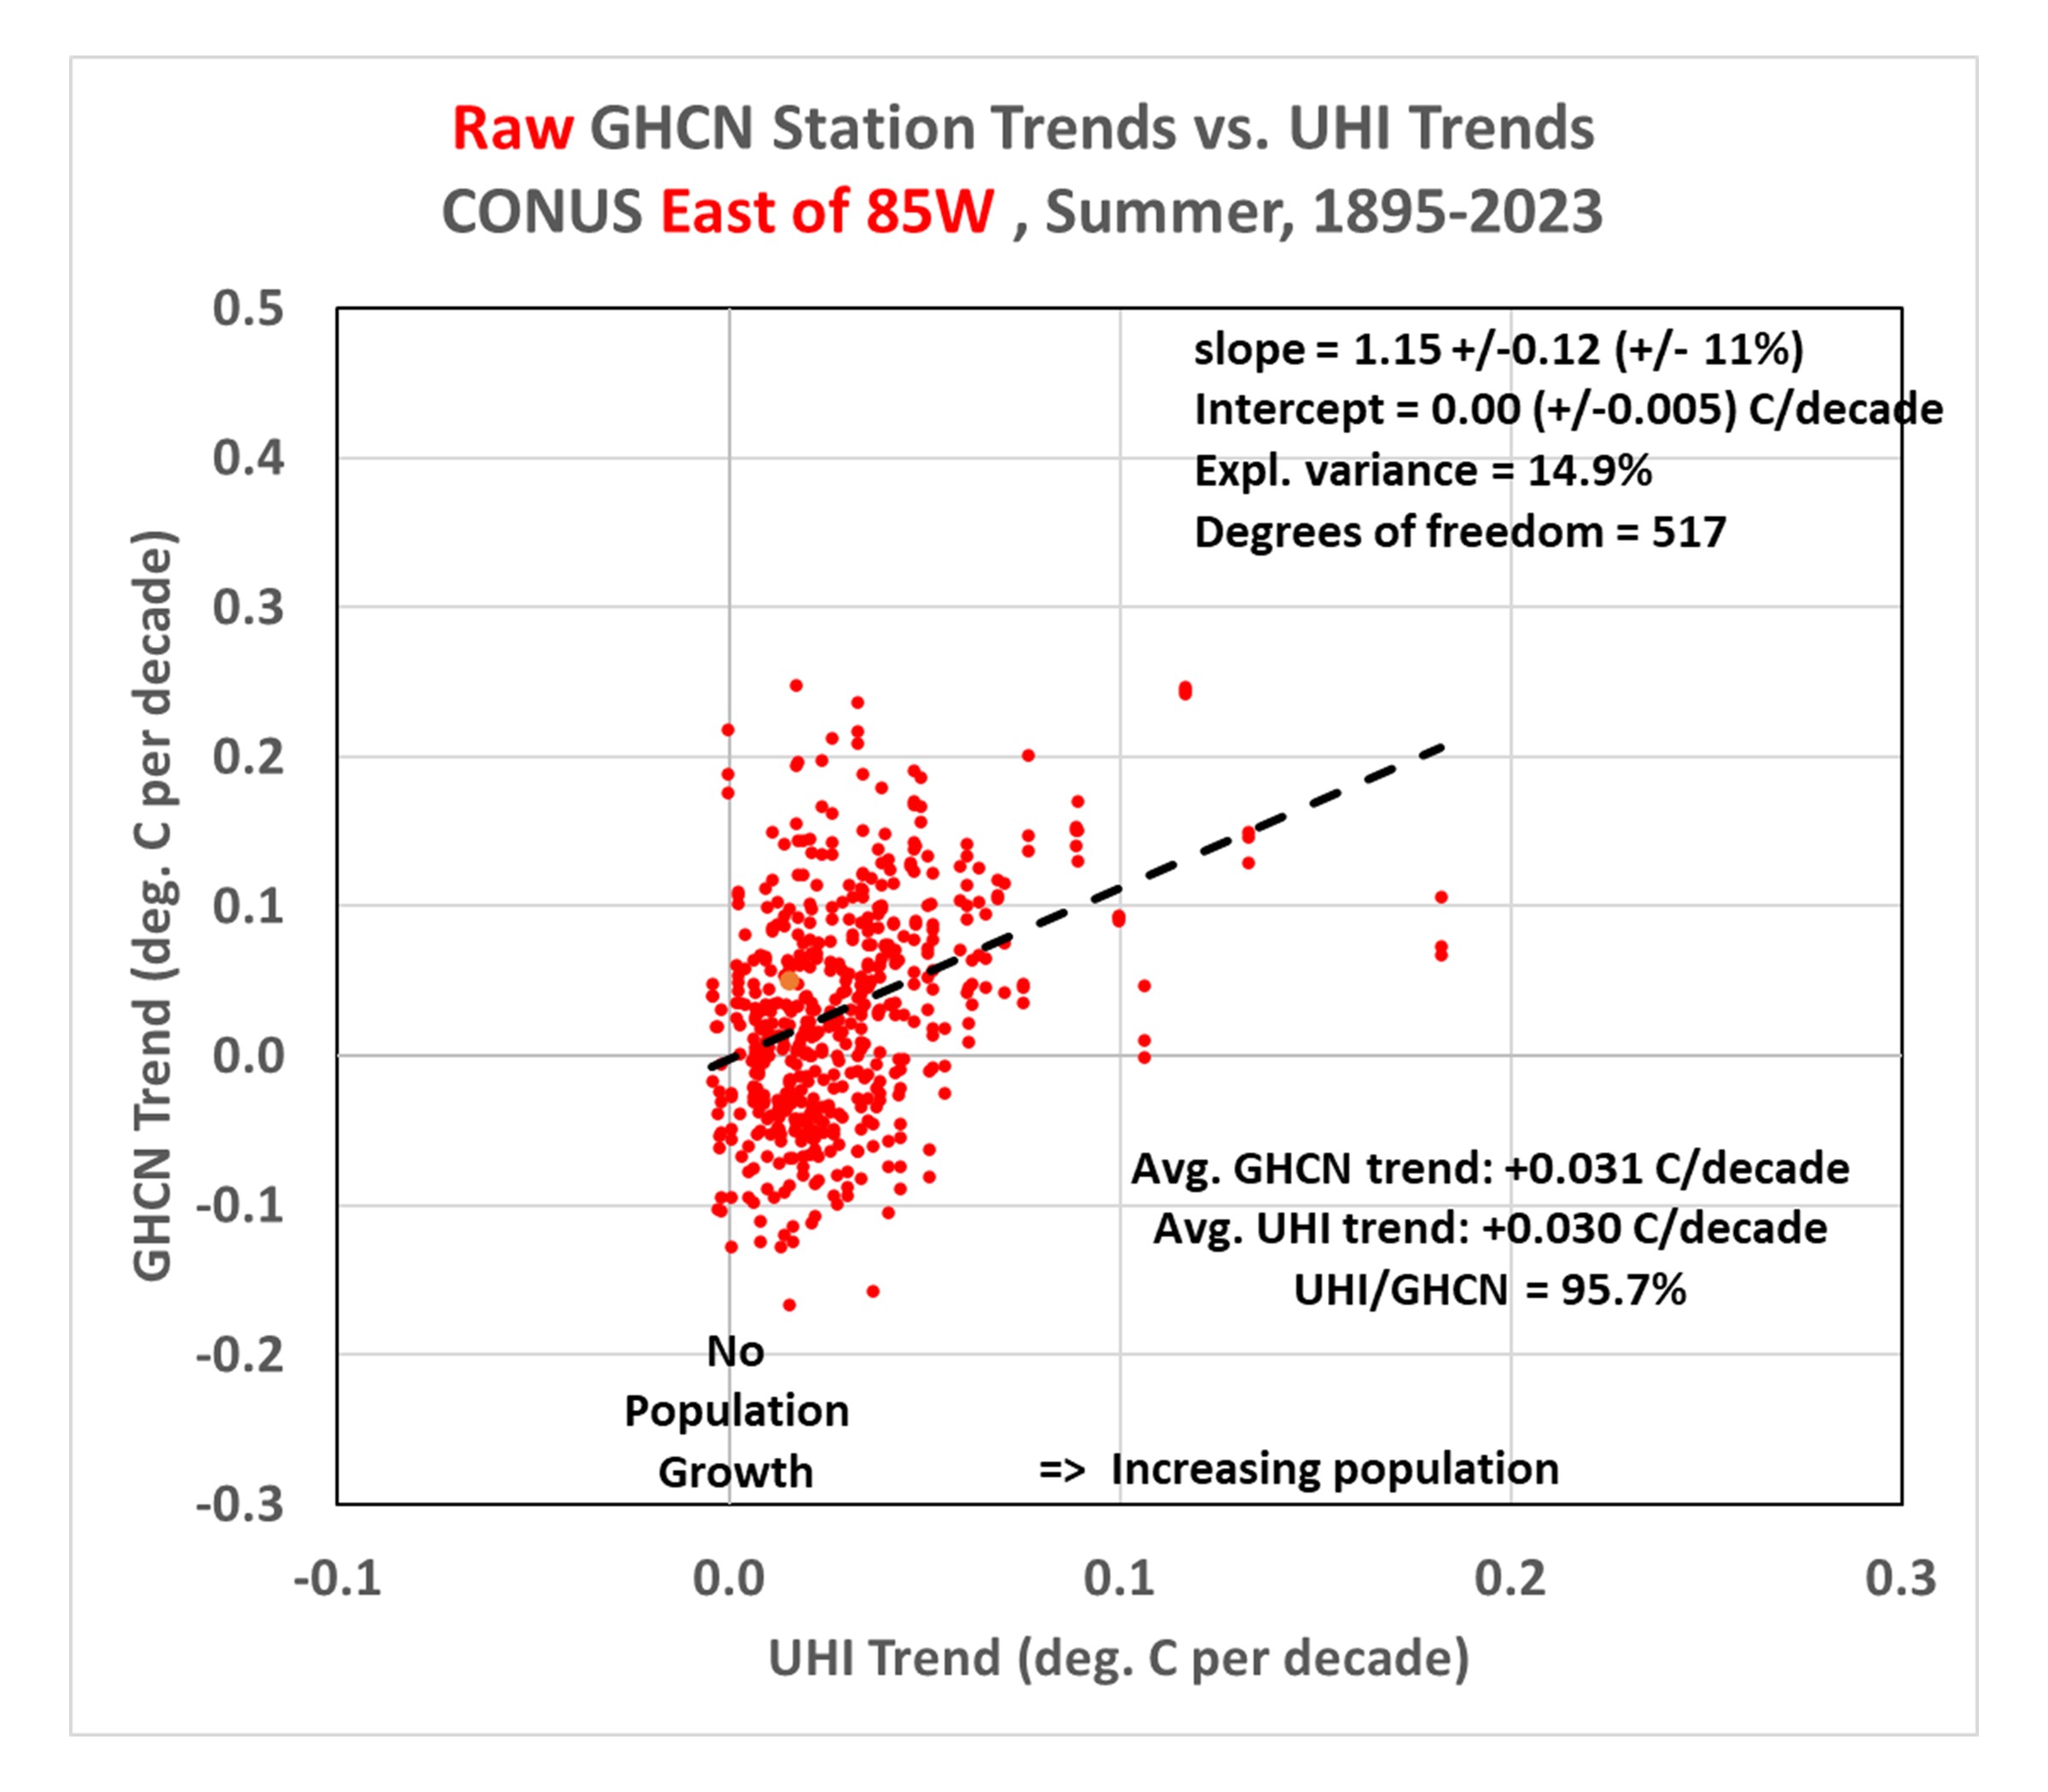
This shows the Eastern U.S. has features similar to the U.S. as a whole, with a regression line intercept of zero (again) indicating those stations with no population growth have (on average) no warming trend in the raw GHCN data. But now, amazingly, the average UHI trend is over 95% of the raw station trends (!) This would seemingly suggest essentially all of the reported warming during 1895-2023 over the eastern U.S. has been due to the urbanization effect… if there are no systematic biases in the raw Tavg data that would cause those trends to be biased low. Also, as will be discussed below, this is the the period 1895-2023… the results for more recent decades are somewhat different.
Homogenization of the GHCN Data Produces Some Strange Effects
Next, let’s look at how the adjusted (homogenized) GHCN temperature trends compare to the UHI warming trends. Recall that the Pairwise Homogenization Algorithm (PHA) used by NOAA to create the “adjusted” GHCN dataset (which is the basis for official temperature statistics coming from the government) identifies and adjusts for step-changes in time at individual stations by comparing their temperature time series to the time series from surrounding stations. If we plot the adjusted data trend along with the raw data trends, the following figure shows some curious changes.
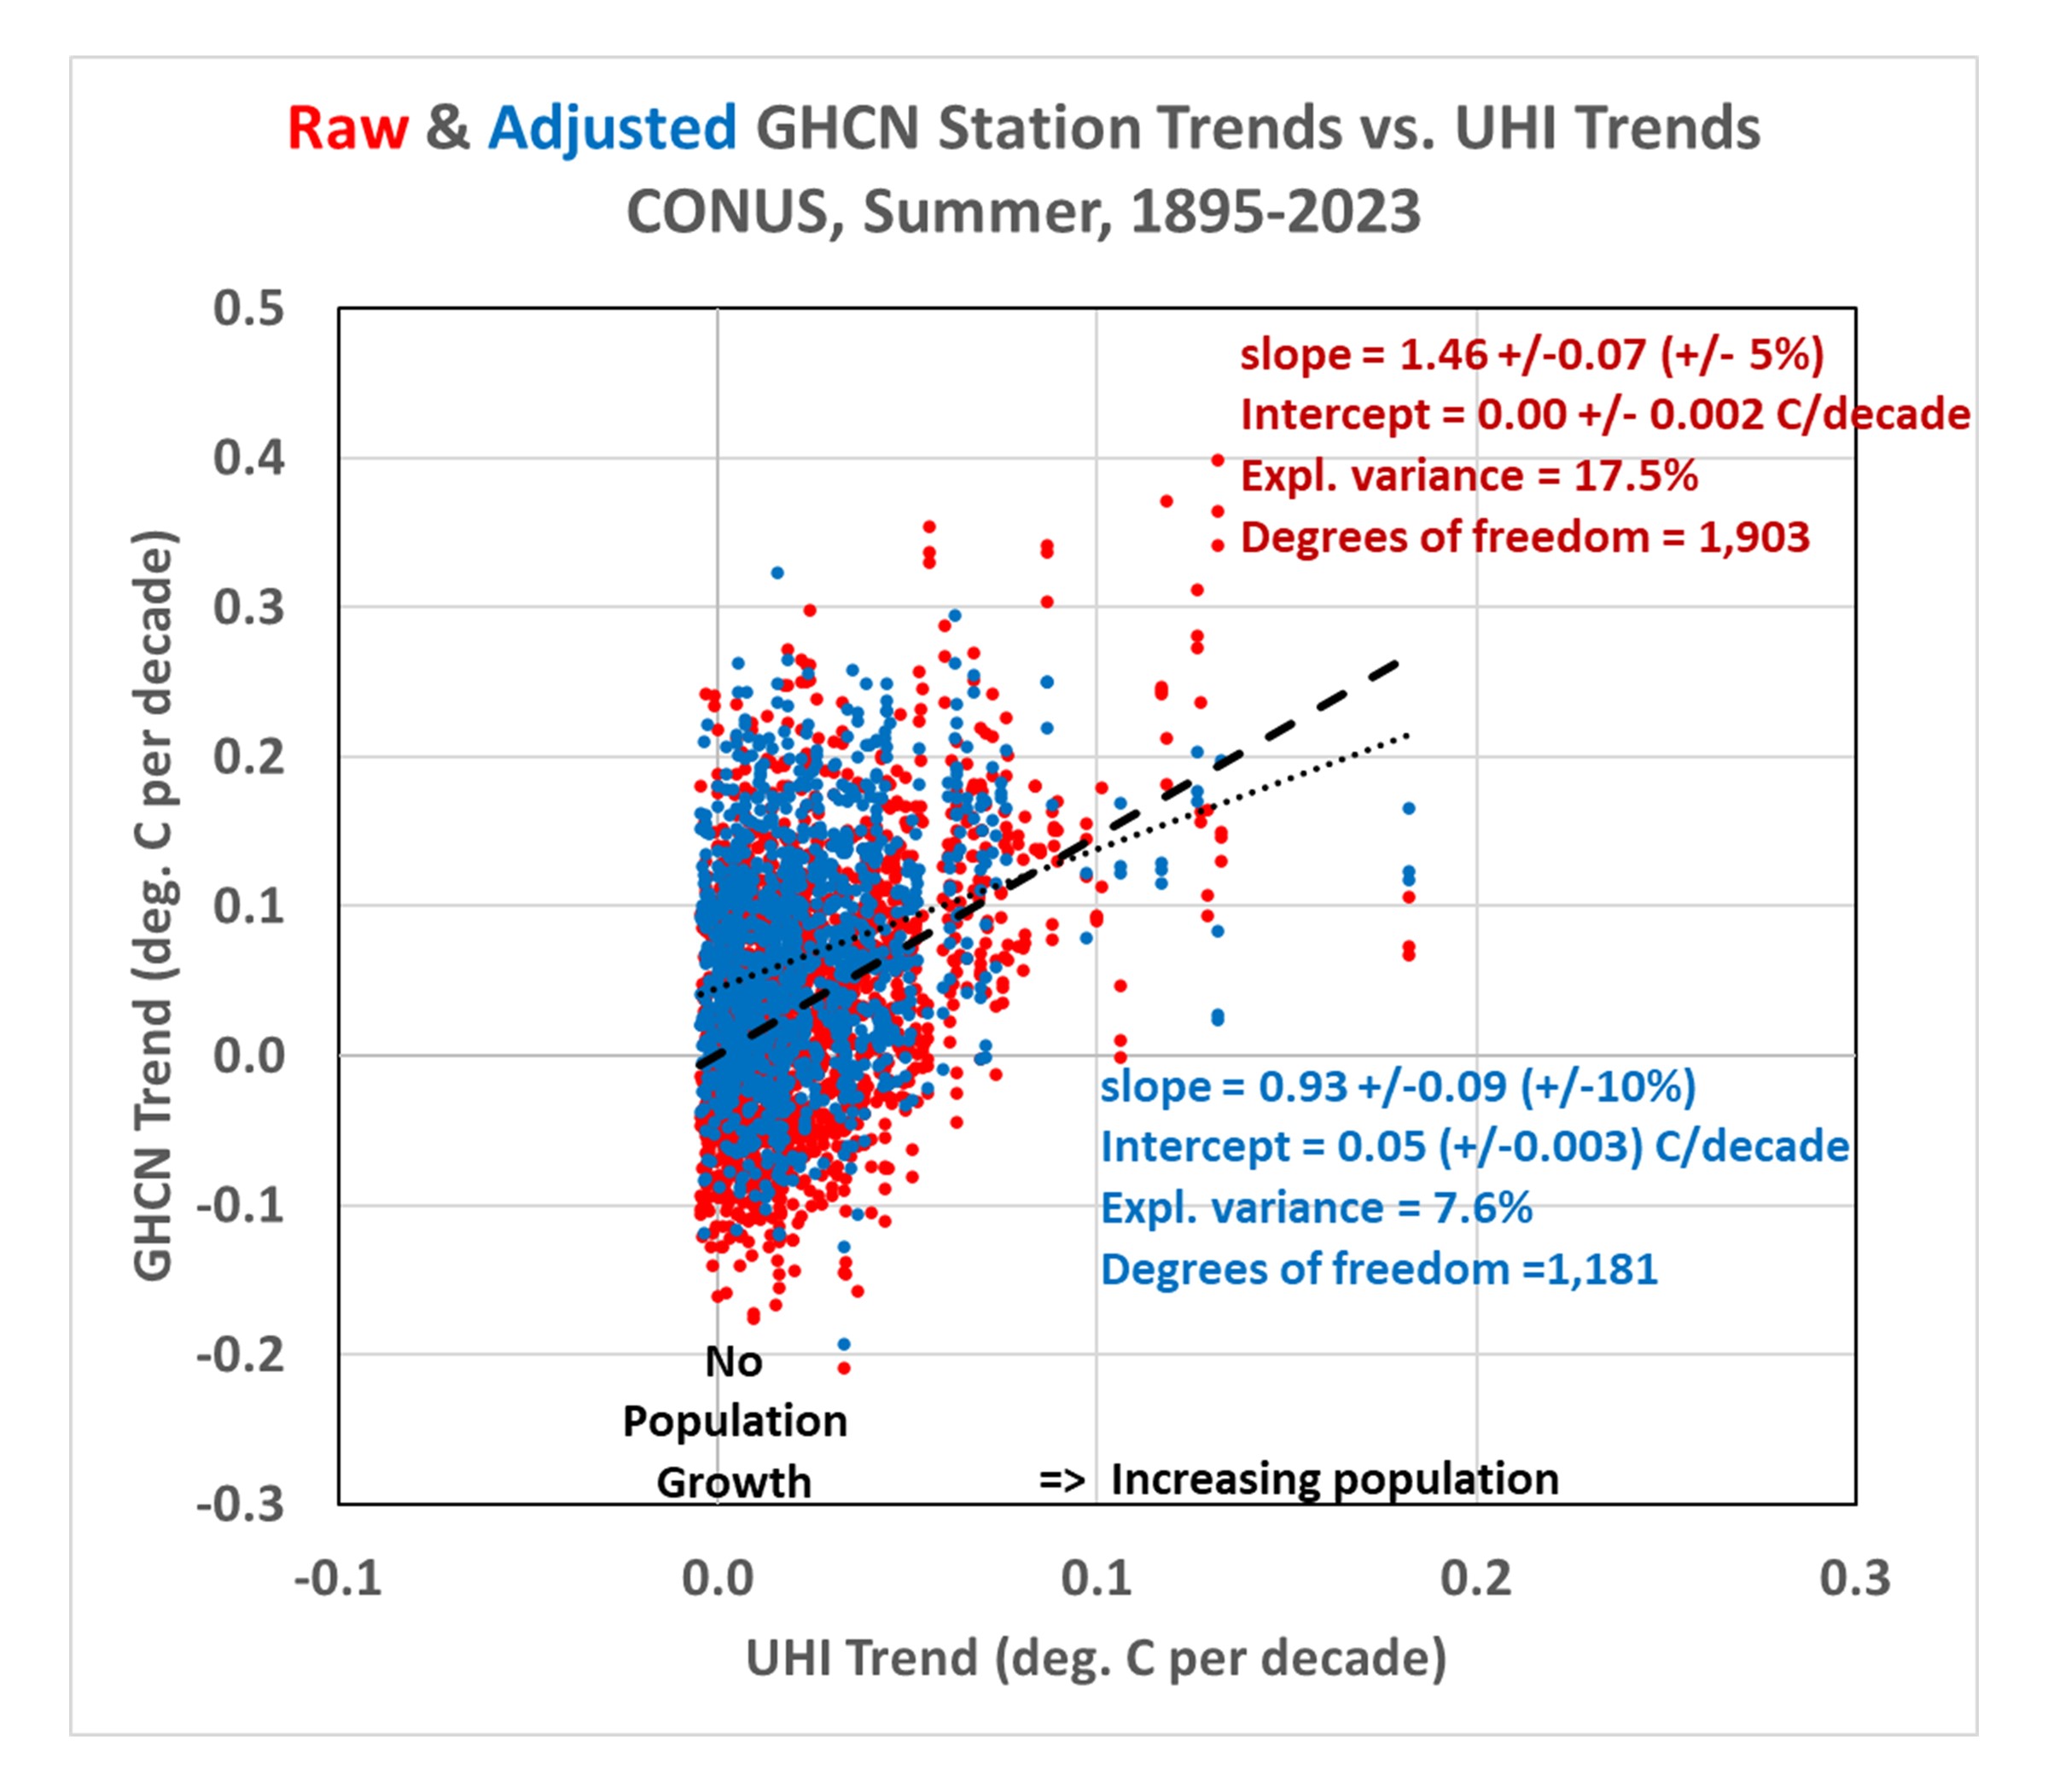
Here’s what homogenizations has done to the raw temperature data:
- Stations with no population growth (that had on average no warming trend) now have a warming trend. I can’t explain this. It might be the “urban blending” artifact of the PHA algorithm discussed by Katata et al. (2023, and references therein) whereby homogenization doesn’t adjust urban stations to “look like” rural stations, but instead tends to smooth out the differences between neighboring stations, causing a “bleeding” of urban effects into the rural stations.
- Stations with large population growth have had their warming trends reduced. This is the intended effect of homogenization.
- There still exists a UHI effect in the homogenized trends, but it has been reduced by about 50% compared to the raw trends. This suggests the PHA algorithm is only partially removing spurious warming signals from increasing urbanization.
- Homogenization has caused the all-station average warming trend to nearly double (+89%), from +0.036 to +0.067 deg. C per decade.I cannot explain this. It might be due to real effects from changes in instrumentation, the time-of-observation (TOBS) adjustment, an unintended artifact of the PHA algorithm, or some combination of all three.
Does This Mean Recent Warming In The U.S. Is Negligible?
Maybe not. While it does suggest problems with warming trends since 1895, if we examine the most recent period of warming (say, since 1961…a date I chose arbitrarily), we find considerably stronger warming trends.
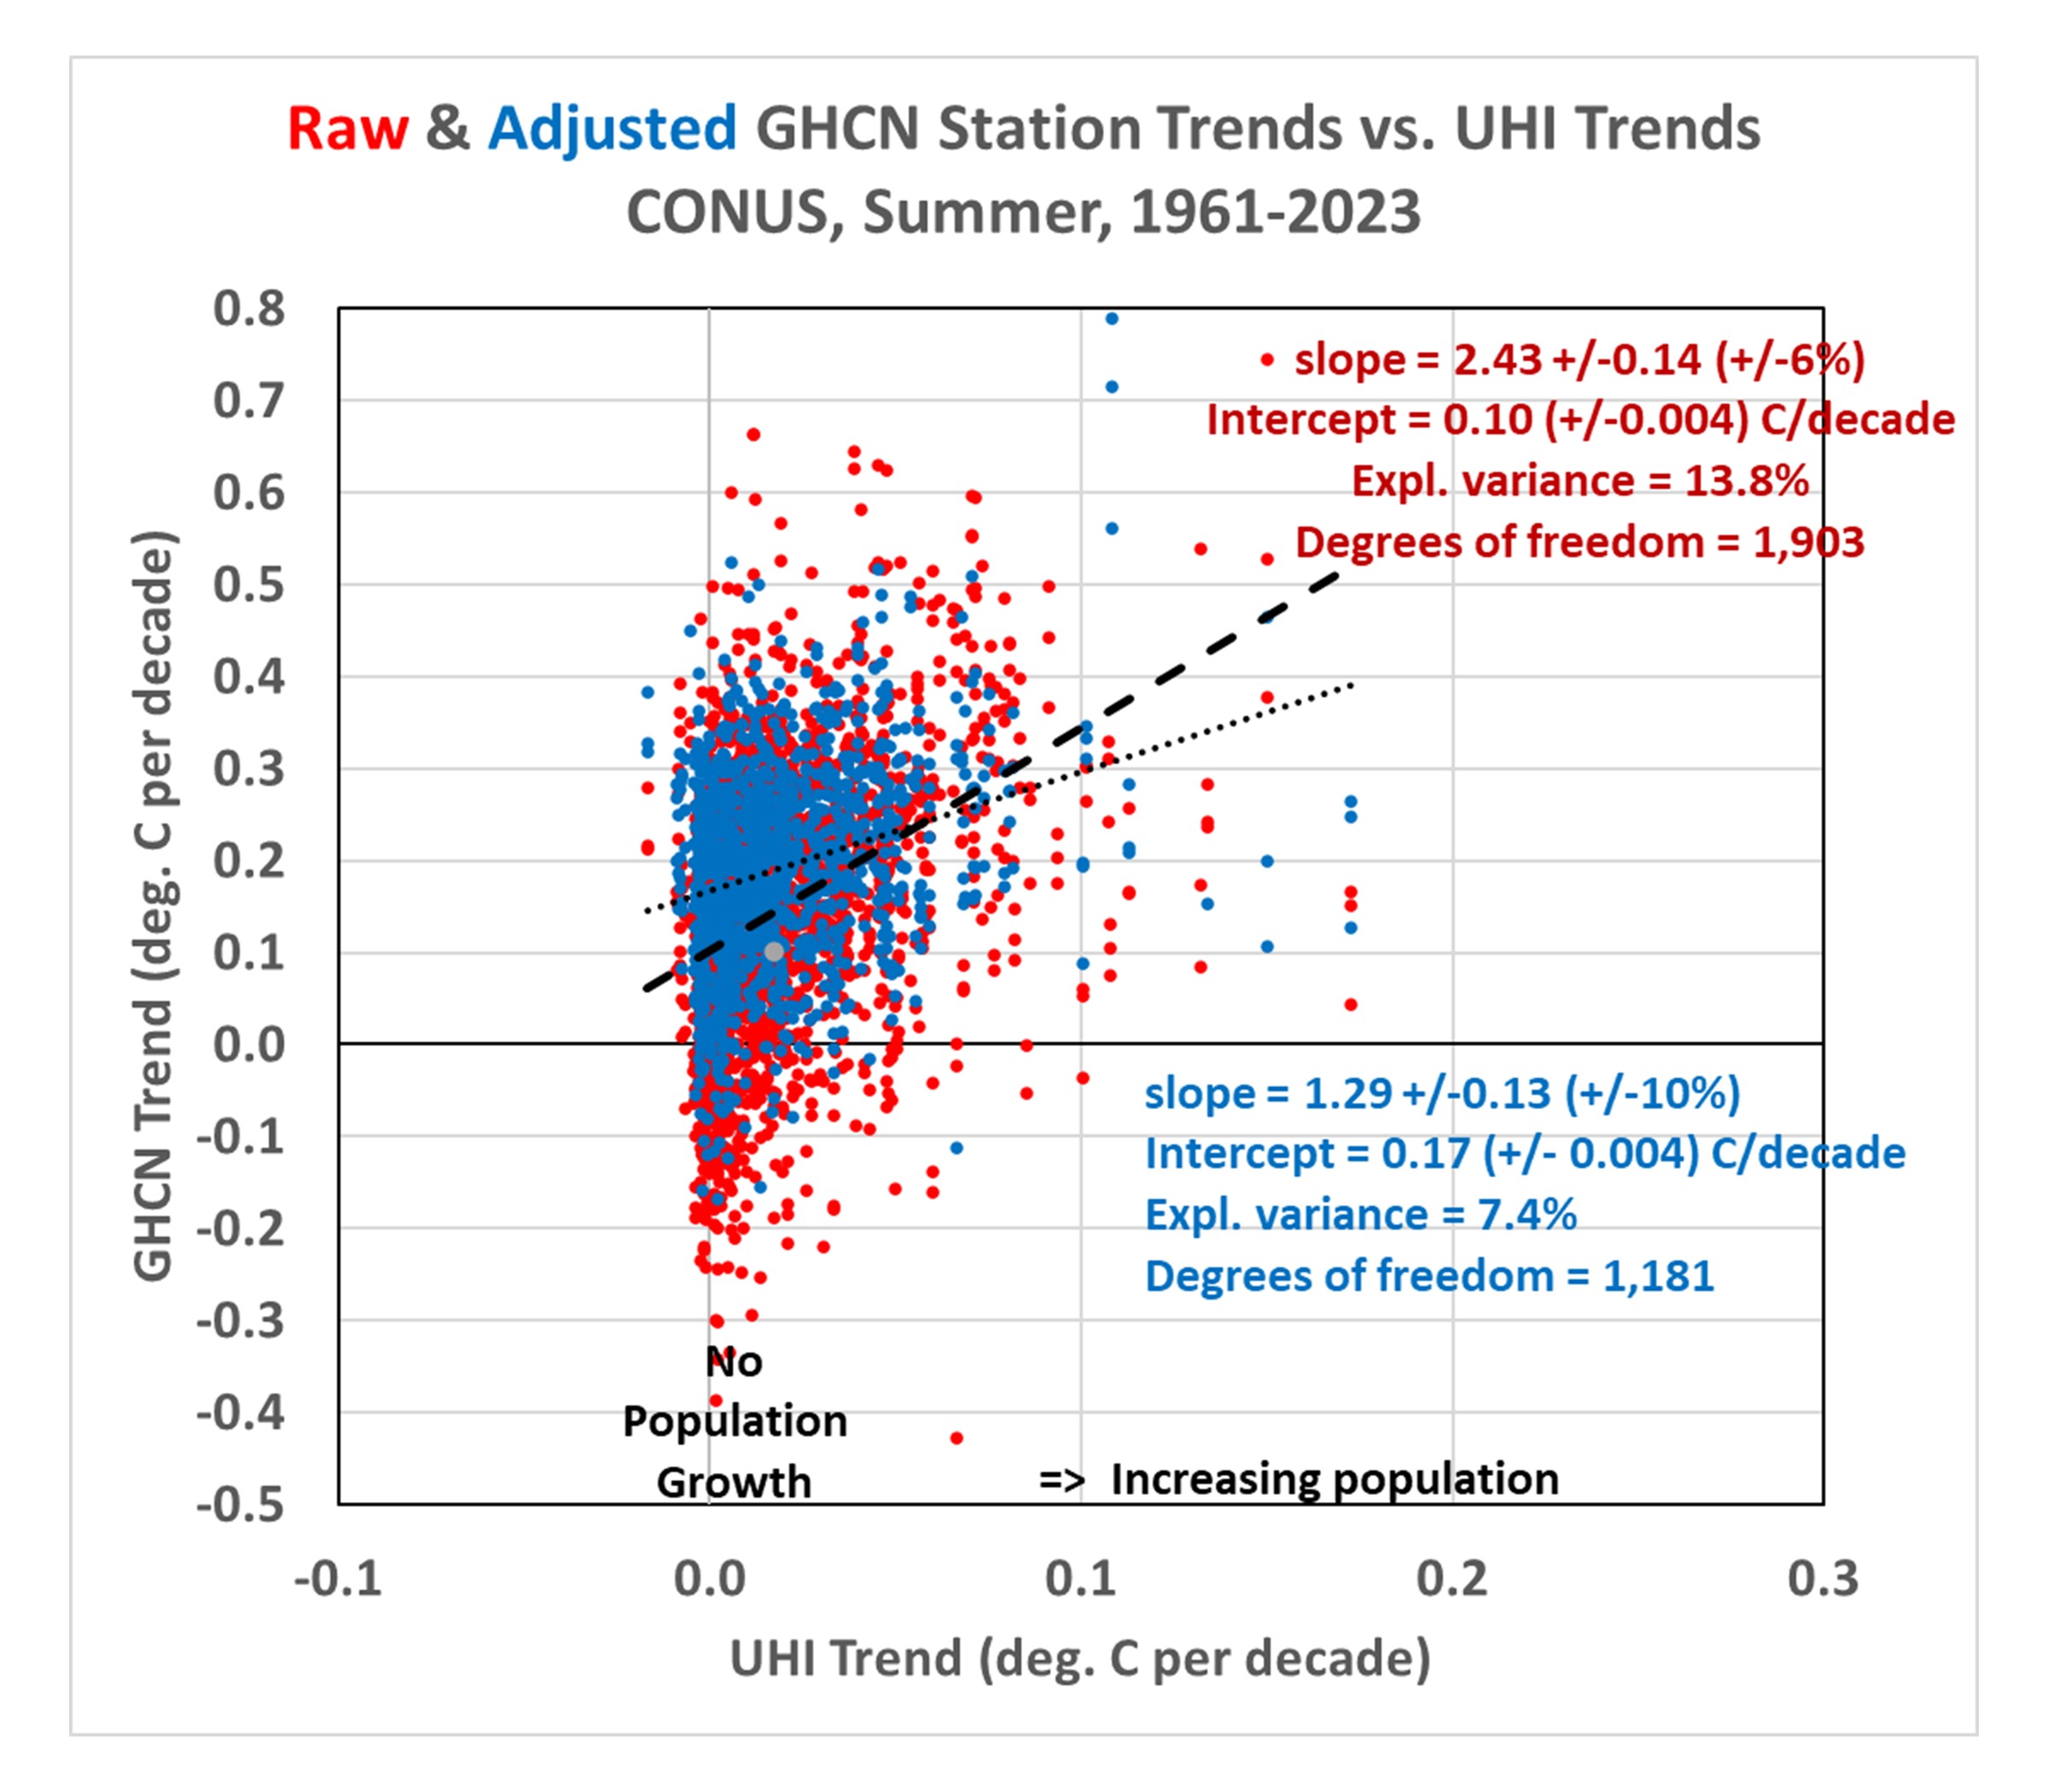
Note that the GHCN trends since 1961 are nearly the same from raw (+0.192 C/decade) as from homogenized (+0.193 C/decade) data. The average UHI warming trend is only about 13% of the raw GHCN trend, and 10% of the homogenized trend, indicating little of the GHCN warming trend can be attributed to increases in population density.
But there still remains an urbanization signal in both the raw and adjusted data, as indicated by the non-zero regression slopes. One possible interpretation of these results is that, if the homogenization algorithm is distorting the station trends, and if we can use the raw GHCN data as a more accurate representation of reality, then the regression intercept of +0.10 deg. C/decade becomes the best estimate of the all-station average warming trend if NONE of the stations had any growth in population. That is little more than 50% of the homogenized data warming trend of +0.192 deg. C/decade.
What Does It All Mean?
First, there is evidence supporting the “urban blending” hypothesis of Katata et al., whereby the homogenization algorithm inadvertently blends urban station characteristics into rural temperature data. This appears to increase the all-station average temperature trend.
Second, homogenization appears to only remove about 50% of the UHI signal. Even after homogenization, GHCN temperature trends tend to be higher for stations with large population growth, lower for stations with little population growth. There is some evidence that truly rural stations would have only about 50% of the warming averaged across all U.S. stations, which is consistent with Anthony Watts’ estimates based upon restricting analysis to only those best-sited stations.
These results suggest there is now additional reason to distrust the official temperature trends reported for U.S. weather stations. They are, on average, too warm. By how much? That remains to be determined. Our method provides the first way (that I know of) to independently estimate the urban warming effect over time, albeit in an average sense (that is, it is accurate for the average across many stations, but its accuracy at individual stations is unknown). As my career winds down, I hope others in the future will extend this type of analysis.
[To see what the total UHI signal is in various calendar months around the world as of 2023, here are the hi-res images: Jan, Feb, Mar, Apr, May, Jun, Jul, Aug, Sep, Oct, Nov, Dec. More details of our method, along with links to monthly ArcGIS-format files of global UHI grids since 1800 (Version 0) are contained in my blog post from November, 2023.]


Does the published literature on the algorithms used agree with your assessment? Will you publish this and get community feedback?
I have no idea what your first question means. Regarding the second question, it takes about a year to get a paper published (unless it is pro-AGW, then it is fast-tracked). I have to decide what I want to submit before I retire.
When will you retire Roy ?
Do you have, or is there, someone who wants to take over after you?
We need people like you who look critically at everything that is published by horror propaganda!
nate…you are in serious denial about the corruption in peer review.
Richard Lindzen complained about it at least 10 years ago when he found it took a long time to publish his papers. When he inquired, a journal editor told him greater caution was the reason since his opinions were considered controversial.
Roy…there is a Denial Of Service attack going on. Don’t know if it’s at the WordPress level or at your level.
I can’t get through with the Firefox or Opera browser and Bindidon claimed he can’t get through from Germany.
Seems to be a sporadic situation with more blockage than not.
May be due to an outfit like Cloudfront, a service used by many systmes to filter users.
“Ive only used Tavg data (the average of daily maximum and minimum temperatures) in developing and testing the method”
You do realize that using Tavg means that your data already contains a bias?
” You do realize that using Tavg means that your data already contains a bias? ”
*
Don’t show us again and again what statistics websites say about it.
Instead, show us your own experience and your own concrete results that support the actual existence of this bias.
*
Here, for example, when processing USCRN hourly data, it is not even remotely visible:
https://drive.google.com/file/d/1AaxFh4QW5DTv7KH42H9DmSFGl68qJYRh/view
https://drive.google.com/file/d/1k8oNXAY0hFrkcRo7x5eEVTEWBGsAK-CX/view
Since 2021 I await your technical contradiction of these results; until now you merely answered with general, non-committing statements.
*
The hourly data from the German Weather Service since 1941 does not show it either:
https://drive.google.com/file/d/1iEdxm4i1JxbVPOa_ZA5GVR1Er8OE2GY2/view?usp=drive_link
If you believe that (min + max) / 2 is an accurate figure for the average temperature then there is little I can show you.
https://drive.google.com/file/d/1AaxFh4QW5DTv7KH42H9DmSFGl68qJYRh/view
Since you have the data, now do the difference between the various values using 1/10ths as the left hand axis.
RHL says: “If you believe that (min + max) / 2 is an accurate figure for the average temperature …”
That is not really the point. We are interested in temperature TRENDS. We could look at all sorts of trends — in T(max) or T(min) or (T(min) + T(max))/2 or T(every hour)/24.
(T(min) + T(max))/2 is a useful and interesting trend to study even if it is not an exact measure of the true average temperature each day.
“even if it is not an exact measure of the true average temperature each day.”
It isn’t.
Tim Folkerts
” That is not really the point. ”
Really? Your post is not very useful, to say the least.
What matters here in the discussion is not to speak once more about trends.
It is the daily difference, with respect to the true 24 hour average within a hourly time series, between
– the mean of Tmin and Tmax;
– the median.
*
Moreover, writing
” (T(min) + T(max))/2 is a useful and interesting trend… ”
now really misses the point.
The point was three years ago and still is that Blindsely H00d aka RLH never was able to technically prove with real examples that the median of 24 hourly measurements is better than (T(min) + T(max))/2, let alone was he able to disprove my results showing that he is wrong.
*
See later my comment about these differences below.
Blinny: Your own data proves my point.
https://www.drroyspencer.com/2024/10/urban-heat-island-effects-in-the-u-s-official-ghcn-data-have-not-yet-been-removed/#comment-1693610
” Your own data proves my point. ”
*
Of course it never did, Blindsley H00d, and it still doesn’t:
https://www.drroyspencer.com/2024/10/urban-heat-island-effects-in-the-u-s-official-ghcn-data-have-not-yet-been-removed/#comment-1693638
As always, eye-balling can be quite misleading.
*
The distance difference between true average and median resp. (Tmin+Tmax)/2 you can even see in the hourly temperature distribution over the days:
https://drive.google.com/file/d/1Zp4zDnMoyO3ZrQ1tXtngnV3F2t73sPkr/view
Bin & RLH, The whole point of statistics it to summarize data in a way that is useful.
In this case, the “use” is to learn about TRENDS (GHCN & UHI trends in particular). For this use, we just need one measure of the ‘typical’ temperature at some locations collected over time. For this use, we don’t really care which of three (or more) measures of central tendency is closer to the “true average daily temperature”. All three measures will give similar results.
Yes, there could be some small, interesting differences when analyzing median vs 24 hr average vs max/min average, but
1) this would only be a small tweak on the graphs and results Dr Roy has found above, and
2) only max/min is available at enough location for enough time to do the analysis, so it is ‘the only game in town’.
Roy . I read this blog post from a link on your Facebook post.
https://wattsupwiththat.com/u-s-surface-temperature/
The above network of good sites uncontaminated shows no warming since 2005 which seems to back up your paper.
DerekT
” The above network of good sites uncontaminated shows no warming since 2005… ”
Really?
Despite claims by technically incompetent people on this blog, I’m not a NOAA butt-kisser nor do I feel the need to ‘appeal to their authority’.
My contradiction below is not based on alarmism but on data analysis.
*
Here is the origin of the WUWT chart you posted:
https://www.ncei.noaa.gov/access/monitoring/national-temperature-index/time-series/anom-tavg/1/0
Unlike at NOAA’s Climate at at Glance page, there is unfortunately no possibility to show to you there the current trend since 2005.
I then downloaded the data you can find at
https://www.ncei.noaa.gov/access/monitoring/national-temperature-index/time-series/anom-tavg/1/0/data.csv
and loaded it into my spreadsheet calc.
Linear trend in the period Jan 2005 – Aug 2024, in C / decade
NOAA USCRN: 0.39 ± 0.13.
*
Here is the result with anomalies wrt 2011-2020:
https://drive.google.com/file/d/1tA3WWmdMgsW0Kwa48on7I0HNJKFboX5z/view
The time series differs from its source only due to a different referece period, leading to different anomaly values.
*
A comparison to other sources might be useful: NOAA’s Climate at a Glance for CONUS and my evaluation of GHCN Daily.
https://drive.google.com/file/d/1K1gyHFikxesObAy_xOLim9IhaiiwxwBu/view
1. Bin GHCN daily
Linear trend in the period Jan 2005 – Aug 2024, in C / decade
Bin GHCN daily: 0.41 ± 0.10 .
Only 0.02 C / decade as difference between the 137 USCRN stations and over 4,000 of GHCN daily available during 2005-2024, despite severe elimination criteria (age >= 10, sufficient data for anomalies or near x,y,z vicinity to such a station, no adjustments, no interpolation).
*
2. NOAA CaaG
this is even more a surprise.
Linear trend in the period Jan 2005 – Aug 2024, in C / decade
NOAA CaaG: 0.32 ± 0.13 .
This seems to be kinda ‘home exception’: NOAA’s land series for the Globe shows for the sat era in 1979-2024 a very high trend, twice as much as UAH LT.
Roy Spencer
Could you please explain the reason for these permanent http ‘403’ exceptions (access denied) when I try to publish comments on your blog using classical browsers like Firefox?
This comment I could only send by using the TOR browser.
Thanks in advance for your reply…
Or use an VPN as I do.
Roy,
You say “These results suggest there is now additional reason to distrust the official temperature trends reported for U.S. weather stations.”
So, it’s a good thing we have many other sources of data, and they all tell the same story: https://ibb.co/3WF3p0z
Regards.
That chart is global, not US.
In the compendium I see:
JMA 0.140 C/decade
That’s a joke, isn’t it?
I just downloaded JMA’s monthly data from
https://ds.data.jma.go.jp/tcc/tcc/products/gwp/temp/list/csv/mon_wld.csv
and obtained as trend: 0.192 +- 0.004 C / decade.
*
In a not too recent past, JMA indeed had such a trend; JMA was the only surface time series with a trend below UAH5.6 LT for the sat era.
https://drive.google.com/file/d/1AaxFh4QW5DTv7KH42H9DmSFGl68qJYRh/view
Blinny’s own data proves why the median is the preferred statistic over the mean. If he plots the difference between the median and the mean and can explain the difference in a scientific/statistical way
that is different to mine…
P.S. The only reason for a difference between the median and the mean is an asymmetry in the underlying data.
After a wonderful warm, golden October afternoon on our terrace, enjoying delicious merguez with a lush ros from the Ctes de Provence, and later watching a great documentary about the Alhambra, back to Blindsley H00d and his usual mix of insinuations and unproven claims.
*
” If you believe that (min + max) / 2 is an accurate figure for the average temperature then there is little I can show you. ”
I don’t believe anything. All I have shown since 2021 is that Blindsley H00d aka RLH’s biased claim that temperature averages with (Tmin+Tmax)/2 are wrong, inappropriate, etc. is simply an affabulation.
*
” Since you have the data, now do the difference between the various values using 1/10ths as the left hand axis. ”
Wow. I thought he would also have the data:
https://climatedatablog.wordpress.com/wp-content/uploads/2021/12/uscrn-contiguous-daily-values-3.jpg
If he is the real author of the USCRN data processing stuff shown in his graph: why does Blindsley H00d not present himself what he expects from others?
**
Here is again the link to the three daily temperature means ouf hourly data – 24h average, median, (Tmin+Tmax)/2, for the whole USCRN (all 137 stations active at generation time, all years from 2001 till 2023):
https://drive.google.com/file/d/1AaxFh4QW5DTv7KH42H9DmSFGl68qJYRh/view
*
And here is a chart showing
– the 24h average (also named the ‘true average’) minus the median (red)
– the 24h average minus (Tmin+Tmax)/2 (blue):
https://drive.google.com/file/d/1ZR53-h9WrAiO-gvx5FaVvYHoTfdf6Rb2/view
*
Anyone can see that a global analysis of USCRN’s station data reveals that the distance between true average and median is over the year mostly greater than the distance between true average and (Tmin+Tmax)/2.
This is corroborated by building for the two difference series the average absolute value and the sum of the absolute values over the year:
– median
average value: 0.17
sum of all 365 days: 60.5
– (Tmin+Tmax)/2
average value: 0.11
sum of all 365 days: 39.3
*
There is unambiguous evidence that when inspecting daily USCRN series out of hourly data, the so often discredited (Tmin+Tmax)/2 is nearer to the true average than the median.
**
But unlike me, Blindsley H00d never has ever admitted being wrong, and will soon restart his median story from scratch again, as he did all the time on this blog.
“I dont believe anything”
You said it. So asymmetry in the underling data shows up how?
You have the data. Why not plot the differences as I said previously?
https://drive.google.com/file/d/1AaxFh4QW5DTv7KH42H9DmSFGl68qJYRh/view
See the differences in the data?
https://drive.google.com/file/d/1AaxFh4QW5DTv7KH42H9DmSFGl68qJYRh/view
But unlike me, Blindsley H00d never has ever admitted being wrong, and will soon restart his median story from scratch again, as he did all the time on this blog.
It is interesting that the axis to the left is in 4 degree increments.
RLH 7:11 AM
Didn’t you understand what Bindidon wrote above?
Didn’t you see that the graphic he posted is exactly what you wanted to see?
https://drive.google.com/file/d/1ZR53-h9WrAiO-gvx5FaVvYHoTfdf6Rb2/view
I saw you call him Blinny! Sounds like a mix of Bindidon and blind, right?
The blind grandpa here is probably you, I guess.
So you agree with me that your data shows asymmetry in the underlying data as shown?
” I suppose it is no surprise that https://drive.google.com/file/d/1ZR53-h9WrAiO-gvx5FaVvYHoTfdf6Rb2/view shows private access only. ”
It rather no surprise that you suspect intention.
Now OK.
I suppose it is no surprise that https://drive.google.com/file/d/1ZR53-h9WrAiO-gvx5FaVvYHoTfdf6Rb2/view shows ‘private access only’.
And now it doesn’t.
Why does the underlying data show such and asymmetry? (Shown by the difference between the median and the mean)
I just checked, it is accessible by anyone.
If you have no access: the problem then is on your side.
*
By the way: Where is YOUR {(Tmin+Tmay)/2 vs medianvs 24h average} graph contradicting mine?
I guess it will never appear…
The data will always show the same thing. Now answer what is the reason for the differences?
“Now OK.”
and
“I just checked, it is accessible by anyone.” Now.
” So you agree with me that your data shows asymmetry in the underlying data as shown? ”
No. It’s your invention in order to discredit an deny my contradiction to your claim.
What I made definitely proves that for the USCRN data, the min/max middle is always nearer to the true average than the median.
But you never admit being wrong, and invent since 2021 new pseudo-arguments to avoid admitting.
How courageous!
Are you saying that there is no underlying asymmetry?
What is your explanation for the differences shown?
“On a graph, the ‘median’ represents the middle value of a data set when arranged in order, while the ‘mean’ represents the average value, calculated by adding up all the data points and dividing by the total number of points; the key difference is that when a data set is skewed (has a long tail on one side), the mean will be pulled towards the tail, making the median a better indicator of the ‘typical’ value in that situation”
” Are you saying that there is no underlying asymmetry? ”
Stop boring me with your sand-throwing-in-the-eyes.
*
” What is your explanation for the differences shown? ”
Unlike you, who boasted once with higher knoledge in statistics but finally admitted to have mereley ‘learned simple statistics’, I have all the time said to lack experience in this domain.
Hence, no: I have no explanation. A top stistician would certainly give you one.
My aim was at showing this difference, like I have shown this one earlier:
https://drive.google.com/file/d/1Zp4zDnMoyO3ZrQ1tXtngnV3F2t73sPkr/view
Your point was years ago that the median is always below the true average and the middle of min/max above and hence is better.
This is the simple-minded opinion of any warming denier.
Later on, you switched to the opinion that the better choice is the one which shows the least difference to the true average.
And therefore, the middle of min/max is according to your opinion the better choice.
For me, as I have shown for the US CRN and the German DWD, the difference between the three is so small that I leave to opinionated guy to claim its relevance.
Point final, this discussion nis too boring.
You can’t stop stalking. Start working instead, beginning by a correction of your wrong median cascades.
“Stop boring me with your sand-throwing-in-the-eyes”
So no answer from you.
“Your point was years ago that the median is always below the true average and the middle of min/max above and hence is better”
No my objection was to do with asymmetry of the data.
“making the median a better indicator of the typical value “
“Better” can only be decided within the context of a particular set of data and how it is being used. There is no universal superiority of mean vs mode vs median vs (max+min)/2 vs geometric mean vs (any other measure you might come up with).
Suppose at some location, historical data show that rainfall is 0 cm 25 days in a month, and 1,2,3,4,5 cm the other 5 days.
* If you want to predict if it will rain on your picnic, then the median value is “better” — 83% of the days rainfall will be 0 cm; you don’t really care that the average is 0.5 cm/day.
* If you want to predict soil moisture to choose a crop to plan, then the mean value is “better” — 0.5 cm of rain per day will be sufficient for lots of crops; if you only looked at the median, you might think you were in desert!
You need to show the superiority of one measure of daily central tendency for the purpose of determining decadal temperature trends. Otherwise you are just arguing about abstract generalities!
NOTE: IF the purpose is finding the true daily average temperature for given day, THEN averaging the hourly values is the best method of the three under discussion. Followed by (TMIN+TMAX)/2, followed by median (based on the graph that was presented).
But again — so what? Does that help us understand UHI effect for the past 100 years?
“‘Better’ can only be decided within the context of a particular set of data and how it is being used”
Statisticians have long decided that asymmetrical underlying data is better represented by the median.
“For distributions that have outliers or are skewed, the median is often the preferred measure of central tendency because the median is more resistant to outliers than the mean.”
I see again that RLH, unable to technically contradict my results let alone to present a result by his own, once more resorts to simply posting general sentences he picks up on the net (as usual without source), without being able to scientifically explain and prove that they apply to the specific context discussed here.
Stop smalltalking and stalking, Blindsley H00d, and finally manage to start working.
*
Blindsely H00d’s eternal attacks remind me Frank Zappa (in ‘Zoot allures’ I guess):
” The torture never stops! ”
” The torture never stops! ”
and so on.
Blinny fails to address which is more accurate on asymmetrical data, the median or the mean.
Statisticians have long decided that asymmetrical underlying data is better represented by the median.
Blinny ignores this as usual.
And RLH, who
– (1) has claimed for years that when processing hourly data, the best mean of (Tmin+Tmax)/2 and median is the one that has the least deviation from the true 24-hour average,
– (2) still stubbornly denies that according to the graphs below, the mean (Tmin+Tmax)/2 has less deviation from the true 24-hour average than the median.
*
1. Distance within the year between (Tmin+Tmax)/2 and median from the true average in a daily averaging of the three for all active USCRN stations in all years:
https://drive.google.com/file/d/1ZR53-h9WrAiO-gvx5FaVvYHoTfdf6Rb2/view
*
2. Distance within the day between (Tmin+Tmax)/2 and median from the true average in a hourly averaging of the three for all active USCRN stations in all years resp. for one station in AK and one in FL:
https://drive.google.com/file/d/1Zp4zDnMoyO3ZrQ1tXtngnV3F2t73sPkr/view
*
And since he is unable to technically refute my results, let alone provide results of his own proving he is right, he continues to hound me endlessly with non-committal claims.
How BORING. Will this ever have an end?
RHL, you should read the passage you are quoting.
“For distributions that have outliers or are skewed, the median is often the preferred measure of central tendency because the median is more resistant to outliers than the mean.”
Often. Not a universal truth. Just a ‘suggestion’ from an introductory stats webpage. The “better” statistic still depends on use. Sometimes mean is better. Sometime mode is better. Or RMS. Or trimmed mean. Or geometric mean.
Plus, the ONLY statistic available for most of sites for most of the 120 years of Dr Roy’s study is (max+min)/2 (ie no hourly data is available). So even if (max+min)/2 is not the ideal, it is still better than NO DATA AT ALL.
Roy,
Not many heat islands in the ocean, yet we have this: https://ibb.co/qNJNr4s
Why do you think that is?
Regards.
How about Hawaii and Fiji? They are heat islands, surely.
BTW…Hawaii is in the US but not in America.
These are sea surface temps, not land temps. Even if Hawaii and other small islands were included, they would have a minimal effect considering the relative land area to the size of the global oceans.
barry…I was just kidding.
I forgot, Australia is in the ocean as well.
Still concerned that some factions are targeting Roy’s site with a Denial of Service attack. It has been several days now that I have been unable to post on the site using Firefox.
Of course, it’s unlikely that hackers would target a browser so it would appear that the problem is a content provider like Cloudflare messing up…again…and targeting legitimate users. Recently, the entire net almost went down due to a Cloudflare error.
The only solution for websites is to disable Cloudflare till they get their act together. It is inappropriate to blacklist users based on CLoudflare’s paranoia.
To whom it may concern
Anyone who wants to access data uploaded to Google services (Drive, Docs, …) that has not been made freely accessible there (often enough because the owner has forgotten to do so) should be aware that Google does not care at all about data protection and sends the owner an email with the requester’s email address, which is probably not what the requester intended!
To whom it may concern
Anyone who uses Google services needs to make things public for others to use them. Otherwise they are private by default. As Blinny has discovered for himself.
There was a lawsuit over that a few years ago. Google has always claimed that anything submitted though their services is their property. That includes their email services and anything you send via them, like photographs.
” As Blinny has discovered for himself. ”
*
I did not discover that, Blindlsey H00d. YOU were the one who DID yesterday. Apparently, you didn’t even notice the consequence of what you yourself did when asking for my data.
*
I have been getting emails from Google for years requesting access to Google Drive data that I accidentally forgot to make public, from people who apparently weren’t aware of the problem; in the last two years alone, I’ve received over 10 such requests.
Sometimes, when I upload, say, five files at once, this little problem can arise. Nobody is perfect, me the least.
*
Now comes the very best I have ever experienced in that corner.
The very last access request to Google Drive stuff came yesterday; here is the original header (in German of course).
Please enjoy from whom it originates:
https://drive.google.com/file/d/1VSWRWtWi_Z1Y5Pfgh3V0Pd-I-eyQbFVw/view
Addendum
Centuries ago, the Krauts invented a wonderful adjective: “dummdreist”, a combination of “dumb” and “brazen”.
This synthetic word apparently came into the language because there were already an amazing number of people like RLH in the country.
*
But RLH never admits he’s wrong, so no one should be surprised that he’ll soon find a way to squirm his way out of this situation like an eel.
binny…”But RLH never admits hes wrong…”
***
Good reason for that. In the exchanges between you two, Richard has never been wrong.
Oh look at what BigFeet&SmallBrain is telling us:
” In the exchanges between you two, Richard has never been wrong. ”
*
Especially here the latest:
https://www.drroyspencer.com/2024/10/urban-heat-island-effects-in-the-u-s-official-ghcn-data-have-not-yet-been-removed/#comment-1693724
*
Robertson never had an idea about what we were talking about during the last years, but he ‘knows’ that Blindsley H00d aka RLH was ‘never wrong’.
*
Good reason for that.
Robertson endlessly butt-kisses RLH in the hope that RLH – who already shares with him GHE, AGW and even Global warming denial – finally also joins him and his fanatic troop to support the lunar spin denial as well.
*
Robertson is of course the ideal judge for such discussions: he even still didn’t manage to really understand how anomalies, baselines and reference periods work together when processing time series.
*
He also denies the existence of time, claims viruses could never be correctly observed, denies the need to consider special and general relativity when implementing GPS, believes that NOAA uses only 1500 stations worldwide, etc etc etc.
So you agree that you forgot to make the relevant item public, just as you and I said.
P.S. I remember well what access requires. You do not. QED.
P.P.S. The request for public access came from me. Just to ensure that you thought things through. Quelle surprise.
” I remember well what access requires. You do not. QED. ”
Here again, you see RLH falling deep down into his usual sissyish insinuations and lies.
*
As I wrote above:
But RLH never admits hes wrong, so no one should be surprised that hell soon find a way to squirm his way out of this situation like an eel.
*
And this will never stop.
What will never stop is me quoting your own words that prove that you failed to make ting public as you have admitted yourself.
…to make things public…
I don’t have the least chance to get rid of this RLH leech.
Comparés à lui, Swen~son, Robertson et Clint R sont des enfants de choeur.
*
By the way, it’s a pity that many commentators are missing, probably because it’s impossible for them to overcome the current Internet hurdle to the blog.
Me thinks you protest too much.
Blindsley H00d, the Leech
From now on, your endless, useless posts – which remind me more of a 15-year-old effeminate girl than a well-educated 76-year-old man – will of course remain visible to the blog’s community, but I thankfully no longer have to see them.
Elliott Bignell’s Tarderase works pretty well on Firefox, but not on TOR, where I still have to see your disingenuous manipulations.
Roy Spencer, however, unlike you, is a grimly determined problem solver, and I am 100% confident that he will zoom into this problem area and successfully get us rid of this technical deficiency on the server that hosts his blog.
So feel free to distort and misrepresent everything I do and write in your ridiculous posts. I currently only see them when I upload my comments. That’s bad enough.
Hardly a protest, more a Gallic whine.
You protest too much.
test
tim f…”The whole point of statistics it to summarize data in a way that is useful.
In this case, the use is to learn about TRENDS (GHCN & UHI trends in particular). For this use, we just need one measure of the typical temperature at some locations collected over time. For this use, we dont really care which of three (or more) measures of central tendency is closer to the true average daily temperature. All three measures will give similar results”.
***
The problem with a statistical analysis is losing the context in a muddle of mathematics. Binny excels at that. One must ensure that the analysis does not become about math alone (number crunching) while the context is lost.
For example, the UAH trend is listed at about 0.13C/decade. There is nothing wrong with that average mathematically but it falls short of describing the actual context. The trend suggests a linear warming from 1979 – present but the actual context is far from linear. Rather, it has been driven by sporadic warming events that cannot be adequately explained.
Over the first 18 years of the record, there was a cooling effect due to volcanic activity which caused the trend to remain below the baseline. Suddenly, in 1998, a super El Nino drove global temps into a relative spike which dissipated just as quickly, with the global average falling temporarily back below the baseline. Then the trend rose above the baseline for the first time in 20 years but leveled off into a flat trend for 15 years. That 15 year flat trend does not show up in the overall trend of 0.13C/decade.
One might ask how a baseline is established without data. Obviously, if the UAH record began in 1979 there was no 30 year average available upon which to establish a baseline,
The 15 year flat trend was driven upward by another super EN in 2016. That spike did not dissipate quickly but approached the baseline slowly over 6 years resulting in another 6 year flat trend. Recently, following a volcanic eruption, Hunga Tonga, that blew millions of tons of water into the stratosphere, there was another relative spike in warming which has yet to dissipate.
The problem here is climate alarmists using the trend to associate it with anthropogenic warming.
The issue is exacerbated by the means of measuring temperatures. The surface method uses, on average, 1 thermometer per 100,000 km^2 of land area, and those temps are taken twice a day and averages. That is hardly a good basis for statistical analysis. Yes, you can do it, but it means nothing.
Nate,
Me: “When surface has a lower thermal capacity, when solar irradiated, surface will intesify emitting more intensively, because it gets warmed at higher temperatures.”
I am referring here to the EM energy/surface skin layers interaction process.
When surface consists from a material with a lower thermal capacity, it is because the surface is made of larger atoms.
When atoms are larger, there are much less atoms streched on the surface skin layer of 1 m2.
When there are less atoms to interact with, the incident EM energy (W/m2) is shared between a lesser number of atoms, so they interact more intensively (W).
And, yes, the surface temperature is induced to higher levels.
It is the same EM energy/interaction process. But there are less EM energy degraded to heat. So, there are less EM energy conserved as heat.
https://www.cristos-vournas.com
“And, yes, the surface temperature is induced to higher levels.
” But there are less EM energy degraded to heat”
These are contradictory statements.
The T of the surface is higher as predicted by GHE models.
Anone with an ounce of interest in finding the truth can test the theory that if you control for the UHI there is no warming simply by controlling for the UHI when you choose the data set.
This made a wonderful High School Science Project.
https://youtu.be/vEYKkKaQlWI?si=SIu1utlRVfmM24h6
https://youtu.be/ZUVqZKBMF7o?si=m2l9x1QqfKn0qtjN
Don’t care about this:
https://i.f1g.fr/media/cms/1232x/2024/10/31/58104c0fe6a7da7ed10146750f40e612cfd2d3b41756571c11e85aa3e032f5de.jpg
It happened sooo many times in the past.
Those who claim it’s due to the Mediterranean sea warming extremely long before Hunga Tonga erupted are all dumb alarmists.
“It happened sooo many times in the past.”
So not global warming then.