
Update (11/12/2024): New annotated version of Fig. 1 added. Corrected who the Greenland Ranch foreman was and associated correspondence. Will fix Fig. 2 (2021/2022) problem Wednesday morning.
Update (11/13/2024): Fixed Fig. 2
In Part 1 I claimed that using stations surrounding Death Valley is a good way to “fact check” warm season high temperatures (Tmax) at the Death Valley station, using a correction for elevation since all surrounding stations are at higher (and thus cooler) elevations. In July of each year, a large tropospheric ridge of high pressure makes the air mass in this region spatially uniform in temperature (at any given pressure altitude), and daily convective heating of the troposphere leads to a fairly predictable temperature lapse rate (the rate at which temperature falls off with height). This makes it possible to estimate Death Valley daytime temperatures from surrounding (cooler) stations even though those stations are thousands of feet higher in elevation than Greenland Ranch, which was 168 ft. below sea level.
Lapse Rates Computed from Stations Surrounding Death Valley
If I use all available GHCN daily stations within 100 miles of Greenland Ranch (aka Furnace Creek, aka Death Valley N.P.) in each July from 1911 to 2024 to compute the month-average lapse rate (excluding the Death Valley stations[s]), I get the results in Fig. 1.
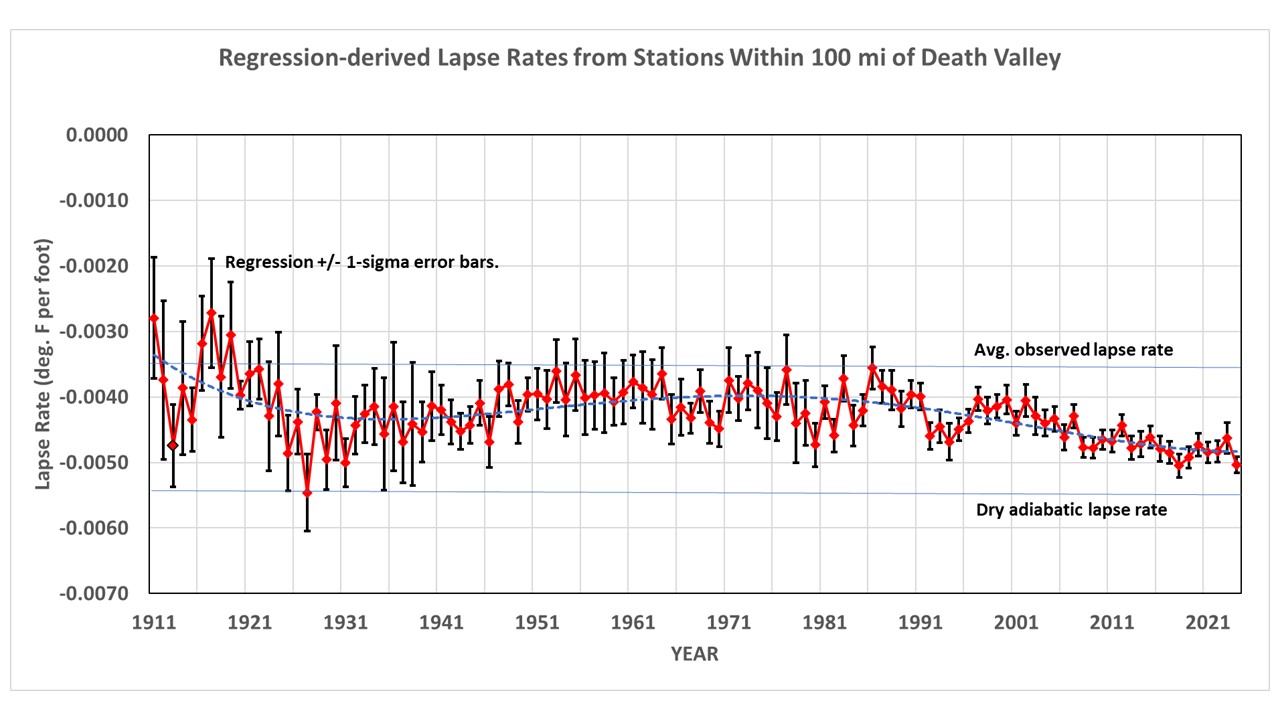
Fig. 1. Lower tropospheric temperature lapse rate estimated from all stations within 100 miles of Greenland Ranch, Death Valley, CA. The number of available stations for these calculations range from several in the early years to 25 or more in the later years. Here I will assume a constant lapse rate of -0.004 during the 20th Century. The 4th order polynomial fit to the data would be another way to assume how the lapse rate changes over time.
The computed lapse rates mostly fall between the dry adiabatic value and the U.S. standard atmosphere value (except in the early years). Given the few stations available in the early years, I will base the calculations that follow on an assumed lapse rate of -0.004 deg F per ft. for the first half of the record, and will assume that the observed steepening of the lapse rate after the 1980s is real, with a value of -0.0048 deg. F per ft. in the early 2020s. In Part 1, I used the actual values in Fig. 1 in each year to estimate Death Valley temperatures. This time I’m using average lapse rate values over many years, keeping in mind the early decades had few stations and so their values in Fig. 1 are more uncertain.
Daily Estimated July Tmax at Death Valley: 2021-2024
How accurately can we estimate daily Tmax temperatures in Death Valley from surrounding high-elevation stations? The following plot (Fig. 2) shows how the July daily observed Tmax temperatures in Death Valley (2021, 2022, 2023, 2024, orange for Death Valley N.P.) compare to estimates made based upon surrounding, high-elevations stations (blue), assuming a lapse rate of -0.0048 deg. F per ft (see Fig. 1).
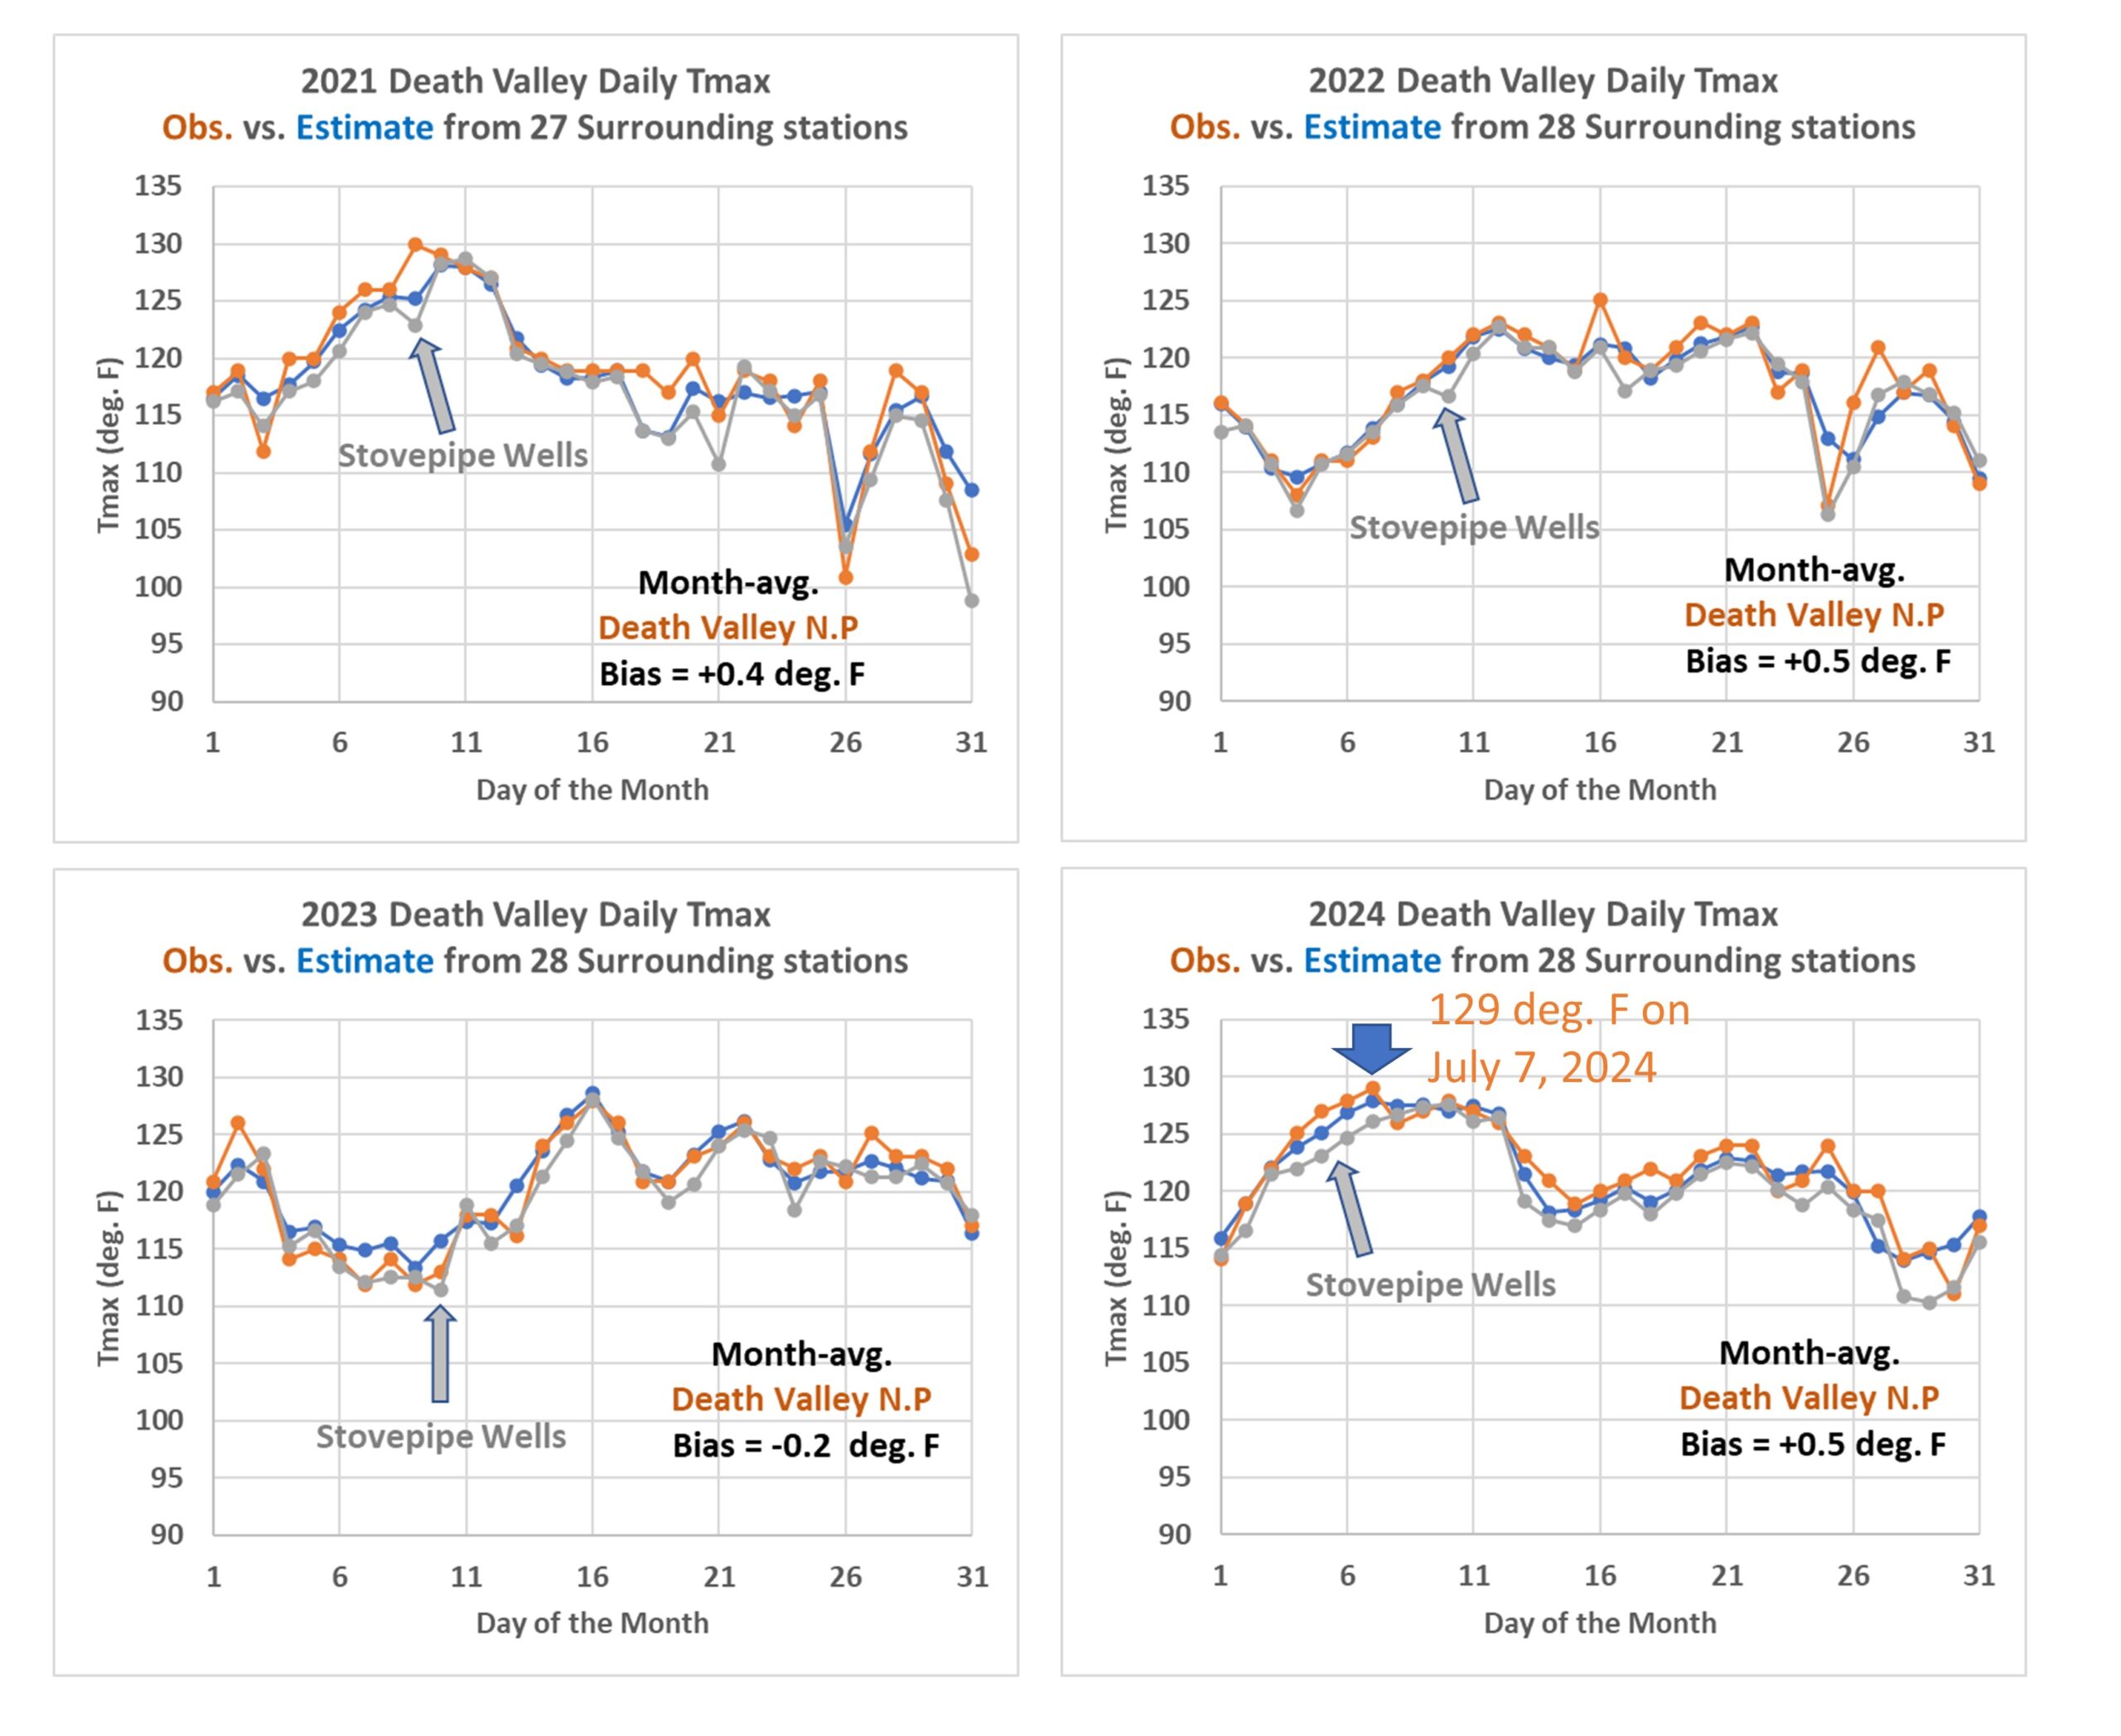
Fig. 2. Daily estimated July Tmax temperatures for Death Valley N.P. from surrounding stations (blue) compared to those observed (orange, 194 ft. below sea level) for 2021, 2022, 2023 and 2024.
In each year the daily estimates from surrounding stations (blue) are reasonably close (within a couple of degrees) to the observed values at both Death Valley N. P. (orange) and at the nearby station Stovepipe Wells. For example, on July 7, 2024 the observed “near record” value of 129 deg. F degrees agrees well with the lapse-rate estimated value of 128 deg. F. Note there were many (27 of 28) stations within 100 miles of Death Valley available to make these estimates during these years.
Daily Estimated July Tmax at Death Valley: 1935-1938
Next, let’s travel back to the 1930s, when there were fewer stations to do these estimates (Fig. 3).
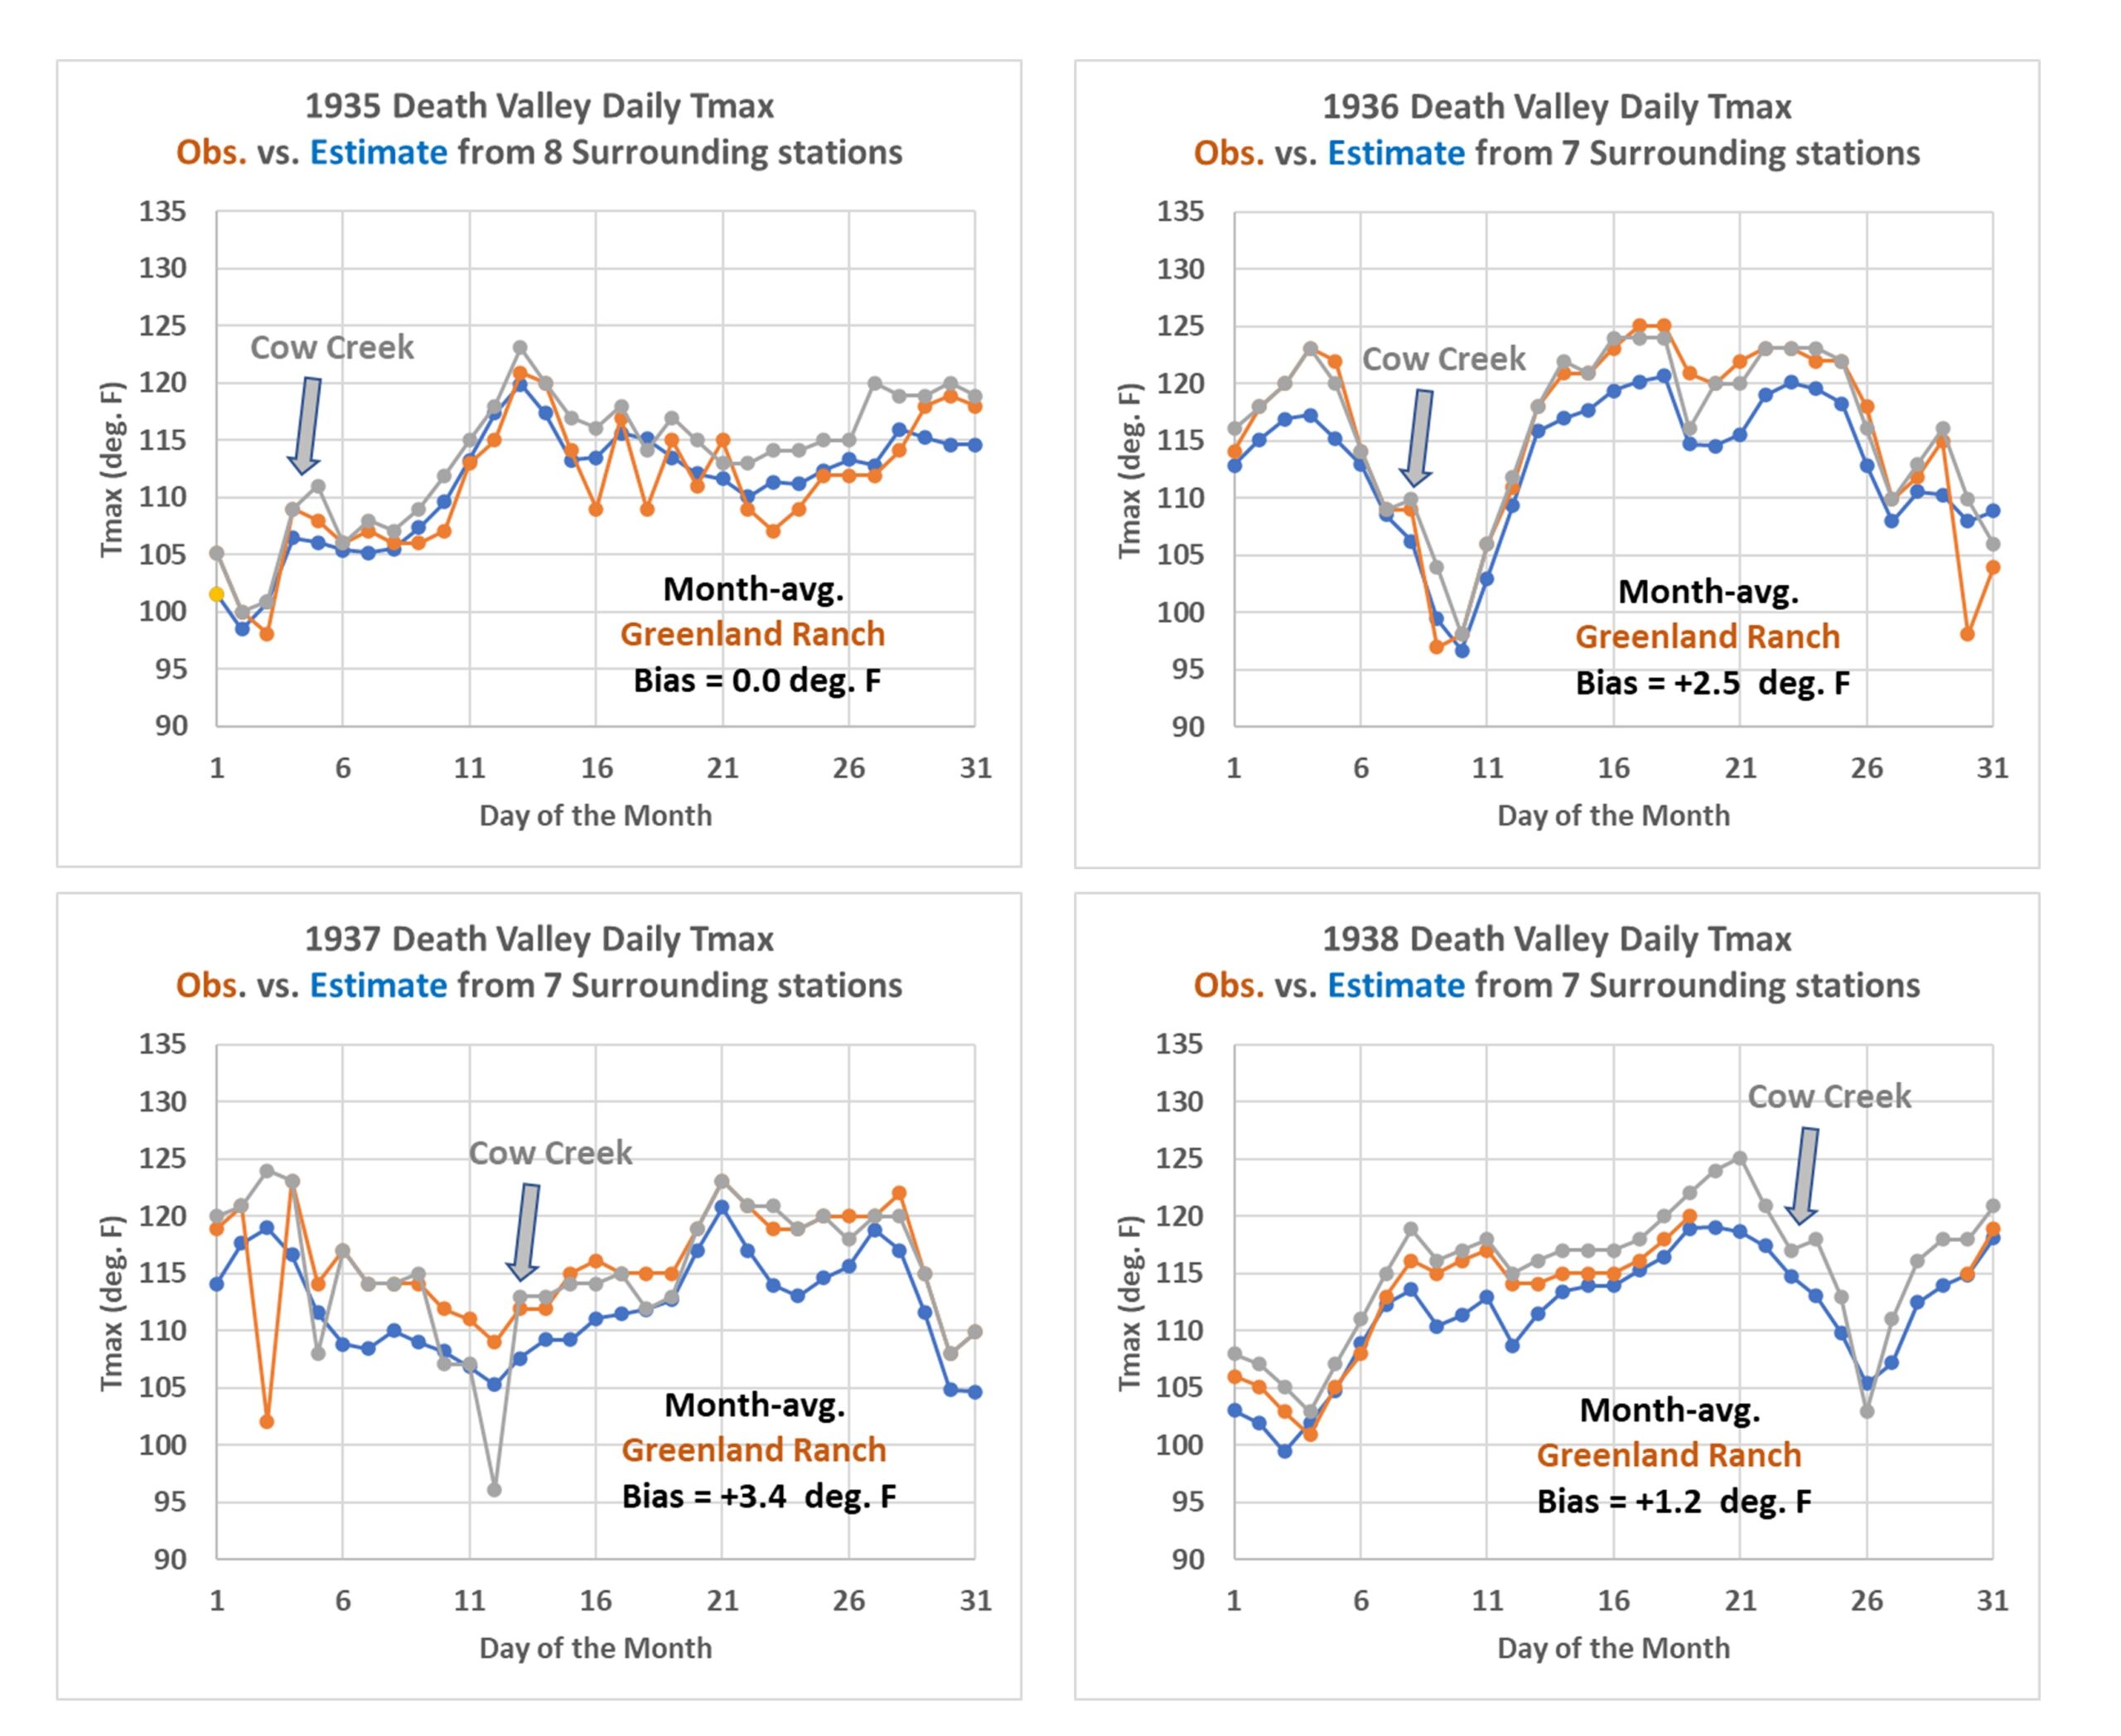
Fig. 3. Daily estimated Tmax temperatures for Death Valley during 1935, 1936, 1937, 1938 from surrounding stations (blue) compared to those observed at Greenland Ranch (orange, 168 ft. below sea level) and Cow Creek (grey, 151 t. below sea level).
Despite only having 7 or 8 stations from which to estimate Death Valley temperatures, the agreement is still reasonably good in 1935, with no bias between observed and estimated, but 1-3 deg. F bias at Greenland Ranch vs. estimated in the following 3 years. There are also a few low temperature outliers in 1937-38 at Greenland Ranch and Cow Creek; I don’t know the reason for these.
Daily Estimated July Tmax at Death Valley: 1912-1915
Finally we examine the period in question, when the 134 deg. F world record temperature was recorded on July 10, 1913 (Fig. 4).
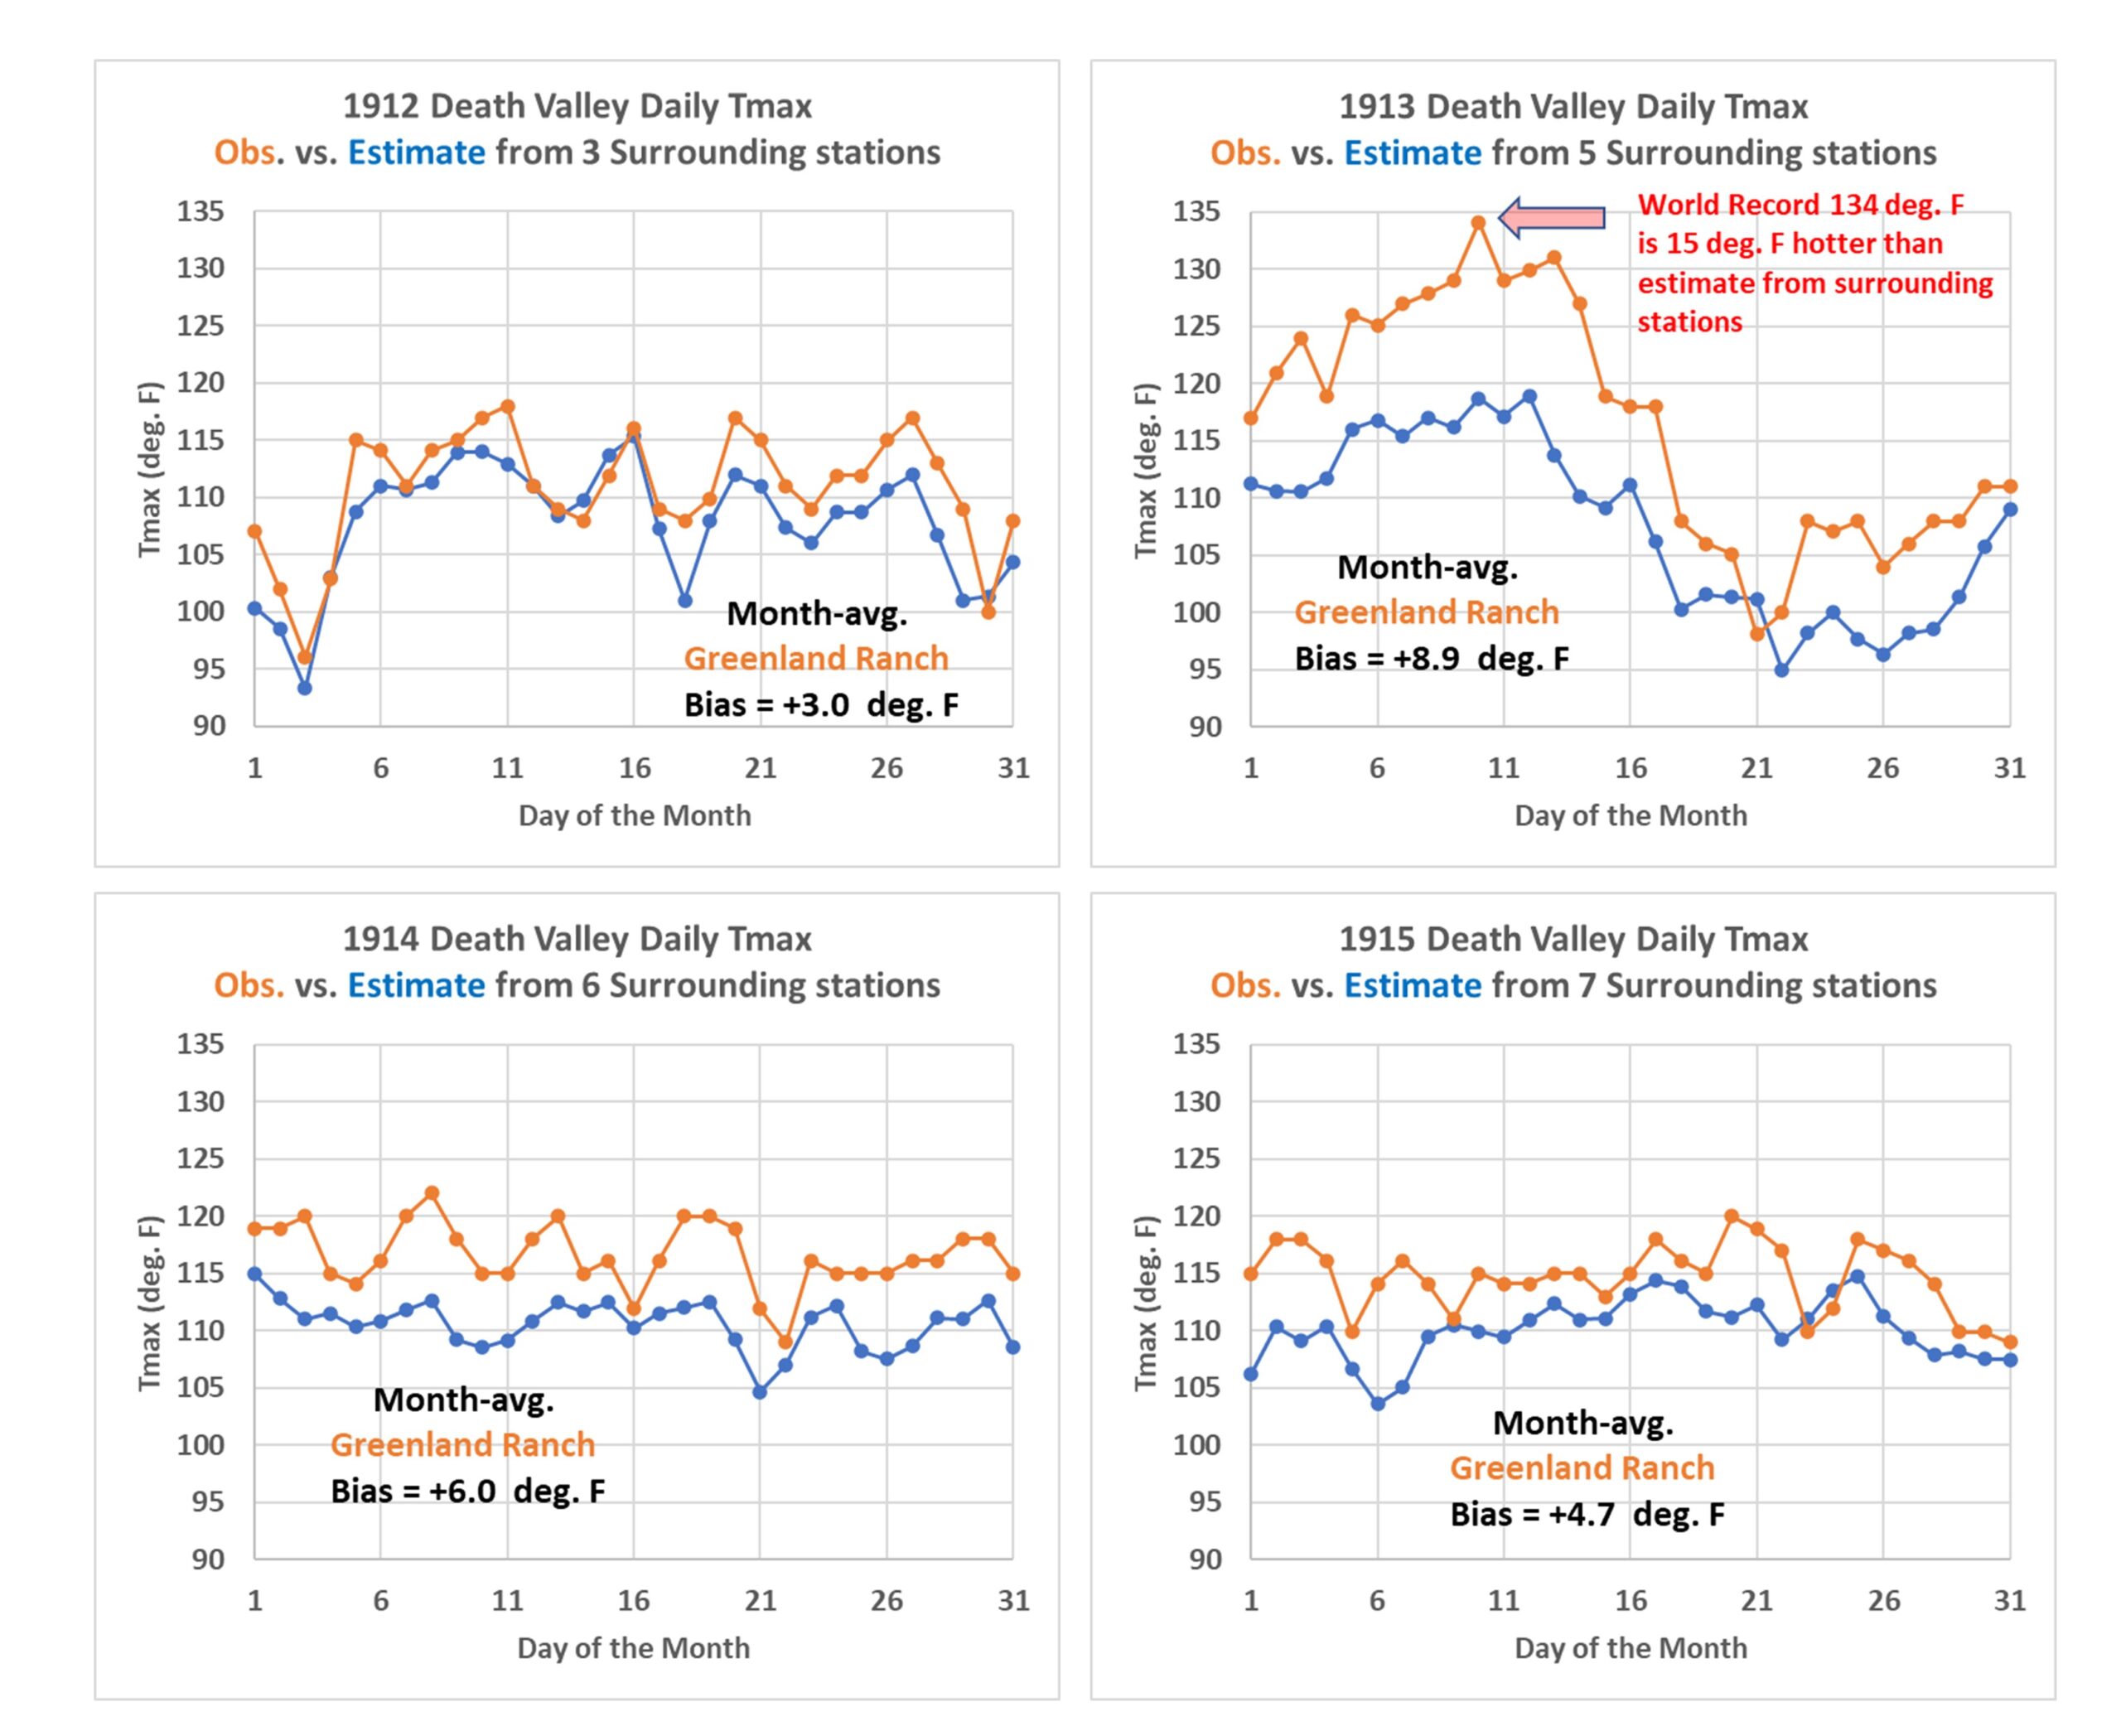
Fig. 4. Daily estimated Tmax temperatures for Death Valley during 1912, 1913, 1914, 1915 from surrounding stations (blue) compared to those observed at Greenland Ranch (orange, 168 ft. below sea level).
During these years there were only 3 to 7 stations from which to compute Death Valley Tmax. In 1912, despite only 3 stations, the reported temperatures averaged only 3 deg. F above those estimated from surrounding stations. But in 1913 (the year of the record) the observations averaged an astounding 9 deg. F warmer than the surrounding 5 stations would have suggested. On July 10, the excess was 15 deg. F!
That second week of July 1913 was indeed unusually hot, and it was during this time that the ranch foreman (Oscar Denton) responsible for making the temperature readings from an official instrument shelter provided by the U.S. Weather Bureau in 1911 might have replaced the official values with values that more accorded with the heat he and his supervisor (Fred Corkill) were feeling on his veranda, away from the USWB instrument shelter which was sited next to an irrigated field. Bill Reid covers the details of correspondence between Corkill and a USWB official in San Francisco regarding the shelter temperatures and how much cooler they were compared to what was measured by a second thermometer farther away from the irrigated field. Reid believes (and I agree) that the shelter temperatures were, at least for a time while Denton was responsible for tabulating the daily measurements, replaced with measurements from a separate thermometer having uncertain quality and siting away from hot surfaces exposed to the sun.
So, How Much Hot Bias Exists in the 134 deg. F “World Record”?
We will never know exactly how much warm bias exists in the world record value. But from comparison to the biases in 1912 and 1914, I would say 9 to 12 deg. F is a reasonable estimate.
Of course, this might be adjusted somewhat if one assumes a slightly different lapse rate than the -0.004 deg. F per ft. I have assumed here (see Fig. 1). For instance, what if the air mass on July 10, 1913 had an exceptionally steep lapse rate, such that an even greater adjustment for elevation needed to be made to estimate the hot temperature in Death Valley? If I use use the lapse rate estimated from the 5 surrounding stations on July 10, 1913 (see Fig. 5), that lapse rate value is indeed “steeper”, at -0.0053 deg. F per ft. But if we use that value to estimate the Death Valley temperature, it is still 10 deg. cooler than the 134 deg. F recorded value. This is still within the 9 to 12 degree bias range I mentioned above.
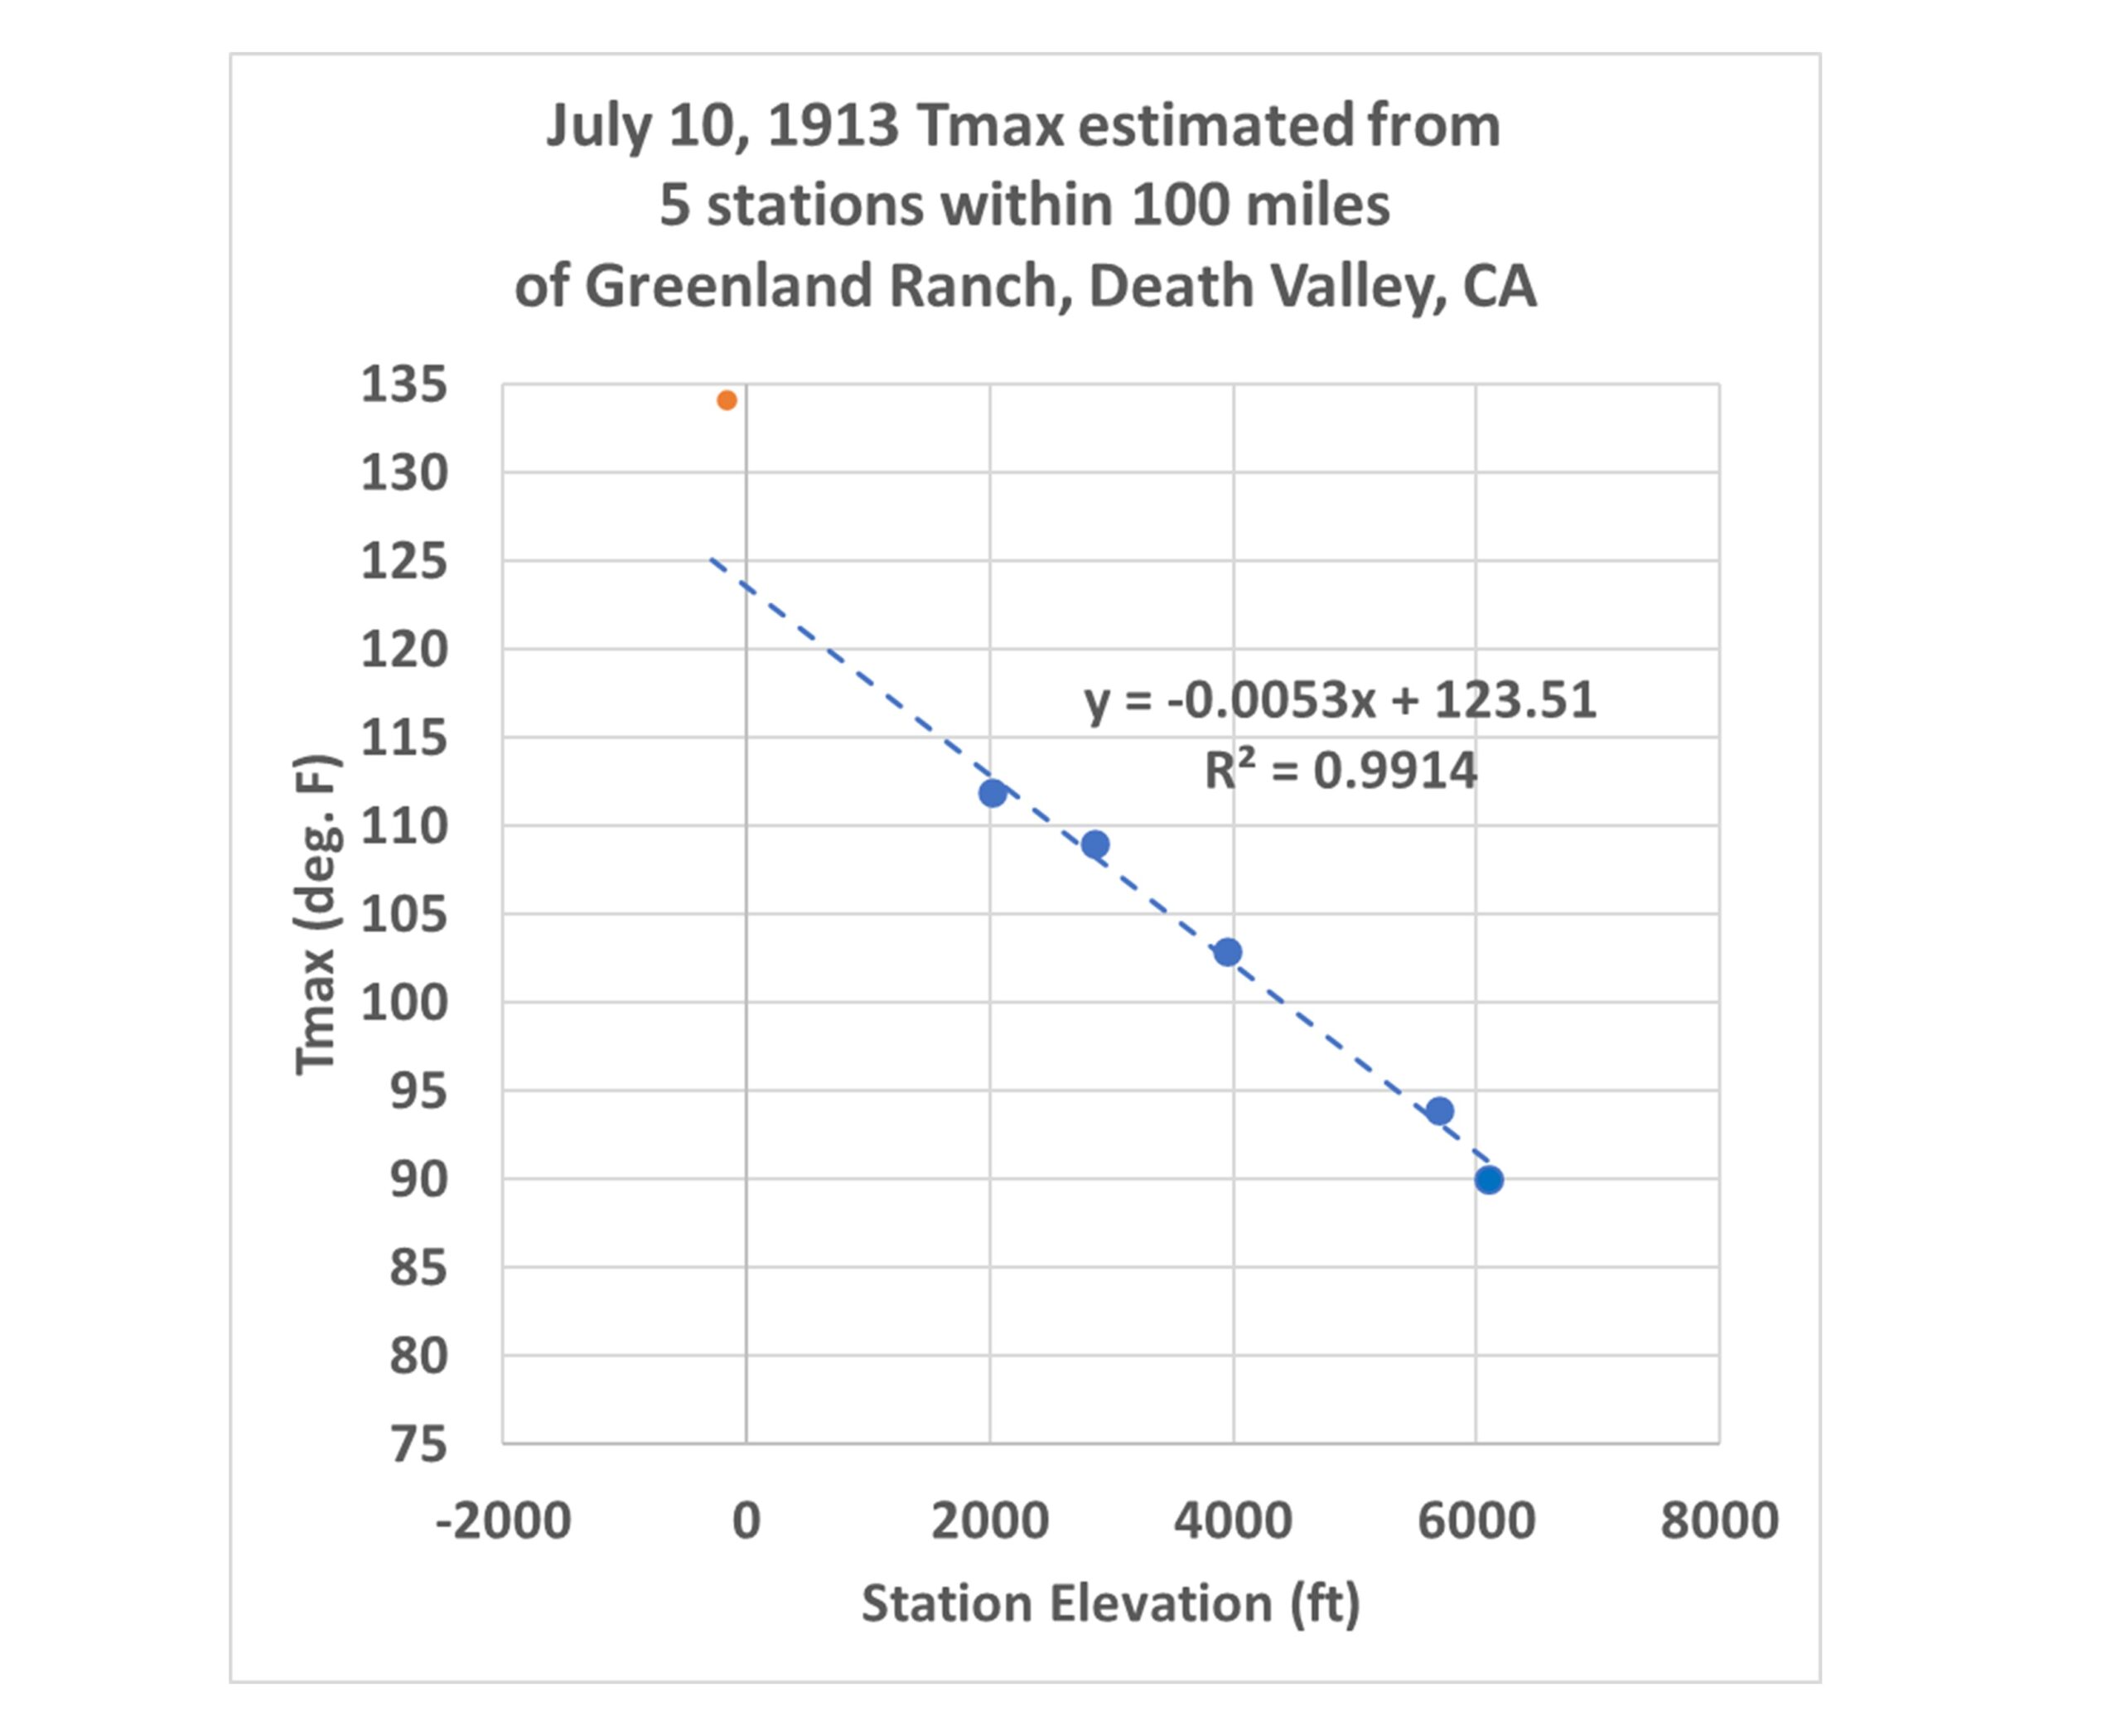
Fig. 5. The world record value of 134 deg. F (red) is 10 deg. F warmer than that suggested by the surrounding higher-elevations stations’ temperature variations with elevation on July 10, 1913.
Conclusion
The 134 deg. F world record hottest temperature from Death Valley is likely around 10 deg. F too high, compared to elevation-adjusted temperatures from surrounding stations. The most likely cause is that the ranch foreman’s reported measurements were (shall we say) unacademically recorded. I find it rather remarkable that the world record hottest temperature from Death Valley was not revised many years ago, since the methods for “fact checking” the record are fairly simple, and based upon meteorological principles known for well over 50 years.

 Home/Blog


From https://wattsupwiththat.com/2024/11/11/death-valley-temperatures-part-3-twelve-years-of-july-daily-tmax-estimates-and-the-134-deg-f-record/#comment-3993792 :
Kevin Kilty
November 11, 2024 5:11 pm
Figure 2, years 2021 and 2022 are identical right down to the smallest details. Something isnt right.
*** My bad, too many plots to keep straight. It will be fixed early Wednesday morning. –Roy
Have you considered other weather phenomena than temperature?
Foehn winds off of mountain tops can multiply the lapse rate if you consider precipitation and wind directions over mountain ranges that surround the valley.
https://youtu.be/e0C7XkTA9sg?si=r5hZcjcZt6K5hTdy
I have lived most of my life in Socal and most of that in areas most affected by Foehn winds. Most events only last a few days but occassionally you get some that get in the range of a couple of weeks.
Roy’s graph for July shows a significant departure for more than two weeks. While it might not be possible to estimate such an effect in arears one should be able to potentially rule it out if the correct conditions aren’t seen in some of the surrounding communities on the other sides of the mountain ranges surrounding death valley. Information for that should be available. Further 1913 was considered to be a very unusual year in many respects.
https://nationalcalamityeaster1913flood.blogspot.com/2017/02/1913s-wild-weather.html
I wonder if you’ve heard of Maximiliano Herrera, Roy. He is a climatologist who specialises in extreme weather events.
https://www.guinnessworldrecords.com/records/partners/consultants/maximiliano-herrera
He has various lists of record temperatures online, including one list for the USA. The 1913 Death Valley temperature gets a brief mention:
“Death Valley: -9.4 / 54.4* [record min / max]
* 56.7C recorded in 1913 is unreliable”
His email is at the bottom of his Extreme Temperature main page, should you be inclined to contact him.
https://www.mherrera.org/temp.htm
It’s a real disaster. Granada in the center.
https://i.ibb.co/fpbZbb7/Screenshot-2024-11-13-22-00-26.png
In three days, a stationary upper-level low (500 hPa) and a deep low in the lower troposphere will set up at the border of Canada and the US. Winter in the US is coming.
https://i.ibb.co/488FzGh/gfs-cape-usa72.png
ren…we have a bomb cyclone headed toward Vancouver, Canada.
Hope things are going well in Poland.
Earth Nullschool shows 944 mb ,,, the imagery looks like a hurricane.
ken…for some reason, they call them cyclones in the Pacific and hurricanes in the Atlantic. I may be all wet but it sticks in my mind that they turn in different directions.
I hear you guys on the Island are being hit pretty hard. The news reports there are waves off Tofino about 6 stories in height. I tried surfing once in that area with 10 footers but I’ll pass on the 60 footers.
May be that hurricanes predominate in the NH and cyclones/typhoons in the SH, therefore the Coriolis effect is likely involved as well as prevailing winds.
I call them all locally, the Pineapple Express. I was just out walking in it for 50 minutes, dodging falling branches and watching for falling trees.
There is an entire neighbourhood without power and the likely cause is Hydro workers being prevented from cutting down trees adjacent to power lines. That’s part of the reason I have no time for eco-loonies.
Rotation depends on NH and SH, not east – west.
The lexicon is probably because its not a tropical cyclone, so its not a hurricane.
Maui fire was caused by winds from Pacific hurricane Dora.
The current Jet Stream looks like Pineapple express. See Earth NullSchool at 250 hpa. Usually there isn’t a dense cyclone, like there is now, with Pineapple Express.
The number of days with geomagnetic storms per year has dropped significantly since 2008.
https://i.ibb.co/Zhbcvrs/liczba-dni-z-burz-geomag.png
It’s not just Death Valley in 1913.
A number of modern heatwaves were once thermodynamically impossible. Not because of fraud, but because the energy content of the climate system has increased.
https://interactive.carbonbrief.org/attribution-studies/index.html
Tell that to people who lived in the 1930s in the US and Canada. That’s when the record for heat waves was created in those countries.
No one was looking elsewhere on the planet so we’ll never know how heat waves affected those people. Heat waves are common place along the Equator.
Ent,
Ancient Vikings might disagree with you.
“Not because of fraud, but because the energy content of the climate system has increased.
https://interactive.carbonbrief.org/attribution-studies/index.html”
These attribution studies needed to be interpreted with caution:
https://www.worldweatherattribution.org/u-s-heat-february-2017/
The authors analyzed the frequency of February anomalies in CONUS exceeding +3.5C and calculated return intervals based on different baseline periods.
Roy Spencer made an excellent point in his post NC Floods, CA Drought, and the Role of Randomness by emphasizing that weather is a superposition of several contributing factors. With that in mind, I wonder if Dr. Spencer would agree with my argument that lumping warm CONUS winter months together is like comparing apples and oranges, especially when the unique physical drivers present during each month are ignored.
February of 54 is used as a historical analog in this study, but the circulation pattern differed from that of ’17.
In both cases, the Tropical/Northern Hemisphere pattern was in its negative phase, which usually promotes ridging east of the Rocky Mountains. But, in 54, an ongoing El Nio influenced the atmospheric setup.
When combined with a negative TNH pattern, El Nio tends to shift the deep trough over the eastern North Pacific further east, disrupting the usual ridging conditions in the eastern seaboard.
In contrast, the pattern in 17 occurred under neutral ENSO conditions.
https://www.cpc.ncep.noaa.gov/data/teledoc/tnh.shtml
Michael Mann referenced this specific attribution during his opening statement at a 2017 congressional hearing. You can skip to 31:48 to hear it:
https://www.youtube.com/watch?v=_3_sHu34imQ
No disrespect intended toward you Red, but I regard anything Michael Mann says as the words of a Klimate Klown. I realize that’s an ad hom reply but it’s the best I have to offer on the subject of Michael Mann.
Did someone with sloppy handwriting put in ‘3’ instead of ‘2’?
Meter readers do that a lot.
Gordon Robertson,
https://x.com/TomANelson/status/1855852716708294731
At the end of the previous thread, Nate wrote on December 2, 2024 at 6:52 AM:
” bunch of recent posts have vanished ”
*
The same just happened today, as it seems.