AP photo/ Ty O’Neil.
Summary
- Previous research has shown the temperatures recorded at Death Valley National Park (DVNP) have curious warm biases on very hot days, possibly due to instrument deficiencies or proximity to mounting structure apparatus and other manmade structures.
- Here it is shown from 21 years of summertime (June, July, August) data that DVNP has many more days when temperatures are much higher than those at the nearby Stovepipe Wells station, than when Stovepipe Wells has hotter days than DVNP station.
- These lines of evidence suggest that the hot summer daytime temperatures reported at Death Valley National Park have potentially large biases, and should only be used for their entertainment value.
In our continuing examination of the world record hottest temperature of 134 deg. F recorded at Greenland Ranch (now Death Valley National Park station) on 10 July 1913, we are finding some curious behavior in recent summertime temperatures there. (The Bulletin of the American Meteorological Society [BAMS] has accepted my proposal for a BAMS article showing the evidence that the 134 deg. F world record was 8 to 10 deg. F higher than what actually existed on that date [10 July 1913]).
Previous Work on Excessively Hot Death Valley Temperatures
Climatologist, weather observer, and storm chaser Bill Reid has blogged extensively over the years on the evidence against the 134 deg. F world record. A good place to start is his most recent post (Part 6) that deals with the Greenland Ranch foreman who made the excessively hot temperature measurements in the first half of July 1913. Bill has agreed to co-author the BAMS paper with John Christy and me.
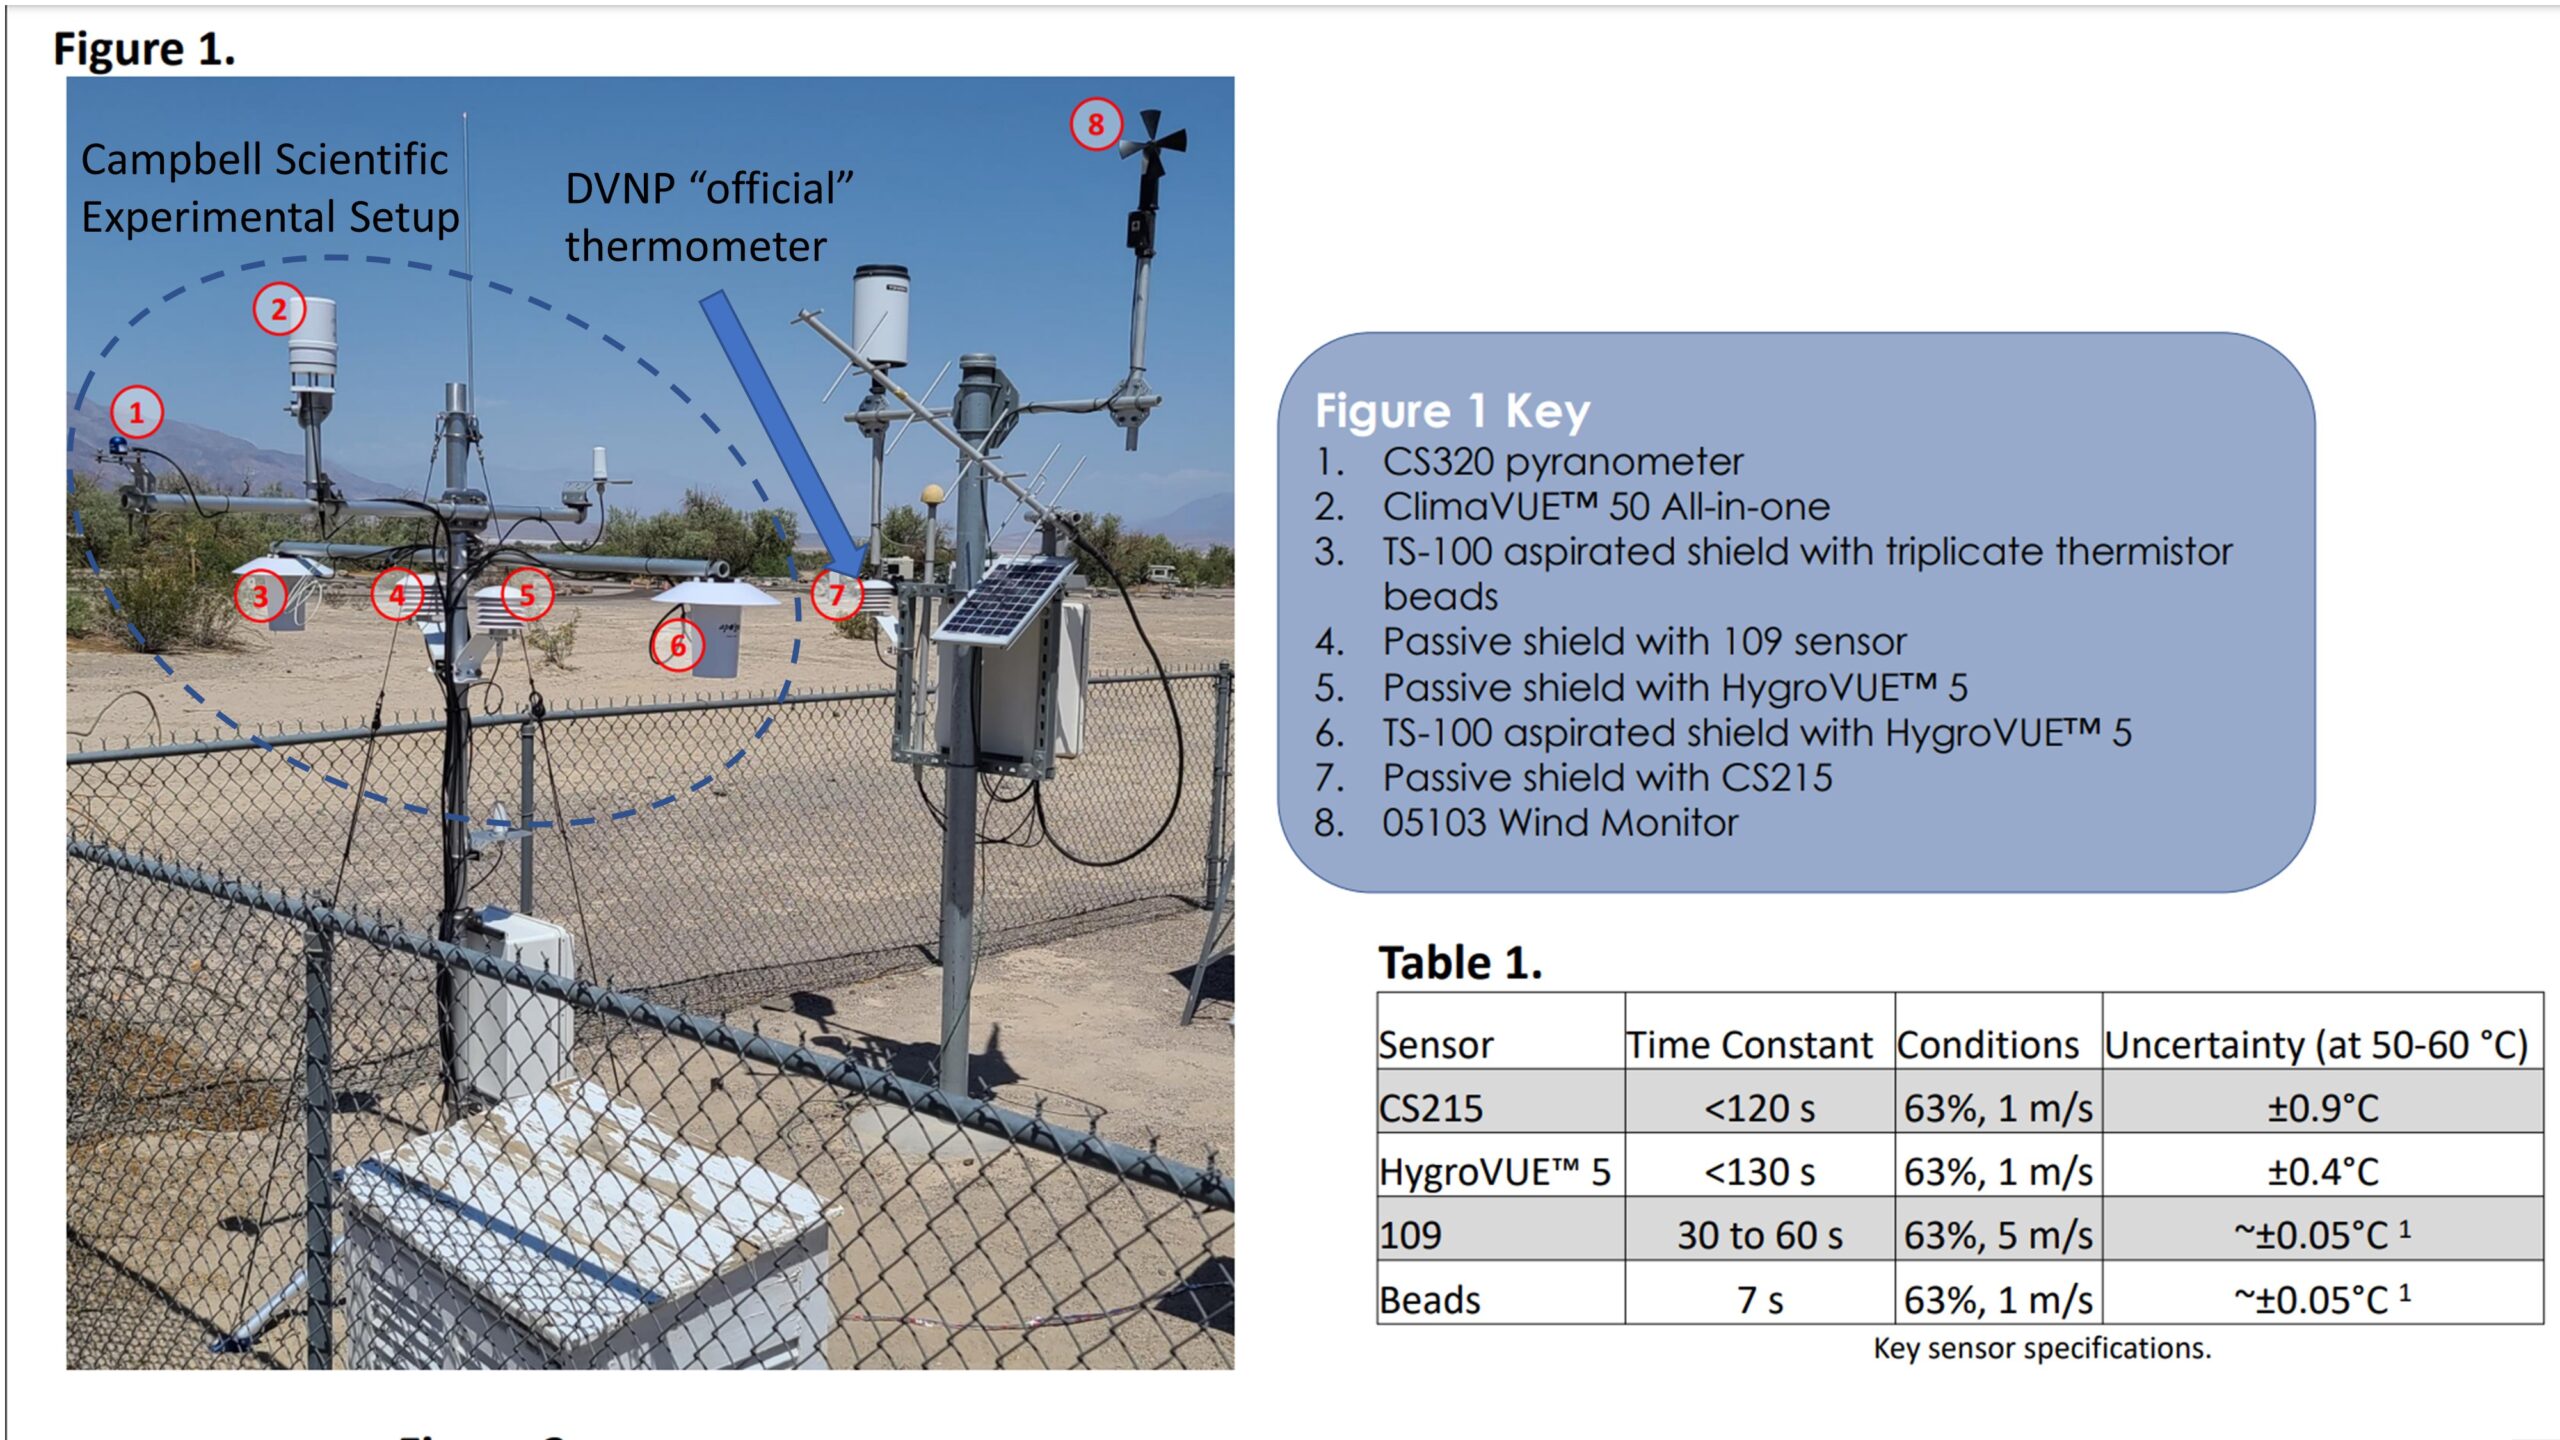
There was also an experiment carried out with a variety of temperature instrumentation placed next to the DVNP weather station during 2021 and 2022. This revealed that on the near-record hot day of 9 July 2021 (130 deg. F), the “official” DVNP sensor produced temperatures a few degrees hotter than the other instruments (AMS conference poster here). The photo in Fig. 1 shows that the older-style DVNP instrument (which is not aspirated) is mounted next to a lot of metal structure and a small solar panel.

Fig. 1 Death Valley National Park weather station, with additional instrumentation added by Dirk Baker (Campbell Scientific, Inc.) and co-investigators to compare to the ‘official’ temperature readings in 2021 and 2022. (Figure adapted from this AMS conference presentation).
The experimental setup in Fig. 1 used several temperature sensors, some with aspirated shields, others with no aspiration. The data shown in their AMS conference presentation suggests to me that the near-record 130 deg. F reading on 9 July 2021 was 2-3 deg. F too hot partly because of the non-aspirated design of the sensor. There was some additional warm bias that could have been due to all of the mounting structure seen in Fig. 1, including a small solar panel next to the DVNP station sensor.
More Evidence: DVNP vs. Stovepipe Wells Temperatures
For the last 21 years there have been two stations in Death Valley: the DVNP station next to the Furnace Creek Visitors Center, and a climate reference network (CRN) station at Stovepipe Wells, 29 km northwest of the DVNP station.
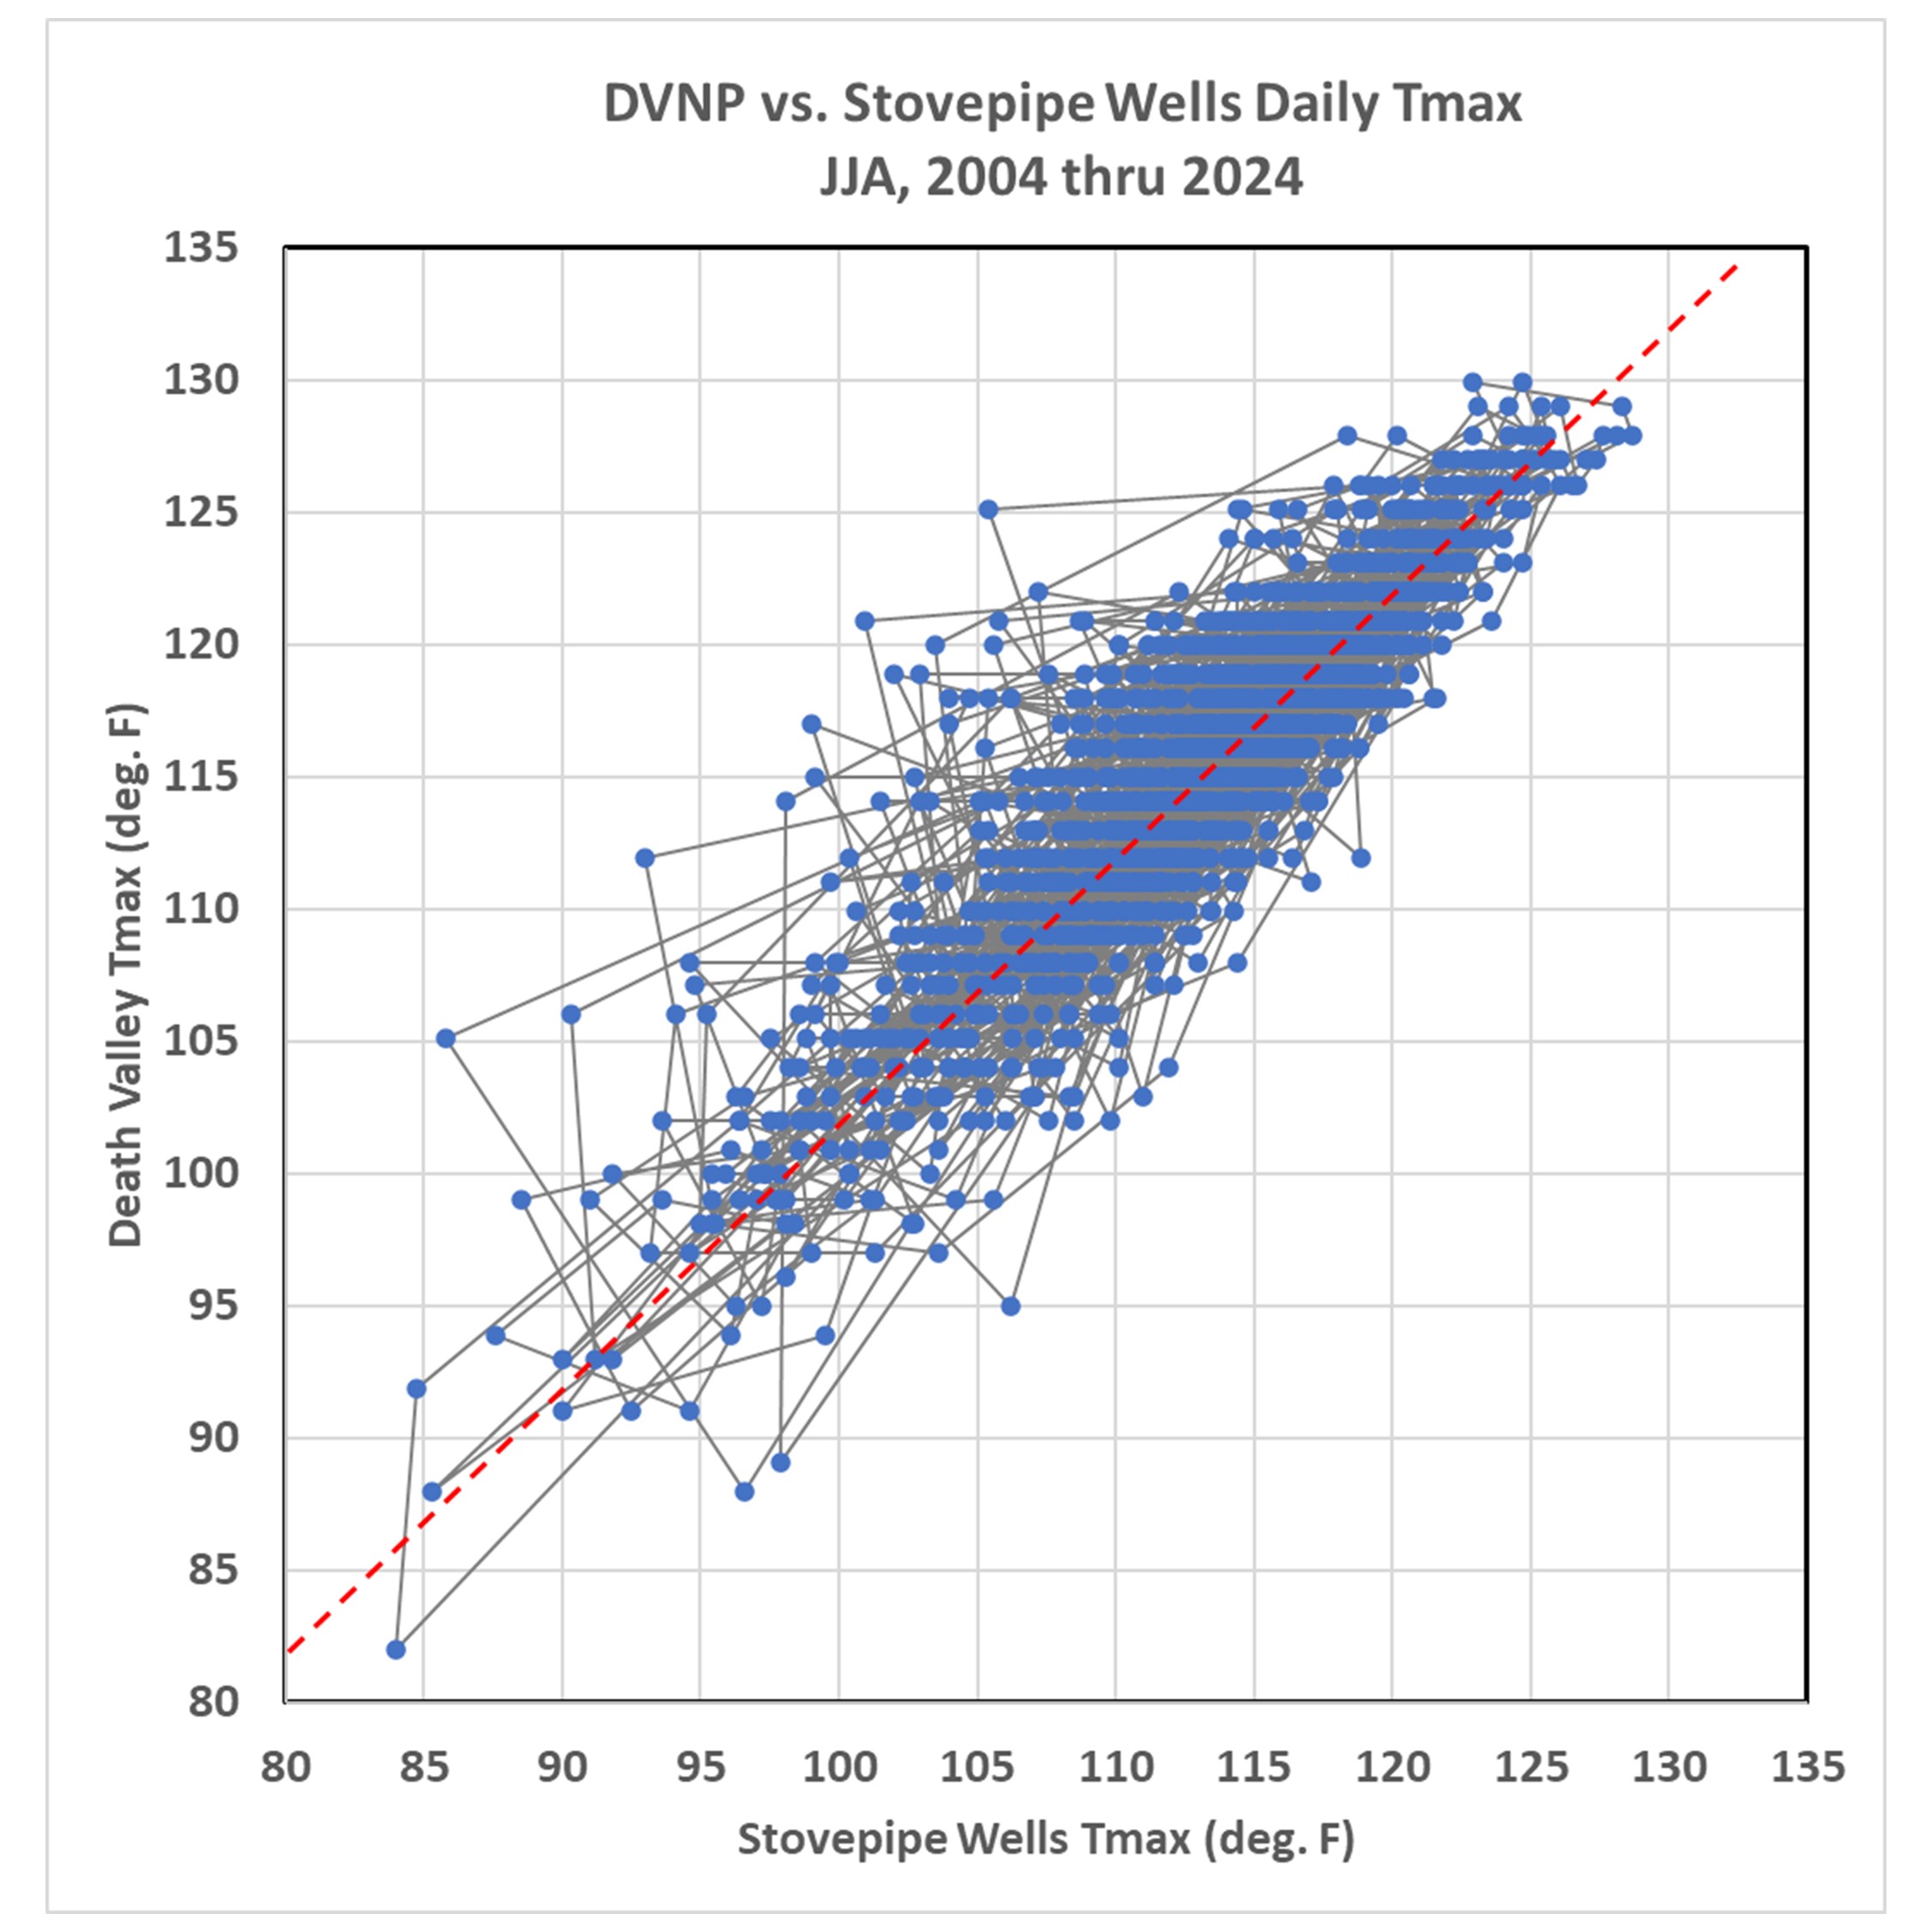
Fig. 2 shows a comparison of the daily maximum temperatures (Tmax) recorded at these two stations for every day in June, July, and August in all years from 2004 through 2024.

Fig. 2. Comparison between daily high temperatures (Tmax) recorded at Stovepipe Wells and Death Valley National Park, for all days in June, July, and August for the years 2004 through 2024. The dashed red line represents the median difference between the 2 stations (2 deg. F, DVNP warmer than Stovepipe Wells). Gray lines connect the days in chronological order.
The median of the Tmax differences between these 2 stations is 2 deg. F (DVNP warmer, represented by the dashed red line), while the average difference is 2.3 deg. F. The expected difference based upon elevation alone is 1.3 deg. F (DVNP station is 278 ft lower in elevation than Stovepipe Wells).
Note in Fig. 2 that there seem to be more outliers to the left of the dashed red line than to the right. That is, there are more days where DVNP is much warmer than Stovepipe Wells than there are days when Stovepipe Wells is much warmer than DVNP station.
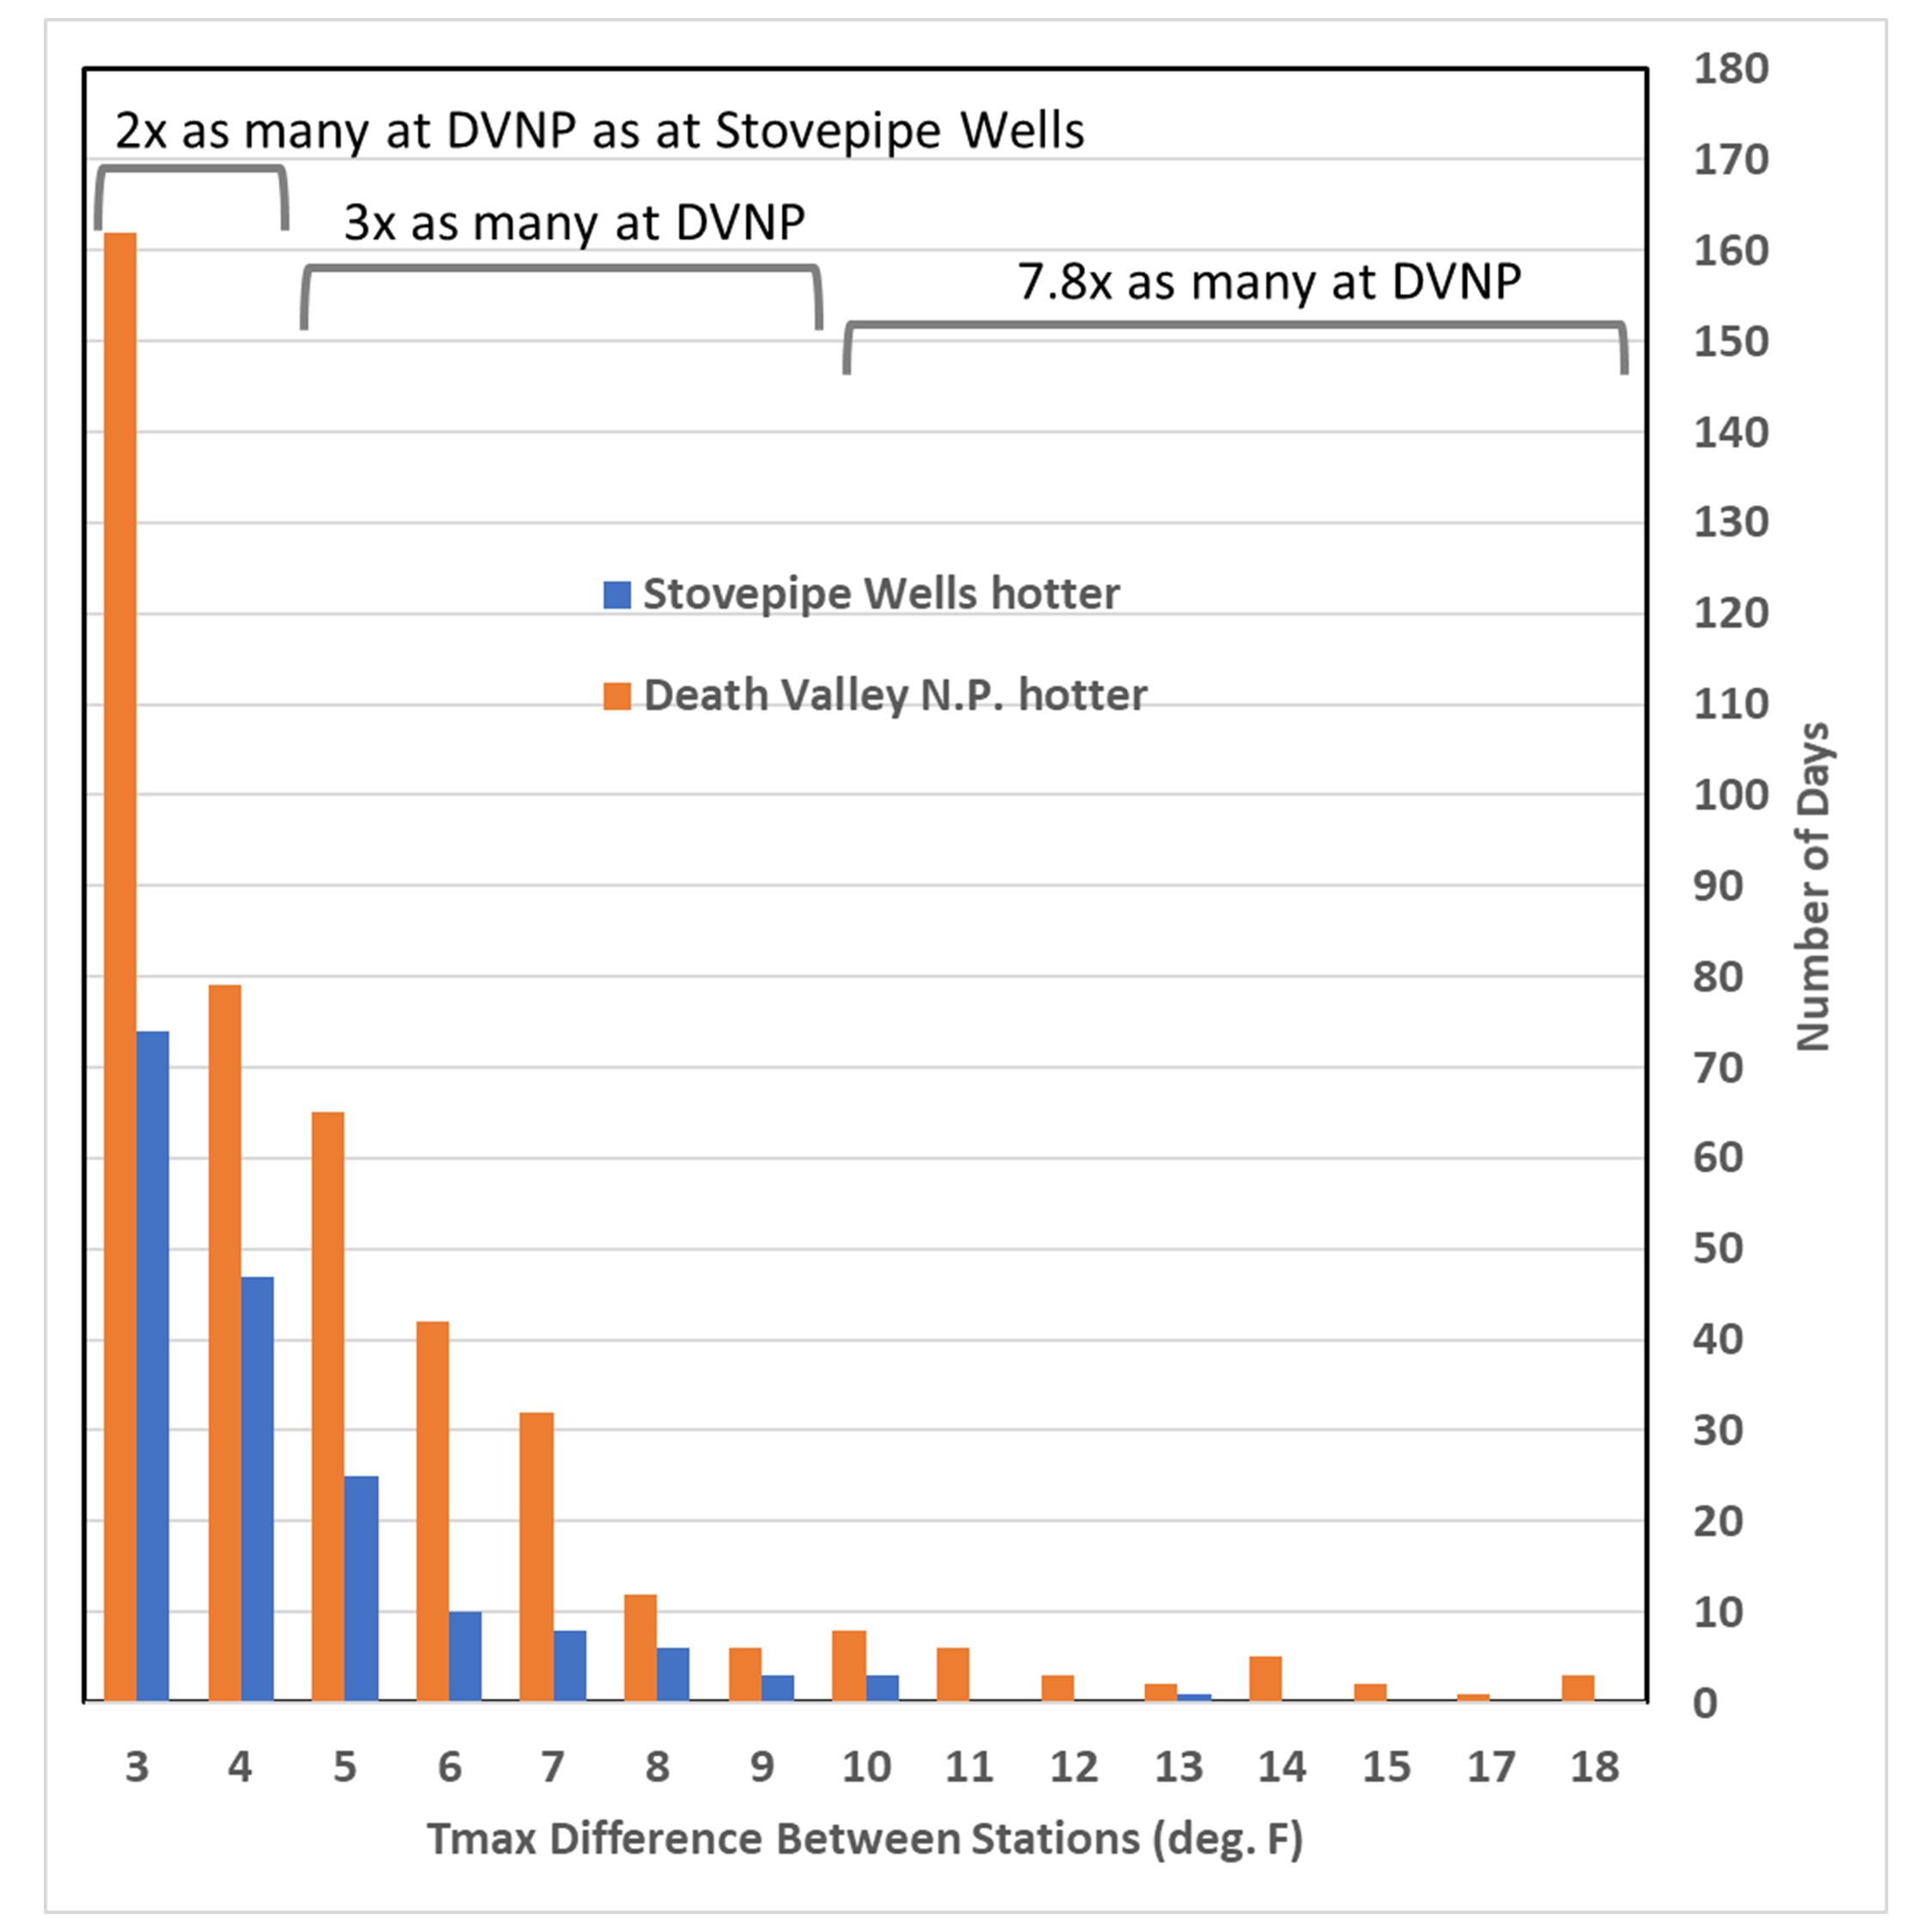
This can be better seen if we look at a frequency distribution of these station differences, adjusted for the 2 deg. F median difference between stations (Fig. 3).

Fig. 3. Frequency distributions of how many days where one Death Valley station is hotter than the other. This is after shifting of the distributions to account for a 2 deg. F difference in their median difference.
As shown in Fig. 3, DVNP station has many more days where it is hotter than Stovepipe Wells, than Stovepipe Wells has days that are hotter than DVNP station. For the 3-4 deg. F hotter category, the difference is 2X, for the 5 to 9 deg. F hotter category the difference is 3x, and for 10 deg. F or greater the difference is 7.8X.
This suggests there is something wrong with the Death Valley National Park instrumentation itself or the immediate environment around the temperature sensor that causes some days to be biased too hot. Bill Reid, who has researched this issue extensively, suspects that days with low wind have excessive heat build-up at the DVNP thermometer site, both in the general area around the instrumentation, and due to the non-aspirated design of the temperature sensor used there.
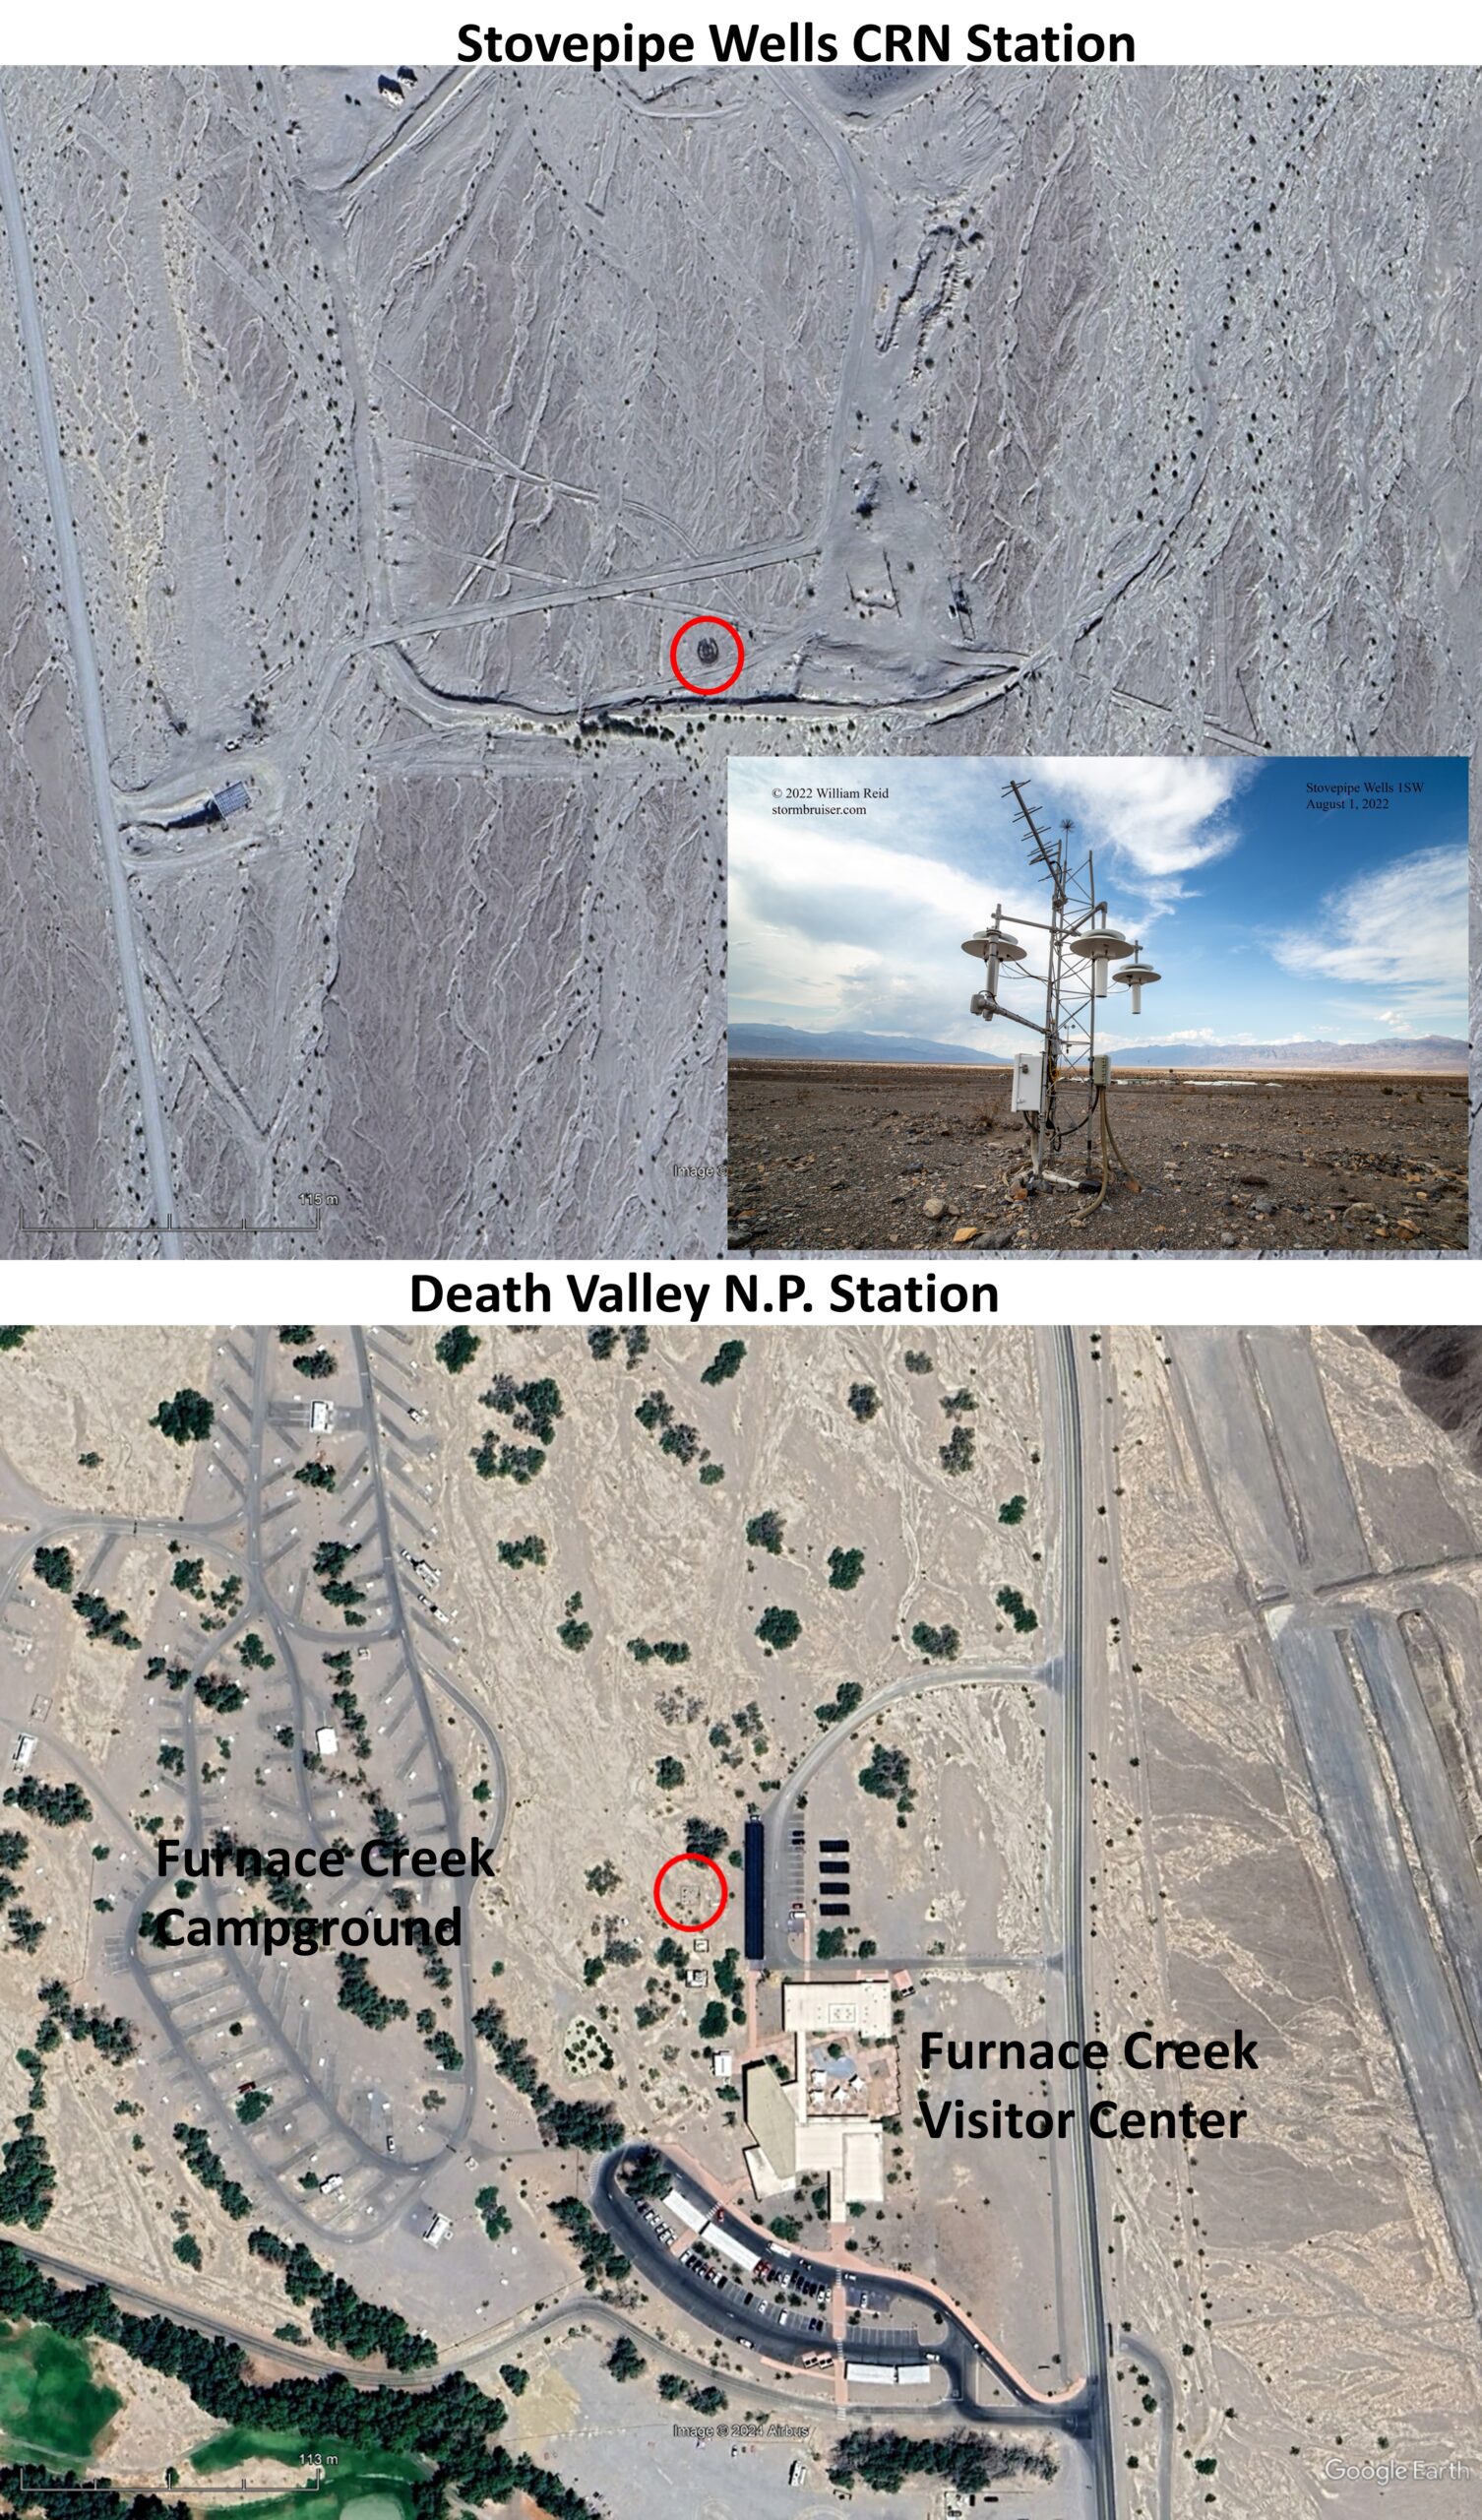
The difference in exposure at DVNP station and Stovepipe Wells is shown in Fig. 4.

Fig. 4. Google Earth imagery of Stovepipe Wells station (top) and Death Valley N.P. station (bottom), stations circled in red. The inset photo at top is of the Stovepipe Wells Climate Reference Network station, courtesy of William T. Reid. The E-W distance across these images is just over 0.5 km.
As can be seen in Fig. 4, the Death Valley N.P station has quite a bit of development surrounding the station, with parking lots, a paved campground, the Visitors Center, solar panels (black) and trees just to the south. The Stovepipe Wells site has almost no development and no vegetation. It is possible that during the prevailing southerly wind flow during the summer, the structures and trees to the south of the DVNP station lead to stagnation of air flow around the temperature sensor.
Conclusions
The evidence presented here, along with evidence presented previously by Bill Reid, Dirk Baker, and others, suggests that Death Valley National Park temperatures should not be relied upon for accurate daytime readings, and that near-record temperatures there are biased too high. The reasons for the biases are not obvious, but the evidence suggests poor sensor ventilation during the daytime when various structures in the vicinity heat up: whether the shield of the sensor itself, its supporting structure, or various manmade objects around the station site. It is also possible that the trees and other structures to the south of the station restrict air flow, further reducing effective convective heat transport away from the solar heated desert surface.
It is my opinion that “official” Death Valley temperatures should use the Stovepipe Wells site data, which come from state-of-the-art Climate Reference Network instrumentation. The traditional site near the Death Valley National Park Visitors Center should only be used for entertainment purposes.
Maybe the National Park Service should investigate adding a CRN station; a good location would be about 1.6 km southwest of the current station, well away from the Furnace Creek tourist area.

 Home/Blog


