
 Home/Blog
The Version 6.1 global average lower tropospheric temperature (LT) anomaly for January, 2025 was +0.46 deg. C departure from the 1991-2020 mean, down substantially from the December, 2024 anomaly of +0.62 deg. Most of this cooling was over the global oceans.
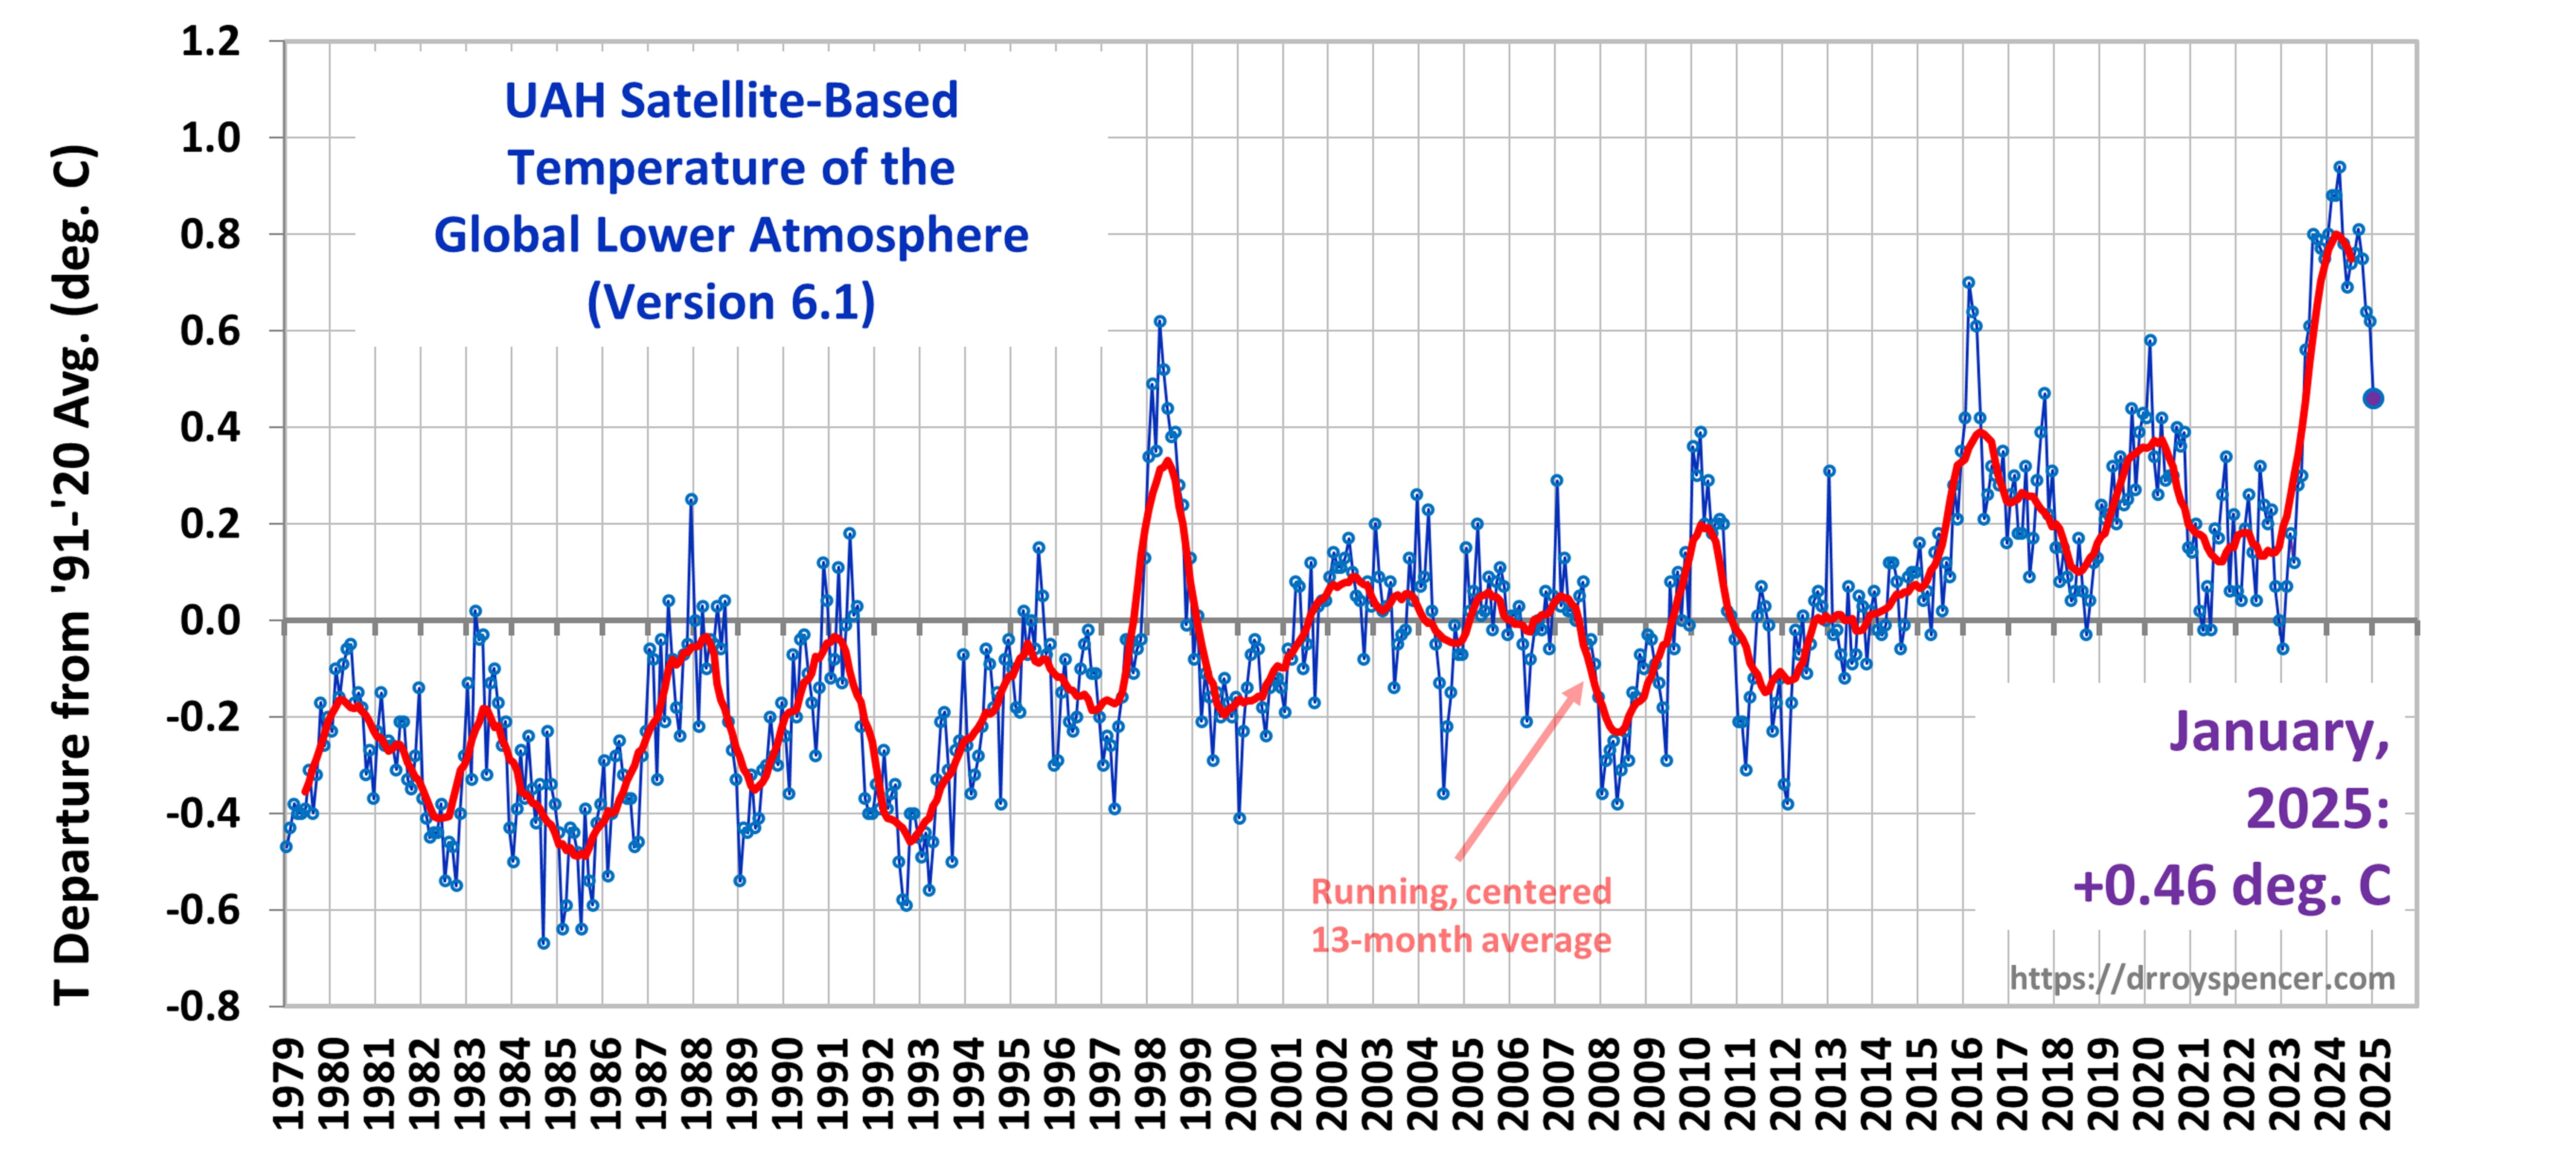
The Version 6.1 global area-averaged temperature trend (January 1979 through January 2025) remains at +0.15 deg/ C/decade (+0.22 C/decade over land, +0.13 C/decade over oceans).
The following table lists various regional Version 6.1 LT departures from the 30-year (1991-2020) average for the last 13 months (record highs are in red).
| YEAR | MO | GLOBE | NHEM. | SHEM. | TROPIC | USA48 | ARCTIC | AUST |
| 2024 | Jan | +0.80 | +1.02 | +0.58 | +1.20 | -0.19 | +0.40 | +1.12 |
| 2024 | Feb | +0.88 | +0.95 | +0.81 | +1.17 | +1.31 | +0.86 | +1.16 |
| 2024 | Mar | +0.88 | +0.96 | +0.80 | +1.26 | +0.22 | +1.05 | +1.34 |
| 2024 | Apr | +0.94 | +1.12 | +0.77 | +1.15 | +0.86 | +0.88 | +0.54 |
| 2024 | May | +0.78 | +0.77 | +0.78 | +1.20 | +0.05 | +0.20 | +0.53 |
| 2024 | June | +0.69 | +0.78 | +0.60 | +0.85 | +1.37 | +0.64 | +0.91 |
| 2024 | July | +0.74 | +0.86 | +0.61 | +0.97 | +0.44 | +0.56 | -0.07 |
| 2024 | Aug | +0.76 | +0.82 | +0.70 | +0.75 | +0.41 | +0.88 | +1.75 |
| 2024 | Sep | +0.81 | +1.04 | +0.58 | +0.82 | +1.31 | +1.48 | +0.98 |
| 2024 | Oct | +0.75 | +0.89 | +0.61 | +0.64 | +1.90 | +0.81 | +1.09 |
| 2024 | Nov | +0.64 | +0.88 | +0.41 | +0.53 | +1.12 | +0.79 | +1.00 |
| 2024 | Dec | +0.62 | +0.76 | +0.48 | +0.53 | +1.42 | +1.12 | +1.54 |
| 2025 | Jan | +0.46 | +0.70 | +0.21 | +0.24 | -1.06 | +0.74 | +0.48 |
The full UAH Global Temperature Report, along with the LT global gridpoint anomaly image for January, 2025, and a more detailed analysis by John Christy, should be available within the next several days here.
The monthly anomalies for various regions for the four deep layers we monitor from satellites will be available in the next several days at the following locations:


Well, finally.
If it keeps dropping precipitously, it won’t look all that different to 98. If.
“If it keeps dropping precipitously, it wont look all that different to 98. ”
Except 1998 was a single year, where 2023 and 2024 were both record breaking.
Here’s what it looks like using a 24 month rolling average.
https://i.imgur.com/Ducv1ii.png
Here’s a direct comparison of the years from 1997 and 2023.
https://i.imgur.com/PEllNHw.png
The recent spike lasted much longer than in 1998.
Except that la Nina 2025 corresponds to la Nina 1999, not to el nino 1998.
That confirms what I perceived going by eye: This peak looks wider. I was actually starting to consider that it might be a step-change, and not go back down at all. But that would have been a real surprise. If the trend were so strong as to drown out periodic fluctuations we would be in real trouble. Fortunately there’s no indication of that.
” Except that la Nina 2025 corresponds to la Nina 1999, not to el nino 1998. ”
La Nina 2025 correspond at all to La Nina 1999:
https://psl.noaa.gov/enso/mei/img/mei_lifecycle_current.png
*
” If it keeps dropping precipitously, it wont look all that different to 98. ”
https://www.cpc.ncep.noaa.gov/products/CFSv2/imagesInd3/nino34Mon.gif
ENSO has moved above the ‘-0.5’ La Nina treshold soon after end of last January…
For the past 15 years, Ive been curious about how ENSO would respond to global warming. Until recently, I hadnt considered how the frequency of its fluctuations could shift if the area under the temperaturetime curve continues to grow for El Nino spikes. If theres more heat in the system, then it makes sense El Nio events might last longer and release more energy. Still, I suspect this latest spike was influenced by the Tonga eruption. It will be fascinating to watch how everything unfolds over the next decade.
It was affected by the HTE. There were multiple Tonga effects which are only now dissipating. We are likely to see continued cooling all year as a result.
The biggest effect was an immediate reduction in clouds. This was initially offset by SO2 injection into the stratosphere. However, the SO2 faded away about the same time as the El Nino took hold. This was why we the warming took off so quickly in mid 2023.
Some of the water vapor injection is still present in the stratosphere although some of it has moved downwards into the upper troposphere. That continues to dissipate as well. I think most of that warming influence will end this year.
We now know the warming this century was caused by cloud reductions leading to increases in solar energy reaching the surface.
“Some of the water vapor injection is still present in the stratosphere although some of it has moved downwards into the upper troposphere. That continues to dissipate as well. I think most of that warming influence will end this year.”
What warming effect did the water vapour increase have? Could you explain a little?
Yea I suspect ENSO frequency will remain same and eventually this anomaly will be associated with Tonga. The physics will change how we consider natural climate change.
Two potential candidates include changes in radiative forcings due to the Tonga eruption in 2022, which injected water vapour into the stratosphere16, and the introduction of shipping regulations in 2020, which have reduced visible ship tracks
Twelve months at 1.5 C signals earlier than expected breach of Paris Agreement threshold, Nature
In what way does the water vapour in the atmosphere affect the radiative forcing?
Barry, The additional stratospheric moisture absorbed and re-radiated infrared radiation, leading to temporary warming. It will last until the 10% extra water vapor dissipates and likely decay gradually. Then we go back to equilibrium state like prior to eruption. The physics for dissipation are new as this is the first wet, but low sulfer eruption documented.
Aaron,
Eecent research suggests slight or no warming due to cancellation by the cooling effect of aerosols.
https://agupubs.onlinelibrary.wiley.com/doi/10.1029/2024JD041296
Nate,
Aerosols have huge uncertainty. Im Saying this from the radiative forcing graph and tables from IPCC for global models of long term climate. So if they are uncertain, then how do we actually know which sensitivity to use? This was a relatively lower aerosols ejection and there is not a history of this much water vapor into stratosphere. So the two forcing have uncertainty. On this one only time will tell, IMHO. For example if temperature stays high perhaps the aerosols model is right. If it returns to preTonga like TEMPERATURE, then that is cool.
GHG AGW is a slow continuous phenomenon. Transient temperature excursions have nothing to do with AGW from GHGs. Any concerns about this are overwraught. And ICPP AR6 chapter 12 pg 1856 reveals essentially no extreme weather trends outside natural variation for everything EXCEPT temperature extremes, although it would not be unexpected or alarming that some small trends do occur. See also
https://rogerpielkejr.substack.com/p/what-the-ipcc-actually-says-about
Certainly the benefits of burning carbon fuels are so great as to be almost beyond our ability to appreciate, and far offset any of these proposed minor “extreme” weather variations (excluding temperature increases over centuries, which are a concern). And it is true CO2 is a green gas that is greening the planet. The plants and animals love this recent human intervention. And the true global ECS is about 2 C, which has been grossly over evaluated for over 40 years by the AGW alarmist propagandists in and out of academia.
Does anyone have a link to a graph of the lower stratosphere which is up to date? Thanks.
Buzz
I just generated one with data up to Dec 24:
https://drive.google.com/file/d/1fCc1t5nzQ3EZv5SQPSbZCq3Z1yGeFQx4/view
A bit more about LS:
https://www.drroyspencer.com/2025/02/uah-v6-1-global-temperature-update-for-january-2025-0-46-deg-c/#comment-1697881
La Niña is here: https://www.climate.gov/news-features/blogs/enso/january-2025-update-la-nina-here
blog test
blog test2
Interesting contrast to ERA which has this January warmer than last year.
UAH still makes this the 2nd warmest January. The ten warmest Januaries so far.
2024 0.80
2025 0.46
2016 0.42
2020 0.42
2010 0.36
1998 0.34
2013 0.31
2007 0.29
2017 0.26
2019 0.24
I wonder if the strong solar activity over the last two years could have something to do with it. Sure, the data do not indicate something unusual with the peak of cycle 25, but observations tell a different story.
Over the past two years again and again there were northern lights over Austria, and large parts of Europe over all. They almost became a common sight. The last time that happened was in the years 1938 to 1941, during cycle 17. Since then there was nothing.
Also interesting is the energy emitted by these mass ejections. Although it is hard to get any precise figures, using the few hints there are, they should not be negligible.
I have wondered about that as well. Even in Denmark, my location, the frequency of Northern lights is outstanding. If there wasn’t so much artificial light “pollution” (forgive the word) many more people would notice.
What is your source for the last time that happened ?
I was told, it is the colder higher atmosphere, and a waning geomagnetic field to blame for it, not the sun or the eruptions. Do you know if that could be true?
E. Schaffer
Oh what a miracle! Weren’t you one of those who claimed a few years ago that SC25’s activity would barely exceed that of SC24?
In any case, apart from a sudden quiet phase from August 2023 to March 2024, SC25 is quite active, isn’t it?
https://drive.google.com/file/d/1ZXKy96mHyuMttcg2vy7k0b3DeLfKzmML/view
Isn’t the question then rather: what exactly do the northern lights have to do with the solar power that actually warms the planet?
1. No, I was not.
2. Radiation is not the only vector by which the sun transfers energy. It ejects high energy (or high speed) particles into space, aka “solar wind”. Depending on the level of solar activity, we see enormous variation in the temperature of the thermosphere, ranging from 500 to 2000K.
” It ejects high energy (or high speed) particles into space, aka solar wind. ”
For example:
https://i.ibb.co/r21cv5jH/number-of-days-with-a-ge.png
Slightly cooler than I expected with only a weak La Nina. Could be a sign the recovery from Hunga Tonga is accelerating. More likely, last month was just a slightly higher than is should have been.
If we assume a recovery from HTe of around 0.05 C / month, it’s going to take about 6-8 months to fully recover.
We still could see UAH continue to drop about 0.1 C / month through May but then flatten out as this La Nina, ends.
With this cooling on top of the Willis E article showing the CERES data (which verified Miskolczi 2010), there can be no doubt that AGW is fiction.
There is no ‘recovery’ from Hunga Tonga as it had no influence.
Something led to a large reduction in clouds which started the month after the eruption. In this case the correlation is solid.
Richard M
Complete this sentence:
Correlation is not __________.
The HadCRUT dataset has not yet been updated, but I expect a similar drop. This plot compares the current spike to the spike following the 1875 eruption of Askja — a wet volcano. I wouldn’t be so quick to dismiss HT.
https://localartist.org/media/HTvAkjsaENSO.png
You said it had no influence. I’ve read that it increased stratospheric humidity by as much as 10%. That would explain the temperature spike.
A 10% increase in global stratospheric water vapor over night had no influence on climate – sure it didn’t.
Meanwhile the stratosphere cooled several degrees after the eruption and continues to be below average. The polar stratosphere is currently the coldest it has been in the satellite era and cold enough to form PSCs – currently over 20 degrees cooler than the average. The forecast is for even colder temperatures for this month and the formation of type two PSCs. Surely there are no teleconnections between the stratosphere and troposphere, right, since the eruption had no influence on climate – it is known.
Get ready for more of that stratospheric air to dump into the troposphere in the coming weeks and more cooling in February.
I feel strongly this is a recovery from Hunga Tonga. 10% increase in water vapor relative to the typical global load is massive. What is not clear is the residence time. Where can we get global water vapor values? Real time? Daily? And are they currently elevated over the Arctic relative to a climate trend?
If Hunga Tonga’s water vapor upload in January 2022 had had any influence on LT’s temperature increase: then there should have been since the eruption a very strong decline in LS temperature, corresponding to an inverse of LS temperature increase after the Pinatubo eruption in 1991:
https://drive.google.com/file/d/1fCc1t5nzQ3EZv5SQPSbZCq3Z1yGeFQx4/view
There was no decline AT ALL in LS temperature since 2022:
https://drive.google.com/file/d/1K42APGS89jCON0dAmdWgDj0aNw6z4iir/view
And the small 0.5 C drop in 2023/24 is absolutely negligible compared to the peaks after El Chichon and Pinatubo.
*
All people insisting on the 150 Mt water vapor and its supposed effect ‘forget’ that Hunga Tonga’s SO2 upload, though much smaller than El Chichon’s or Pinatubo’s, was in turn not negligible at all.
*
The Estimated Climate Impact of the Hunga Tonga-Hunga Ha’apai Eruption Plume
Schoeberl & al. (2023)
https://agupubs.onlinelibrary.wiley.com/doi/full/10.1029/2023GL104634
” Scaling to the observed cooling after the 1991 Pinatubo eruption, HT would cool the 2022 Southern Hemisphere’s average surface temperatures by less than 0.037°C. ”
*
To understand what Schoeberl & al. mean, you just need to compare LT’s reactions to the huge LS warmings after El Chichon and Pinatubo with the supposed reaction of LT to LS after Hunga Tonga:
https://drive.google.com/file/d/1jFVD4AOyXQXIAotsDflm6ISagb5SpOtb/view
There is hence few probability that the strong LT peak starting in 2023 (quite similar in size and slope to the El Nino peak in 1997/98) was due to Hunga Tonga.
By the way, this is what Roy Spencer wrote about one year ago on this blog… but I’m sure that the hyperspecialists posting here know all this much better than Mr Spencer!
Why are you just looking at the area where the underwater volcano happened.
At one point the stratosphere all over the world contained an extra 15% water vapour.
Why are you just looking at the area the underwater volcano happened.
At one point the stratosphere all over the world contained an extra 15% water vapour.
Dear ‘Richard M’:
please clarify, which ‘Willis E article’ (2010 – 2025)? …
which ‘verified’ [sic, confirmed or extended ] Miskolczi 2010?
— ? Energy & Environment Volume 21, (4) Pages: 243 -262 —
— Best Regards, — RLW
It was WAY cooler than I expected, Richard M.
I saw the battle between La Niña (cooling), weakened Polar Vortex (warming) and HTE (warming). Just looking at the charts, I expected the anomaly to be higher (warmer).
Maybe this means the HTE is, finally, no longer a factor?
HTE is still a factor. It’s move a little.
https://acd-ext.gsfc.nasa.gov/Data_services/met/qbo/h2o_MLS_vLAT_tap_75S-75N_146hPa.png
https://acd-ext.gsfc.nasa.gov/Data_services/met/qbo/mls_h2o_taperecorder_lat_45S-45N_10hPa.png
Good point, Richard M.
I should have said, “…no longer as big a factor as it was”.
You’re saying the greenhouse warming from HT may have had a significant impact, right?
Is there research showing the HT volcanic eruptions are still having an effect? The research I know concluded its influenced ended a year ago, and the effect was a slight cooling.
Hunga induced circulation changes that reduce stratospheric ozone and lower temperatures also play a role in the net forcing. The change in the radiative flux would result in a very slight 2022/3 cooling in Southern Hemisphere. The Hunga climate forcing has decreased to near zero by the end of 2023.
Evolution of the Climate Forcing During the Two Years After the Hunga Tonga-Hunga Ha’apai Eruption, M. R. Schoeberl et al, Journal of Geophysical Research: Atmospheres, v129 i14 Jul 2024.
https://doi.org/10.1029/2024JD041296
==
News article:
Atmospheric Effects of Hunga Tonga Eruption Lingered for Years: A new study builds on previous research into the underwater volcanos effects on the climate, Rebecca Owen, EOS, 22 August 2024.
https://eos.org/research-spotlights/atmospheric-effects-of-hunga-tonga-eruption-lingered-for-years
The first source failed in the very first sentence:
“We calculate the climate forcing for the 2ys (sic) after the 15 January 2022, Hunga Tonga-Hunga Ha’apai (Hunga) eruption.
Any “calculation of the climate forcing” is based only on beliefs.
And the second source merely regurgitates the first source.
That ain’t science.
As opposed to the zero calculations that you did…
Bwa ha ha!
Nate believes all ”calculations”.
Figures don’t lie, but liars do figure
Clint is simply pointing out that it is not at all understood how the GHE occurs, thus calculation based on an unproven theory of how the GHE works trump rwh
where is nothing but bunk.
Nah. And Clint simply denies the ordinary physics behind the GHE, as explained by Roy Spencer.
Nate says:
“Nah. And Clint simply denies the ordinary physics behind the GHE, as explained by Roy Spencer.”
The ordinary physics are fine. What hasn’t been addressed is the wide acceptance that the GHE exists because the “sky” mean temperature is warmer than outer space 3C.
Thus, it is also accepted that if the sky gets warmer so will the surface.
But that runs somewhat afoul of the idea that the sky is warmed by the surface. A little chicken vs the egg problem.
We can only conclude that there are chickens and eggs and that there is a surface temperature and a sky temperature.
Closure of the atmospheric window is one method of warming the surface from the perspective of the surface seeing less outer space without physically changing the temperature of the sky.
Seems a lot of reliance on band broadening. The higher the diffusion the greater the broadening. But in S&O increased concentrations don’t seem to create the effect expected from band broadening.
Perhaps Nate can take another attempt at explaining that.
As I see it the thermosphere provides a clue of what a nitrogen/oxygen atmosphere looks like in the absence of GHGs. i.e. the atmosphere being warmer than the surface. Thus that implies a saturation point occurring when the surface temperature becomes the same apparent temperature as the atmosphere.
That provides some interesting gaps in the theory. . .that are actually recognized by Nate’s favorite proof of ever increasing CO2 being a relentless control knob of GHE but these gaps are not recognized by Nate who just assumes that one can handwave that away as his proof does verbally but no scientifically.
@ Clint R (February 6)
“Any calculation of the climate forcing is based only on beliefs.”
You failed to read the second sentence of Appell’s comment. It says, “We use satellite observations of stratospheric aerosols, trace gases and temperatures to compute the tropopause radiative flux changes relative to climatology.” Schoeberl et. al. use measurements, unlike Clint and Bill Hunter who just wave their hands.
LOL! We may read outgoing radiative flux on real time, I don’t know if we do that or not. But its of no use unless we also monitor incoming sunlight from both a solar brightness analysis and an orbit speed basis.
Since it is clear the time function of closeness to the sun varies over the decades (in sync with the movement of the other planets) the amount of sunlight actually received by earth varies.
I provided links to changes in orbit speed effects in terms of how long half orbit transits vary.
That will have an effect on how much sunlight is received by earth. Where are the calculations that tell us if this is a concern and since its a positive influence how much warming is due to it after it affects water vapor.
Links to this so-called settled science would be very help so you aren’t just hand waving.
Poor short term correlation with surface temps, which showed a rise this month.
Rise for January on surface.
https://oz4caster.wordpress.com/monthly-trends/
https://www.tandfonline.com/doi/full/10.1080/00139157.2025.2434494
Article finds recent T step-up is due to shipping aerosol reductions.
“This temperature jump was spurred by one of the periodic tropical El Nino warming events, but many Earth scientists were baffled by the magnitude of the global warming, which was twice as large as expected for the weak 2023-2024 El Nino. We find that most of the other half of the warming was caused by a restriction on aerosol emissions by ships, which was imposed in 2020 by the International Maritime Organization to combat the effect of aerosol pollutants on human health.”
Global surface temperature relative to 1880-1920 in Figure 1 is the GISS (Goddard Institute for Space Studies) analysis through October 2024.2 The 1970-2010 warming rate of 0.18 C/decade almost doubled in 2010-2023, but this higher rate is not a prediction of the future.
If the higher rate isnt a prediction of the future, then its odd how confident its presented as evidence of acceleration.
Their guessing Nate, looking for scapegoats as usual.as if those events never happened before before man took to the seas.
They had predicted acceleration a few years ago.
Hansen links the alleged post-2010 warming acceleration to a decline in planetary albedo.
Yet, albedo variations remain poorly understood. In fact, the National Snow and Ice Data Center’s second most recent analysis highlighted how the December 2024 recovery in Antarctic sea ice extent has sparked debate over whether a true regime shift occurred after August 2016, when persistently below-average extents became common.
https://nsidc.org/sea-ice-today/analyses/ringing-new-year-warm-arctic
The political and policy assertions in that publication rest on the claim of an acceleration in global warming.
“Yet, albedo variations remain poorly understood.”
Agree. This is one paper. Others may find different results.
In addition to shipping, there has been a reduction in air pollution from China, which has been suggested as a mechanism for the warming of the N. Pacific.
Red,
“the December 2024 recovery in Antarctic sea ice extent has sparked debate over whether a true regime shift occurred after August 2016, when persistently below-average extents became common.”
The year to year, month to month fluctuations in sea ice are normal. For example 2017-2019 had well below average minima. Then 2020-2021 were near normal. Then 2022-24 were well below normal again.
BTW at the moment it looks like 2025 will again have well below average minimum.
https://nsidc.org/sea-ice-today/sea-ice-tools/charctic-interactive-sea-ice-graph
If these year-to-year variations were truly normal, it’s worth asking why the CMIP6 models struggle to reproduce the magnitude of the 2023 Antarctic sea ice anomaly. As noted in recent research, this event had a return period of over 1,000 years under internal variability and was essentially unprecedented in models that align closely with observed variability.
https://agupubs.onlinelibrary.wiley.com/doi/full/10.1029/2024GL109265
Cimp 6 models apparently don’t include effects of when and where orbit speeds of earth are affected by celestial objects other than the sun.
The length and amplitude of current variations are in the same pattern as planetary alignments that only occur in concert with the patterns of planetary movement such as our ability to see all the other planets at same time at night over the past several years at a rate seldom seen.
These effects also enabled NASA the ability to slingshot Grand tours of the solar system.
They are talking about winter maximum sea ice level, nothing to do with current summer levels. It was quite a bit lower than average in 2023 and 2024.
We will see what 2025 brings. Obviously modeling Antarctic sea ice ain’t easy. Which is why it is called science.
“We will see what 2025 brings. Obviously modeling Antarctic sea ice aint easy. Which is why it is called science.”
I know. Modeling Antarctic sea ice and albedo is extraordinarily difficult, as even the CMIP6 models fail to reproduce anomalies like the 2023 winter sea ice extent.
That’s why Im perplexed as to why Hansen would not only claim a clear acceleration in global warming tied to albedo but also use that claim as a basis for political proclamations.
“Thats why Im perplexed as to why Hansen would not only claim a clear acceleration in global warming tied to albedo”
No need for perplexedness. He made a scientific argument based on data, and the physics of aerosols and clouds.
red krokodile says:
”Thats why Im perpl’exed as to why Hansen would not only claim a clear acceleration in global warming tied to albedo but also use that claim as a basis for political proclamations.”
Hansen is more activist than scientist and he isn’t shy about saying that.
I am convinced that the 2023 temperature anomaly is connected to Jupiter’s last pass through prime planetary alignment most affecting earth’s orbit speed by slowing it through the austral summer. Of course if the sun becomes brighter (it is also solar max) or closer/slower through the summer thats going to likely drive some change in albedo, even if not a change in albedo percent.
Recent press has been talking about this alignment with all 8 planets observable at night on one side of earth.
I have paused my analysis because of not actually having a calibrated access to long term or real time solar brightness records which has been known to be a necessity for over a decade when TSI constant was lowered to about 1360watts correcting older analysis due to lack of adequate calibration.
It does not require all the data analysis shown in the paper to simply guess, as several here are doing in assigning the warming to HT with no analysis at all.
https://www.drroyspencer.com/2025/02/uah-v6-1-global-temperature-update-for-january-2025-0-46-deg-c/#comment-1697908
https://www.drroyspencer.com/2025/02/uah-v6-1-global-temperature-update-for-january-2025-0-46-deg-c/#comment-1698013
??
The billions of gallons of water that Trump ordered to be released from N. California reservoir was being stored for the dry season, when it is actually needed by farmers and others.
This is the wet season!
Trump has been in office less than a month and already the satellites see a reduction in global temperatures!
(Just something for the “Trump Derangement Syndrome” kiddies.)
I’m going to need more popcorn….
And this is related to the temperatures in January how? We all know you suffer from exterme TDS, but let’s try and stay on topic.
Yet another non-sequitur from Clint, our resident specialist in that.
Oh he’s just strolling.
More learning for the TDS kiddies:
https://www.youtube.com/watch?v=pGPTBsEBJlw
Clint’s videos need a warning label:
‘Viewer discretion advised. This program contains material intended for gullible or racist audiences only’
Nate says:
“The billions of gallons of water that Trump ordered to be released from N. California reservoir was being stored for the dry season, when it is actually needed by farmers and others.”
What Nate, and Politico, CNN, and etc., does not want you to know is that the water releases Trump proposed for LA amounts to about 4% of the mean amount of water, unavailable to farmers, released annually in the fall to protect the delta smelt. Of course Newsom will make the farmers suffer instead of the smelt and would prefer LA residents also go without decent fire protection.
I will say it again….
https://breadonthewater.co.za/2024/05/12/surface-air-temperature-sat-versus-sea-surface-temperature-sst/
Henry Pool
1. ” Note that I am not blaming Spencer and Christy for giving a wrong impression. What they are doing is completely correct, if you look at it linearly. They are simply averaging and averaging of what is inherently a very unequal warming of the earth going by same UAH data… ”
Anyone interested can look at Spencer’s file containing the anomalies for 8 zones and 3 regions:
http://vortex.nsstc.uah.edu/data/msu/v6.1/tlt/uahncdc_lt_6.1.txt
and combine the info with UAH’s world anomaly and trend maps available below:
https://www.nsstc.uah.edu/climate/
Why don’t you fill the gap, by providing us each month on this blog with what you yourself miss on it?
*
” RECOMMENDATION
To avoid confusion, it would be better to rather look at reporting on the warming of the northern- and southern hemispheres separately instead of reporting on the warming of land and water separately. ”
Did you ever compare the two pairs?
https://drive.google.com/file/d/1kAirJhRCdzGrDV2YulBDq8eVQtnwWSaz/view
versus
https://drive.google.com/file/d/1PoYuPP-alL-mbraAjRW8OMQk-Lzyq1gP/view
Why, do you think, is the difference so small?
*
3. ” He determined that the water of the major European rivers that end up in the North Sea, have warmed considerably due to the water being extensively used for cooling by many factories and energy companies nestled along the way from London, Holland, France, Germany and Switzerland. ”
That’s really 100% amazing!
How the hell is it possible to focus on small, since years decreasing trickles flowing into the oceans on the one hand, and on the other hand ignore that at the same time, increasing amounts of cubic kilometers of cold water are being washed into the same oceans by the worldwide melting of icebergs, glaciers and sea ice?
*
In my native tongue we love to say:
” Au royaume des aveugles, le borgne est roi. “
Brrrrr!!!! Cold!!!!
Looks like global cooling for sure.
Chances are pretty good we will see continued cooling. The La Nina only became official with the December number. We won’t see that show up in the UAH data for a couple more months and we are likely to remain under La Nina conditions for several more months.
During this time we should also see further dissipation of the warming due to the Hunga-Tonga eruption.
We could see another 0.2 C drop in the global temperature, maybe even more. All this while the AMO remains in its warm phase. Just think what will happen when the AMO cycle eventually flips as all cycles do.
The last AMO cycle flip occurred from 1995-1997. The next flip is most likely to occur during the current Trump administration.
henry…”In my opinion, the extra global warming of earth in the last 50 years, is coming from a change in sea surface temperature (SST). SST appears to be affected by combination of factors…”
***
Under ‘other factors’, how about the facts related to the way averages are calculated the past 50 years, the way surface temperatures are fudged, and the better accuracy of the sat telemetry?
According to UAH, it has warmed about 0.5C since 1980. According to the fudged surface record, it has warmed over 1C, and some have reported a warming since 1970 of 1.5C.
The actuality is a warming of about 1C since 1850 and that can be explained as a rewarming from the Little ice Age. The rewarming should not be linear due to the large amount of ice built up over the 400+ years of the LIA. That is compounded by Earth’s orbit and axial tilt, which serves to build up ice in either hemisphere during winters.
It makes sense that warming should accelerate slightly as the ice from the LIA melts.
Geophysicist, Syun Akasofu, has estimated a rewarming from the LIA of 0.5C/century, and he seems to be right.
Lol. Geophysicist Akasofu’s and your simple maths are just a little off, eh?
The first 75 years after the LIA end in 1850 the global temperature stayed static. Since 1925, or in 1 century, the global temp has increased near to +1.4*C.
Even if you claim 175 years since the end of the LIA, the global temperature is now nearly double that of yours and Akasofu’s claims of +0.5*C per century.
Even UAH shows a +1*C rise in lower atmosphere temps in less than 50 years.
Your maths? Not even close to right.
Mr. Maytrees:
Lol is unnecessary in response to Mr. Robertson’s statement.
Nor is: Your maths? Not even close to right.
A simple refutation with support would be congruent with Mr. Robertsons statements. There is no need to show the insecurities which are bound up in the emotionalism of preening about who is right or wrong.
“A simple refutation with support would be congruent with Mr. Robertsons statements.”
You are obviously not familiar with all of Mr Robertson’s statements, or you would not take on the role of the tone police.
Actually, why are you taking on that role anyway? Didn’t you just spruik for substance while offering none?
Dr. Spencer, one of the most useful graphs I have ever seen is the comparison you made in 2018 of the satellite data of the lower troposphere temperature change versus time with those of the climate models. It showed a glaring discrepancy, bu a factor of about two. Could you guys update that graph with recent data, including the recent drop in temperature as the El Nino ended? I might wait another month or two just to repeat the point that the models are running much too hot. Thanks much
So that is why its snowing here today.
https://i.ibb.co/N2VkkpRq/ventusky-pressure-20250210t1200.jpg
https://i.ibb.co/sJgvVT41/ventusky-temperature-2m-20250210t1200.jpg
Europe
https://i.ibb.co/j9LTx3dg/ventusky-pressure-20250209t2100.jpg
La Nina
http://www.bom.gov.au/archive/oceanography/ocean_anals/IDYOC007/IDYOC007.202502.gif
Here is the picture you preferred around 2020-2022:
https://www.cpc.ncep.noaa.gov/products/CFSv2/imagesInd3/nino34Mon.gif
Do you remember?
https://i.postimg.cc/5yHYfPtN/nino34-Mon290322.gif
That was a FULL REAL La Niña!
We have a 3-month trend that suggests the atmosphere experienced a peak temperature last year, and is now cooling. The January number is a big drop, but monthly numbers have a history of making big moves that are not trends.
This would seem to support the HT volcano theory and not the ship fuel theory. The comment that most of this cooling was over the global oceans, seems to suggest is not ship fuel. ENSO forecast is for a weak La Nino.
The oceans have not cooled much outside of the ENSO regions.
https://climatereanalyzer.org/clim/sst_daily/?dm_id=world2
I think that UAH is very sensitive to convection from the tropical oceans. So it oscillates more with ENSO than the surface.
I’m not an excessive amount of deviation from the blended GHG, aerosol, TSI, and ENSO expectation. If the HT eruption is having an influence it isn’t manifesting enough in the UAH TLT values to be detectable.
Absorption of water radiation bands in the Stratosphere and above means less intense surface heating of the ocean, which has stopped Atlantic Hurricanes. It also means a less intense water cycle, with reduced precipitation and lower plant transpiration, and a generally dryer climate. Where I live stream flow has reduced to a trickle.
“Absorption of water radiation bands in the Stratosphere…”
Que?
Brrrrr!!!! Cold!!!!
Looks like global cooling for sure.
-3C here in Vancouver, Canada and forecast is for -8C soon.
binny…”The Estimated Climate Impact of the Hunga Tonga-Hunga Haapai Eruption Plume
Schoeberl & al. (2023)
https://agupubs.onlinelibrary.wiley.com/doi/full/10.1029/2023GL104634
Scaling to the observed cooling after the 1991 Pinatubo eruption, HT would cool the 2022 Southern Hemispheres average surface temperatures by less than 0.037C. ”
***
Hilarious….Binny cites a paper by uber-alarmist Dessler and his grad-student co-authors, who use computational methods and unvalidated models to guesstimate a warming of 0.03C due to Hunga Tonga injecting millions of tone of water into the stratosphere.
I am not sure that Dessler knows about gas laws or any other science. He is confident in his unvalidated climate models.
Dessler appears to agree with his alarmist brethern that CO2 at 0.04% of the atmosphere has a warming effect of 9% to 25% yet WV injected into the stratosphere, an arid place, has only a 0.03C effect.
Alarmists are hilarious as are alarmists like Binny who blindly quote them as authority figures.
A first remark before I zoom once again into Robertson’s mix of arrogance, ignorance and incompetence
You just need to look for the number of publications Dressler shared with his alleged ‘grad-student co-authors’ to understand that Robertson is ready to any lie.
No wonder from a guy who is known as a 360 degree denier of anything that doesn’t fit his megalomaniacal self-assessment.
Has anyone remarked that the comments are all gone from posts in the past?
For instance, I went back to February 2021 temp update to recall the baseline differences for each month, but though there are 1616 comments in that thread, they are wiped out.
https://www.drroyspencer.com/2021/02/uah-global-temperature-update-for-january-2021-0-12-deg-c-new-base-period/
For numerous posts I looked at there is often one spam comment. That’s it.
barry
Yes, this is known (to me) since quite a while.
Whenever you need older drroyspencer.com now lacking the comments, please think that numerous instances permanently crawl the entire Web and sore into the Web Archive.
Here is what you miss:
https://web.archive.org/web/20210302082317/https://www.drroyspencer.com/2021/02/uah-global-temperature-update-for-january-2021-0-12-deg-c-new-base-period/
Simply invoke the Web Archive and enter the link to the source you want to obtain original data from.
You probably won’t find everything back – but a lot of it, I guess :–)
Yes, I use WM regularly. Didn’t think to apply it here. I was just curious how this had happened.
These were the numbers Bellman gave when the baseline shifted forward 10 years to 1991-2020.
1 0.143
2 0.16
3 0.128
4 0.122
5 0.124
6 0.132
7 0.130
8 0.126
9 0.166
10 0.161
11 0.134
12 0.119
But as there has been a new revision (6.1) and a shift of all values due to the truncation of NOAA19 satellite data, these values won’t be the same. I’ll see about it tomorrow maybe.
barry
You hardly could see any difference in the baselines because the differences between 6.0 and 6.1 first appeared after 2020:
https://drive.google.com/file/d/1JGKYhqvumAaD71Yvb_WbEAPdzmB4v_lR/view
The 12 month baselines for 6.0 and 6.1 are therefore identical down to 3 digits atdp:
Jan 263.179 (K)
Feb 263.269
Mar 263.427
Apr 263.843
Mai 264.448
Jun 265.099
Jul 265.418
Aug 265.233
Sep 264.637
Oct 263.945
Nov 263.406
Dec 263.191
*
Incidentally, when I look at UAH LT’s grid baseline I posted above, it is always astonishing to compare Robertson’s endlessly repeated, completely stupid attacks against NOAA’s allegedly fudged data with his stubborn, uneducated fixation on NOAA’s trivial definition of anomalies – a definition definitely useless for anyone having to actually compute them!
Thanks. I guess there would be little to no difference.
I wanted to compare the 30-year monthly anomaly averages for 6.0 and 6.1, and for the two different baseline periods, but couldn’t figure out the formula to average every nth row in Excel (2007). Partly also to check whether the unflagged changes to anomalies had made much difference.
Ultimately, I wanted to check a prediction I made a while ago that that it was very unlikely an anomaly would fall underneath the old baseline after 2016. Far as I can make out we haven’t had a negative anomaly on the old baseline since 2012. But in 2013 the old value for May was within a few thousandths of a degree of zero, and in one of the unflagged changes was actually zero to three decimal places.
https://web.archive.org/web/20171007124215/https://www.nsstc.uah.edu/data/msu/v6.0/tlt/tltglhmam_6.0.txt
https://web.archive.org/web/20181123112505/https://www.nsstc.uah.edu/data/msu/v6.0/tlt/tltglhmam_6.0.txt
Not a big deal, just wondering about that prediction, and how long it had been since a negative anomaly on the old baseline.
https://i.ibb.co/r21cv5jH/number-of-days-with-a-ge.png
https://www.cpc.ncep.noaa.gov/products/stratosphere/strat-trop/gif_files/time_pres_TEMP_ANOM_ALL_EQ_2024.png
https://www.cpc.ncep.noaa.gov/products/stratosphere/strat-trop/gif_files/time_pres_TEMP_ANOM_JFM_EQ_2025.png
The man appointed to head NOAA:
“Jacobs was also cited for misconduct after the “Sharpiegate” incident, in which he and other Trump-appointed NOAA officials were found to have exerted pressure on scientists to alter the forecast for 2019’s Hurricane Dorian to align with misstatements made by President Trump, suggesting the hurricane would veer into Alabama. It did not, and the weather modeling had not indicated that it was likely to.”
The noise made about hiring the best people for the job when they tried to blame DEI on the air accident last week…
Check the credentials of some the people Trump has appointed? The new Sec Def is perhaps the least qualified person ever to hold the position. Looks like being a white male doesn’t actually guarantee you expertise, but it does get you jobs.
This guy had the audacity to jump on Trump’s bandwagon suggesting DEI hires lack competence.
It’s seriously funky. Compare Hesgeth’s credentials with Biden’s Sec Def.
Pete Hesgeth:
“After graduating from Princeton University, Hegseth began his career working as an analyst for Bear Stearns. From 2003 to 2014 and again from 2019 to 2021, he served as an infantry officer in the Army National Guard, attaining the rank of Major. He received the Bronze Star while serving in the special operations forces during a combat deployment to Iraq in 2005.[3] In 2014, he voluntarily deployed to Afghanistan to train the Afghan security forces. Following his military service, Hegseth became an active figure in conservative and Republican politics and was the executive director of Vets for Freedom and Concerned Veterans for America. From 2014 to 2025, he was a political commentator for Fox News and was a weekend co-host of Fox & Friends from 2017 to 2024.”
Lloyd Austin:
“Before retiring from the military in 2016, Austin served as the 12th commander of United States Central Command, beginning in March 2013. Prior to that he served as the 33rd vice chief of staff of the Army from January 2012 to March 2013, and as commander of United States Forces Iraq from September 2010 to December 2011. He is the first African American to hold each of these positions. After retiring from the armed services, Austin joined the boards of Raytheon Technologies, Nucor, Tenet Healthcare, and Auburn University…
He graduated from the United States Military Academy at West Point with a Bachelor of Science degree in 1975… He later earned a Master of Arts degree in counselor education from Auburn University’s College of Education in 1986, and a Master of Business Administration in business management from Webster University in 1989. He is a graduate of the Infantry Officer Basic and Advanced courses, the Army Command and General Staff College, and the Army War College.”
The Wiki entry charts his career, which is much lengthier than this overview, detailing multiple command positions, including the Pentagon and CENTCOM in Iraq.
Lloyd Austin is black.
Maybe, just maybe, you can hire someone who is not white, male or cis-gendered, and still get a quality hire.
Trump’s DEI comments in the press briefing following the crash were entirely disgusting. The more so because he had no idea whatsoever what caused the crash. Pure dog-whistling, and slighting minorities while doing it. Simply disgusting for a leader. Hesgeth’s parroting of these views is eye-popping, considering his complete underqualification for the job Trump put him in.
Not to mention Trump’s children held positions in the White House. Lara Trump became chair of the RNC last year. Her qualifications were that she worked at Fox News and released a song. No previous experience in politics.
And he talks with a serious face about meritorious employment.
*yawn*
Oh look… One of these smallbrained 101% admirators of the Trumping boy doesn’t like to see the truth, and… yawns.
Oh look … someone who thinks we have any influence on who Trump chooses for his government ,,, as is his privilege. If you don’t like his choices … run for President yourself.
Too, most of us here don’t even get to vote for USA President.
This is supposed to be a blog about climate. Yeah, I’m guilty of straying into politics too. But its ridiculous to complain here about Trump’s choices for government posts.
*yawn*
“who Trump chooses for his government … as is his privilege”
Ken, Trump doesn’t get to install whoever he likes into these positions. Are you not familiar with the mechanisms? Congress has to approve.
In this way, yes, the people have some say in how successful a president’s nomination will be, particularly if the senate majority is not the same party as the president. The senate can and has rejected the president’s top pick, though it is rare. More often nominations will be withdrawn if an unfavourable outcome is anticipated. In Trump’s last term, three of his top picks for cabinet positions withdrew went it became apparent they would not be confirmed.
It’s not a dictatorship (yet), where the pres just installs whoever they want.
Elon Musk is a different story. Neither elected nor confirmed, he has been given extraordinary power and access beyond anything a “special government employee” has ever been given, with his functions and security clearance unknown, and with no congressional oversight or audit, as his team has been described as outside the government.
As someone here remarked, it would be like a Democratic president giving George Soros the power to access classified information, restructure government departments and fire and hire at will, with no congressional oversight.
Not only am I not familiar … I also don’t give a tinker’s damn.
There is nothing I can do about the appointments even if I were a US citizen … and I am completely not interested because I’m not (at least until USA becomes the 11th Province).
I don’t care about the machinations of US politics; we in the 51st state have enough problems of our own, particularly with the current bunch of perpetual liars.
“I don’t care about the machinations of US politics”
I’m perfectly fine with you ignoring this conversation.
“Nothing I can do”
Yes there is. Call and ask your senator to grow a pair, stop being a sycophant, and not consent to loser appointments, especially the next 3.
But you wont.
Err..if your a Canadian, never-mind about your senator, just stop posting BS.
Nate and barry, you need to realize your comment-count is becoming excessive. Please control your TDS cultism.
> I dont care
As long as his beloved Christian fascism is up and running, Kennui could not care less about small details such as illegality and unconstitutionality.
Yet, Army recruiting has skyrocketed after Trump and Hegseth came into office. Young Americans know that Hegseth will be a soldiers’ Secretary of Defense. Austin wasn’t.
the services surge in enlistments began nearly a year ago as the Army overhauled much of its nearly $2 billion recruiting enterprise
https://taskandpurpose.com/news/army-recruiting-increase-trump/
I have often read posts by people asking for UAH’s reason to use anomalies rather than absolute values, and replied always in the same manner.
*
When you observe the temperatures recorded for various atmospheric layers, you compare temperatures differing by a lot:
– for LT, about 260 K;
– for LS, about 210 K.
This is then what you obtain when comparing LT and LS using absolute data:
https://drive.google.com/file/d/1HQnEudaqrspBrACM_7-xyxHM_Hp7vprK/view
And this is what you obtain when comparing anomalies (i.e.: departures from a mean with annual cycle removal) wrt the same reference period:
https://drive.google.com/file/d/1jFVD4AOyXQXIAotsDflm6ISagb5SpOtb/view
*
This is really not a matter of taste.
Doctor Spencer, is it possible to assign the zero line to a temperature in degrees Celsius, for example zero equals 14 C ?
Dr. Spencer would know the exact value, but -9C is in the ballpark.
99.9% of what Clint R posts is BS but this time exceptionally it isn’t.
Averaging UAH LT’s 12 month climatology gives 264.09 K i.e. -9.06 C.
Bindi, stop with the false accusations.
You can’t understand 99.9% of the science I present, and you can’t learn.
Grow up.
In contrast to UAH, This January was another new record in the surface data.
https://climate.copernicus.eu/surface-air-temperature-january-2025
ERA5’s data assimilation process combines observational inputs with physics-based modeling to estimate temperatures in regions with limited data coverage. The model’s nonlinear equations are highly temperature-sensitive, meaning even minor systematic errors in nearby thermometer readings will propagate and lead to cascading errors in the final estimates.
There is well-documented evidence that shows many U.S. surface temperature stations are poorly sited, which artificially suppresses measured diurnal temperature ranges.
I posted that study here a while back, but some dummkopf found it too inconvenient to handle and decided that attacking my intelligence was the way to go.
Reanalysis uses more weather variables than just surface T, thus is less sensitive to UHI effect. Roy Spencer likes this approach.
Less sensitivity does not equal no sensitivity.
UHI appears to have little impact on global temperature. Compare long-term satellite records with surface. Hardly any difference.
There is a known lag with ENSO variation, where the lower troposphere response is slower than surface. That’s one of the reasons why the UAH excursion this month is interesting.
We’ll see what RSS comes out with in a week or so.
Barry, as I tried to convey to you back in late December, relative trends can align even if both datasets contain independent errors. Anomalies improve comparability between different datasets, but this does not mean that the absolute data is free of bias.
Many assume that because climate science often focuses on anomalies, the accuracy of absolute temperature is less important.
I have already touched on how ERA5’s temperature assimilation process relies on temperature-sensitive physics, but this also applies to IPCC climate models, which depend on accurate absolute temperatures to correctly simulate radiative balance, land-atmosphere interactions, etc.
“ERA5s data assimilation process combines observational inputs with physics-based modeling to estimate temperatures in regions with limited data coverage.”
Yes, it uses weather model physics, which is tested everyday across the globe, and is highly successful at short term prediction.
It makes sense to use these to fill in missing data that needs to be self consistent with all surrounding observations.
“Anomalies improve comparability between different datasets, but this does not mean that the absolute data is free of bias.”
You mean free of error.
Of course. No measuring system is perfect. There is always error. And yet planes fly, buildings stand, and you and I can communicate over long distances.
The point is not that data is imperfect. That is a given. The issue is how well the data capture the ‘truth’, and how well we understand the degree to which it doesn’t.
Regarding UHI, it is of great significance that data that is not encumbered by it (lower troposphere O2 radiance brightness) is a close match to surface data.
Absolute values are useful for some contexts, anomalies are useful for others. Neither is intrinsically better than the other.
“Yes, it uses weather model physics, which is tested everyday across the globe, and is highly successful at short term prediction.
It makes sense to use these to fill in missing data that needs to be self consistent with all surrounding observations.”
The observations anchor the data and minimize model prediction errors. However if the weather station reading itself is compromised, then it’s not really a validation. Instead, the assimilation process just forces the model to conform to a flawed baseline.
So, it wouldn’t make sense to use these to fill in missing data.
Barry,
I agree that climate science has developed methods to derive precise measurements. But, this precision should not be conflated with accuracy, as the two serve different purposes.
UHI can still corrupt data, even when trends align with more pristine records.
A ghost town with no population growth wont experience spurious warming from active urbanization, but it’s temperatures still arent an accurate representation for the rest of the region. Streets, buildings, etc. will continue to distort the local temperatures there relative to surrounding rural areas.
The fact that planes fly, buildings stand, and we can communicate over long distances is a testament to engineering disciplines that carefully distinguish between those two concepts. These systems function reliably because they are designed with an understanding of both.
Red,
“However if the weather station reading itself is compromised, then its not really a validation. Instead, the assimilation process just forces the model to conform to a flawed baseline.
So, it wouldnt make sense to use these to fill in missing data.”
You might familiarize yourself with how reanalysis works before assuming how it works.
For example:
“Reanalysis combines all distinct weather observations available on one given day in the past. It not only factors in one single variable, like e.g. temperature, but takes into account almost all available weather observations for that specific day. Depending on the reanalysis components set, these can include a variety of variables such as wind or humidity, but also measurements of atmospheric composition, like ozone or carbon monoxide. They can also include data on ocean and land variables such as waves and soil moisture.”
https://climate.copernicus.eu/reanalysis-qas
So what you are saying is reanalysis isn’t actually a mean temperature but an apparent temperature.
From Google AI:
“”Apparent temperature” refers to how hot or cold it feels to a person based on a combination of the actual air temperature and other factors like humidity and wind speed, while “temperature” simply refers to the measured air temperature without considering these additional elements; essentially, “apparent temperature” is the “feels like” temperature, whereas “temperature” is the actual measured value. “
As always, my stalker Bill has no idea what the topic is. Posts anyway.
Nate,
Bill Hunter’s description of reanalysis as producing an ‘apparent temperature’ (in the sense of a modeled representation rather than a directly measured value) is fitting. The variables your link mentioned help reanalysis capture broader conditions well, but this does not equate to achieving the accuracy needed for reliable surface temperature estimates in areas with sparse observations.
red, the point is, which you haven’t really acknowledged, is that the lower tropospheric (satellite) data is unaffected by UHI.
Thus, when there is a very good correlation between surface and satellite data on hemispheric and particularly global scale, it strongly suggests that UHI either isn’t a significant factor at these scales, or that adjustments for that in the surface records seem to work well.
If there was something significantly off with global surface measurements, why on Earth do they show such excellent correlation with global satellite temperature, not only in trend, but also in the sign of each annual change?
Thermometers capture air temps at about 2 metres altitude. Satellites capture radiance brightness of O2 through the depth of the atmosphere, centred on 3km altitude. The difference in the metric strengthens the corroboration in terms of global and hemispheric temperature. Also well corroborated is the difference in trends between ocean and land temps.
All data has error. But when several groups working with two completely different metrics and different methods corroborate each other, that strongly suggests that the results are good despite the error.
“‘apparent temperature (in the sense of a modeled representation rather than a directly measured value) is fitting. the sense of a modeled representation rather than a directly measured value) is fitting.”
Not at all the sense of meant by Bill to mislead people, which was the ‘feels like’ temperature that humans feel.
Whereas the reanalysis attempts to find actual temperatures, even in places not measured.
Look Roy Spencer is a meteorologist and skeptic, and likes the reanalysis approach.
Because it uses known physics of the atmosphere to constrain temperatures that are missing, as opposed to just simple averaging.
Barry, I did address this with my ghost town analogy. A ghost town’s surface temperature time series will align well with its assigned grid cell in the lower troposphere measured by UAH, precisely because there’s no spurious warming from active urbanization.
That doesn’t mean it provides an accurate representation for nearby rural areas.
You are too focused on relative trends. Relative trends and anomalies cannot, by themselves, provide the accuracy needed for physics-based modeling. These processes depend on accurate absolute temperature data as well.
Nate, small errors can exist while reanalysis provides a modeled representation of broader conditions.
As for Roy Spencer, it is odd of you to suggest he is incompetent. Recognizing the strengths of reanalysis doesnt require pretending it’s flawless.
“odd of you to suggest he is incompetent.”
Don’t be silly. I was saying he understands meteorology way better than you or me.
Nate as usual is full of it and assumes without any evidence I have something against reanalysis. And worse via a knee jerk reaction he immediately assumed I was trying to mislead people.
Fact is almost 50 years ago I became aware that there was more than temperature involved in surviving comfortably in an uninsulated cabin in the northwest by analyzing temperature and other things. But that is only one of many reuses for reanalysis. Google AI though notes only the most popular notion of reanalysis.
I agree that reanalysis can be a superior mode of analyzing temperature data. But one needs to be smart about what it can do and can’t do. For example it can’t fix errors in measurement or poor sampling of temperature data (e.g. UHI). To claim that one must first recognize the error and second explain how it was corrected.
Its like the interest in effects of changes in orbital speed caused by other planets, if you don’t look you won’t find, nor can you claim you fixed or improved it via reanalysis.
But Nate apparently doesn’t understand its strengths and limitations and tries to offer it as a superior product for all purposes.
barry says:
”If there was something significantly off with global surface measurements, why on Earth do they show such excellent correlation with global satellite temperature, not only in trend, but also in the sign of each annual change?”
Natural climate change is occurring. Not only do you have global climate temperature variation occurring over climate length trends they are occurring at less than climate length trends. We also understand that these weather variations can favor say El Nino or La Nina over the other and that they have feedbacks that can accumulate in accordance with Milankovic theories.
This board has mulled the recent rapid warming out of time with El Nino and La Nina and its extended stay at a warm peak. I believe thats in sync with the unusual alignment of the planets that has been occurring and increasing becoming aligned over most of the last 44 years. . .an event that has an orbital periodicity of about 175 years.
If this is true we should know so within the next few decades. Or OTOH our scientific funding cabal could surprise us and actually build a computer model over a few years and establish that sooner. Who knows maybe somebody actually has a copies of Milankovic’s original works that hasn’t disappeared yet and it could be made available again to the public.
“So what you are saying is reanalysis isnt actually a mean temperature but an apparent temperature.
From Google AI:
Apparent temperature refers to how hot or cold it feels to a person based on a combination of the actual air temperature and other factors like humidity and wind”
Yes, Bill you falsely tried to suggest the T as determined from Reanalysis has something to do with ‘feels like’ temperature, which it has nothing to do with.
Now you know.
red,
“Barry, I did address this with my ghost town analogy. A ghost towns surface temperature time series will align well with its assigned grid cell in the lower troposphere measured by UAH, precisely because theres no spurious warming from active urbanization.”
Clearly towns with no UHI will have no UHI signal aloft. But this doesn’t address the point that UHI don’t show up in the LT record.
Roy Spencer: “…the only truly global temperature measurements, unaffected by artifacts such as urban heat island effects, are for the bulk atmosphere from Earth-orbiting satellites…”
Spencer has been working on UHI with land surface records and with surface records obtained by satellite (eg, Landsat). He does not use the MSU bulk atmosphere records at all, because they do not capture UHI.
It because the LT record is “unaffected by artifacts such as urban heat island effects,” that the excellent correlation with global, or land or sea surface or hemispheric records provides a good source of corroboration that the surface records are fairly robust.
Nate says:
”Yes, Bill you falsely tried to suggest the T as determined from Reanalysis has something to do with feels like temperature, which it has nothing to do with.
Now you know.”
You still have it wrong Nate. Apparent temperature is primarily ”feels like” temperature as most people don’t make your error.
An apparent temperature is a reanalysis. Its one of many reanalyses.
Reanalysis is not done to correct a temperature it is to adapt it to something else including a ”feels like”.
In the case of ecmwf reanalysis is done to create a 3D climate, not to correct a temperature monitoring system. Its results will be different due to the reanalysis and it has many uses like climate modeling of the atmosphere. But when you claim its better than the instruments that record the temperature you have completely lost touch with the purpose of a reanalysis.
When you start combining datasets you also introduce their errors, but the biggest error is to conclude they corrected the errors.
You screw up in the same way with with the consensus warming expected from CO2 which is nothing more than combining multiple models and finding a mean.
One or none of the models might be right, one better than all others and also no doubt when you have enough of them better than the mean of the whole bunch too.
“A ghost town with no population growth wont experience spurious warming from active urbanization, but it’s temperatures still arent an accurate representation for the rest of the region. Streets, buildings, etc. will continue to distort the local temperatures there relative to surrounding rural areas.”
In the same way dark coloured natural rock will be a few degrees warmer than a nearby shady glen? How about the temperature at the surface of a broad river compared to stony ground half a kilometre away?
Highly localised temps within the same region – even within the same square kilometre – can be very different depending on terrain. There can even be areas that are generally warmer than ghost towns, both at day and night.
But when we anomalise the data we remove the differences in order to determine change over time. Thus, a ghost town with no growing UHI is perfectly fine for this analysis. A thermometer at 1 km altitude is going to have a very different absolute temperature to the thermometer at the base of that mountain, but when we anomalise the data for each to a common reference, the absolute differences no longer interfere with our time series analysis.
Increasing UHI does affect the analysis. Temperature records try to account for this. Comparison with lower tropospheric temperatures indicate that UHI is either not a significant factor in very large sample sizes (global/regional), or is being adequately addressed.
This is harder to determine for regional analyses, owing to the greater variability in the data.
“Reanalysis is not done to correct a temperature it is to adapt it to something else including a ‘feels like'”
Totally false. You have no idea what you are talking about.
Read about and quote from the source given above that explains how reanalysis actually is done, rather than telling us your feelings about what you think it is doing.
Lacking quotes, we can safely ignore your opinions.
Barry,
“It because the LT record is unaffected by artifacts such as urban heat island effects, that the excellent correlation with global, or land or sea surface or hemispheric records provides a good source of corroboration that the surface records are fairly robust.”
This is not true. The fact that an inaccurate temperature time series can correlate with an accurate one keeps being overlooked by you. Correlation alone does not validate the robustness of surface data. To refresh your memory:
https://wattsupwiththat.com/2016/04/19/systematic-error-in-climate-measurements-the-surface-air-temperature-record/
“Before inclusion in a global average, temperature series from individual meteorological stations are subjected to statistical tests for data quality. [13] Air temperatures are known to show correlation R = 0.5 over distances of about 1200 km. [14, 15] The first quality control test for any given station record includes a statistical check for correlation with temperature series among near-by stations. Figure 6 shows that the RM Young error-contaminated temperature series will pass this most basic quality control test. Further, the erroneous RM Young record will pass every single statistical test used for the quality control of meteorological station temperature records worldwide. [16, 17]”
To scientists, both surface temperature data and satellite data are complementary tools for understanding climate as a whole. Surface temperature records provide insights into near-surface phenomena, while satellite data reveals bulk atmospheric changes. Treating them as mere cross-checks oversimplifies their value and undervalues their individual contributions.
Barry,
“But when we anomalise the data we remove the differences in order to determine change over time. Thus, a ghost town with no growing UHI is perfectly fine for this analysis. A thermometer at 1 km altitude is going to have a very different absolute temperature to the thermometer at the base of that mountain, but when we anomalise the data for each to a common reference, the absolute differences no longer interfere with our time series analysis.”
Except absolute differences are not an interference because they provide valuable insights into the spatial variability of a region.
Temperature records from the base of a mountain and higher altitudes help understand how conditions change with elevation. If there are glaciers at those higher elevations, knowing the absolute temperatures would be important for regional modeling. This data helps predict the future trajectory of glacier melt and its cascading impacts on the surrounding environment and the regional climate itself.
A ghost town, on the other hand, represents a very small percentage of land and functions as its own microclimate.
“Temperature records from the base of a mountain and higher altitudes help understand how conditions change with elevation. If there are glaciers at those higher elevations, knowing the absolute temperatures would be important for regional modeling. This data helps predict the future trajectory of glacier melt and its cascading impacts on the surrounding environment and the regional climate itself.”
Sure, absolute temps and anomalies are used for different purposes, and they can even be used for the same purpose while examining different metrics of the same problem.
I asked below what your interest in absolute temperatures are, on a board where the main topic is climate change, so perhaps I have something of an answer here?
I had imagined we were talking about the fidelity of the temperature records in terms of climate change, as that is the background topic here. And for that purpose anomalies solve many problems that absolute temperatures do not, and are more malleable to homogenisation and correction.
red, is part of the impetus behind your discussion to get ‘warmists’ to understand there is value in absolute temperatures? Because you don’t need to convince me.
“I asked below what your interest in absolute temperatures are, on a board where the main topic is climate change, so perhaps I have something of an answer here?”
Absolute temperature is important for ERA’s data assimilation process to produce physically meaningful estimates of temperature in data-sparse regions. Even small errors in absolute temperature will amplify and propagate through nonlinear equations, leading to erroneous estimates.
ERA5 is one of the world’s leading global temperature datasets. It was developed by the ECMWF, an institution regarded as one of the most prestigious in climate science.
Replied in the thread below.
https://www.drroyspencer.com/2025/02/uah-v6-1-global-temperature-update-for-january-2025-0-46-deg-c/#comment-1698351
Nate says:
”Reanalysis is not done to correct a temperature it is to adapt it to something else including a ‘feels like’ ”
Totally false. You have no idea what you are talking about.
Read about and quote from the source given above that explains how reanalysis actually is done, rather than telling us your feelings about what you think it is doing.
Lacking quotes, we can safely ignore your opinions.rs and also no doubt when you have enough of them better than the mean of the whole bunch too.
———————————-
LMAO! You haven’t even read the source you quote above!
You have provided zero evidence that a reanalysis is not done to correct a temperature record and your own source explains it done for another reason, namely to feed a computer weather model
”Reanalysis is a scientific method which aims to estimate weather conditions for each and every day over the past few decades as accurately as possible. It is based on a multitude of existing past weather observations from all around the globe and in different points in time, integrated into a current weather computer model. This type of reanalysis is called atmospheric reanalysis. There are also other types of reanalyses, such as ocean reanalyses and atmospheric composition reanalyses”
You look at the output, ignore the facts, and decide what you think it does. The only reason it has a different temperature output is because it has different inputs. Inputs that bring along additional error that may or may not partly offset each other. ECMWF reanalysis does a relatively good job for input to their weather models but its frequently wrong like all forecasts are.
So you now have a quote that proves you didn’t even read what you claimed to read before making up stuff about what its purpose is. You are some piece of work.
And still nothing quoted agreeing with your ‘feels like’ statement.
Then you go off in multiple different directions.
This is your MO.
I will not follow.
” There is well-documented evidence that shows many U.S. surface temperature stations are poorly sited, which artificially suppresses measured diurnal temperature ranges. ”
Show us this again!
Hopefully you are able to show something more consistent than the ‘results’ published in 2011 by surface stations.org, claiming that of all USHCN stations, only 71 would be ‘well sited’.
Here is the list of these 71, published in 2012 by NOAA (which I luckily downloaded, the original link is lost):
https://drive.google.com/file/d/1ipzDRdJppZDM6ii4qj9h1AKFrC3t0h94/view
And here is the comparison of these 71 ‘well sited’ USHCN stations with 329 GHCN daily stations, respectively located in the same 1 degree grid cell as the 71:
https://drive.google.com/file/d/14OiHmTn0DjbJF_s7cEZXicQd6-oAiCqe/view
*
As the arrogant anything-all-time-better-knowing krokodile very certainly knows
– the GHCN daily station set (over 20,000 in the US) contains stations with arbitrary location with no respect to ‘UHI’ considerations;
– GHCN daily data is ‘raw raw’, 0% adjusted;
– a comparison of daily (Tmin+Tmax)/2 to the 24h average computed out of USCRN hourly data coming from all 137 stations shows no relevant difference between the two:
https://drive.google.com/file/d/1k8oNXAY0hFrkcRo7x5eEVTEWBGsAK-CX/view
nor can it be seen in the same comparison based on the hourly data of the German ‘DWD’ stations:
https://drive.google.com/file/d/171KaOg775MFB0jHqcN7PtySU-IXP3fwa/view
*
Show us YOUR results, krokodile – aka Ho~g~le, aren’t you?
For Figure 1:
You are making the same mistake Fall et al. (2011) specifically warned about. If you had read the paper, you would know that while mean temperature trends across sites may be similar, the Tmin and Tmax trends show opposite-signed biases due to poor sitting.
As for your Figure 2, your y-axis spans a range from +25 C to -5C. That is so broad that it masks the very differences were discussing.
No, he’s not making that error because he’s not commenting on that. All he is saying is that the median and the diurnal min/max average are virtually identical.
And yes, Fall et al confirmed the official US temperature records (NOAA etc) for average US temps (min/max average method). The max/min bias was already known about, and this research contributed to the field.
They buried the corroboration of average temps at the bottom of the study, but that was understandable, given who was writing it.
Anthony Watts learned something valuable – time of observation bias is a necessary correction to make to avoid spurious results. 4 years prior to that paper he co-authored, he was casting very negative aspersions on this adjustment.
“No, hes not making that error because hes not commenting on that. All he is saying is that the median and the diurnal min/max average are virtually identical.”
He’s not? Lets revisit what he actually said:
“Show us this again!
Hopefully you are able to show something more consistent than the results published in 2011 by surface stations.org, claiming that of all USHCN stations, only 71 would be well sited.”
This clearly relates to the surfacestations.org analysis. His comparison between the median and the diurnal min/max average is irrelevant here because it was based on USCRN data, which avoids the siting issues documented in the 2011 study. The two datasets are not comparable in this context.
Moreover, his apparent discovery that the median and the diurnal min/max average are similar is trivial. When there are only two values (tmax and tmin), the median is effectively the average.
“They buried the corroboration of average temps at the bottom of the study, but that was understandable, given who was writing it.”
The corroboration of average temperature trends was not “buried”; it was simply not the focus of the study. The main finding was that poorly sited stations produced opposite signal biases in Tmax and Tmin. The best-sited stations showed no century-scale trend in DTR.
On the contrary, Menne et al. overlooked this significant finding. How could they have missed this key point? A lack of DTR has implications for the physical accuracy of climate models.
“Moreover, his apparent discovery that the median and the diurnal min/max average are similar is trivial. When there are only two values (tmax and tmin), the median is effectively the average.”
This is wrong. Scratch this.
Bindidon didn’t address diurnal range change, he only used averages.
“On the contrary, Menne et al. overlooked this significant finding.”
No, this contribution to the field was not overlooked.
Reassessing changes in diurnal temperature range: A new data set and characterization of data biases
“Field-based studies and statistical analyses have consistently concluded that the CRS to MMTS transition led to a positive bias in Tn and a negative bias in Tx, artificially reducing DTR in the raw data [Fall et al., 2011; Williams et al., 2012c, and references therein].”
https://agupubs.onlinelibrary.wiley.com/doi/full/10.1002/2015JD024583
Menne is a coauthor. Fall et al is cited twice in that paper, such as the above.
The corroboration with mean temps was buried in the paper. And no wonder, Anthony Watts, coauthor, had been impugning the mean US temp records for years, saying they ran too hot, made wild adjustments, etc. So it was quite something for those who like me had been visiting his site since it started to discover this result. I remember how the long conversation went. I also remember Mosher and John V in the bowels of climateaudit doing some preliminary analysis with the surfacestations best-sited stations as they came in. Mosher went on to work with BEST.
surfacestations.org and the resulting paper Fall et al contributed to understanding of biases in the US temp record. I congratulated Anthony on surfacestations in the late 2000s. It was a worthy, grassroots effort.
At the same time, he authorises a lot of rubbish posted at his website.
I was referring to Menne et al. (2010), which concluded that there is no evidence of an inflated trend in mean temperature. But thanks for sharing your link.
Now, the study you referenced relies on adjustments. Adjustments only align monthly anomaly time series with data from neighboring stations deemed “reliable,” without addressing the errors embedded in the raw data itself. If these adjustments truly resolved systematic errors, they would also correct the absolute temperature records (but they don’t). The authors explicitly claim that systematic errors are being corrected based on differences in trend distributions between adjusted and raw data (Figure 6), but this assumption is flawed.
Systematic errors are not strictly breakpoints in a time series that can be resolved through statistical homogenization. Such errors can only be accurately identified and corrected through field calibration tests using multiple thermometers under controlled conditions.
Do you recall the study I shared back in late December?
“I was referring to Menne et al. (2010)”
Then you should know exactly why they “missed this key point.” Fall et al (2011) hadn’t been published.
I don’t recall the study you shared back in December.
Fall et al find the same trends for average temperatures between their 80 well-sited stations (CR1&2) and the full USHCNv2 network.
From 2005 USCHN full network pairs very closely with the ‘pristine’ subset of USCRN, referenced in Fall et al.
What you are proposing for verification would require significant funding. How many weather stations would be sufficient? Probably half the USHCN network. A researcher looking for a grant would have to demonstrate that the current verification methods are so inadequate as to require the extra spending. I think the case against it is too strong.
“From 2005 USCHN full network pairs very closely with the pristine subset of USCRN, referenced in Fall et al.”
If relative trends were all that mattered, you could simply normalize all data to a common reference, and there would be no need for rigorous attention to absolute temperature data. However, the developers of the USCRN intentionally prioritized installing high quality instruments and implementing standardized data collection to ensure both accurate absolute temperatures and reliable long term records.
In contrast, USHCN data is limited to relative analysis because its adjusted dataset relies entirely on statistical homogenization.
That’s right, most weather stations were not planned with long term climate monitoring in mind.
“If relative trends were all that mattered, you could simply normalize all data to a common reference”
Could? That is ongoing for decades.
“and there would be no need for rigorous attention to absolute temperature data.”
On this board relative trends are the main interest. The general topic is climate change. No problem if you bring other interests, but it would be good if you could illuminate them so we don’t talk at cross purposes.
I’m familiar, but not very conversant with, ERA5.
If I investigate your comments that “small errors in absolute temperature will amplify and propagate through nonlinear equations, leading to erroneous estimates,” by searching ERA papers, what will I learn?
For example, will I learn that this is a serious issue, or that the propagation of errors is minimised by the processing, or that this has not been considered at all by the researchers?
You will discover that, during the assimilation process, the assumed error distributions for the surface temperature parameter, derived from a thermometer affected by a non-constant systematic error, are smaller than the actual magnitude of the error.
https://confluence.ecmwf.int/display/CKB/ERA5%3A+uncertainty+estimation
The reference clearly states that systematic model errors and systematic observation errors are neglected:
“The EDA takes into account mostly random uncertainties in the observations, sea surface temperature (SST) and the physical parametrizations of the model. In principle, as long as these uncertainties are properly described and there are no additional sources of uncertainty, then the EDA will properly describe the reanalysis uncertainties. However, systematic model errors are not taken into account by the EDA and”
I see that EDA mostly assesses for random error, and not systematic error.
Are you implying that systematic error is not considered atll, just because the EDA uncertainty tool doesn’t quantify it?
That would seem to be the case.
As absolute temperature observations are fed into the model every 12 hours (or 24 for when there is only daily data), and the model tailors the previous 12 hours to meet the new observations over and over again, how can an error in an absolute temperature propagate if the model is ‘trained’ every 12 hours by real observations? The model window is only 12 hours. And errors are also constrained by the suite of other observations that feed the model,every 12 to 24 hours.
Maybe it is not a coincidence that ERA5 temperature time series is a close match with the surface and satellite series? If errors propagated, wouldn’t we see significantly different results from the other temperature time series?
Am I going to find out that systematic error IS, in fact something that the ERA team have considered and worked to resolve?
Because your last post suggests that it is completely overlooked.
“As absolute temperature observations are fed into the model every 12 hours (or 24 for when there is only daily data), and the model tailors the previous 12 hours to meet the new observations over and over again, how can an error in an absolute temperature propagate if the model is trained every 12 hours by real observations? The model window is only 12 hours. And errors are also constrained by the suite of other observations that feed the model,every 12 to 24 hours.”
The real observation is also the systematic error that all ensemble members in the spread are anchored onto. The model does not “know” that the anchor is corrupted.
For example, if a thermometer incorrectly reads 23.4C instead of the physically correct 21C for a daytime maxima, the model uses 23.4C as input alongside its physics to estimate values for nearby data-sparse regions. Even though the assimilation window is only 12 hours, the systematic error persists because it remains in the input and influences the models dynamics.
“Maybe it is not a coincidence that ERA5 temperature time series is a close match with the surface and satellite series? If errors propagated, wouldnt we see significantly different results from the other temperature time series?”
No. Reanalysis output and the input data will correlate when normalized to a common reference because both are responding to the same regional variability. So the final global temperature anomaly should correlate significantly among all datasets because the SEM in each dataset will be very small after averaging together regional anomalies.
“Am I going to find out that systematic error IS, in fact something that the ERA team have considered and worked to resolve?”
This would be very challenging to resolve. To get an accurate estimate for a data sparse region would require assigning the correct error distribution to each of the members in the ensemble. A systematic error influenced by environmental factors would have a varying magnitude, necessitating detailed and precise metadata for accurate modeling.
“The real observation is also the systematic error that all ensemble members in the spread are anchored onto. The model does not “know” that the anchor is corrupted.
For example, if a thermometer incorrectly reads 23.4C instead of the physically correct 21C for a daytime maxima, the model uses 23.4C as input alongside its physics to estimate values for nearby data-sparse regions.”
I read that if the temperature reading is at odds with the other surrounding values in the ensemble – that is, the other members of the ensemble contraindicate the value of an individual member – the model assigns less weight to the temperature. ERA5 is good at picking up random errors in this way, particularly when the field is obs data rich. Thus, the temperature reading could down-weighted if it is at odds with the estimation provided by the short-term (eg, 12-hour) forecast. The outputted temperature is then adjusted to the background estimate of the model.
However, not all errors will be detected by the weather model, and can pull the 12-hour (or 3-hour) forecast off the mark.
“Even though the assimilation window is only 12 hours, the systematic error persists because it remains in the input and influences the models dynamics.”
This would persist only for the model features that are not constrained by observations. These are outputs for which there are no or very little data, such as evapotranspiration and latent and sensible heat fluxes.
As far as I’ve read, the output variables that have no observational inputs are not used to constrain observations. While they are part of the dynamic physics of the atmospheric model, they are not fed back into the next forecast window. So some outputs with a persistent error (within the 12-hour window) have consistent jumps at each window boundary.
That’s not to imply that persistent model error does not exist – it is discussed in the literature, and I see that it is given significant attention by the researchers involved with ERA5 – but I’m not sure that absolute temperature errors propagate beyond the 12-hour window. A systematic temperature bias from a weather station, however, could contribute to a persistent error in the output when paired with systematic bias in the weather model. At least as far as I’ve read.
I found a slide show from one of the chief ERA5 people that simplifies what I think is your contention about model bias.
https://events.ecmwf.int/event/376/contributions/4294/attachments/2463/4262/Weak_Constraint.pdf
Here is a 2020 article on systematic model bias and attempts to correct for it.
https://www.ecmwf.int/en/newsletter/163/meteorology/improving-handling-model-bias-data-assimilation
This is a list of variables which mentions how they are handled in the model.
https://cds.climate.copernicus.eu/datasets/reanalysis-era5-single-levels?tab=overview
And a research paper describing ERA5.
https://rmets.onlinelibrary.wiley.com/doi/10.1002/qj.3803
I asked: “Am I going to find out that systematic error IS, in fact something that the ERA team have considered and worked to resolve?”
You replied: “This would be very challenging to resolve….”
Which sidestepped the question.
Can we agree that systematic model error and propagating error is something the researchers are very much aware of and have developed methods to address? If so, then the next step would be to assess the quality of those efforts.
I read back to get the context for this discussion. Nate’s post that the surface temperature for January 2025 was different to UAH was based on the ERA5 output.
So just to clarify the issue, you are saying that ERA5 is prone to propagating errors for monthly global temperature output due to systematic model bias (perhaps coupled with bias in global monthly temperature).
Is that correct?
Just checked – GISS and NOAA have updated and now show global data for January 2025. Both have the highest January anomaly on record. Had.CRUt, JMA and RSS are not yet updated.
Satellite data tends to lag surface WRT ENSO events, so possibly we are seeing some lag here? RSS will be interesting to see.
Down-weighting, error persistence in unconstrained outputs, and similar processes all relate to later stages in the process after the ensembles have already been created. By that point, systematic error is already baked into all ensemble members because they all start from the same observational baseline (e.g., 23.4C). This baseline is the foundation for everything that follows, so these cannot undo the systematic bias introduced at the start.
“Can we agree that systematic model error and propagating error is something the researchers are very much aware of and have developed methods to address? If so, then the next step would be to assess the quality of those efforts.”
I agree, alongside your references, that ERA5 researchers have made efforts to address systematic model bias. But the systematic observational biases introduced at the ensemble generation are a different challenge.
“So just to clarify the issue, you are saying that ERA5 is prone to propagating errors for monthly global temperature output due to systematic model bias (perhaps coupled with bias in global monthly temperature).
Is that correct?”
Yes.
I’d like to revise my answer to your question:
No, model bias is not the primary reason for error propagation. But, if there is a systematic error baked into the system early through biased observational data, this error will amplify existing model biases.
“Down-weighting, error persistence in unconstrained outputs, and similar processes all relate to later stages in the process after the ensembles have already been created.”
I don’t think that’s correct. You can tell me where I go wrong.
The assimilation process (4D-Var) tries to balance a suite observations with the prior weather model forecast (12 hour windows). The process can reject biased data a priori or during the run, where it can be down-weighted via the VarQC (Variational Quality Control) component. Multiple runs of the weather model are run and the assimilations are analysed with varying initialised states based partly on each iteration’s outcome. There is also a randomised component in the initial states for each run based on the range of error estimated by EDA (Ensemble Data Assimilation).
This is all within the assimilation process, and each ensemble member can produce differently down-weighted variables. EDA estimates the error and feeds back information to the assimilation process for the next run.
I think you may be referring to the component of EDA that estimates the uncertainty/s of the ensemble as an outputted range for users.
To be clearer, the down-weighting occurs in each iteration of the ensemble creation, not post ensemble creation. Observations that are way outside the background state indicated by the suite of observations can be rejected altogether, but if they could possibly be within the range, but seem to be suspect, then they are down-weighted by VarQC, which operates within the 4D-Var assimilation process, for each iteration of the ensemble members. This down-weighting does not occur after the ensembles have been generated.
“I’d like to revise my answer to your question:
No, model bias is not the primary reason for error propagation. But, if there is a systematic error baked into the system early through biased observational data, this error will amplify existing model biases.”
I think that is possible. I said as much in the 8th para here.
But would this apply to monthly global temperature to a degree that would account for the departure from UAH LT for January?
I think probably not. Persistent biases discussed in the literature are usually regional and localised, or are about atmospheric processes. As far is I’ve read on this – and it is admittedly quite limited – large-scale land coverage estimates (ie, global) tends to be quite robust for the surface from 1979 onwards. The near surface component is, of course, well constrained by observational data. If errors actually propagated, we would see a noticeable departure in ERA5 near-surface temperatures. Anomalisation would do nothing to hide it.
I plan to read this next:
“Low frequency variability and trends in surface air temperature and humidity from ERA5 and other datasets’
https://www.ecmwf.int/en/elibrary/81213-low-frequency-variability-and-trends-surface-air-temperature-and-humidity-era5
19MB download on that page.
One of the primary conclusions of the referenced study below is that measurement errors among independent thermometers in the same spatial domain are highly correlated due to shared environmental influences.
https://journals.ametsoc.org/view/journals/atot/25/11/2008jtecha1046_1.xml
When thermometers in the same area experience similar biases, they can falsely validate each others measurements. This clustering effect creates an illusion of reliability, which will mislead quality control mechanisms like VarQC. As you noted, VarQC interprets this consistency as accuracy and retains the biased data instead of flagging or down-weighting it.
If the O-B departures between the model forecast and these biased observations are small, the system assigns high weights to the observations. This reinforces the models background state and embeds the bias into subsequent assimilation cycles.
I think you are confusing station-pairing for the near-surface temperature data sets with the VarCQ operation.
VarCQ doesn’t compare nearby stations. It looks for values that seem to be offset to what is expected in the background state determined by the suite of observations. If each of the temperature observations seems to high or low for the background state it will down-weight.
I agree a consistent bias spread over a common area could embed in the background state, if the bias is small and doesn’t trigger VarQC. But other routines in the processing, like VarBC, also act to reduce bias by comparing specific anchors with near-surface temperature measurements, such as radiosondes and skin surface temperature.
To wind this into the original point, the ERA5 departure for January 2025 is likely not much affected by this kind of bias, as the bias has to trend to impact monthly comparisons. The reanalysis process constantly pulls the forecast back to observations.
Tp remind, the surface data sets also comport with ERA5’s January departure. JMA has updated, and like GISS and NOAA, their January value is the warmest January on record, as well as being an uptick from December.
It is not uncommon for satellite monthly departures to be different in sign from surface datasets. (As opposed to annual departures, which are much more consonant)
RSS have not yet released the January value, nor has Had.CRUt.
“But other routines in the processing, like VarBC, also act to reduce bias by comparing specific anchors with near-surface temperature measurements, such as radiosondes and skin surface temperature.”
Table 2 from Hersbach et al. 2020 says that, in addition to satellite radiances, VarBC is used for bias correction in ozone data and ground-based radar-gauge composites within the ERA5 system. Satellite radiances, ozone data, and ground-based radar-gauge composites are all indirect observations, unlike air surface temperature. There is no explicit mention of the application of VarBC to 2-meter temperature observations.
Furthermore, that wouldn’t even solve the problem. The O-B departure in VarBC would be the biased observation subtracted from the background state forecast and not the physically true air temperature. The system does not know the true value, so it cannot correct toward it – only towards what it believes to be correct.
Reading further into it it seems you’re right that varBC doesn’t directly compare near-surface data to anchors, but it does provide test for bias in other (satellite-retrieved) components that make up the background state, all of which pulls on the near-surface temp values. I was wrong to say this was a bias correction that directly tied into near-surface temp measurements.
Let’s review what we’ve learned.
While the EDA process does not correct for systematic bias, it is not the only bias correction module in ERA5.
Weak constraint 4D-Var superseded 4D-Var, which had originally assumed no systematic model bias. Weak constraint 4D-Var allows for systematic bias correction.
VarQC tests for data bias pre-assimilation, adjusts based on the output of each of the 10 runs per window, but does not monitor systematic bias.
VarBC checks for systematic bias, but only on satellite-retrieved components.
Are these sufficient to prevent systematic bias? And to the point, if there is systematic bias, does it show up in every component? From what I’ve read the answer on that is “no,” because the reanalysis is a good fit with observations for many parameters, but not with others.
IOW, I don’t think a systematic bias in one component automates overall bias for every component in the output.
To the original contention, is systematic bias in EAR5 so significant that it could mitigate the validity of the general result that near-surface temperatures increased from December to January while UAH LT decreased from December, and is it thus unreasonable to conclude that the near-surface January global temperature was ranked warmest January in the record when it wasn’t the case for UAH LT?
I don’t know.
I also don’t see a discrepancy here, as the LT doesn’t always follow GST month by month, and this is particularly evident with the timing of the response to ENSO events, when LT lags by a few months. The consistency of this result suggests that opposite signed monthly departures don’t necessarily indicate a problem with either measuring system. I can only repeat that ERA5 is not so susceptible to propagating errors that it’s output is significantly different from most observations. Whatever systematic bias is happening, it doesn’t seem to be pulling ERA5 way off line on a global or hemispheric scale, with or without anomalising.
RSS and HadCRUt still haven’t published January. That leaves 3 different GST datasets aligning with ERA5 so far.
“And to the point, if there is systematic bias, does it show up in every component? From what Ive read the answer on that is no, because the reanalysis is a good fit with observations for many parameters, but not with others.
IOW, I dont think a systematic bias in one component automates overall bias for every component in the output.”
No one knows how much systematic error in near-surface temperature affects the rest of the reanalysis – to determine that, we would need to quantify the magnitude of the error.
Even if other parameters (humidity, precipitation, etc.) are perfectly accurate, the final state of the reanalysis will still be distorted because all parameters are physically interconnected. Near surface temperature, humidity, and precipitation are not independent components. They work together to form a cohesive representation of atmospheric conditions.
“Whatever systematic bias is happening, it doesnt seem to be pulling ERA5 way off line on a global or hemispheric scale, with or without anomalising.”
But as has been conveyed to you repeatedly, data corrupted by systematic error can behave just like good data.
Also, what do you mean by ‘with or without anomalising’? All global or hemispheric temperature estimates are presented as globally or hemispherically averaged anomalies.
‘But as has been conveyed to you repeatedly, data corrupted by systematic error can behave just like good data.”
You’ve said this but not explained why.
Even if it is so, how does that give significance to your dismissal of ERA5 regarding the January anomaly?
“Also, what do you mean by ‘with or without anomalising’? ”
I thought you had been saying the anomalisation reduces the differences between raw, absolute temp data and the reanalsysis.
red: Adjustments only align monthly anomaly time series with data from neighboring stations deemed ‘reliable,’ without addressing the errors embedded in the raw data itself. If these adjustments truly resolved systematic errors, they would also correct the absolute temperature records (but they don’t)….
barry: Maybe it is not a coincidence that ERA5 temperature time series is a close match with the surface and satellite series? If errors propagated, wouldnt we see significantly different results from the other temperature time series?
red: No. Reanalysis output and the input data will correlate when normalized to a common reference because both are responding to the same regional variability. So the final global temperature anomaly should correlate significantly among all datasets because the SEM in each dataset will be very small after averaging together regional anomalies.
Seemed to me you’ve been saying that anomalisation reduces error that propagates in the ‘absolute’ temps. I’m not sure how this could be so for global temperature. Anomalies are only a difference from a baseline. The difference between one anomaly and the next is the same difference between the absolute values.
I’m not exactly sure what you are saying here.
Reading back over the conversation and summarising,
You have presented a compelling theoretical basis to have concerns that there could propagating errors in ERA5’s model that would make January’s monthly temperature data suspect. The strength of your argument lies in your grasp of ERA5’s corrective processes and error management.
I’ve boned up on ERA5 and discovered myself that there are indeed processes designed to address systematic bias, and pointed out that the errors don’t seem to propagate in the output, particularly for global-scale temperature.
Our weaknesses or blindspots seem to be:
You dismiss correlation with GST datasets with “bad data can behave like good data” but WRT ERA5 present a theoretical rather than an empirical argument. You’ve said this could be the case, but not demonstrated that it is the case. For instance, you offer no clear threshold where this becomes a significant problem. You also haven’t quite addressed how propagating errors don’t seem to manifest in the ERA5 GST time series. If there is a systematic (model-derived) propagation, that is a function that does not exist in the GST records of NOAA, HadCRUt etc.
I haven’t fully engaged with your concern about systematic bias, leaning a bit too heavily on correlation with the surface records. I certainly haven’t rebutted it, and don’t even disagree with it. And at times I’ve not accurately grasped the workings of the correction components of ERA5. I suspect the deeper delve required to sort that would be beyond both of us. It’s certainly deeper than I have the time, inclination, and, and almost certainly, the skill to address in any reasonable timeframe.
I’m left with a better understanding of how ERA5 works, but not convinced that there is a compelling argument to dismiss January’s monthly GST temperature discrepancy with UAH, the reasons given to doubt it being theoretically sound, as far as I can tell, but still speculative. The correlation doesn’t address the concern with systematic bias, but it does provide empirical evidence that the propagation theory doesn’t.
So you’re leaning on the theory of error propagation to dismiss ERA5 January GST, and I’m leaning on the correlation factor.
Have I summed up fairly, do you think?
Click on my name. I put together a quick demonstration to directly address your main argument. Ive kept it as simple and clear as possible. I hope this helps.
And yes. I do think you’ve summed up the argument accurately.
I gather from the video things you’ve said earlier, but it seems you are referring to a constant offset being propagated, rather than a trend. If I’ve got you right this would seem to me to have no impact on the monthly GST presented as anomalies, and thus no reason to call into question the uptick for last January, and it being the warmest ranked January on record, resulting from the ERA5 analysis.
I do take your point that on local scale a systematic offset could misinform about local weather conditions needed to understand melt onset, precipitation dew point etc.
You have to consider the practical implications of that data, not just the data itself. After all, data isn’t just collected for its own sake – it’s meant to improve our understanding of the world and inform decisions.
The IPCC assigns climate impact thresholds at specific global temperature increases (1C, 1.5C, 2C, etc.). If the baseline temperature is systematically biased due to inaccurate local data, then the credibility of those thresholds is called into question.
The issue isn’t just about individual stations – it’s about whether a global temperature estimate calculated from systematically flawed local data truly represents the state of the climate. If we are making major conclusions based on these thresholds, the accuracy of the data they are built on matters.
Ok, now we are generalising. I think we have enough accuracy to make decisions, especially WRT mitigating greenhouse gas emissions.
There is absolutely no question that the world is warming, and very little doubt about the magnitude of the warming. Multitudes of data of all kinds converge on the rate of warming we see in the surface records (and reanalysis).
Ie, you don’t get that much sea level rise without significant warming. Global sea ice decline is real, as is glacier melt, ocean heat content, earlier plant flowering, species migration… the list goes on and on. We are definitely warming, the greenhouse gas cause (not forgetting other drivers short and long term) is clear by now, and the uncertainty remaining is only by how much.
There is another component to the risk assessment that makes it especially pointy.
We do not have another atmosphere to fall back on. We are conducting a giant experiment with the only atmosphere we have, and our uncertainty on the outcomes should not be a reason to relax. Quite the opposite. Uncertainty cuts both ways.
We are inside the test tube with no way out. If the experient goes worse than the average estimates, then we are stuck with it. If it goes well, then we are lucky.
But we shouldn’t wait to find out which way it will swing. We have an opportunity to mitigate whatever may happen. With no second Earth to go to, no doover in any reasonable time frame, we should be prudent.
The kind of observational accuracy you seem to think is necessary before doing anything is unreasonable, and probably won’t happen for a few decades. If out test tube experiment happens to go wrong, with the worst effects being felt in a few decades, we don’t have the luxury of time to wait and see. And if we continue business as usual, then after we discover our fate with more accuracy, we will be stuck with it for decades more.
If this was an experiment that we could terminate at any time or walk away from, the risk assessment would be completely different.
Also, I can’t see how, per se, error propagation would inevitably lead to an overestimation of the true warming trend. I suspect it would impossible to determine this from averaging the error propagation potential of the many different components.
The best we could currently do would be to compare ERA5 with the surface records.
https://climate.metoffice.cloud/dashfigs/gmt.png
https://repository.library.noaa.gov/view/noaa/33555/noaa_33555_DS1.pdf
https://agupubs.onlinelibrary.wiley.com/doi/full/10.1029/2019JD032361
It was harder to find global LT comparisons.
https://www.osti.gov/servlets/purl/1999732
To clarify:
“Also, I can’t see how, per se, error propagation would inevitably lead to an overestimation of the true warming trend.”
Rather than an underestimation. IOW, there;s no reason think propagating errors would only have a warming effect.
To connect that to my argument above on risk.
nate…just goes to show that fudged surface data is unreliable.
Which data did you rely on to claim that the annual US temp in 1934 was as hot as recent years?
Roy – why the disconnect? https://www.yahoo.com/news/unexpectedly-warm-january-puzzles-climate-031104699.html “Last month was the world’s warmest January on record….”. Any idea where the European Copernicus Climate Service is getting their data?
Forecast of the feels temperature for February 10.
https://i.ibb.co/GfGWf0Sr/ventusky-feel-20250210t1200.jpg
NATIONAL WEATHER SERVICE
Normal Average Annual Temperature ( 1991-2020 ) : 54,7 F =12,661 C
This result corresponds to severe hypothermia
Klaus
Please give us the link within
https://www.weather.gov/
to the page presenting this data.
https://futurism.com/elon-musk-conflict-interest-shutting-down-usaid
https://www.weather.gov/media/slc/ClimateBook/Annual%20Average%20Temperature%20By%20Year.pdf
Thanks a lot.
Amazingly cold but correct.
When downloading CONUS TAVG monthly data out of NOAA’s Climata at a Glance
https://www.ncei.noaa.gov/access/monitoring/climate-at-a-glance/national/time-series/110/tavg/1/0/1895-2024/data.csv
and averaging for 1991-2020, I even obtain 53.27 F aka 11.81 C…
Thank you.
Amazingly cold but correct.
When I download the CONUS TAVG monthly data from Clim at a Glance
https://tinyurl.com/2uxa7rfz
and average all months in 1991-2020, I obtain 53.27 F i.e. 11.81 C
Oops?! The comment I thought lost suddenly is on the thread…
A lot of confusion here, as usual.
CONUS is NOT Global and surface is NOT Lower Troposphere.
Klaus posted US national temps at the top of this thread. Feel free to start your own.
Bindi-dingdong thinks that 53.27F is totally different from 54.7F when you’re freezing to death.
No one is freezing to death when the air temperature is 53F, unless you’re naked and wet in wind overnight. Who said anything about freezing to death at 53F?
The discussion about carbon neutral has increasing public interest. Some claim the goal is rapidly approaching. What does the data show? Coal seems to have peaked, but oil and gas are still increasing. This data source shows that fossil fuels still amount to about 83% of global energy. That is down just slightly. Wind and solar remain small contributors in the renewable category compared to nuclear (renewable or just carbon free?) and hydropower.
https://ourworldindata.org/energy-mix
tim…I doubt that the public in general has much of an interest in the carbon neutral meme. Our government in Canada is beginning to concede that the Canadian public either don’t want carbon neutral or they have little interest.
We have a Green Party running federally who are struggling to get minimal support. They have 2 seats in a 338 seat Parliament. That reflects Canada’s interest in climate change, since that’s what the Green’s are all about.
Looks a bit like the Australian Greens, with focus on environmental issues and short on details when it comes to fiscal policies, national security and social policies compared to the major parties.
klaus…from your link…
https://www.weather.gov/media/slc/ClimateBook/Annual%20Average%20Temperature%20By%20Year.pdf
***
Note that 1934 was as warm as today. No one has attempted to explain that warming.
Someone brought up hypothermia, a condition that is inaccurately related only to freezing conditions. Hypothermia can happen at room temperature.
Hypothermia is a better example of ‘energy in – energy out’ than the fictitious Earth energy budget. The body can only maintain it’s 37C core temperature if it has energy input from food. Without food, the core temperature drops toward the ambient temperature.
Of course, the rate of cooling, a la Newton’s Law of Cooling, depends on temperature difference. The greater the temperature difference the higher the cooling rate. We need to remember that a room temperature of 20C represents a 17C temperature difference wrt core body temperature. Freezing water at near 0C represents a 37C temperature difference.
https://health.clevelandclinic.org/hypothermia-can-happen-indoors-surprising-facts
I might add that we must be careful with the global averages in the document due to how they were measured and calculated. It has not been till recently that we have developed a fetish for calculating global averages and it has been done largely with a huge alarmist bias.
“Note that 1934 was as warm as today. No one has attempted to explain that warming.”
The worst North American drought year of the last millennium: 1934 Cook et al (2013)
For one.
You sound exactly like Donald Trump telling a lie. Just put his accent on that quote and it could have come out of his mouth.
Which dataset did you refer to when you determined that 1934 was so warm compared to recent years?
If it’s the one Klais linked, that’s NOAA.
Are you saying their dataset is reliable enough for you to refer to when talking about which year is warmer than another?
If not, which dataset are you relying on?
To see the years in context, here they are lined up in a time series:
https://www.ncei.noaa.gov/access/monitoring/national-temperature-index/time-series/anom-tavg/ann/12
If you can’t see earlier than 2005, just pull the slider underneath the graph to the left. Or you can look at it here.
https://tinyurl.com/yzb4mbnx
Short story, it’s warmer now than in 1934.
But the summer of 1934 is still a humdinger.
https://tinyurl.com/yzb4mbnx
Hmmm tinyurl seems to be messed up.
If you want to see the amazing summer of 1934, which has only ever been tied in recent times, click on the NOAA link and choose
Parameter: Average Temperature Anomaly
Time Scale: 3-Month
Month: August
But don’t listen to Gordon if he says no one’s ever investigated it.
As usual, Barry side-steps the question. Why was it as warm in 1934 as today? Also, Barry dismisses 1934 as an anomaly while ignoring an entire decade of drought conditions in North America in which consecutive heat waves records were set that still stand today.
The heat wave record was set in 1936…
https://www.wunderground.com/blog/weatherhistorian/the-great-heat-wave-of-1936-hottest-summer-in-us-on-record.html
but the entire ’30s decade had droughts. We were taught in first year Geology that the great dust storms produced were due to fields being ploughed incorrectly. I regard that as nonsense today since the soil needs to dry out first and for a long time with consecutive droughts.
What caused those droughts in the 1930’s…the trace gas C02???
barry…NOAA surface data is so fudged and corrupt as to be unreliable.
“As usual, Barry side-steps the question. Why was it as warm in 1934 as today?”
I literally posted a study into that year in my reply. Did you forget your meds today? There are tons of studies on it – contrary to your inane comment
“No one has attempted to explain that warming.”
” barry… NOAA surface data is so fudged and corrupt as to be unreliable.”
How do you know what the annual temperature was in 1934? Which data set are you using to say that it is the same temperature as ‘today’?
Please tell me it’s not just your gut feeling. Which serious source provided you with the information that the annual temperature in 1934 was “as warm As today”?
Sorry about the diversions into politics, but these are extremely interesting times. If Roy asks for it to cease, I’ll oblige. Till then….
Areas that Trump wants America to take possession of:
Greenland
Panama Canal
Canada
Gaza
I wonder if this list will grow.
When do we get to call him an imperialist? Do we need one more portion of the globe to be an stated acquisition, or is it more than one?
barry…you should know by now that Trump specializes in opening his mouth and letting his belly rumble. He thinks he is running a non-union corporation where workers are at his mercy, and that he can bully them into submission.
Trump must obey the Constitution and if he does not, that is grounds for impeaching him. Unless he manages somehow to bypass the Constitution, he is doing nothing more than venting.
There is zero chance that he will take over Canada as things stand. To do that, he’d need complicity and popularity from within and that’s not happening. All he has done is manage to make us stronger, in defiance of any US takeover of our resources.
The only chance he has is if the Tories get into power, and if the Liberals are smart, they will play that card and keep them out.
His threats against Greenland have brought the entire European Union into the fray in support of Denmark.
The US became great by getting along with its Allies and friends. In a single week, Trump has gone a long way to alienating them.
“you should know by now that Trump specializes in opening his mouth and letting his belly rumble.”
Oh, fully aware. He just says stuff regardless of consequences or facts.
In simple terms, he continually lies. In more forgiving terms, he makes stuff up.
He constantly bypasses the constitution. DOGE is currently operating outside the constitution.
SCOTUS recently ruled that a president’s actions are immune to law for the most part. So not only does Donny now have the yes men around him and the crazies that will go even further than him, he has the license to do a lot more than last time.
Not that legality was a big issue for him to begin with, but SCOTUS has just endorsed his own ideas that the constitution is beneath the presidency.
Herr’s a ‘forecast’ for you. Trump is going to cause turmoil and chaos on the global stage, with an escalation in ME conflict. He is also going to cause economic hardship at home and abroad. Unless Ukraine wins the war and Russia limps back home. Trump will screw that conflict up, too.
Barry, You’ll be pleased to know BC Conservative Party will have its annual AGM in Nanaimo on 1 March 2025. A new executive board will be elected. BC Conservatives are currently the opposition party in BC Legislature.
Knowing nothing about BC I’ve just had a quick google. The election last year followed the global trend where the incumbent lost or did much worse.
While one could pick at economic failures, the economy since 2020 has done reasonably well compared to the rest of the world. Low unemployment, a reasonable but not completed recovery from the COVID depression, but the cost of things has risen higher in BC than the global average increase post-COVID.
All this with a domestic and commercial energy supply that is mostly renewable. BC has an advantage with hydro, it seems.
barry, Klaus
Klaus’ idea to show how cool CONUS normals for 1991-2020 are was a good catch.
For years I have regularly shown Robertson’s utter incompetence even wrt things as simple as CONUS’ temperatures since their ‘official’ begin in 1895.
All the time he endlessly repeats the same allegation that the 1930s were warmer than today. They were not – even if you restrict the view to a monthly TMAX series whose descending sort shows, at its top 10, a tiny bit more Julys out of the 1930s than out of the 2000s:
1936 07 90.81
1934 07 90.52
2012 07 89.92
1901 07 89.92
2006 07 89.55
1980 07 89.49
1931 07 89.49
1954 07 89.26
2022 07 89.22
1930 07 89.10
Source
https://www.ncei.noaa.gov/access/monitoring/climate-at-a-glance/national/time-series/110/tmax/1/0/1895-2024/data.csv
*
But months are months and years are years; for these, you have to look at their averages and not at their Julys.
Here is a descending sort of National Weather Services’ yearly data posted by Klaus:
https://drive.google.com/file/d/185pXddFq-22Fs_cqCcQlIuptRtHCFvhu/view
You immediately see the dominance of the 2000s with the top 10 full of them; the first of the 1930s is at position 11, the second one at position… 58.
*
{ In fact, the posted list was published in April 2024, hence 2024 is missing, which is actually the new topmost year. }
*
Even worse: ignoramus Robertson apparently never had a look at the end of such a descending sort.
Otherwise, he would have seen that the 10 bottommost positions contain 3 of the 10 1930s, with 1932 being even the coldest of all years.
*
Finally, let’s hammer on the nail one last time, by averaging the two decades:
– 2000s: 54.3 (F)
– 1930s: 51.3
*
But Robertson is known to always deliberately ignore contradictions and to soon resort his unchanged blah blah.
**
So much also about the stupid polemic posted above by hyperdummkopf ‘red krokodile’:
” Bindi-dingdong thinks that 53.27F is totally different from 54.7F when youre freezing to death. ”
A difference of 3 F i.e. 1.7 C is in such a series a fairly relevant number, ¡basta ya!
Big talk from someone who thinks a 30C y-axis is a genius move. If Im a dummkopf, what do we call someone who botches basic chart scaling?
In a previous comment, I showed a comparison of daily (Tmin+Tmax)/2 to the 24h average computed out of USCRN hourly data coming from all 137 stations shows no relevant difference between the two.
But accidentally I selected absolute data:
https://drive.google.com/file/d/1k8oNXAY0hFrkcRo7x5eEVTEWBGsAK-CX/view
*
Hypergenius red krokodile’s reaction:
” As for your Figure 2, your y-axis spans a range from +25 C to -5C. That is so broad that it masks the very differences we’re discussing. ”
This is completely ridiculous, as using absolute data shows even more the similarity between the two averages of hourly data because of the higher deviations with regard to the dmall differences in the polynomials.
*
But the genius wants a y-axis spanning a smaller range, hence we show the same stuff in anomaly form, giving smaller deviations:
https://drive.google.com/file/d/1cVtzEpaL5S_QLLDTLADqcMiad-KgrVkv/view
The same can be shown of course for the German hourly DWD data:
https://drive.google.com/file/d/1FoEq50ao5rfZepgQGVY1MtV56lal0TMe/view
*
That’s the reason why ‘red krokodile’ 100% deserves the mention ‘hyperdummkopf’.
Like Robertson and Clint R, who discredit anyone showing GHE, global warming or even the lunar spin, the hyperdummkopf can’t contradict technically with own results, hence keeps polemically discrediting.
Comprehension failure!
For 30-year trends, the difference in (Tmax + Tmin)/2 trends between the entire network and only the CRN1&2 (best-sited) stations was less than 0.01C/decade. So, a y-axis spanning 30C is clearly excessive and obscures the very differences under discussion.
Furthermore, the data you’re using was derived from the USCRN dataset, which does not include the stations analyzed in the 2011 study. This means youre not addressing the central issue I raised. You are just deflecting with irrelevant comparisons.
barry
I saw above another blah blah, for years and years endlessly repeated by ignoramus Robertson:
” barry… NOAA surface data is so fudged and corrupt as to be unreliable. ”
*
Robertson lives in such a deep, persistent hatred against NOAA that he can’t stop denigrating what they do – of course without having ever been able to technically, let alone scientifically contradict their results.
Instead he posts links to prehistorical ‘Musings from the Chiefio’ (Techno bits and mind pleasers) like this incredibly incompetent stuff:
https://chiefio.wordpress.com/2009/10/27/ghcn-up-north-blame-canada-comrade/
No need to say that E.M. Smith is his favourite contemporary authority figure!
*
But let’s forget this ridiculous chiefio figure and his tremendously absurd evaluations of GHCN V2, and go to a more productive, concrete data comparison with as example – by accident, he he – the region around Vancouver (a 2.5 degree grid cell centred on 49N-123W), in which we can see how close are actually the data of
(1) NOAA’s Climate at a Glance based on GHCN V4’s adjusted and homogenized variant,
(2) GHCN V4’s raw, unadjusted source GHCN daily
and
(3) last but not least, UAH LT’s data for the same 2.5 degree grid cell.
*
Here it is (chart design dated end of October ’24):
https://drive.google.com/file/d/1I2_U77XFXLJJSjYovH525LBkwtpqgY8_/view
*
Linear estimates in C / decade for the period Dec 1978 – Aug 2024:
– UAH LT: 0.24 ± 0.11
– GHCN daily: 0.17 ± 0.04
– NOAA CaaG: 0.14 ± 0.02
*
I can only repeat:
Who credulously believes Robertson’s incompetent lies 100% deserves it.
**
Sources
NOAA CaaG
https://www.ncei.noaa.gov/access/monitoring/climate-at-a-glance/global/time-series/49,-123/tavg/land_ocean/1/0/1937-2024/data.csv
GHCN daily
https://www.ncei.noaa.gov/pub/data/ghcn/daily
UAH LT (old version 6.0 at that time)
https://www.nsstc.uah.edu/data/msu/v6.0/tlt/
Yes, one wonders how it is that such small differences between the favoured dataset and the rest excites such withering dismissal.
I’m still keen to know which dataset Gordon relies on – assuming it’s not just his gut feeling – to say that 1934 US temperature was as warm as recently in the US.
He has rubbished every single dataset that could give him that answer, so it’s a mystery how he comes to this conclusion.
Bindidon seems quick to criticize others with an insult, but slow to admit mistakes. In a previous topic, I correctly stated that there have been periods of rapid sea level rise in recent history. The response was to post graphs (not raw data) that had been smoothed with 10-year averaging along with suggestions about being an expert on the topic. Data smoothing is the oldest trick in the book to hide rapid or erratic changes.
I found raw data from a reliable government source to show a rapid rate of sea level rise between 1930 and 1950 with a long period of rather slow rise after that. The obvious conclusion being that the current 40-year period is not exceptional even though it is longer and at a faster rate. I did not see an apology or acknowledgement.
More recently, Bindidon seemed to confuse the concept of latent heat of vaporization as it relates to heat pumps. I very politely posted a detail explanation of the error, and once again received no acknowledgement.
Dottore Tim S
This is not an insult, Dottore. It is just a somewhat sarcastic reaction to your all trhe time condescending, professoral tones.
**
1. ” Bindidon seems quick to criticize others with an insult, … ”
*
Your behavior on this blog luckily is free of all the discrediting, denigrating, insulting and lying you seem, unlike me, to politely overlook or, unlike me, avoid to reply, possibly because you fear the harsh responses following your replies.
*
Starting for example with Robertson, insulting years ago Andrew Motte, one of the ten main direct translators of Newton’s Principia and historically the very first one, a ‘cheating S O B’ – just because he was unable to follow Newton’s (New) Latin and thought Motte woulkd have it plain wrong.
Robertson even insulted someone with ‘a$$hole’, a few years ago too.
Continuing for example with Clint R, who regularly denigrates and insults hundreds of historical and contemporary astronomers, mathematicians and physicists as ‘astrologers’ – just because all of them understood how to compute the lunar spin whose existence he denies.
Such people insult me since I visit the blog – either still under the same pseudonym or under other ones – just because I don’t share anything of their 360 degree denial attitude.
*
2. ” … but slow to admit mistakes. ”
Unlike some opinionated posters who endlessly repeat the same nonsense despite having been contradicted and corrected, I always have admitted my mistakes; this then was cowardly misused by these people with further discrediting of my positions and results.
But… to admit a mistake, I first have to admit it is one.
**
3. ” I found raw data from a reliable government source to show a rapid rate of sea level rise betweeI found raw data from a reliable government source to show a rapid rate of sea level rise between 1930 and 1950 with a long period of rather slow rise after that. ”
*
On January 19, I stored the beginning of an inevitably complex reply to your somewhat superficial comment about sea levels and therein your brazen claims about
– the reasons for my smoothing you manifestly did not understand;
– the allegedly raw data you found,
but was at that time too sick to finish the intended comment.
*
I’m recovering now, but it’s a bit late here at UTC+1, and will reply in detail tomorrow, including a reaction to your heat pump blah blah which didn’t have the least relevance in the context of the recent discussion about these devices.
*
Ayez donc un peu de patience, Dottore.
I have criticized Gordon, Clint, and others on occasion, but I try to be professional and not use overt insults. I am sure they do not like it, but I at least attempt to make my comments objective and include some kind of explanation or justification.
As for being condescending, I try to follow two important rules. I only comment on things that I know to be true, and I will admit my mistakes or modify my comment if necessary. If I am speculating or expressing an opinion, I try to make that obvious or directly state that it is an opinion. If you notice irony, sarcasm, or attempted humor, that is usually on purpose.
I admit fully that I am not a climate expert. I am a student of climate. On the other hand, I am very well educated and have significant professional experience working with most of the raw science involved. I am really good at doing investigative research, and I know how to write effective statements.
As you point out, I try not to comment on criticism or other things that are obviously incorrect.
In other news, Avian Flu has joined the growing list of things made worse by Climate Change. The claim is that migratory habits have changed. Just today, there is news of an infected cat. The pandemic potential is probably rather weak. There already is a vaccine (scary bad word for some people) in short supply that can easily be ramped-up if needed. More notably, this could become a case study in zoonotic pandemic development.
Historically, zoonotic development takes time for the many mutations to develop. This is compelling evidence that COVID-19 was a lab leak of a gain-of-function experiment. COVID did not need any time at all to develop the ability to spread asymptomatically as an aerosol. The original SARS and MERS never became highly infectious because they were identified in their early development.
Lab leak is still a possibility. There is no compelling medical evidence that GoF was involved. Pretty much all medical research on that points to natural origin.
There is more volume of research (number of published papers) on zoonotic development, but that does mean it is correct. None of it is conclusive, that’s right, none because the crossover animal has not been found and to that extent, does not exist. The lab does exist, but the Chinese Communist Party will not let any outside observers go anywhere near it (okay, the street out front), while they also deny that it has any military or state secret functions.
My bad. Insert this lead sentence:
There is more volume of research (number of published papers) on zoonotic development, but that does NOT mean it is correct.
“This is compelling evidence that COVID-19 was a lab leak of a gain-of-function experiment.”
No.
“There is more volume of research (number of published papers) on zoonotic development, but that does NOT mean it is correct.”
Yes.
There has been a huge amount of research on the origins. Shutting the world down can be inspirational in some respects. Non-zoonotic origins has been explored and not entirely rejected, but that’s very different from “compelling evidence.”
So we have two very opposing views. The strongest case for a lab leak comes form Dr Robert Redfield, who actually is a Virologist.
https://www.newsnationnow.com/vargasreports/declassify-scovid-docs-former-cdc-director/
[The man who headed the Centers for Disease Control and Prevention when the COVID pandemic began says still-classified State Department documents add credibility to his long-held contention that the virus spread because of a leak from a laboratory.
Once they are declassified, the American public will get a much better understanding of the knowledge base we have, Dr. Robert Redfield told NewsNations Elizabeth Vargas Reports.
Rep. Brad Wenstrup, R-Ohio, chair of the House Select Subcommittee on the Coronavirus Pandemic, says he recently viewed the State Departments documents, which he says strongly hint that the Chinese Communist Party attempted to cover up the fact that COVID first spread due to a lab leak at the Wuhan Institute of Virology.]
The other point of view for zoonotic origins has many proponents. They all have the problem that the crossover animal does not exist. My favorite nonsense argument is the fact that SARS-CoV-2 virus was found at the wet market and on animals at the wet market — the smoking gun! This is actually humorous since infected people tend to sneeze and none of animals were infected — it was all external.
Anyway, I will agree it is not fair to use guilt by association to develop a stereotype. Nonetheless, this is the most extreme view for zoonotic release I found. It comes from the World Socialist Web Site:
https://www.wsws.org/en/articles/2025/01/28/thlk-j28.html
I couldn’t find any research by Redfield on the issue, but I did find research papers that he co-authored with Fauci on COVID 19.
So, no, we don’t have Redfield on one side of medical evidence, we have testimonial from him – his opinion.
You can read the wiki entry on him regarding COVID.
https://en.wikipedia.org/wiki/Robert_R._Redfield#COVID-19_pandemic
“The other point of view for zoonotic origins has many proponents. They all have the problem that the crossover animal does not exist.”
This is also the case for, Ebola, Spanish Flu (H1N1) and HCV. All assumed to have a zoonotic origin, owing to similarity with viruses found in animals, but the precursor animal group was never found.
Yes it’s a problem, but it’s hardly definitive.
Why would you provide an ‘extreme’ view? Isn’t the mass of evidence and a balanced view better?
No barry, I am not going to chase 10 different strawman arguments at once. Do you have an intelligent question or comment? In 1918 things were different.
My comments are intended to be sincere and not reflexive arguments just for the sake of argument. You are on the verge of becoming irrelevant like so many others.
I might regret this, but I am going to explain why Wikipedia is so very useful and reliable on some technical subjects and complete junk on anything political or controversial. I am a Wikipedia editor. It is nothing special. Anyone can just sign up. Anyway, I have access (maybe the public does also — not sure) to the inside debate process.
There are different levels of editors depending on the “importance” of the subject. Every topic has a main editor who commands the input. Period. The way the game is played is that nothing is supposed to be published on the public page unless it has a reference of some kind which is usually a media reference. Sometimes you will see notes that a better reference is needed.
That sound good, right? The problem is that anything at all can be included so long as it came from a source with a reference — any reference. This is at the discretion of the prime editor.
The prime editor gets to decide. I am not even close to that level, and I am not sure how that privilege gets earned. So there you have it. One person, or maybe a small group with seniority get to decide at their discretion what references get posted and which ones do not.
I witnessed one discussion where a climate change claim was made. Someone made a comment that it should be left out because the site was getting a reputation for being too liberal and it was not needed for the topic. The prime editor disagreed. End of discussion.
I tend to lay low and not make waves for two reasons. One is that I do not spend much time working as an editor. The other reason is that I do not want to get a reputation as a trouble maker. I want to preserve my ability to argue things that I think are important. I want to save my battles for things that count.
The comments on this editors page do not get saved because the purpose is to screen content before it gets posted. Once a decision is made the discussion is deleted. These people who all know each other fight like cats and dogs about trivial little details — just like some of you on this site.
Rant is over.
I have no idea what your issue is. I disagreed with you that there is compelling evidence that SARS CoV2 arose from GoF manipulation. We discussed it. I think I was polite.
I get the impression that you are leaning more heavily than I am on a lab leak/gain of function theory. All I’ve said, and am happy to back up (though you already seem to be aware) is that the lab leak theory remains in contention, and the weight of medical evidence is against GoF cause without entirely rejecting it.
I’m well aware of how wikipedia is put together and its limitations.
I have no idea why you cited a socialist magazine on a medical question. Could you explain your thinking? Were you trying to achieve some sort of balance in the two sources you chose?
My homespun research on this topic has usually taken me to google scholar. I often look for review papers on various science-based topics, that cite and summarize the prevailing view, as well as explaining and contextualising alternative views.
I also checked the NIH contract with Wuhan Lab and the US medical group requesting funding 3 years ago. I tend to go to source wherever possible. I certainly don’t rely on news media (or wikipedia) to get a grounded view.
Barry made a perfectly valid point, that the ‘precursor group was never found’ for many infectious viruses , and thus this absence of evidence is not evidence of absence, as Tim suggests.
But Tim has no response other his standard condescension and insults:
“No barry, I am not going to chase 10 different strawman arguments at once. Do you have an intelligent question or comment? In 1918 things were different.
You are on the verge of becoming irrelevant like so many others.”
What are the statistical odds this outbreak would occur that the place they are doing the gain of function research?
It’s not clear that the Wuhan lab was conducting regulated gain of function research. They manipulated a virus to infect ‘humanised’ mice, but it is a matter of debate whether this transgressed GoF prohibitions in terms of the narrow definition determined by the US health services, which is about the risk posed to human safety. Gain of function research is routinely done to, create vaccines and antibiotics, strengthen crop resistance and find cures for cancer, to name a few activities which fall under the broad category which are not prohibited.
The Wuhan lab is under a cloud of suspicion because it refused to share its research data with the NIH via Eco Health Alliance, a US non profit that had secured the grants for Wuhan research on coronaviruses. NIH withdrew funding early 2020 and restored it a few months later, finally withdrawing funding altogether in 2023 after reporting failures both from EHA and Wuhan, particularly that the research had increased virus virulence in mice.
BREAKING NEWS:
barry has full access to all of the secret records of the Wuhan Institute of Virology. He knows what work was done and what activities did not occur. He has proof that there was no military work being done.
Please tell us more (yes, sarcasm for those who do not get it!).
Tim, you’ve claimed that you’re trying to have a sincere conversation. I’ve given you the benefit of the doubt. Now I don’t buy it.
You’re going to have to work on your humour, too. Sarcasm works better if it even slightly accurately characterises what it’s satirising.
Tim,
Yes we have discussed it thoroughly before. I showed you a number of facts that point to the zoonotic theory. The covid DNA found near live animal cages in the wet market, the first identified cases in workers in the wet market, the analysis of all first cases consistent with spread from the wet market.
And even though the virology community and the intelligence community express no certainty in either scenario, you still do.
Redfield was appointed by Trump. That is all you need to know.
barry says:
“Its not clear that the Wuhan lab was conducting regulated gain of function research. They manipulated a virus to infect humanised mice, but it is a matter of debate whether this transgressed GoF prohibitions in terms of the narrow definition determined by the US health services, which is about the risk posed to human safety.”
Here in lies the problem. “Corruption” and “government” are synonymous. That will always be the case when bureaucrats are made responsible for OP money without any personal risk being attached.
At least some of the authoritarian societies would just take them out back and shoot them when they F’d up. I am not advocating for any authoritarianism at all. But we would be better off allowing private entities engage in the research with full recourse against all their assets and in extreme cases criminal liabilities when they negligently screw up.
—————–
barry says:
“The Wuhan lab is under a cloud of suspicion because it refused to share its research data with the NIH via Eco Health Alliance, a US non profit that had secured the grants for Wuhan research on coronaviruses.”
And that’s a surprise in authoritarian China? That’s expected. Which im becile thought different? We should not be funding anybody who is beyond full accountability.
——————-
barry says:
“Its not clear that the Wuhan lab was conducting regulated gain of function research. They manipulated a virus to infect humanised mice, but it is a matter of debate whether this transgressed GoF prohibitions in terms of the narrow definition determined by the US health services, which is about the risk posed to human safety.”
Here in lies the problem. “Corruption” and “government” are synonymous. That will always be the case when bureaucrats are made responsible for OP money without any personal risk being attached.
At least some of the authoritarian societies would just take them out back and shoot them when they F’d up. I am not advocating for any authoritarianism at all. But we would be better off allowing private entities engage in the research with full recourse against all their assets and in extreme cases criminal liabilities when they negligently screw up.
——————
barry says:
“NIH withdrew funding early 2020 and restored it a few months later”
LOL! Sure thing Fauci wanted no hint that Wuhan would be the source. Reinstating the funding was part of the coverup. It was closed due to suspicions and restored without any scientific answers to the suspicion. That’s a crime or should be.
Fortunately an ever growing dissatisfaction is well planted and we now have some leadership that is going to dive into this. I certainly hope that growth skeptical of an authoritarian administrative state grows back to its historic levels of a 100plus years ago. That was the original vision of the civil service to get away from administrative corruption. Today the civil service has been lap dogged to thousands of commissions, boards, publicly funded institutions, and special interests.
“LOL! Sure thing Fauci wanted no hint that Wuhan would be the source.”
Funding approval is decided by committee, but well done soaking up the arch villain rhetoric. The truth is usually much more boring than the political narrative.
barry says:
”Funding approval is decided by committee, but well done soaking up the arch villain rhetoric. The truth is usually much more boring than the political narrative.”
There are lots of different kinds of committees. For instance and not fully inclusive of all committees.
You have committees where one member controls the program budgets of the others,
You have committees where the majority or all of the members has the same special interests.
You have committees where the majority of all of the members are independent and represent a vast majority of stakeholders.
Only one of those types of committees is capable of decisions that is satisfactory as the ”arch villain” can be any of the others.
Maybe figure out which chair is the right one before flicking your locks, Goldy.
Nate, you of all people know better. We had this discussion before. There are two primary issues that separate the two theories. The zoonotic path needs a crossover animal. This is a new virus, not something that has been in nature for a long time. The Chinese have not been able to find or manufacture a bat virus in nature that is a precise copy of SARS-C0V-2. It does not exist. Without the crossover animal, the zoonotic route is pure theory, and zero substance. Are any of the vast array of scientists who support this theory working on finding this crossover, or is it easier to leave it out there as possibility?
I posted a news link and video from a reliable person, Dr Redfield, who claims to have proof, or at least really good evidence of the lab leak. I got a response from barry with a complete trash piece from Wikipedia. They worked long and hard to find any and every bit of trash they could find on Dr Redfield. Realize that opinions are fair game to the Wikipedia editors if they can find a link to show it was published. Please comment on the content in the 5-minute video in the news article. Do not attempt to trash Dr Redfield. There is zero evidence that he has any evil intent, or does not fully believe what he says.
The comment from the Socialist news was a joke. Maybe barry really did not see the humor. My apologies if he took it seriously. For the record, I think it could have been written by a comedian. The fact is that it was a prominent result in my search along with Newsweek, CBS, NYT, WP, and all of the rest. Here is my comment in context:
[Anyway, I will agree it is not fair to use guilt by association to develop a stereotype. Nonetheless, this is the most extreme view for zoonotic release I found.]
Yes, I didn’t get the joke. I probably lack some context for it. I totally didn’t understand this comment.
“Anyway, I will agree it is not fair to use guilt by association to develop a stereotype.”
No idea if you were referring to me, socialism+zoonotic theory or something else.
“Without the crossover animal, the zoonotic route is pure theory, and zero substance.”
That would be true if there was nothing at all to indicate the virus is of animal origin. There is plenty of evidence of that, including strong similarity to bat coronaviruses, the fact SARS CoV1 almost certainly originated in a wet market, the fact that the controversial furin cleavage is found in other viruses in animals, and the fact that many of the earliest cases were clustered around the Wuhan market.
But we may have different ideas of the meaning of the word “substance.” No crossover animal has been discovered, although SARS CoV2 readily infects certain animals, including those that spread SARS CoV1, and some of these types animals were sold at Wuhan market when the outbreak started. There is certainly empirical evidence to build a theory of zoonotic origin.
Unfortunately – or suspiciously, depending on your politics – the animals at Wuhan market were destroyed before genetic testing could be done. SARS CoV2 was found in animal trace samples at the market, but no way of determining if this was the source, or if humans infected the animals.
(I had a lot of free time during lockdown)
BTW, I wasn’t attempting to trash Redfield, but I thought it was worth getting some context. As well as criticisms, that section also describes his correct interpretations of the COVID outbreak as opposed to the US executive of the time. I also noted his early research of COVID.
But my main point was that dedicated research trumps personal opinion, even from experts.
This is how I would refer to expert opinion on both sides of this debate.
“We offer a perspective on the notable features of the SARS-CoV-2 genome and discuss scenarios by which they could have arisen. Our analyses clearly show that SARS-CoV-2 is not a laboratory construct or a purposefully manipulated virus.”
https://www.nature.com/articles/s41591-020-0820-9
“Under a series of NIH grants and USAID contracts, EHA coordinated the collection of SARS-like bat CoVs from the field in southwest China and southeast Asia, the sequencing of these viruses, the archiving of these sequences (involving UCD), and the analysis and manipulation of these viruses (notably at UNC). A broad spectrum of coronavirus research work was done not only in Wuhan (including groups at Wuhan University and the Wuhan CDC, as well as WIV) but also in the United States.”
https://www.pnas.org/doi/10.1073/pnas.2202769119
And a review article to summarise the research in general:
https://journals.asm.org/doi/10.1128/mbio.00583-23
As I’ve revisited the issue, I find that the side of the debate falling on the GoF/lab leak theory is not as rooted in science as the zoonotic origin. But I haven’t dived very deeply. The second paper above is typical of what I found – some political language injected into a purportedly medical research paper. Much alleging, not much research.
In that regard, here is a paper that discusses the politics surrounding the outbreak and later study of the disease.
https://link.springer.com/article/10.1007/s11673-023-10303-1
Despite it looking to me that the science clearly favours a zoonotic origin, I’m no expert. I can weigh the evidence as well as I can read and understand the research. Therefore, I have to allow that the issue is not settled, though i note the political emphasis behind the GoF/lab leak theory, which may have muddied the waters rather than illuminated them.
Tim S, Barry
There is a possible smoking gun for the zoonotic hypothesis.
Case zero, the first identified covid infection, occurred in December 2000 in Wuhan city and was associated with the market.
However, there were informal reports of earlier flu cases in the rural villages supplying animals to the market. This would suggest that the animal trappers were picking up Covid from the animal population they were harvesting.
Unfortunately neither the American investigation team, nor the Chinese authorities followed up on the reports at the time, so any evidence is now lost.
“The zoonotic path needs a crossover animal. The Chinese have not been able to find or manufacture a bat virus in nature that is a precise copy of SARS-C0V-2. It does not exist”
Again ignoring the quite valid point that historically, absence of evidence for that has not been evidence of absence.
But there is available other evidence, as I mentioned above, which you will likely again ignore, because you have decided.
Nate, you continue to reveal yourself by not answering questions that bother you. You provide a partial quote of me, but leave out the part that answers your question about the absence of evidence. Could it be a strategy of people who are pushing the zoonotic theory?
[Without the crossover animal, the zoonotic route is pure theory, and zero substance. Are any of the vast array of scientists who support this theory working on finding this crossover, or is it easier to leave it out there as a possibility?]
I will expand on that. In the modern world with DNA technology, these questions can be answered.
This part is fun. They found DNA at the wet market, but no infected animals. That is easily explained by infected people sneezing. We know the virus can survive in dried mucus.
I hate to bring science into this, but there is a risk management tool that looks at probabilities. For those who do not know, probability fractions multiply, they do not simply add. For example, if 4 thing happen at the same time, and each one is a 1 in 1,000 chance, the resulting probability is 1 in a trillion, not just 1 in 4,000. So the question is how many mutations did it take for SARS-CoV-2 to develop? Then the followup is whether that series of mutations is more likely to occur in a controlled lab experiment, or randomly in nature in a succession of interactions back and forth between 2 different animal species? What are the odds?
“This part is fun. They found DNA at the wet market, but no infected animals.”
Because the animals were destroyed and the site cleared of them before they could be tested.
“or randomly in nature in a succession of interactions back and forth between 2 different animal species? What are the odds”
When one of the species is humans, and the other live animals in cages, the chances are much higher.
Nor do you answer for facts that are inconvenient.
The first identified cases were workers in the wet market. The analysis of the homes of all first cases consistent with spread from the wet market.
Absence of evidence of the precursor animal has not been evidence of absence in many cases that Barry named.
In other viruses that spread from animals to humans, there were workers in close proximity to the animals for extended periods, allowing the virus to bounce back and forth and evolve more quickly.
“Tim S says: Then the followup is whether that series of mutations is more likely to occur in a controlled lab experiment, or randomly in nature in a succession of interactions back and forth between 2 different animal species? What are the odds?”
I’m curious what you think of Darwin’s theory of evolution by natural selection?
It is interesting that Nate claims to not understand the concept of virus mutation. I thought that was obvious. The evolution of COVID to different variants took millions of infected people with trillions of virus replications for each person. It is a slow process. A few people at a wet market is not significant. Speaking of the wet market as a point of origin, that is exactly what the Chinese want you to believe. Hmmmm
As I recall, Tim, neither of us are virologists.
Here’s a map of the earliest cases and their links to the wet market.
https://www.science.org/doi/10.1126/science.abm4454#f1
Seems clear the clustering around the market and not the lab.
The paper does a good job discussing where the data is from, mostly from the various local hospitals who reported before this was known to be a new infectious disease.
I have to admit that I am very impressed with Nate’s investigative skills. The failure to find virus on the sidewalk in front of the lab and in the surrounding area would be proof that the virus could not have somehow originated from the lab and spread elsewhere — like a wet market maybe. People need to decide on their own whether that is sarcasm or not.
Note: I do not have Nate’s account. It seems that he wrote that himself.
Trying to have a serious discussion.. But just get the usual condescension, and a dearth of answers from Tim.
Innuendo and sarcasm aren’t substance or sincerity.
The wet market is not a viable issue. There are no clues or leads there and you both know it, so who are you trying to play? How many people do you think are buying that story? I am willing to bet that if the Chinese were being transparent, you would find shopping malls, sporting events, and many other places with outbreaks.
I remember very early-on, there was a video showing a fleet of small excavators (probably 30 to 50) working on building a temporary hospital for hundreds of people. I could be mistaken, but I remember being surprised and wondering if the story of building a hospital was true, because I think this was before they admitted to human-to-human transmission. Obviously, they knew something was serious at that point.
So did all of those early cases come from the famous wet market, or was that a smoke screen put on by the Chinese because they already knew full well they had a big problem?
Here it is, For the record, I was mistaken. You guys will be thrilled. Construction started 3 days after the announcement of human-to-human transmission. Oh, but wait a minute. That was the announcement. When did they actually know?
https://en.wikipedia.org/wiki/Huoshenshan_Hospital
Look at the photo in the upper right. Construction of the hospital began on the evening of 23 January 2020 with a scheduled completion of construction on 2 February.[10]
https://en.wikipedia.org/wiki/Timeline_of_the_COVID-19_pandemic_in_January_2020
14 January
WHO sent a tweet which said “preliminary investigations conducted by the Chinese authorities have found no clear evidence of human-to-human transmission of the novel coronavirus (2019-nCoV) identified in Wuhan, China”.[76] According to Reuters in Geneva, WHO said there may have been limited human-to-human transmission of a new coronavirus in China within families, and it is possible there could be a wider outbreak.[77]
20 January
On 20 January, after two medical staff were infected in Guangdong, China National Health Commission confirmed that the virus was human-to-human transmissible.[102] The investigation team from China’s National Health Commission confirmed for the first time that the coronavirus can be transmitted between humans.[103]
From the wiki timeline:
“Respiratory wards in Wuhan hospitals began reaching capacity around 12 January, with some people being denied care.”
Perhaps contributory to the hospital being built? As may be for the following?
“18 January
An epidemiological team from Beijing led by renowned Chinese scientist Zhong Nanshan arrived in Wuhan and began an investigation into the epidemic.[91] [On 19 January] Officials reported 17 additional laboratory-confirmed cases, three of which were in critical condition. This brought the number of laboratory-confirmed cases in China to 62. The patients’ ages ranged from 30 to 79. Nineteen were discharged and eight remain critical.”
……
20 January
Chinese Communist Party general secretary (Paramount leader), Xi Jinping said “people’s lives and health should be given top priority and the spread of the outbreak should be resolutely curbed.”[102] State Council premier Li Keqiang urged decisive and effective efforts to prevent and control the epidemic.[105]”
Tim, it’s well-known Chinese authorities were at times secretive and often prevented unfettered investigation. It’s par for the course. This raises legitimate suspicions but doesn’t answer many questions.
On the flip side, it was Chinese medicos who were quickest to sound the alarm (and get punished for it by the CCP) and were first to publicise the genome sequence.
“The wet market is not a viable issue. There are no clues or leads there”
Tim blatantly denies the facts shown to him in the published scientific literature, while focusing fully on conspiracy theories promoted by right wing media and 4chan etc
Nate continues to pretend to be clueless while making false accusations about associations that I do not have. Maybe he is not pretending. Maybe he really does not understand the most basic facts about virus transmission.
No clues at the Wuhan market?
https://www.cell.com/cell/fulltext/S0092-8674(24)00901-2?_hsmi=324423428
Tim,
When you claim certainty that no other expert claims, then you just make yourself look foolish.
Sorry, you do not know more about virology than virologists. Nor do you know more about how epidemics spread than epidemiologists.
You consistently reject contradictory evidence linking most of the earliest cases to the wet market.
But a lack of evidence on the lab leak theory, for you becomes evidence of a conspiracy.
This is a standard logical fallacy adopted by conspiracy obsessed people.
Nate, I have been honest with you and given you a fair opportunity to have an intelligent conversation. Instead, you resort to this crap. I have supported every statement with the reasoning I am using, but to no avail. You insist on making it personal rather than rational.
You had your chance.
This
“The wet market is not a viable issue. There are no clues or leads there
is unsupportable BS, given the scientific research that has been shown to you, revealing loads of leads present there.
Read the paper just cited by Barry.
Going back to your original statement on GOF research being responsible:
Questions have been raised about whether this NIH-funded research had a role in the emergence of SARS-CoV-2. In this regard, the chimeric viruses that were studied (i.e., the WIV-1 virus with the various spike proteins obtained from bat viruses found in nature) were so far distant from an evolutionary standpoint from SARS-CoV-2 (Figure 1) that they could not have possibly been the source of SARS-CoV-2 or the COVID-19 pandemic. The body of the scientific data from this award including the bat coronavirus sequences published in the scientific literature and public databases makes this conclusion readily apparent to anyone with experience in and knowledge of virus phylogeny and evolutionary biology.”
NIH statement on its funded WIV research.
This is consistent with both Fauci and Collins testimony.
Source:
https://www.niaid.nih.gov/diseases-conditions/coronavirus-bat-research
And this
“COVID did not need any time at all to develop the ability to spread asymptomatically as an aerosol.”
makes no sense to me.
How do you know how long such development requires when humans interact with host animals?
How do you know it had not developed this ability in animals over a long time?
There are three ways to debunk the GHE/CO2 nonsense.
First, there is “common sense”. People can look at Al Gore, Greta, Michael Mann, and many others, to see a common thread of irrationality. Additional examples are on blogs, where the “believers” can hardly make a comment without throwing out insults and false accusations. The political agendas are easy to spot.
Second, there is the “Data”. This is how Drs. Christy and Spencer combat the nonsense. Temperatures in the past have varied enough that nothing today is “unprecedented”. The most reliable modern temperature record comes from the satellite measurements of the atmosphere. We’re likely in a 50/60-year warming trend, all based on natural variability.
Third, there are the sciences of “radiative physics” and “thermodynamics”. Although these sciences are obscure to over 99% of the population, they can be easily understood with a little effort. The REAL science quickly debunks the CO2 nonsense.
One of the reasons this nonsense has gone on for so long is that Skeptics are divided on which of the three ways to combat it. Too often, ego gets in the way. One group of Skeptics wants ONLY their thinking to be considered. The Warmists/Alarmists, on the other hand, pretty much march in lockstep.
As an operational weather forecaster for 40 years, I never was interested in climate because I always thought forecasting climate was impossible. Forecasting the weather 3 days out was hard enough already. Forecasting months and years into the future – forget it!
However, when I got a gig up in Alaska to forecast the oceanic weather and ice conditions from 2007 to 2015, my interest in climate was started by these dire predictions that the Arctic would experience an ice free summer within a decade. It was around 2007-2008 when I first heard these alarming predictions by the Arctic “climate experts” being blasted out by the news media. Then the politicians (certain ones you all know) hopped on board the global warming bandwagon and demanded immediate action to stop fossil fuel use now, or else a global catastrophe would happen.
I asked the sea ice analyst (my boss) if he thought the ice was going to melt away soon. He told me quietly like he did not want anybody else to hear it, “not in our lifetimes.” The both of us are not atmospheric or climate researchers. But we both thought these predictions for the melting ice were absurd. At summer solstice, there is still about 10,000,000 km^2 of Arctic ice. There is no way that much sea ice will melt away in 3 short months. By the time the autumnal equinox arrives, the Arctic sun drops below the horizon and the temperature drops like a rock. On top of that, the average Arctic temperature (80N-90N) in the summer is only 1.0C. It will take much more than that to bring an ice-free summer.
I think what got the ball rolling for these alarmist predictions was that the Beaufort Sea had become ice free in late summer 2007. The global warming zealots had a field day with that. They tried to make that event mean that industrial CO2 emissions caused that to happen. But the ice analyst and me knew that it was storms and ocean currents that shoved the ice out of the Beaufort Sea into the Arctic Ocean.
I think the tide is beginning to turn. Common ordinary people no longer have “climate change” at the top of their list of concerns.
This is an interesting comment in the light of the fact that Arctic sea ice extends are currently near record lows.
Here is a simple question for you:
What is the probability that a new record low Arctic sea ice extent will occur some time between now and the end of the year?
If you believe the “tide is turning” then you must have in your mind a relatively low probabilty number – say, only 1%.
In which case you should be happy to offer to pay me about $100 it it occurs or else take my $1 if it doesn’t.
Maybe 1% is a bit too low for you. Lets make it 10% in which case you should be happy to offer to pay me about $10 it it occurs or else take my $1 if it doesn’t.
Still not sure? Why not simply make it 50%. I pay you $1 if it doesn’t occur and you pay me $1 otherwise.
Just tell me what number you would be happy to put your money on.
rob…good comment, I agree with you. I might add to your comment if you don’t mind.
The Arctic Ocean is a dynamic ocean in every sense of the word. It has two main currents of water flowing, the Beaufort Gyre and the Transpolar Drift. Of course, there are also typical atmospheric wind currents.
It’s not unusual that the Beaufort Sea would be ice free considering the above. Captain Henry Larson was captain on the RCMP cutter St. Roch, the first boat to successfully sail through the NW Passage both ways. The voyage reveals the dynamic properties of the Arctic Ocean and how variable its ice pack can be.
https://en.wikipedia.org/wiki/Henry_Larsen_(explorer)
On the first leg of the journey from Vancouver to Halifax, the St. Rock was hemmed in my sea ice on the northern shore of Canada. It took two years to complete the journey. On the return leg, the St. Rock sailed straight through, unimpeded by ice, in 86 days.
Larsen explained that the ice is always moving, making the journey unpredictable. It moves because it is always being broken up into section, driven by the Gyre and the Transpolar Drift. I personally think that makes it impossible to determine sea ice extent from satellites. When the ice drifts, one slab gets driven onto another, producing ridges that are up to 40 feet high. There are thousands, if not millions of such ridges, which surely belies the telemetry on sats.
In other words, the ice is constantly compacting and expanding.
In addition to what you and your boss claim, as long as the Earth maintains its current orbit and axial tilt, there is no way that any amount of anthropogenic warming will affect Arctic sea ice. There is no way that a 1C average warming will do anything, not even a 5C warming.
Rob Mitchell
“On top of that, the average Arctic temperature (80N-90N) in the summer is only 1.0C. It will take much more than that to bring an ice-free summer.”
No. There is a reason why high Arctic surface temperatures stay close to 0C even in Summer.
For thermodynamic reasons heat entering the high Arctic as warm air or insolation melts ice rather than warming the air. Turning ice at 0C to water at 0C absorbs a lot of heat without changing the temperature.
Sustained warmer temperatures can only occur once the ice is all gone.
You can demonstrate this in your kitchen. Fill a glass wit ice. Add cold water and a thermometer. The temperature in the glass stays close to 0C until all the ice has melted.
In 1979 the minimum ice extent in September was 7 million square kilometres.
In 2012 it was 3.5 million, reduced by half in 34 years.
2012 was exceptional. However 2024 was around 4.5 million, so the trend is definately downward.
The back of my envelope suggests that the shrinkage rate is about 0.5 million/decade and we’ll see our first ice free ocean (1 million) somewhere between 2037 and 2085.
I don’t know your age, but if you are retired like myself, neither of us will probably see an ice free Arctic.
Proxy data says maximum sea ice extent occurred ~1400, about a hundred years after the start of LIA.
Why would you be concerned that the annual minimum sea ice extent is retreating this year when its been generally in retreat since ~1400?
What would be the cause for alarm if all the sea ice were gone? The geological data says its happened before and everything survived just fine.
I would suggest that robust increase in annual minimum sea ice extent would mean a return to LIA conditions. Cooling would be a cause for alarm as last time Europe lost half its population and China had a dynasty change.
Humans flourish when its warm; not when its cold.
> Proxy data says maximum sea ice extent occurred ~1400,
With higher Sea Surface Temperature anomalies, no less:
https://www.researchgate.net/figure/Proxy-records-of-climate-change-over-the-last-millennium-a-changes-in-Arctic-sea-ice_fig1_281674965
@studentb
I meant “the tide is turning” on the concerns about climate change from common ordinary people. The general public used to be much more concerned about climate change than today. When they see Greta or AOC squawk about the world ending soon because of our fossil fuel use, the public just rolls their eyes.
The NSIDC record Arctic sea ice extent low of 3,387,000 km^2 occurred in Sep 2012. For 12 years in a row the Sep ice extent min has closed higher. How many years in a row will it take before you global warming zealots realize the Arctic ice is not melting away to oblivion?
> The general public used to be much more concerned about climate change than today.
Said with a confidence that is inversely proportional to the evidence provided:
https://www.cleanenergywire.org/factsheets/global-surveys-show-peoples-growing-concern-about-climate-change
Perhaps Rob is only referring to Americans.
Even then, more than 70% of them believe that climate change will harm future generations:
https://climatecommunication.yale.edu/wp-content/uploads/2024/01/climate-change-american-mind-beliefs-attitudes-fall-2023.pdf
The same minority we see here is running or applauding Donald’s clown show.
“Why would you be concerned that the annual minimum sea ice extent is retreating this year when its been generally in retreat since ~1400?”
The concern is the high rate of retreat, since late 1990s.
The general natural trend is one of very slow cooling since the Holocene Optimum, which should be increasing sea ice..
tim s …”I have criticized Gordon, Clint, and others on occasion, but I try to be professional and not use overt insults. I am sure they do not like it….”
***
For what it’s worth, I have no issues with criticism. Having said that, I have considered any criticism from you to be rather weak. My interest is more in basic physics and how closely climate science follows it. Thus far, I have found any similarities to be few and far between.
A basic tenet of thermodynamics is the 2nd law as proposed by Clausius. He was very precise with his definition and there has been no new science in the interim to overrule his original definition, even though many arrogant scientists have tried to re-state it.
He stated in words that heat can never be transferred, by it’s own means, from cold to hot. Modern scientists tend to interpret the 2nd law using the concept of entropy, which only muddies the meaning. Entropy tends to be a concept that befuddles people even though Clausius stated it simply as the sum of infinitesimal heat transfers at a temperature, T. The meaning is clear, entropy is the heat used up in a process and not available for doing work.
It is clear because entropy has a value only in an irreversible processes in one direction only, hot to cold.. That means any heat transferred from a body disappears and is no longer available. In a reversible process, entropy always equals zero.
The 2nd law is a law, as defined by Clausius, that can be applied generally to all energy. It is really a general observation in physics that energy can only move from an energy of higher potential to one of lower potentials BY THERE OWN MEANS. That applies to water running downhill, a boulder falling from a cliff, electrons moving from a higher to lower potential, and heat moving only from hot to cold.
The 2nd law disqualifies the AGW, which allows heat to flow from a colder region to a hotter region simply by incorrectly redefining the 2nd law. It has been redefined as a NET flow of energy, where energy includes electromagnetic energy and thermal energy. A net flow requires a summation of energies, and energies of different forms cannot be summed.
As G&T pointed out, the 2nd law is a law about heat, therefore a net flow must only be about heat. Ergo, EM cannot be included since it is not heat. The 2nd law claims that heat cannot flow from a colder atmosphere to a warmer surface, there is no net flow, only a possible one way flow, cold to hot, which is zero.
I have never seen you tackle this issues even though you claim to have expertise in this science. If you are going to objectively criticize me, then do it based on the science.
tim s…”This is a new virus, not something that has been in nature for a long time. The Chinese have not been able to find or manufacture a bat virus in nature that is a precise copy of SARS-C0V-2″.
***
Talking about a cause of covid is ingenuous since no virus has been PHYSICALLY isolated. There is all sorts of arm waving and faked images of viruses, but no proof. It is not enough to post an image of a virus and claim it is the virus in question, and quite another to accompany the graphic with the method used to get it.
Back to science. This is about your statement above re a new virus, which has never been proved. First, we need to talk about why no virus has been physically isolated and that goes back to the HIV controversy. Both HIV and covid are related based on the method used to allege them.
Every virus claimed since HIV has been based on an inferred method proposed by Luc Montagnier, the scientist credited with finding HIV. Prior to HIV, there was a gold standard put forward by the Louis Pasteur Institute, of which Montagnier worked as a scientist. In fact, one of Montagnier’s team, Dr. Barre-Sinoussi, sat on the LPI panel that created the gold standard. She subsequently ignored the method she helped create.
The team used the LPI method which required that a suspected virus be centrifuged in a sugar solution with a density gradient. If viral material was present, it should flow to a specified density in the sugar solution. If there, the material is removed and prepared into a slide of about 90 nm thickness, suitable for viewing on an electron microscope. If a virus is there, it must appear as particles of similar size and dimensions.
Here’s the problem as explained by Montagnier. When the team prepared the specimen and viewed it on an EM …………..***THEY SAW NO VIRUS!!!***.
Why did they continue the search??? Peter Duesberg, an eminently qualified researcherwho discovered the first cancer gene, had already pointed out that HIV could not cause AIDS and that the real cause was lifestyle. Montagnier eventually agreed with him.
Montagnier had specialized in the new field of retrovirology, a field not fully accepted in the day. Retrovirology was not invented till 1970 and a pioneer in the field warned against RNA being used to identify a virus. He gave the warning because RNA is also a common component of many bodily functions.Montagnier’s inference re HIV was based on RNA taken from a person with AIDS. He presumed the RNA was from a virus but he never proved it.
More on that in a minute.
Montagnier has freely admitted that he did not discover HIV, he inferred it based on RNA theory. Furthermore, he went on to claim that HIV will not harm a healthy immune system and that AIDS is caused by oxidative stress related to lifestyle.
All viruses ID’d since HIV have used Montagnier’s inferential method (SARS, including covid, bird flu, and swine flue). None of them have seen a virus on an EM even though the Net abounds with fake inferred images of viruses. Because HIV could not be seen directly on an EM, rocket scientists like Fauci and David Ho came up with the idea of trying to amplify it. For those hung up on the notion that HIV and SARS have been physically isolated, why is the identification an indirect method based on converting RNA to DNA and measuring the number of iterations involved in producing the DNA.
Fauci and Ho used the PCR method for DNA amplification. The inventor of PCR, Dr. Kary Mullis was adamant that PCR could not be used to find a virus that could not be seen on an EM. His reasoning was sound, if the virus was not visible on an EM, amplifying it would not reveal a virus since PCR amplifies everything equally. PCT does not act like a visual microscope, it is a very indirect method based on inferences about RNA.
There is not a shred of proof that the RNA used as the basis of HIV and covid tests comes from a virus. There is a far greater likelihood that the RNA comes from a condition in the body related to disease. The original ID of covid by Wuhan scientists is based entirely on inference with no physical proof that a virus is there. The scientist credited with inventing the covid RNA/PCR test, Drosten, is on record as admitting he isolated no virus, only that he went on the reports by the Wuhan scientists.
Since the modern covid test is based on RNA claimed to be from a spike protein in a virus, the test is not testing for a virus. The same can be claimed for the vaccine, which is based on a modified form of the same RNA (mRNA). In fact, they could not extract RNA from the spike protein because they can barely see it on an EM at about 100 nm. There are no tools to extract the RNA so we must take their word for it that the RNA extracted is from the spike on a virus.
Modern virology is getting away with sheer speculation. However, they are adamant that the vaccines and tests are legitimate, based on this speculation.
Where’s the proof to back my claims? For one, we were told that HIV would spread to the heterosexual community. Never happened. We were told HIV was a highly contagious virus but the scientist who inferred it claimed it does not even cause AIDS. He claimed that a healthy immune system will handle it and that the real cause of AIDS is oxidative stress related to lifestyle.
Same with covid, after all the hysteria and hype it was written off as endemic and disappeared. There is no doubt that something serious happened but it barely affected more people globally than a serious strain of flu. In Canada, it affected less than 1/10th of 1% of the population of 40 million(34,205 deaths)(0.085% of 40,000,000 people).
Most deaths by far involved people over 80 (19,729 deaths). Nearly 58%.
The truth is that only people with depleted immune systems, most with at least one other serious health issues.
“Talking about a cause of covid is ingenuous since no virus has been PHYSICALLY isolated.”
This is your first comment and it is, as usual, completely and utterly wrong. Abysmally wrong.
You read that somewhere and your brain can’t let go of it even after many studies linked for you that demonstrate it has been isolated and sent to other research groups. Multiple research teams around the world have isolated it. The isolated virus was sold or given freely to research institutes.
I’m going to cite 5 papers from different teams that isolated the virus and see what your brain does with the information.
“The etiologic agent of the outbreak of pneumonia in Wuhan China was identified as severe acute respiratory syndrome associated coronavirus 2 (SARS-CoV-2) in January, 2020. The first US patient was diagnosed by the State of Washington and the US Centers for Disease Control and Prevention on January 20, 2020. We isolated virus from nasopharyngeal and oropharyngeal specimens, and characterized the viral sequence, replication properties, and cell culture tropism. We found that the virus replicates to high titer in Vero-CCL81 cells and Vero E6 cells in the absence of trypsin. We also deposited the virus into two virus repositories, making it broadly available to the public health and research communities. We hope that open access to this important reagent will expedite development of medical countermeasures.”
https://www.biorxiv.org/content/10.1101/2020.03.02.972935v2 [US team]
“Isolation and Full-Length Genome Characterization of SARS-CoV-2 from COVID-19 Cases in Northern Italy”
https://journals.asm.org/doi/10.1128/jvi.00543-20 [Italian team]
“In this study, we describe the isolation of SARS-CoV-2 from the first two patients diagnosed with the novel coronavirus disease (COVID-19) in Brazil. We describe its genomic sequence (SARS-CoV-2/SP02/human/2020/BRA) and in vitro replication characteristics. Virus stocks (infectious particles and lysates) were set available and distributed to the research community.”
https://www.scielo.br/j/mioc/a/3hzYZ4W4m4bHGTNX8fJS65p/ [Brazilian team]
“We used isolates from the first passage of an OP and an NP specimen for whole-genome sequencing. The genomes from the NP specimen (GenBank accession MT020880) and OP specimen (GenBank accession no. MT020881) showed 100% identity with each other. The isolates also showed 100% identity with the corresponding clinical specimen (GenBank accession no. MN985325).”
https://wwwnc.cdc.gov/eid/article/26/6/20-0516_article [US team]
“Isolation and Characterization of SARS-CoV-2 from the First Reported Patients in Japan”
https://www.jstage.jst.go.jp/article/yoken/73/4/73_JJID.2020.137/_pdf [Japanese team]
I can go on and on and on citing papers from all over the world where researchers isolate the SARS CoV2 virus and then test it and often make it available to other research teams.
So what happens in your brain when you get multiple sources corroborating the opposite of what you believe? Do you write them all off as frauds? Do you imagine they don’t know what they are talking about? Do you invent a new definition of “isolating” and announce that no team has done x, y or z?
Or do you admit that you are wrong? Could you ever do that?
Tim S,
Watch this chat. Watch what Gordon does in the face of overwhelming evidence. It will teach you something about the general interaction here.
Barry,
You’re a fountain of knowledge. I remember you are one who argued very adamantly that the 2020 election was fair and that Biden received 81 million votes. Where did those 15 million Biden votes go in 2024?
As always, the 6.9 L pickup driver, great fan of the dumb ‘2000 mules’ manipulation, is a fountain of misrepresentation and misinformation.
1. All attempts from the Trumping Boy and his campaign team to question election results in numerous judicial proceedings failed 100 %: the Trumping Boy definitely lost the 2020 election
2. Without the absolutely relevant ‘help’ of
– an absolutely miserable television appearance from former President Biden;
– the false selection of Vice Harris as replacement candidate who not only seemed unsuitable for many but also … was a woman, OMG;
– the incredibly undemocratic decision of the Supreme Court, which silently but unmistakably supported Trump by redefining presidential immunity in an unprecedented way, as a kind of Lex Trump, and thus prevented his legal persecution;
the Trumping Boy would never have won the last presidential election.
“Where did those 15 million Biden votes go in 2024?”
Yeah, it’s crazy, isn’t it? Somehow Biden stole 15 million votes while Trump was in power, and yet couldn’t rig an election when he was president.
Oh, OK, so now you’re doubling down that all those extra 15 million votes were legit in 2020 but in 2012, 2016, and 2024 the Democrats were flatlined at 66 million votes. Is that your assertion?
It’s not just ‘my assertion’, stephen, plenty of Repubs in Trump’s circle, Republican governors and Sec State of the states he pointed at, his AG Bill Barr, his federally appointed watchdogs all agreed the election was fair.
So don’t make this a personal issue, nor a partisan one. There is Donald Trump on the phone pressuring the Georgian Sec State to find him votes out of thin air, 60+ lawsuits that couldn’t prove the widescale fraud that wasn’t there, multiple recounts in many states, even by politically biased auditors (Cyberninjas), the fake code My Pillow guy offered $5 million to prove was fake and was done by a Republican Trump voter and plenty of other busted claims and hole-filled evidence.
But that wasn’t my point. My point was if the Dems could rig the election while Trump was in power, why couldn’t they do it when Biden was president?
Because the stolen election narrative was generated entirely by one Donald Trump, which was vigorously taken up without skepticism by his ardent followers.
By the way, the Dems lost 6 million votes between 2020 and 2024, comparable to Carter’s loss his second go-round. Which cracked up source are you getting your numbers from? Some double-counting witchcraft there.
“so now youre doubling down that all those extra 15 million votes were legit in 2020”
Sure Stephen, the DEMS arranged for Biden to get 12 Million votes more than any previous Democrat…but also enabled Trump to get 11 Million more votes than any previous Republican.
I suppose you think only those extra R votes were legit?
Bin Wigly – the climate expert
https://youtu.be/LU5Aces15Fc?t=2874
Real coffee with Scott Adams, the dachshund’s absolute authority figure…
Merci beaucoup de m’avoir bien fait rire, mon petit teckel hypernerveux!
binny bundtcake doesn’t like anything that smacks of truth. He relies on GHCN, failing to grasp that it is a “Historical” network full of fudged data from the past.
Ironically, NOAA, the owner, sells it as a justification for slashing global surface stations from 6000 to less than 1500. They claim that, although the record of real stations has shrunk, the number of stations in GHCN has increased.
Actually, that’s a lie. GHCN’s number of stations has shrunk by 90% since 1990. Binny is still using old data from it and passing it off as current.
of course, Scott is no climate expert, what he is a brilliant bullzshit detector.
https://youtu.be/REteSlY63do
Really?? Is a cartoonist the best you can find to tell us the scientists are doing it wrong?
barry…frothing at the mouth…”Watch this chat. Watch what Gordon does in the face of overwhelming evidence. It will teach you something about the general interaction here”.
***
Barry posts several articles from authority figures without the slightest understanding of what they are talking about. Not one of the papers mentions ***PHYSICALLY*** isolating a virus, they are all referencing genomes sequences without revealing how they got the genome sequence.
The genome sequences are created on a computer model from ***THEORETICAL*** constructs related to RNA. Not one of those papers has indicated they used an electron microscope to SEE a virus. The genomes are created by guessing.
The source of those genome sequences are the inferences produced by Luc Montagnier after he failed to see HIV on an EM. Montagnier admitted freely that the sequences are inferences. He and his lab assistant, who does his EM work, admitted, at no time did they see HIV on an EM.
This practice of passing off genome sequences as a virus is fraud. If they got the genome sequences from an actual virus, isolated physically using an EM, that would be one thing. However, the genome sequences in question are fabrications on a computer attained by splicing theorized RNA strands together to get a complete fabricated genome.
At one point, Montagnier revealed the hoax by pointing out that one covid genome contained the entire HIV genome “INFERRED” by Montagnier. All these rocket scientists are doing is taking inferred RNA sequences and applying them wherever they think they fit. In other words, genome sequences created on a computer model are fraudulent.
Proof??
1)The Wuhan team admitted they had not physically isolated covid, they had simply applied the aforementioned fraudulent genome sequencing, created theoretically on a computer model and not retrieved from an actual virus.
2)Christian Drosten, who is credited with the first covid RNA_PCR test, admitted he did not isolate a virus. All he did was read the Wuhan report and take the word of the Wuhan scientists that they had created a genome, albeit fraudulently.
3)from the Italian paper…”Swab contents were seeded on Vero E6 cells and monitored for cytopathic effect and by an RT-PCR protocol using primers for the N region (5). Cell culture supernatants from passage 1 (P1) of four isolates were collected, and RNA was extracted with QIAamp viral RNA minikit (Qiagen) and quantified with an in vitro-transcribed RNA standard (S. Rajasekharan and A. Marcello, unpublished data). The quantity and quality of the RNA were assessed using Qubit 2.0 fluorometer…”
Not a word about an EM or images from the EM. That’s because they did not use one.
4)from the US team…”We isolated virus from nasopharyngeal and oropharyngeal specimens, and characterized the viral sequence, replication properties, and cell culture tropism”.
This is an outright lie, they isoated nothing, all they did was go one the word of authority figures that a sequence for covid had been determined from a real physical virus.
5)from the Brazilian study…they claim to have used an EM, but first…”The detection of viral RNA was carried out using the AgPath-ID One-Step RT-PCR Kit…”.
According to Dr. Kary Mullis, who invented the PCR test this method is fraudulent, simply because PCR cannot be used diagnostically to amplify a virus that cannot be seen on an EM.
The Brazilian team go on to contradict themselves by viewing something on an EM that looks like a pimple. They offer no proof this is a virus nor do they show a group of them as required.
And where are the spikes that are claimed to surround a virus, the mechanism with which they allegedly attach to a human cell? Even with a cross-section, the spikes should e apparent. After all, the vaccine is based on sequences claimed to be from the spikes.
Sorry, more fraud. They obviously used the EM as an after-thought when they were already convinced they had isolated a virus using RNA_PCR.
6)Japanese study…”The Tokyo Metropolitan Institute of Public Health (TMIPH) has initiated testing of individuals and close contacts suspected of harboring the SARS-CoV-2 by using nucleic-acid based methods including real-time RT-PCR (qRT-PCR) (4) as described in the manual distributed by the National Institute of Infectious Diseases (NIID) (5)”.
Once again, more fraud, using a method that does not even identify a virus but infers one indirectly.
Re their EM assertions, “Our results revealed a virion size of about 100 nm (Fig. 3), andconfirmed the characteristic envelope structure of coronaviruses as reported by NIID (8)”.
Note the word virion in lieu of the word virus. A virion is related to a virus but it is inert and cannot be claimed as a virus. In other words, they are passing of a virally-related particle as an actual virus.
Note: The first claimed isolation of the SARS virus was rejected after the paper was submitted. The auditors claimed the so-called virus identified could have been any viral particle and not a virus per se.
This is a cheap trick used by researchers. They see ‘something’ on an EM and want desperately to use it as proof but they cannot claim it as an actual virus. At least the Japanese called it a virus whereas the Brazilians passed it off as an actual virus.
Barry if you are serious about this, you will read the work of Dr. Stefan Lanka on the subject. He exposes the fraud surrounding modern virology and he does it using damning proof.
Lanka has essentially proved that the research done to claim a measles virus is fraudulent.
correction…”At least the Japanese called it a virus whereas the Brazilians passed it off as an actual virus”.
should read…
At least the Japanese called it a virion whereas the Brazilians passed it off as an actual virus.
The message is clear, neither team has any idea what they are looking at.
Yep, you redefine what “isolated” means and airily decide that medical researchers either have no idea what they are looking at or they are committing fraud.
I can produce dozens more papers like this from teams of medical researchers all over the world, and you will just do the same song and dance.
You, with no medical degree or experience.
“Virus Isolation from the First Patient with SARS-CoV-2 in Korea”
https://synapse.koreamed.org/upload/synapsedata/pdfdata/0063jkms/jkms-35-e84.pdf
“Isolation of infectious SARS-CoV-2 from urine of a COVID-19 patient”
https://www.tandfonline.com/doi/pdf/10.1080/22221751.2020.1760144 [Chinese team]
“First isolation of SARS-CoV-2 from clinical samples in India”
https://journals.lww.com/ijmr/fulltext/2020/51020/First_isolation_of_SARS_CoV_2_from_clinical.22.aspx
“Whole genome sequencing of the viral isolate and phylogenetic analysis indicated the isolate exhibited greater than 99.99% sequence identity with other publicly available SARS-CoV-2 genomes. Within 24 hours of isolation, the first Australian SARS-CoV-2 isolate was shared with local and overseas reference laboratories and major North American and European culture collections.”
https://onlinelibrary.wiley.com/doi/full/10.5694/mja2.50569
Team Australia here sent copies of the isolated virus abroad for study. Not physical isolation?
“The SARS-CoV-2 virus SARS-CoV-2/Finland/1/2020 was isolated in a biosafety level 3 (BSL-3) laboratory in Vero E6 cells from the Day 4 nasopharyngeal swab (NPS) and nasopharyngeal aspirate (NPA) specimens (Table).”
https://www.eurosurveillance.org/content/10.2807/1560-7917.ES.2020.25.11.2000266
Are the Fins frauds? Or do they fail to fully fysically flip the firus?
“Virus isolation and neutralisation of SARS-CoV-2 variants BA.2.86 and EG.5.1”
https://www.thelancet.com/journals/laninf/article/PIIS1473-3099(23)00682-5/fulltext [Europe]
“Isolation of SARS-CoV-2 from the air in a car driven by a COVID patient with mild illness”
https://www.sciencedirect.com/science/article/pii/S1201971221003751 [Team USA]
“Natural SARS-CoV-2 infections, including virus isolation, among serially tested cats and dogs in households with confirmed human COVID-19 cases in Texas, USA”
https://pmc.ncbi.nlm.nih.gov/articles/PMC7743065/ [Team America]
I can go on and on, Gordon, and you will actually tell us that all the medical research teams around the world are either frauds or incompetent. As if you actually know better than the scores of international research groups that have not only isolated the virus from January 2020, but do it routinely.
Because you would rather look like a complete f00l than admit you are wrong.
Of course they physically isolated the virus, Gordon. They grow the isolates in culture and test if they infect. They do. Then they compare the genomic sequence of their isolates with other SARS CoV2 sequences. They match.
That is the definition of isolated viruses – they cab replicate outside the host, in artificial frameworks and be studies without contamination from other biological matter.
But hey – you think electron microscopic pictures would convince. Voila!
Electron microscopy images and morphometric data of SARS-CoV-2 variants in ultrathin plastic sections
“In the present study, four of these five VOCs were examined using the thin plastic section technique3 for transmission electron microscopy: Alpha (B.1.1.7)18, Beta (B.1.351)19, Delta (B.1.617.2)20 and Omicron BA.2 (B.1.1.529)21. In addition to the VOCs, two reference isolates from the beginning of the pandemic, Munich92922,23 and Italy-INMI124,25, were included in the study to allow direct comparison.”
https://www.nature.com/articles/s41597-024-04182-3
“SARS-CoV Germany/Frankfurt and SARS-CoV-2 Italy-INMI1 isolates showed similar ultrastructural characteristics, including a particle size distribution with a median of around 100 nm without spikes. The maximum spike length of both viruses was 23 nm [35].”
https://www.sciencedirect.com/science/article/pii/S1286457923000904
Ultrastructural analysis of SARS-CoV-2 interactions with the host cell via high resolution scanning electron microscopy
“SARS-CoV-2 isolate (HIAE-02: SARS-CoV-2/SP02/human/2020/BRA (GenBank accession number MT126808.1) was used in this work. The virus was grown in Vero cells (Monkey African Green kidney cell line ATCC CCL-81) in the Laboratory of Molecular Virology, at Federal University of Rio de Janeiro, Brazil…
https://www.nature.com/articles/s41598-020-73162-5
And I can go on and on with these. I don’t have to, because EM images of viruses are NOT the gold standard for demonstrating isolation, but even if it was, there are scores of papers on that, too.
Ok, Professor Robertson, what did these scientists get wrong?
ent…”…for thermodynamic reasons heat entering the high Arctic as warm air or insolation melts ice rather than warming the air. Turning ice at 0C to water at 0C absorbs a lot of heat without changing the temperature”.
***
Exactly how does warm air get to the Arctic? The thermohaline system does not reach much farther than a line drawn between Greenland and Scotland. Obviously, heat is not being transported to the Arctic via warmer water from the south.
Air currents in the atmosphere would not fare much better. Seems obvious that heat is generated in the Arctic only during the brief Arctic summer, when adequate solar energy is input.
ken…”I have never seen any assessment of WWI that would support this statement. Sure Canada punched above its weight, but it was still a very small contribution. Vimy Ridge was a success even though it was a minor event in WWI”.
***
It was not the size of the battle that mattered, it was the timing. Vimy Ridge occurred toward the end of the war and the tactic used by the Canadians was a turning point. Up till then, the Allies had been mired in age old tactic in which leaders like Haig tried to solve impasses by throwing men mindlessly into the battle.
That’s what I found so horrific about WW I, the constant and brutal loss of life due to mindless military leaders. Time after time, and battle after battle, they sent men over the top and into the brutal firing lines of well positioned machine guns.
At Vimy, the Canadians had perfected the rolling barrage, wherein the soldiers followed a barrage of shells that advanced in front of them. It was highly successful and that’s why the Canadians took Vimy after many failed attempts using traditional tactics.
Mind you, it was no cakewalk, but the leading barrage got them into the desired position since the defenders had to disappear underground while the barrage was on. Reports from defenders claim it was horrific facing the barrage.
With regard to the state of our current youth, it’s hard to assess. Things were much the same pre WWI and WWII, but young people volunteered en masse and got into shape due to the training. The point is, they all wanted to help.
I have not mingled much with young people locally but while working on Tar Sands projects, I encountered young people from across Canada. I have little doubt they’d perform if required.
barry…”Ye Gods, Ive been reading about unappointed, unelected Musk and his Department of Government Efficiency (DOGE)”.
***
This is Trump’s honeymoon period where he is enacting legislation using executive orders. He will likely crash to Earth once Congress gets going and Republican congress people find their seats threatened.
Already, two Republicans congressmen from Kentucky have complained about the tariffs. Canada has countered with tariffs against their whisky and it is obviously hurting them.
This is Trump’s MO, to raise Cain mindlessly and let the chips fall where they may. He has praised Kim Jong Un of North Korea as an alright guy, a seriously questionable assessment of a known brutal leader.
I think he has served his purpose of terminating the ridiculous Biden admin who were leading the US down the tubes. If he continues with his current rhetoric, Republican congressmen will become antsy as their two year of remaining vote mandate approaches. It only takes the loss of 3 Congressmen to lose Congress.
I have a reply to your post to me about isolating the virus.
https://www.drroyspencer.com/2025/02/uah-v6-1-global-temperature-update-for-january-2025-0-46-deg-c/#comment-1698237
barry
Robertson once again proves in this virus exchange that he is a both egomanian and megalomanian liar.
When you post 100 or 200 nm pictures showing viruses by use of transmission electron microscopy but lacking the scale bar, he replies with ‘No scale bar, thus not verifiable’.
If you post pictures with scalde bar, he replies ‘No electron microscope known to me has a resolution of 200 let alone 100 nm; this, the picture is 100% faked’.
And if the picture if from the German RKI (Robert Koch Institute), he will reply ‘Lanka knows that all RKI pictures are 100% faked’.
More stubborn, barazen and stupid you die.
*
Here is SARS-COV-2:
https://i.postimg.cc/vmV639zg/Screenshot-RKI-SARS-Co-V-2-Italy-INMI1-100-nm.png
https://www.rki.de/DE/Themen/Forschung-und-Forschungsdaten/Nationale-Referenzzentren-und-Konsiliarlabore/EM-Erregerdiagnostik/Aufnahmen/EM_Tab_covid.html
*
Here is measles:
https://i.postimg.cc/3wj0sGyk/Screenshot-Masernvirus-Paramyxoviren-Transmissions-Elektronenmikroskopie-200-nm.png
https://www.rki.de/SharedDocs/Bilder/InfAZ/Masern/EM_10_53483_b_Masernvirus.jpg?__blob=poster&v=4
*
Liars a la Robertson perfectly know why they post here: anywhere else they would be banned within one hour.
Heil dictator freedom of speech!
To make things clear, I should add that Lanka, one of Robertson’s major authority figures, is himself a brazen liar – exactly as is Robertson when he writes:
” Lanka has essentially proved that the research done to claim a measles virus is fraudulent. ”
*
Never did Lanka ever prove that. On the contrary: he proved himself a fraudulent person, by brazenly claiming in the context of his denial of the measle’s existence:
” Pharma-Lüge aufgeflogen – BGH-Urteil bestätigt: Masern-Viren existieren nicht ”
https://www.anonymousnews.ru/2017/01/20/pharma-luege-aufgeflogen-bgh-urteil-bestaetigt-masern-viren-existieren-nicht/?fbclid=IwAR2YAxMQeVy50jPnk0Ukf0xuNZIxIsXniY_DWafAGfOqt0kf1OisFccVn_Q
*
Translation
” Pharmaceutical lie exposed Supreme Court ruling confirms: Measles viruses do not exist ”
Sentence’s text:
https://web.archive.org/web/20200511152301/https://impfen-nein-danke.de/u/BGH+I_ZR__62-16.pdf
” The plaintiff’s appeal against the non-admission of the appeal in the judgment of the Higher Regional Court of Stuttgart – 12th Civil Senate – of February 16, 2016 is rejected because
– the legal matter has no fundamental significance,
– the complaints based on the violation of fundamental procedural rights are not valid
and
– the development of the law or the securing of uniform case law do not otherwise require a decision by the appeal court (Section 543, Paragraph 2, Sentence 1 of the Code of Civil Procedure).
No further justification is required in accordance with Section 544, Paragraph 4, Sentence 2, Clause 2 of the Code of Civil Procedure. The plaintiff shall bear the costs of the appeal proceedings (Section 97, Paragraph 1 of the Code of Civil Procedure).
Value in dispute: €100,000 ”
*
As anyone having the least bit of knowledge can see, Germany’s Supreme Court did not decide in the matter at all but simply rejected a request by Lanka’s unlucky contradictor for admission of an appeal to a Higher Court’s decision.
Lanka and Robertson: two persons ready to any lie.
Bindidon
There is a deeper layer going on with Gordon and Lanka. Both are into alternative medicine. It is a huge money making industry and it needs its salesmen to convince others to get into it. Hence the denial of established science on viruses (that has been quite successful in greatly reducing illness in the first world Nations were vaccinations are available. Gordon admits to taking so much Vitamin C he gets the runs. I think Vitamin C has some ability to fight illness and I take some. Gordon is probably totally into alternative medicine. Most blogs that sell alternative medicine also go deep into unproven Conspiracy Theories. The idea is if someone is gullible enough to believe unproven ideas with no evidence, they will be prime targets to sell alternative medicine to.
https://www.nccih.nih.gov/research/research-results/americans-spend-30-billion-a-year-outofpocket-on-complementary-health-approaches#:~:text=Americans%20Spend%20%2430%20Billion%20a,on%20Complementary%20Health%20Approaches%20%7C%20NCCIH
“If you post pictures with scalde bar, he replies ‘No electron microscope known to me has a resolution of 200 let alone 100 nm’ ”
100nm is typical of the SARS CoV2 virus size mentioned in the above papers, so apparently these research groups are all frauds.
So let’s find out if the people who use and make these things can help us.
“In practice, the actual resolution of an SEM can range from 1 to 20 nm…
While magnification and resolution are distinct concepts, they are closely related in SEM. Increasing magnification often leads to the perception of higher resolution, as finer details become more apparent. However, its important to note that magnification alone does not guarantee improved resolution. As a general rule of thumb, the minimum feature size you can measure with a reasonable margin of error is ~10 times the resolution, so at 10 nm resolution you can measure 100 nm particles.”
https://www.nanoscience.com/blogs/understanding-the-difference-between-magnification-and-resolution-in-scanning-electron-microscopy/
And
“The word resolution simply refers to the smallest observable feature in an image. For the human eye, that is about 0.2 mm. SEM resolution is typically between 0.5 and 4 nanometers…
While SEMs cannot provide atomic resolution, typical floor model SEMs can achieve resolutions of the order of 1 to 20 nanometers some SEMs are even capable of sub-nanometer resolutions.”
https://www.thermofisher.com/us/en/home/materials-science/learning-center/applications/sem-resolution.html
The latter source has an interesting mention of viruses.
“Thanks to this nanometer-scale scanning electron microscope resolution, SEMs have opened a whole new world to researchers. A virus, for example, is between 60 and 140 nanometers. A DNA strand has a radius of one nanometer. A glucose molecule is about 0.9 nanometers in size. You can resolve all of these with an SEM.”
Gordon announces that in order to prove a virus has been isolated it needs to be visible under an electron microscope. If they are smaller than the resolution he believes is possible with an EM, he is relying on a mistaken belief to set an impossible task.
In a few days, the polar vortex in the lower stratosphere will split into two vortices, one over eastern Canada and the other over Siberia, according to the distribution of the geomagnetic field in the north. The geomagnetic center over Canada will weaken and strengthen over Siberia.
https://i.ibb.co/wrb4CHjv/gfs-z100-nh-f120.png
https://i.ibb.co/kgDWYRbb/MF-n-f.png
Welcome to the Gordon Robertson blog where you can read endless reams of meaningless drivel replete with endless reams of equally meaningless responses.
Here is some more science on the Avian Flu problem. It demonstrates the dangers of natural spillover, and it also provides a contrast to COVID-19. The very first strain of SARS-CoV-2 virus was exceptional at asymptomatic spread. People typically were infectious for 3 days and spreading virus without symptoms as an aerosol with a very high death rate. The 6 foot distancing was never effective or necessary. It was lingering in the air. It did not require any time at all for successive mutations to develop its ability to directly and effectively infect humans. Was it a natural miracle?
This H5N1 bird virus is taking the normal slow path to become effective at spillover. How many wild birds, domestic birds, and cattle are there? How many mutations does that represent?
Here is the story:
https://www.sciencenews.org/article/bird-avian-flu-virus-infect-dairy-cows?
What [experts] are concerned about is that it could indicate another independent spillover event into dairy cows, says veterinarian and environmental epidemiologist Meghan Davis of the Johns Hopkins Bloomberg School of Public Health. The risk of H5N1 still remains low for most people, she notes.
Save the Ostrich. What happens when avian flu fears goes bonkers.
https://bcrising.ca/save-our-ostriches/
“The 6 foot distancing was never effective or necessary.”
https://journals.plos.org/plosone/article?id=10.1371%2Fjournal.pone.0252963&utm
https://www.bmj.com/content/bmj/375/bmj-2021-068302.full.pdf
Your studies are mostly about social isolation. One did not even mention physical distancing and the other said this:
[These three studies were rated at moderate risk of bias 40 61 to
serious or critical risk of bias 47]
Here it is in full:
[physical distancing and transmission of SARS-CoV-2
and covid-19 mortality
Studies that assessed physical distancing but were not
included in the meta-analysis because of substantial
differences in outcomes assessed, generally reported
a positive effect of physical distancing (table 2). A
natural experiment from the US reported a 12%
decrease in SARS-CoV-2 transmission (relative risk
0.88, 95% confidence interval 0.86 to 0.89),40 and
a quasi-experimental study from Iran reported a
reduction in covid-19 related mortality (β −0.07,
95% confidence interval −0.05 to −0.10; P<0.001). 47
Another comparative study in Kenya also reported a
reduction in transmission of SARS-CoV-2 after physical
distancing was implemented, reporting 62% reduction
in overall physical contacts (reproductive number
pre-intervention was 2.64 and post-intervention was
0.60 (interquartile range 0.50 to 0.68)).61 These three
studies were rated at moderate risk of bias 40 61 to
serious or critical risk of bias 47 (fig 2)]
Science Fact: SARS-CoV-2 can survive and remain viable in mucus droplets that are so small they remain airborne due to Brownian motion — aerosols.
Nonpharmaceutical Measures for Pandemic Influenza in Nonhealthcare Settings Personal Protective and Environmental Measures
https://pmc.ncbi.nlm.nih.gov/articles/PMC7181938/
This paper makes no mention at all of distancing but it does consider Respiratory Etiquette (coughing into your sleeve etc) as follows:
quote There is no evidence about the quantitative effectiveness of respiratory etiquette against influenza virus. unquote
2 meter distance to prevent the spread of viruses is based on nothing but misguided imagination.
Tim, they both mentioned physical distancing, but I admit the first one it’s too hard to tease out the physical distancing (personal distancing and number of people congregating indoors/outdoors) from other measures.
For the meta-analysis (review paper):
You just cited the three out of 8 studies they did NOT use for the analysis. It even says so in your quote.
Of the 5 they used these were the pooled results:
“Five studies with a total of 2727 people with SARSCoV-2 and 108 933 participants were included in the analysis that examined the effect of physical distancing on the incidence of covid-19.37 53 57 60 63 Overall pooled analysis indicated a 25% reduction in incidence of covid-19 (relative risk 0.75, 95% confidence interval 0.59 to 0.95, I2=87%) (fig 6). Heterogeneity among studies was substantial, and risk of bias ranged from moderate (37 53 57 60) to serious or critical (63) (fig 2).”
Side note – this is how science is done, quantifying the uncertainty and including it in the analysis. Also ‘bias’ refers to methodological bias, not personal or ideological, when studies are non-randomized.
All the studies that reckoned on the success of physical distancing, whether indicating strong methodological bias or not, whether they were included or not, concluded there was a net benefit from physical distancing.
So I offer this against your remark:
“The 6 foot distancing was never effective or necessary.”
The research that we have on it does not corroborate your view.
What informed your opinion?
“2 meter distance to prevent the spread of viruses is based on nothing but misguided imagination.”
Rubbish.
The WHO recommendation is one meter. Even this recommendation is pulled out of nowhere.
Please provide an RCT study that shows transmission of viruses is reduced by 1 meter or 2 meter distancing.
No, Ken, it’s not pulled out of nowhere. There were scores of studies on droplet dispersion and the risks of proximity that came up with various physical distancing numbers early in the pandemic. There were studies in hospitals that assessed the risk in situ with live CoV2 virus present, and there were meta-studies that looked at different policies on physical distancing and the outcomes while the policies were in force, for example.
RTC are scarce if not non-existent, as it would be unethical to deliberately expose unvaccinated people to a known disease.
This:
“2 meter distance to prevent the spread of viruses is based on nothing but misguided imagination.”
Is horsepucky.
If I listed a bunch of studies that informed policy would that make any difference, or would I be wasting my time?
tim…”This H5N1 bird virus is taking the normal slow path to become effective at spillover. How many wild birds, domestic birds, and cattle are there? How many mutations does that represent?”
***
Stefan Lanka, an expert in viruses, who discovered the first virus in the ocean, reveals the truth about the swine and bird flus. Basically, neither have been proved to exist.
The bird flu is nothing more than an extension of a long-standing ailment in birds related to the abysmal conditions in which they are raised. The rocket scientists who have declared a virus are gassing millions of birds because a few were found to have symptoms related to the long-standing issues that affect domestic birds.
Let’s get it straight. We keep baby cows penned up so they can’t move and become anemic just we we humans swine can have veal. Anemia is a serious condition for humans but when animals get sick via such treatment we blame it on a virus. The mind boggles at the thought of our cruelty, intentionally making animals sick while penning them for their miserable life just so we animals can have veal.
Chickens are penned up en masse and other animals are kept in abysmal conditions. They become sick and some rocket scientist, lacking proof, declares a virus as the cause.
That was the official diagnosis of a pellagra outbreak in the southern US states circa 1915. A young official sent to investigate immediately concluded the cause was diet-related. He was ignored while officials looked for a viral cause. They had no proof that pellagra was caused y a virus and they blindly followed that reasoning till the 1940s when the real cause of pellagra was found…a B-vitamin deficiency.
In Africa, where maize is a food staple, similar issues arise that lead to malnutrition. That leads to wasting syndrome and the rocket scientists at the WHO claim it is caused by a sexually-transmitted virus.
This article is available elsewhere if this site does not work.
http://whale.to/b/lanka.html
“Since the late 19th centrury, diseases of poultry in mass animal farming have been observed: Blue colouring of the crest, decrease in egg laying performance, sagging of the feathers, and sometimes these animals die too. These diseases were called bird pest.
In present-day mass poultry farming, in particular when hens are being raised in cages, many animals die each day as a result of species-alien animal farming. Later, these consequences of the mass animal farming were no longer called bird pest, but bird flu. Since decades back, we are experiencing that a transferable virus is being maintained as the cause of this, in order to deflect from the actual causes”
Then…
“I have studied molecular biology.
In the course of my studies I demonstrated the existence of the first virus in the sea, in a sea alga. This proof was first published in a scientific publication in 1990, in accordance with the standard of the natural sciences. The virus whose existence I demonstrated reproduces itself in the alga, can leave it and reproduce itself again in other algae of this kind, without having any negative effects, and this virus stands in no connection whatsoever with any disease.
For instance in one litre of sea water, there are over 100 million viruses of various kinds very different from each other. Fortunately, the health authorities and the doctors have not become aware of this, otherwise there since long would have been a law permitting sea bathing only for persons attired in total body condoms”.
A perfect example is the HIV/AIDS scam. The theory that AIDS is caused by HIV was put forward by the Reagan administration and rushed out without peer review. After that, any researcher who questioned the theory, like Peter Duesberg, had his funding blocked and he was summarily ostracized.
Duesberg was no lightweight. He was the youngest scientist of his era inducted into the National Academy of Science based on his discovery of the first cancer gene. Duesberg put forward elegant explanations of why HIV was not causing AIDS and forwarded equally elegant reasoning of how AIDS was caused by lifestyle. A few years later, Luc Montagnier, credited with discovering HIV, came to agree with him.
Montagnier joked about his admission. He knew that since he had won a Nobel, he could speak the truth without being ostracized.
Meantime, the WHO put out propaganda that HIV would spread to the heterosexual community. Did not happen. To support their propaganda, they went to Africa and picked on poor, starving Africans. AIDS is classified as up to 30 opportunistic infections related to immune deficiency. The WHO included wasting syndrome as one of them and used that as proof that African heterosexuals suffered from AIDS.
Problem is, wasting syndrome was around long before HIV was identified and the cause was already known: malnutrition. contaminated drinking water, and parasitic infections like malaria. However, the scam artists at the WHO were desperate and not about to allow fiction to interfere with their corrupt dogma.
Gordon, your fake science is not humorous in this case. It is an important issue. There is already too much confusion about vaccines and a whole host of other issues.
I do not believe in censorship, but I do think errors — whether made intentionally for humor or not — need to be corrected. Anyone who wants to get good advice on any of this should consult a licensed and board certified medical doctor. I assume most countries have something similar to board certification in this country.
tim…it amazes me that you can get to the level of education you claim and be so naive. I base my naivete claim on your desire to accept any scientific paper as being kosher.
I see no refutation of what I claim. I am not asking for papers, I am asking for objective reasoning. Disprove anything I have said about HIV/AIDS or the relation I have developed between HIV theory and covid.
I take this very seriously. I first began investigating AIDS due to the propaganda being spread by the WHO and the US CD.C that AIDS would spread to the heterosexual community. In the early days, the US counterpart of Montagnier was Robert Gallo, who was censured for stealing data from Montagnier. It became an international incident that was swept under the rug by US officials.
If you want to go on sucking up to authority figures, fill your boots. My interest is objective science and fields like HIV/AIDS are so corrupt they can no longer be categorized as science.
I first began investigating the anthropogenic theory due to the claim that 90% of scientists agreed with it. Such a confidence level flew in the face of probability theory I had studied in engineering. Turn out the claim was based on twp papers that has interviewed about 1000 scientists each. One of the papers was written by an alarmist, Naomi Oreskes, who felt that consensus is a valid for of scientific research. Her claim to fame was berating 3 dead scientists who could not defend themselves.
My doubt were soon confirmed when I encountered articles by Richard Lindzen. He revealed the abject corruption of the IPCC and the theory itself. That was some 20 years ago and further investigation has served to deepen my suspicion that anthropogenic research is corrupt as well.
tim s…”Science Fact: SARS-CoV-2 can survive and remain viable in mucus droplets that are so small they remain airborne due to Brownian motion aerosols”.
***
Tim…care to explain that when a virus is so small it can barely be seen on an electron microscope? If what you say is true, and it has never been proved, any mask fibres would appear as the Grand Canyon to a virus.
Any virus is far too small to be examined on an aerosol. The claim is only inferred, there is no way to observe it for real.
The official N90 masks used in hospitals must be treated with chemicals that act as an attractant to aerosols. Even at that, they are not 100% effective. Straight cloth is useless for such an application.
Can you prove that the covid virus has ever been physically isolated? I mean the actual process where a virus is separated from the host and viewed on an electron microscope?
I am aware that certain micrographs are being trotted out as proof but most are photos of viral particles (virions) with no proof provided that they are in fact a virus.
ken….”Welcome to the Gordon Robertson blog where you can read endless reams of meaningless drivel replete with endless reams of equally meaningless responses”.
***
You sound like a soldier. I would venture that most people who enter the military are reliant on authority figures. Heck, you are unaware of the immense contribution of Canadian infantry in WW I.
Your authority figure is Will Happer. I have no real issues with Will, in fact, I like his style. He called climate change theory a scam and I agree. The only problem I have with Will is that he has subscribed to the anthropogenic theory, which I regard as a scam as well. You seem unable to read Will with any degree of objectivity.
I recall early on in the Moon discussion that you insisted the Moon orbits the Sun, not the Earth. You insisted on that despite the fact the articles you referenced claimed the Moon orbits the Earth.
That means to me that you are incapable of reading scientific articles in depth yet you are slamming me for reading articles in depth and reporting them. Hence, I take your criticism for what it is worth.
BTW, all of my posts are in support of Roy and science in general.
tim s and others…why is there no vaccine against HIV yet a vaccine was created for covid in 3 months? If they have the genome for both, why can’t they produce a vaccine for HIV? They’ve had over 40 years to produce an HIV vaccine but none is available.
How long must this naivete go on? The major drug companies have all been fined billions of dollars for essentially lying about and misrepresenting their products. Yet you lot go on naively defending them. Pfizer was granted immunity from prosecution for the covid vaccine. Why???
The truth about HIV/AIDS is well know to anyone with an objective mind. AIDS is not caused by a virus and the very scientist, Luc Montagnier, credited with discovering HIV, is on record as essentially claiming that. He is on record as claiming that HIV is harmless to a healthy immune system and that AIDS is caused by oxidative tress related to lifestyle.
The difference between Montagnier and Lanka is that Montagnier still believed he had isolated a virus whereas Lanka called a spade a spade and insists that none of the major viruses have been scientifically and physically isolated. Montganier admitted that he did not see HIV on an EM but he felt his ad hoc claim that RNA from a person with AIDS came from the HIV virus. He did not prove that nor has anyone proved a causal relationship between said RNA and any virus, including covid or any of the SARS family of viruses.
When Peter Duesberg claimed the same thing long before Montagnier, he was ostracized and his funding stopped by Anthony Fauci. There was nothing they could do to Montagnier without shooting themselves in the foot. he had already been awarded a Nobel for discovering HIV.
I don’t care what anyone believes, it is simply wrong to ostracize and or censor a scientist for expressing his POV. Yet, people here on Roy’s blog seem to think that’s OK. Roy is essentially ostracized and censored by his peers, hence he can likely understand what it must have been like for a top scientists like Duesberg to be treated the same way.
Gordon Robertson
YOU: “tim s and otherswhy is there no vaccine against HIV yet a vaccine was created for covid in 3 months? If they have the genome for both, why cant they produce a vaccine for HIV? Theyve had over 40 years to produce an HIV vaccine but none is available.”
You do not understand what a vaccine does! HIV attacks the immune system CD4 (T helper cells). A vaccine works by priming the immune system to attack a certain structure entering the body so it has a heads up on fighting off the invader. Smallpox vaccine was just a weakened form of the more deadly one. Vaccines do not stop viruses they just prime the immune system. You can’t prime the immune system to fight something that destroys it!
Here is what is used to treat people infected with HIV.
https://hivinfo.nih.gov/understanding-hiv/fact-sheets/fda-approved-hiv-medicines
They stop the virus from replicating.
Gordon Robertson
Here is an article on Duesberg. Because of his credentials he was responsible for the deaths of 300,000 Africans because the leader believed him. One can offer alternative ideas. His flaw was he rejected evidence supporting HIV caused AIDS.
https://en.wikipedia.org/wiki/Peter_Duesberg
“In a 2010 article on conspiracy theories in science, Ted Goertzel highlights Duesberg’s opposition to the HIV/AIDS connection as an example in which scientific findings are disputed on irrational grounds, relying on rhetoric, appeal to fairness and the right to a dissenting opinion rather than on evidence. Goertzel said that Duesberg, along with many other denialists frequently invoke the meme of a “courageous independent scientist resisting orthodoxy”, invoking the name of persecuted physicist and astronomer Galileo Galilei.[12] Regarding this comparison, Goertzel wrote:
…being a dissenter from orthodoxy is not difficult; the hard part is actually having a better theory. Publishing dissenting theories is important when they are backed by plausible evidence, but this does not mean giving critics ‘equal time’ to dissent from every finding by a mainstream scientist.
Goertzel, 2010[12]”
Once again, it is amazing to see how many people do not understand that Trump is a very simple minded person who is also amazingly effective at using his power to negotiate deals. In the last administration, North Korea Kim was forced to concede that he has no desire or intention to join the civilized world. One train ride to Beijing to meet with his daddy, and the deal was over. They will remain isolated and totally dependent on China.
Now we have Trump taking over Gaza. People are running around with their hair on fire and their minds exploding. Anyone watching the press conference today with the King of Jordon, and paying attention, can now see the strategy. He wants the various leaders of the countries in the region to step up and take over the situation. He actually wants them to solve the problem. Message received!
Oh, by the way, Putin is shaking in his boots and releasing spies (improperly detained prisoners?).
Trump mania has reached epic proportions,how would the self riteous citizens of the west like to live in the Middle East? never knowing when the next atrocity will occur.spending your life looking over your shoulder, all we here is free palastine, which only makes Hamas and others stronger,as with Ukraine the Isreal Arab conflics can all be traced back to WW2. Trump may be right, or maybe not, but the crux is, no one else appears to want to end the revolving door of conflics. there is a paperback titled, Down To A Sunless Sea, its only fiction but every Western leader should read it.
“Oh, by the way, Putin is shaking in his boots”
Absurd take on events, Tim.
If anything Putin is shaking with excitement at the prospect of gobbling up huge swaths of Ukraine, and no NATO membership for what’s left of Ukraine.
All facilitated by the Trump Administration.
As far as the Russian release of the prisoner, Trump indicated it was a trade for something or someone unspecified.
Putin is playing a very weak hand. He released a prisoner and his strongman buddy in Belarus released 3 just so Putin could get a phone call from Trump. He has agreed to talks with Ukraine. That is weakness compared to one month ago.
Putin needs something to claim a victory, otherwise there is no deal. It is not clear what that will be. Fairy tale endings where the evil dictator is defeated do not happen in real life. The war is mostly a stalemate. Neither side is advancing except Ukraine taking Russian territory. That will be huge bargaining chip.
“strongman buddy in Belarus released 3 just so Putin could get a phone call from Trump.”
Where is this information from?
Apparently you think you can read Putin’s mind?
What kind of strong negotiator would give up a key Putin demand, that Ukraine not join Nato, BEFORE the start of negotiations?
By comparison, Biden and a consortium of other countries got a bunch of prisoners released by Russia, including 2 Americans and one resident of the US.
The Biden administration also got Mexico to promise to send nearly 10,000 troops to the border to prevent illegal immigration.
The difference is that Trump knows how to market these achievements, and make it look like only he can get these things done. It all plays to his strong man rhetoric, and people are easily dazzled.
What is less obvious is his failures. Some of his most high-profile executive orders have been held up by the courts, and a couple have been quietly abandoned. Naturally, Trump sees this as a problem with the courts, rather than presidential overreach.
He knows how to be a boss, but he doesn’t have the guts or the chops to be a president. If he did, he would be pushing congress to authorise his notions. Instead he relies on official – and sometimes illegal – decrees because he knows he couldn’t get it done the hard way. He doesn’t like failure, so he won’t risk it.
“never knowing when the next atrocity will occur”
or how would you like to be a Palestinian, having your homeland bombed to smithereens then have the US President tell you to leave and go somewhere, because he wants to acquire your homeland for the US.
Otherwise known as ethnic cleansing.
On the contrary, forcing Palestinians to remain in a land that is constantly bombed is inherently inhumane.
Constantly bombed by the Zionists or the USA?
Israel had the right to take action, as the events of October 7, 2023, demonstrated that peaceful coexistence with Hamas is not feasible.
The bombing of civilian locations would be horrific if there were any genuine civilian areas. Hamas hides within the population. More horrific is this behavior. There is no justification for treating innocent civilian hostages this way. There also is no reference in civilized human behavior to compare with Hamas. People say that Hamas behave like animals, but even the worst animal behavior in not this bad:
https://www.msn.com/en-us/war-and-conflicts/military-organizations/hamas-to-free-3-more-israeli-hostages-for-dozens-of-palestinian-prisoners-under-gaza-ceasefire/ar-AA1yDrYG
Your argument is that every Palestinian is a member of Hamas.
Before the war support for Hamas among Palestinians was 22%. now it stands at 40%.
So says the Times of Israel.
https://www.timesofisrael.com/poll-support-for-hamas-on-the-rise-among-palestinians-now-double-fatahs/
I made no such “argument” or any statement that could be reasonably interpreted that way. Your response barry, says that you are now irrelevant to me. Good Bye!
Argue with people who like that sort of thing.
“The bombing of civilian locations would be horrific if there were any genuine civilian areas.”
This is the comment. Either Gaza is mostly civilian, in which case most of it is civilian area, or Gaza is not civilian, and has no civilian areas.
Once you say there are no civilian areas, you are saying there are no civilians. This has been suggested quite a few times by the Israeli government, to international and domestic condemnation, although they, like you, have also separated Gazan civilians from Hamas, and said they are trying to minimise collateral damage,
If that is the case, they are doing a horrifically bad job.
“On the contrary, forcing Palestinians to remain in a land that is constantly bombed is inherently inhumane.”
Who is doing that?
Red,
“Israel had the right to take action”
Yes. Just as Assad in Syria had a right to take action against enemy fighters there.
He did so by leveling cities, killing 10’s of thousands of civilians. And he was universally condemned as evil, even by the US for this. And he was finally booted from his country.
Yet when Israel adopts the very same approach, leveling cities and killing 10s of thousands of civilians. This is not condemned by the US, on the contrary it is defended.
Nate,
Of course civilian lives matter, but what choice does Israel have when Hamas uses human shields?
What would you suggest Israel do differently?
Have rules of engagement like the rest of the civilized world’s militaries have, and follow them.
The problem is that the current Israeli government has no concern for Palestinian lives. They treat them as vermin.
If violent criminals put themselves in a crowd of civilians, then you suggest the police should just open fire?
Or if bank robbers take hostages, you suggest that the police just blow up the bank?
“Have the rules of engagement like the rest of the civilized worlds militaries have, and follow them.”
It can be argued that Hamas is the state violating the rules of engagement by operating within civilian areas and using the population as human shields while continuing its terrorist agenda.
Hamas deliberately exploits this strategy to undermine Israel’s military responses and manipulate global perception. By framing civilian casualties as evidence of oppressive Israeli aggression, they aim to garner sympathy from Arab states and the broader international community, which helps further their narrative.
And this tactic works, not just for optics, but also to hinder the opponent, as long as the opponent operates with concern for reducing civilian casualties, which the Israeli government has said it strives to achieve, but which it has consistently failed to achieve.
According to the lower estimates, around 50,000 Palestinians have been killed, which includes civilians and members of Hamas. Twice that many have been injured. A small fraction of that number are actual militants. By the Israeli government’s estimate of militants killed, that is collateral damage of two civilians for every militant.
Unsurprisingly, Hamas has been able to recruit new members during the conflict.
Around 70% of the buildings in Gaza’s urban areas have been destroyed. That is an extraordinary result from ‘surgical’ attacks.
But it does comport with the notion that there are “no civilian areas” in Gaza.
Breaking News: My apology to the teacher for calling him a spy. He was caught with medicinal cannabis obtained in the USA. Most of these cases are spies, but my apologies anyway. And yes, there was a swap for a money launderer after the phone call, or at least announced only today.
Trump and Putin have agreed to a meeting in a neutral country to be named later. It looks as if Ukraine is an ultimate loser in this. Putin is a loser also, but not personally since he could probably care less about the death and damage he has caused.
Why do you unable to post in the right place?
barry…”Gordon announces that in order to prove a virus has been isolated it needs to be visible under an electron microscope. If they are smaller than the resolution he believes is possible with an EM, he is relying on a mistaken belief to set an impossible task”.
***
Huh???
SEMS are not used to confirm a virus, the TEM is used. All a SEM can offer is a superficial surface scan of material viewed where the scanned surface is no more than 2 -3 nm deep..
The TEM, or transmission electron microscope, fires electrons right through the sample, therefore the sample slide thickness can be no more than about 90nm. Otherwise, the electrons cannot pass through it. As the electrons pass through they are collected on an image, which is comprised of the affected areas, shading the image in areas of black and white, representing electrons that made it through in various intensities.
What is viewed re a virus is a very thin cross section of the virus. The SEM, on the other hand, produces a 3-D view of the external surface, not the innards.
The question arises as to how the image is known to be a virus. That leads to confusion, since viral particles are sometimes confused with a real virus. Not only that, there are particles in normal tissue that can be mistaken for a virus.
One clue is that the viruses themselves should be of uniform size since they have the same density. Density = mass/volume. Although it is claimed that a virus has spikes protruding that it uses to attach itself to a cell, with a TEM it is virtually impossible to see such spikes.
The alleged corona virus is thus named because it appears to have a corona around it. Where then are the spikes for attaching to a cell?
And the goalposts move again, Gordon. You have exclusively used the acronym EM, never specifying what kind of electron microscope, and as soon as you are linke to a bunch of studies confirming EM capture of isolated SARS CoV2 virus, you suddenly find a new loophole.
Ok, here is yet another paper. TEM captures of isolated SARS CoV2, including spikes.
https://www.nature.com/articles/s41597-024-04182-3 [You can see the spikes]
I can, as before, produce many studies like this.
https://www.sciencedirect.com/science/article/pii/S1286457923000904
https://www.biorxiv.org/content/10.1101/2020.03.02.972927v1.full.pdf [Figure 2 is the TEM images, and you can see the spikes – they also used cryo-EM separately]
There are also plenty of studies using cryo-EM to image SARS CoV2, and they also see the spikes.
So, Lucy, are you going to pull the football away again, or are you going to give up this preposterous stance of yours in the face of all the evidence accrued from perhaps the world’s most studied virus?
Here are 2 more studies where the researchers isolated the virus, tested it in culture, observed its replication, used the isolated virus to infect other cells, and used transmission electron microscopy to image their results.
https://pmc.ncbi.nlm.nih.gov/articles/PMC7239045/
https://pmc.ncbi.nlm.nih.gov/articles/PMC7454076/
For interest, here is a study that tested which kind of cultures were more efficacious for hosting the isolates.
https://www.nature.com/articles/s41598-024-75038-4
“Note the spikes that adorn the outer surface of the virus, which impart the look of a corona surrounding the virion, when viewed electron microscopically.”
richard…all viruses apparently have such spikes, why don’t all viruses show the corona. It seems apparent to me that the said corona is nothing more than a uniform diffraction of electrons as they pass through whatever it is they are moving through.
It is well known that a TMS is destructive to the sample. Makes sense, since the high velocity electrons collide with atoms in the sample, knocking them apart. How would you like a stream of high velocity electrons aimed at your body? Of course, they’d have to put you in a vacuum first since electrons collide with air molecules, which block them and divert them.
When the first SARS virus was claimed in a paper, the paper was rejected at peer review. The reviewers claimed the nature of the viewed specimen virus was uncertain, that it could have been any virion.
What has changed??? How can anyone be sure they are seeing an actual virus and not simply viral material (virion) or even cell debris?
I am afraid the average researcher lacks the qualifications to differentiate a virus from a pomegranate.
ps. when I look at the supplied EM micrographs, the thought occurs to me as to why they seem congregated in groups with vast spaces between the groupd. Does that mean viruses are social creatures who hang out in groups, while lined up to enter a cell?
Gordon,
“It is well known that a TMS is destructive to the sample.”
So after insisting the scanning EM was not sufficient, and that only transmission EM was good enough, you now turn around and say that TEM damages the sample!
Incredible, self-fulfilling ‘reasoning’.
But I’ve had my fun. I’m content to let you believe that you know better than hundreds of different virus research teams, and thousands of virus researchers all over the world, who must all, according to you, be either incompetent or fraudulent.
SOLAR MINIMUM UPDATE
[Donald]’s job reduction order could hit most at this major Huntsville employer
https://www.al.com/news/huntsville/2025/02/trumps-job-reduction-order-could-hit-most-at-this-major-huntsville-employer.html
We had to do the same after Pierre Trudeau policies laying waste to Canada’s economy. Its really hard on the people involved.
There is no single high cost item that will bring government budgets under control. Even if salaries are just ‘5%’ of the spending … there have to be cuts. It all adds up to a whopping trillions of dollars of deficit spending.
There should be laws restricting deficit spending by governments so these situations don’t happen.
It really matters who you vote for … and this job reduction order isn’t Trump’s fault. You can’t blame him for decades of waste that are leaving USA in a situation where default is a real threat.
It is his fault based on the extent of what he plans. You can’t simply turn workers out into the street, justifying it as a means of balancing the books. At least, you can’t under a democracy that is supposedly based on compassion.
I did not see a word of this in his platform. Had he revealed these plans, I doubt that he’d have been elected. No, his current executive order comes after consultation with billionaires like Musk.
He vowed to slash government spending and prune the bureaucracy. And he got a mandate to do that. It should have been expected that he would come in with sledgehammers and machetes and ignore the constitution.
“And he got a mandate to do that.”
Did he? He did not get a mandate to enact Project 2025. During the election he specifically disavowed these plans.
I don’t know about Canada, but in the US we have separation of powers. Congress makes laws and controls the spending. They create agencies.
The President does not have the authority to unilaterally turn off the spending, nor to liquidate agencies, like USAID or the Dept of Education.
If he did, then whatever programs and spending this Congress passes and is signed into law, the next President could just cancel.
Separation of powers isn’t going to resolve a looming sovereign debt crisis unless they work together.
So ends justify the means for you?
The only way to solve the US debt crisis is to take on the Social Security deficit, which is very simple to do, but Republicans refuse to consider is required, which is to have well-off people contribute more.
Yes.
Layoffs are a frequent occurrence in private sector.
There is no reason to not do the same in government.
In the corporate sector financial auditing firms may make recommendations, but the layoffs are determined by the businesses themselves.
What Trump is doing would be like Deloitte sacking people working at
Telstra. It’s not Trump’s money paying for the ‘businesses’, and the businesses are owned by congress, not the presidency.
Also in the corporate sector, an auditor from Deloitte would be barred from auditing any company where they or their family could benefit from inside news or decision-making post audit. Musk would be in severe violation.
It doesn’t matter if he has the power or not; it needs doing. Else government go bankrupt and everyone … everyone … gets thrown into poverty.
So go ahead, keep obfuscating the critical factor of imminent sovereign debt crisis. You’re not immune.
I don’t think it is reasonable to abandon the constitution and the law to fix federal debt, which is definitely an issue. No one is denying it. The methods to deal with it are being criticised, quite appropriately.
This is exactly the argument of despots – torch the red tape and let me fix it. ignore the law and checks and balances and give me all the power. Or I’ll just take it – which is what Trump is doing.
And you have to trust that the Trump et al will get the job done right and fairly. But your argument recommends eschewing the checks and balances to establish that.
How much of the US system of checks and balances would you think is reasonable to set aside? You’d need a third term for Trump, surely, or the next pres would just crank it all up again – can’t risk that because it’s a crisis, right?
Would you go as far as skipping the next federal election so the job could get done properly?
“It doesnt matter if he has the power or not; it needs doing.”
Ken thinks dictators are cool.
barry…And the goalposts move again, Gordon. You have exclusively used the acronym EM, never specifying what kind of electron microscope…”
***
Barry…I had presumed, based on your apparent expertise in the field, that you’d know the difference between a SEM and a TEM. The original gold standard as put forward by the Louis Pasteur Institute obviously postulated a TEM since the electrons had to pass through the sample.
Most micrographs you see of a claimed virus are obvious cross sections of the virus. That happens when suspected viral material is prepared on a slide where the sample is about 90 nm thick. You cannot pick a virus up with tweezers and deposit it on a specimen plate, and you most definitely cannot slice a virus in half to create a cross-section. The cross-section obviously comes from slicing through multiple viruses prepared on some sort of substrate.
Here’s a good article on how samples are prepared for SEMs and TEMs.
Lanka’s argument is that artefacts are often mistakes for a virus. He offers examples of how common viruses like measles have been mistaken in papers for artefacts and even cell structures, where the implication is that the virus is inside. They don’t go out of their way to make that clear.
https://www.sciencelearn.org.nz/resources/500-preparing-samples-for-the-electron-microscope
“Micelles and strange-shaped mitochondria are examples of artefacts structures that are seen under the microscope but arent found in living cells. Its very important to be aware that artefacts can be introduced during fixation so that you dont mistake them for real parts of your sample. Telling the difference between an artefact and a real structure can be difficult”.
“For TEM, samples must be cut into very thin cross-sections. This is to allow electrons to pass right through the sample. After being fixed and dehydrated, samples are embedded in hard resin to make them easier to cut. Then, an instrument called an ultramicrotome cuts the samples into ultra-thin slices (100 nm or thinner). TEM samples are also treated with heavy metals to increase the level of contrast in the final image. The parts of the sample that interact strongly with the metals show up as darker areas”.
“Samples destined for the SEM arent cut into thin sections, because the SEM visualises the surface of three-dimensional objects. Instead, SEM samples are coated with a thin layer of metal (usually gold or gold-palladium). The metal coating makes samples conductive. It acts in a similar way to an electrical wire, drawing away the electrons that are bombarding the sample. Without the metal coating, many samples build up electrons, and this can cause charging artefacts. These are strange-looking areas on SEM images that give a false impression of how the sample looks”.
Gordon,
I’m glad you brought up the Pasteur Institute. Gold standard?
Here is an article from the institute about them isolating SARS CoV2:
https://www.pasteur.fr/en/press-area/press-documents/institut-pasteur-isolates-strains-coronavirus-2019-ncov-detected-france
And here is a research paper by the institute detailing the replication and TEM imaging of the SARS CoV2 virus. They also used SEM.
https://www.nature.com/articles/s41467-021-24521-x
The cult kiddies like to deny reality. They have to, to support their cult beliefs. One such reality they like to deny is “natural variability”. This winter are seeing many signs of this natural variability, as La Niña sets record snowfall in multiple areas.
https://www.pnj.com/story/weather/2025/01/22/what-part-florida-snow-pensacola-panhandle-photos-state-records-coldest-ever-days-temperatures/77872545007/
Absolute tosh. No one denies natural variability.
Keep burning those straw men.
Got a link to support your opinion, barry?
But at least you recognize you’re a cult kid. That’s progress….
You want me to prove a negative?
Don’t be silly. No one denies that there is natural variability. Witness the endless discussions about ENSO as an example. No one denies the existence of that natural variable.
Clint R
Who here denys that “Natural Variability” exists? You deny science by proclaiming, with zero evidence and complete lack of understanding of physics, that increase on CO2 in atmosphere can’t lead to higher surface temps (because CO2 acts as a radiant insulator as shown in several graphs of outgoing IR, graphs you refuse to consider).
It’s been a while since you’ve trailed me with your insults and false accusations, Norman.
But thanks for proving me right, as usual.
It will be an Arctic hit in the Midwest.
https://i.ibb.co/B5G2Dc0s/gfs-z100-nh-f00-1.png
” … as La Niña sets record snowfall in multiple areas. ”
*
I always get a big laugh about these self-assessed specialists – who in act are rather High Priests of the ‘360 Degree Denial’ Cult – when we see them talking about GHE, HTE or even simply about La Niña.
*
Record snowfall, eh?
Let’s look at the reality of snow cover that they always manage to ignore:
https://ccin.ca/home/sites/default/files/snow/snow_tracker/nh_sce.png
while intentionally misinterpreting the information below, which deals with snow mass hence tells us how wet the snow is on average (and not so much how voluminous it is):
https://ccin.ca/home/sites/default/files/snow/snow_tracker/nh_swe.png
*
Finally, let’s look at the power of this short season’s natural variability compared to earlier, year-long La Niña events:
https://psl.noaa.gov/enso/mei/img/mei_lifecycle_current.png
*
Until Sep ’23, I watched an unusually long lasting La Niña which started in 2020 and ended in 2023:
https://drive.google.com/file/d/1OFB3GczUOmJ-T1IwbmVFa3NuRaWpSIaO/view
I recall having totally underestimated its power in 2021, because Japan’s Met Agency did as well: this ENSO event lasted 35 (thirty five) months below the ‘-0.5’ treshold.
Anyone can see how the current La Niña would look like when inserted into this picture of superposed eventrs.
**
And when I look today at NOAA’s NINO 3+4 forecast
https://www.cpc.ncep.noaa.gov/products/CFSv2/imagesInd3/nino34Mon.gif
I emit some doubt about the current La Niña being able to explain anything about ‘everything being natural’ in today’s climate affairs.
Fizzix is broken
https://youtu.be/qPaB1nZgR9Y
Entropic Man: Re your post at https://www.drroyspencer.com/2025/01/uah-v6-1-global-temperature-update-for-december-2024-0-62-deg-c/#comment-1696594
The method that you used implicitly assumes that the WV level at the beginning of a period of study is the same as it is at the end. Instead, the assessment is path dependent. The temperature trajectory can be accurately approximated by 432 straight line segments (the temperature data is reported monthly so 36 years times 12 months per year = 432 segments). The month-to-month average temperature difference (which is what drives WV change) is half the difference between reported values. The solution is obtained via numerical integration: WVn = WV(n-1) + 0.5*(Tn-T(n-1) * 0.067 * WV(n-1).
The rate/C varies with temperature. It is the slope of the saturation vapor pressure vs temperature curve at a temperature divided by the pressure at that temperature. Area-weighted average is closer to 6.7 % than 7 %.
Also, I believe that UAH temperatures should be used because they are not subject to UHI uncertainties.
The result of this analysis is a WV increase due to temperature increase of 0.39 mm.
Testing
Roy,
Far as I can see the January anomaly doesn’t yet appear at https://www.nsstc.uah.edu/data/msu/v6.1/tlt/ .
barry…”Here is an article from the institute about them isolating SARS CoV2:”
***
Barry…Disclaimer…I am not arguing in any way that something is causing pneumonia in certain people and that the pneumonia can be fatal. I am in no way in denial that a problem exists. However, we must take into consideration that 99.95% of those encountering this affliction experience nothing more than symptoms which range from trivial to more serious and that the human immune system handles the affliction in those people.
Only a tiny fraction world-wide are succumbing to the affliction and here in Canada, some 55% are over 80, many with multiple health conditions related to aging.
Let’s try to be scientific and refrain from leaping to conclusions that a virus is responsible, especially when the evidence of a virus is seriously limited.
***
There is nothing in either article that explains how they ISOLATED a virus. Neither the SEM nor the TEM were used to claim a virus, only virions, or viral particles were claimed. Lanka has claimed that to be the case with most viruses, researcher are simply mistaking cell debris or virus particles for a real virus.
Isolation means just that, to physically separate an entity from another entity so the original entity is clearly identified. Montagnier is on record, admitting he saw no HIV virus on a TEM and that he concocted a theory that RNA isolated from a person with AIDS. That is apparently the same theory being used by the LPI to claim covid isolation.
Ironically, even though Montagnier was an open-minded person, he became unusually closed-minded re his inferential method. He stated, as far as he was concerned, his inference re RNA was as good as physical isolation. I think there was tremendous pressure exerted on him and his team to find a cause of AIDS and that they succumbed to the pressure by leaping to an unreasonable conclusion re RNA.
I regarded his RNA claim as sheer nonsense. When you have a gold standard from the LPI to physically isolate a virus using a TEM, and you apply the method and see no virus, and you devise a highly theoretical method based on inference, claiming it is the same as seeing the virus on a TEM, then you are deluded.
From the articles…
“We observed a rapid increase of extracellular viral RNA in apical culture supernatants (P?<?0.0001), with concentrations reaching up to 106 viral RNA copies/L at 2 days post-infection (dpi), followed by stable or slowly decreasing viral RNA levels until 7 dpi (Fig. 1C)"
***
They are obviously using the method devised by Montagnier after he failed to SEE HIV on a TEM. Montagnier's method is fraught with issues since it has to be presumed that the RNA mentioned above is from a virus.
No one has ever proved the RNA in question comes from a virus. In fact, a pioneer in the field of retrovirology, circa 1970, when the field was invented, which is about RNA, cautioned that RNA could not be implied to represent a virus simply because RNA is everywhere in the body.
There is abject denial that the person with AIDS from whom the RNA was extracted is from a particular cult of gay men (about 17% of all gay men) that practices anal sex with multiple partners while high on various drugs.
Their practices are termed 'high risk' for a reason. They are dealing with human excrement while in a drugged stupor. I would be looking for evidence that the RNA in question is from such practices and not from a phantom virus. The other high risk group, IV drug users, claimed to be vulnerable to AIDS, have serious issue with malnutrition. Why are malnutrition and drug abuse being ignored while a theorized virus get the blame?
WRT covid, how do we know the RNA is not from issues in the human body related to disease? Many people who die of pneumonia related to a theoretical virus already have serious health conditions. Although I admired Montagnier for his forthrightness, I think he committed a major gaffe by relating RNA to HIV after he failed to see a virus on a TEM. What bothers me more is the number of scientists and researchers who cling to his new theory even when there was no proof the past 40+ years to support it.
In the LPI articles you provided they are presuming the issues they describe are caused by a virus. That is ingenuous in part because pneumonia can be caused by bacteria. Presuming that breathing difficulties due to pneumonia are caused by a phantom virus is just plain silly.
People, especially the elderly, develop pneumonia while lying in hospital. There is no virus involved, just a weakened immune system and a body shutting down due to age and other factors. If the immune system is compromised due to age, the pneumonia can be lethal.
Pneumonia is a disease of the lining of the lungs. Many smokers eventually develop COPD, which is another form of lung dysfunction. Those people often develop pneumonia and die. During the covid hysteria, if such a person died, the death would be listed as a covid death, if anything related to the RNA claimed to be from a virus was present.
The entire theorized covid genome is never present, it is theorized using a computer model. The HIV/AIDS theory is based on a house of cards and innuendo and the covid theory is built on HIV/AIDS theory.
In 2020 the the excess death rate in the US and may countries around the world spiked to levels not seen since WWII. That’s not fake statistics. Death certificates are as tight a statistic as there is.
The timing of the spikes match perfectly with the waves of infections and mortality from COVID.
So not only do you have these enormous departures from average mortality, they happen at exactly the same time as the waves of reported COVID deaths.
Australia had some of the strictest lockdowns in the world, and managed to go through 2020 without these spikes in excess mortality. But when in late 2021 we opened up, then came the massive COVID deaths, and once again the number and timing of deaths matched the waves of mortality attributed to COVID.
This is some of the most persuasive evidence, if anyone needed any. And there is a lot more besides.
Monster unicorns did not increase overall mortality by 17% in 2020 and 2021. Most years prior to that saw variability of only 3% maximum. Even the 2017/18 influenza season, one of the deadliest prior to COVID and since WWII, a maximum of 5% more people died than expected.
That flu season saw 60,000 excess deaths. 2020 and 2021 each saw 350,000 excess deaths. Those numbers also happen to correlate with the mortality attributed to COVID for those years.
And the timing of the overall mortality spikes matches the waves of reported COVID mortality.
SARS CoV2 was real, it was the most lethal virus for a century, and it has probably been researched more than any other virus, due to its severe worldwide impact and the policy of sharing the genome sequence and making all research on it open access, pretty much unheard of for any other topic.
There is an avalanche of hard science on COVID, Gordon. You shouldn’t take yourself so seriously on this.
‘That flu season saw 60,000 excess deaths’… in the US. This is the figure Trump quoted at the start of the pandemic.
Gordon Robertson
Your denial of basic science is amazing! Your ideas on Covid are horrible jumble of nonsense! I had a bad case of Covid (positive test) was sick for 3 weeks with 101 F fever for days, weekness, chills, terrible night sweats, and nausea to the point of not eating! Many people at the workplace got it and many were off for weeks. Usually flu lasts 24-48 hours than done. When people came back they reported they never felt that sick before! One who had mild symptoms lost sense of smell for a year. You really are a cluless wonder spreading lies!! Wish you were not such a liar and cared about the truth. Your agenda is to misinform and spreadlies. Why this is your primary motivation only you can answer.
SOLAR MINIMUM UPDATE
About 250 Huntsville Utilities customers were in for a surprise when they received letters notifying them their accounts were about to be debited $100 to take care of their electric bills.
The letters indicated their accounts would be debited when their next invoices are due.
That’s because the assistance they were receiving through grants distributed by the Community Action Partnership of Huntsville/Madison & Limestone Counties, were revoked following an executive order from [Donald].
https://www.al.com/news/huntsville/2025/02/trump-executive-order-leads-to-100-charge-for-250-huntsville-utilities-customers.html
Are you unable to find some other blog where you can exhibit your boring Trump Derangement Syndrome episodes?
Compared to Willard’s comment above, your post
https://www.drroyspencer.com/2025/02/uah-v6-1-global-temperature-update-for-january-2025-0-46-deg-c/#comment-1698361
is of an incredible insanity and stupidity.
Your true colors come shining through.
Stock market is up some 25% in the past year.
Did the actual value of the companies on the stock market rise by 25%? Hell no.
So why are stock valuations skyrocketing? Because the dollar is hemorrhaging value due to money printing by government.
Trump is trying to stop the money printing in order to end the spiraling debt cycle that is quickly going to result in a sovereign debt crisis. He is cutting spending wherever he can find egregious waste.
Tariffs, electric bill rebates, foreign aid, military, you name it; the spending deficits and trade deficits has to end.
Its not going to be enough. Wiemar republic is going to look like a picnic.
Socialism is ‘grate’ until you run out of other people’s money. And you’ve run out. TANSTAAFL
“He is cutting spending wherever he can find egregious waste.”
What he and Elon are doing is not about waste or efficiency. It is about selectively canceling programs they hate for arbitrary and capricious reasons.
Musk liquidated a small but valuable program, USAID, that the current Sec of State had highly praised, because Musk had a previous dispute with their leadership in Ukraine.
The cancelling of foreign aid, which is called soft power, with a budget 1/25 of the defense budget, means that China will fill the vacuum, and reap the economic and diplomatic benefits.
Here are only a few examples of the WASTE and ABUSE:
Top ten:
$1.5 million to advance diversity equity and inclusion in Serbias workplaces and business communities
$70,000 for production of a DEI musical in Ireland
$2.5 million for electric vehicles for Vietnam
$47,000 for a transgender opera in Colombia
$32,000 for a transgender comic book in Peru
$2 million for sex changes and LGBT activism in Guatemala
$6 million to fund tourism in Egypt
Hundreds of thousands of dollars for a non-profit linked to designated terrorist organizations even AFTER an inspector general launched an investigation
Millions to EcoHealth Alliance which was involved in research at the Wuhan lab
Hundreds of thousands of meals that went to al Qaeda-affiliated fighters in Syria
Source https://www.whitehouse.gov/fact-sheets/2025/02/at-usaid-waste-and-abuse-runs-deep/
Very hard to make an argument that this is a good use of taxdollars, not even in the context of ‘soft power’.
Most of those are Trump administration lies, Ken.
https://www.theoaklandpress.com/2025/02/07/the-white-houses-wildly-inaccurate-claims-about-usaid-spending/
Most of those things on the list were funded by the State Department, not USAID, and most are completely mischaracterised. It wasn’t a musical (but musical sounds gayer, eh?). It wasn’t just for electric vehicles, it was for green energy initiatives and to get in front of China on that front. And so on. Read the fact check. There are score of them now.
Also, even if you include in that list things that USAID didn’t fund, it’s still a tenth of a percent of USAID’s budget, and USAID’s budget is 1% of the Federal budget.
So this ‘incredible waste’ is tiny compared to the rest of USAID’s budget, as well as being Trumped up.
The trouble with an avalanche of lies is that it can take time to sort out the debris, and by the time that gets done, the lies have taken root.
Just like Haitian’s eating pets. These people lie, and they lie constantly, and suckers like you eat it up.
Ken,
Legitimate instances of waste in a dept. can be pointed out by DOGE, and the appointed head of the dept can end it.
There is no need to throw out the baby with the bathwater.
Whatever he does is AOK with Ken.
Just now he has fully ripped the blindfold off Lady Justice.
The Justice Department has made it clear that if you have done a crime like taking bribes, and there is a strong case against you, AND if you are powerful and will do Trumps bidding (a quid pro quo), then you won’t be prosecuted or go to prison.
https://apnews.com/article/new-york-city-us-attorney-0395055315864924a3a5cc9a808f76fd
Republican congresscritters have come up with 2 bills with the same idea: authorise President Trump to negotiate with Denmark to acquire Greenland.
The first bill last month included a provision that congress would need to ratify after seeing the details of the negotiations/agreements. This proposal bill is called the Make Greenland Great Again Act.
The next bill was pretty much the same, except that it does not require any congressional oversight and suggests a new name for Greenland after acquisition. It is called The Red, White and Blueland Act, issued by a different congresscritter
Firstly, the names of these bills cannot be satirised, because they are already satires. And yet they are genuine. They invoke the cheesiest red white and blue-uniformed marching band stereotypes.
Secondly, next to outright saying it, could Republican congresscritters indicate any more obviously that they are fine with a presidential autocracy?
Forgot to mention this eyebrow-raising language in the NEW, IMPROVED! bill.
“The President is authorized to enter into negotiations with the Government of Denmark to purchase or otherwise acquire Greenland.”
barry…”could Republican congresscritters indicate any more obviously that they are fine with a presidential autocracy?”
***
If the US constitution is kept intact, there is no way that can happen. You are speaking as if Trump has a huge majority in Congress and he does not. In fact, based on the popular vote, he has support of barely half the electorate.
Germany was in dire straights pre WW II and Hitler’s ranting and rhetoric about making Germany great appealed to the masses, not all of them but arguably with a majority. That is not the case in the US.
Trump has already made an enemy of McConnell, a Republican Congressman and I am sure there are several more who could defeat any of his bills in Congress. That would create an impasse in the house and leave Trump a lame duck president.
A statesman, Trump is not. He is more like a bull in a china shop. In the past, I regarded his disdain for political correctness with amusement but thus far in his 1 month term, he has crossed several lines that threaten not to make the US great but to render them in a precarious position with no friends or allies.
We are all waiting to see how things unfold but I am guessing that Trump is simply blustering, feeling things out to see how other nations feel. I could be wrong. This far, he has been soundly rejected by Canada and Europe is getting up in arms about him meddling in Greenland.
He appears to be desperate for rare earth element of which Canada has an abundance. He is now casting his lot with the Ukraine, a dangerous move since it could lead to tension with Russia. Trump promised to fix the Ukraine-Russia rift but thus far he has managed to deepen it.
Not a good start.
Let’s face it, when he talks about making the US great again, he means for the wealthy, not the average US citizen, who are obviously going to be expected to support his efforts financially.
I’ve been assuming that the moderates in the Republican party wouldn’t go along with the outlandish and unconstitutional stuff. But they are remarkably silent, or at best mealy-mouthed.
So we’ll see what happens with godforsaken bills like this. When congress are called to vote on stuff like this, we’ll get a better lay of the land. I’m not pessimistic.
It’s nice to see some responsible adults in the Oval Office, for a change.
* Schools can’t force Covid vaccinations.
* Drill, baby, drill.
https://www.youtube.com/watch?v=yoYpeufpEWE
Didn’t watch a 30 minute video.
Tell me, is the federal government now telling the states what to do re vaccinations? Because the states were left to decide that during the pandemic. It was a varied approach state by state, and no one was forced to have vaccinations.
Trump is one of the few people I’ve ever seen where the joke that, “You know when he’s lying, his lips move,” is true.
I understand you children have a short attention span, barry.
That’s why I included the brief summaries:
* Schools can’t force Covid vaccinations.
* Drill, baby, drill.
Did schools force COVID vaccinations? Is that what Donny told you?
https://eu.usatoday.com/story/news/politics/2025/02/14/trump-bars-federal-funds-schools-covid-vaccine-mandates/78634277007/
” WASHINGTON ― President Donald Trump signed an executive order Friday prohibiting federal funds from going to K-12 schools and universities that require COVID-19 vaccinations.
The order, signed by Trump in the Oval Office, instructs the departments of Education and Health and Human Services to issue guidelines to comply with the order and create plans to “end coercive COVID-19 vaccine mandates.”
“That solves that problem,” Trump said after signing the order.
However, the order will likely have a minimal impact.
No states currently require COVID-19 vaccinations for students at K-12 public schools, and at least 21 states have passed laws banning vaccine mandates.
Only 15 colleges ‒ all private institutions ‒ still require COVID-19 vaccination shots, according to “No College Mandates,” an advocacy group that opposes COVID-19 vaccine requirements. ”
*
Once again, the Trumping boy ‘trumped’ the USA – all MAGA puppets included, by selling what was already there as brand new.
Very good Bindi. Now you understand that:
* Schools can’t force Covid vaccinations.
Maybe you can explain it to barry?
Also, you forgot:
* Drill, baby, drill.
More good news.
why has this blog suddenly gone political? is the climate that benign?
why has this blog suddenly gone political?
Because a constitutional crisis is looming, and what happens in the US has knock-on effects for the rest of the world, especially with a chaotic leader.
Superpowers are like systems of government, and like democracy, the US is the least worst.
So, what is this Constitutional crisis that is looming, Barry? Biden’s abrogation of his Constitutional duties didn’t appear to bother you.
The Trump administration is attempting to take on the role of the legislature, including but not limited to determining what funding should be allowed in various government branches. This is constitutionally the province of the democratic process of representatives in congress. Previous presidents have tested this exclusivity, but never with the scope and sweep of the Trump administration. Furthermore, no other administration has made a naked grab for the purse strings, as DOGE did when accessing the funding levers in the treasury. No administration in the history of the US has attempted to gather so much power to itself as this one, nor at such an accelerated pace. It’s not even close.
The crisis is looming because even though the courts, as one of the 3 branches of separated powers, has put checks on the executive branch, congress has not. Rather, bills have been tabled that reflect a Republican trend of derogating congressional and other powers to the executive. I mentioned one upthread – the execrable Red White and Bluesland bill, that did one better than the previous bill to acquire Greenland, by removing the requirement for congressional review and approval.
It remains to be seen whether moderate Republicans will support the Trump’s desire to absorb more power, and whether they will support their colleagues’ bills that would make Trump’s some of illegal activities lawful activities. For instance, there is a bill to give the executive more power to fire bureaucrats based on their loyalty.
And it remains to be seen if SCOTUS will support the lower courts rulings on the various executive orders that are or may be unconstitutional.
The constitutional crisis looms because it is far from certain that the separation of powers will withstand the assault on centuries old norms, rules and laws that determine how the US government operates.
I don’t know if you have noticed. The Trump administration is not filled with conservatives. It’s filled with radicals.
Stephen,
https://www.drroyspencer.com/2025/02/uah-v6-1-global-temperature-update-for-january-2025-0-46-deg-c/#comment-1698395
The executive take-over and or dismantling of government functions is pervasive. I could make a large list. The administration has removed the Democratic members of some oversight committees, robbing these committees of a quorum. They are unable to function as a result. Couple that with the firing of inspectors general, whose work is similar to and often adjunct to these committees, then consider that DOGE has been constructed to evade freedom of information requirements (it is ‘separate from government’) and it is clear that the executive is eroding oversight mechanisms that might interfere with its attempts to control the narrative about government operations while it consolidates power.
There is no precedent for the systematic removal of oversight committees in any presidency.
The administration doesn’t want knowledgeable independent voices diluting their messaging and deviating their intent.
Trump wants to drain the swamp. His administration wants to expand the powers of the presidency, remove oversight, and make government agencies, like the FBI, DoJ and CIA align with the will of the presidency.
As usual, Trump and Republicans are doing exactly what they accused the Dems of, making the DoJ do the bidding of the president. This often holds true – every accusation is a confession.
barry says: “The executive take-over and or dismantling of government functions is pervasive.”
We can only hope it continues….
Barry,
You had no problem with Biden stealing an election, dismantling the CBP, tearing down border walls, unilaterally forgiving student debt, weaponizing the DOJ, having hundreds of pieces of classified information in his possession while as a Senator or VP which he had no authority to do so.
Barry,
Also you need to go back and study civics. Appropriations bills originate in the House but it is a negotiation process with the Senate and the President because they all have to sign off. Also, legislation can originate from the Senate and or the President.
Barry,
I assume you took civics. Maybe you didn’t. I know Gordon is Canadian. Nate is American. He should know better. We have a system of checks and balances. That is what is happening, nothing more. No crisis. Working as it should. Unlike Biden.
Barry,
No tax on tips.
No tax on senior’s social security.
No tax on overtime.
No more loopholes for billionaire professional team owners.
Extension of 2017 tax cuts.
Do you have a problem with any of this?
Barry,
Does it bother you that Judge Engelmayer, an Obama appointee, would issue a restraining order against the Secretary of the Treasury so that he could not audit his department? Now that is something unconstitutional that you can crow about. This judge should be removed.
Stephen focuses on the policies he likes, while ignoring the unconstitutionality and demolishing of the rule-of-law to achieve them.
If Trump can simply demolish departments or programs passed by Congress and signed into law (USAID DOEducation), then what’s to stop the next President from doing that to whatever passes through Congress during this 4 years?
Then Congress becomes superfluous.
Then he illegally fired all the Inspector Generals of all the agencies, without giving Congress the required notice and rationale.
By the way the IGs work for US to protect US from a rogue government.
So that is over and done with.
Then there is the Dept of Justice, which under Trump, is issuing Get-of-Jail free cards to all who bend-the-knee to the Dear Leader.
This is how justice is doled out in Russia.
But Stephen is AOK with all of it. And that’s how we get dictators.
“Engelmayer’s order was sought by Arizona Attorney General Kris Mayes and 18 other states who argued an attempt by Musk’s Department of Government Efficiency to access Treasury records violated the privacy of Americans.”
“Engelmayer ruled that DOGE’s nongovernmental access to the sensitive financial and personal information of Americans was a risk for leaks and vulnerable to hacking.”
Which is a legitimate concern of many Americans, except Stephen.
DOGE has no congressional oversight, and the House Republicans refused to subpoena Musk.
stephen, first of all – stop deflecting. If your argument is that Biden is as bad as Trump, then you’re not doing Trump any favours. But again you are reading nearly rote from the Trump campaign playbook. Endless lies with occasional smatterings of truth.
“You had no problem with Biden stealing an election”
That didn’t happen. A Trumpian fantasy absorbed by his followers. Every bit of ‘evidence’ was laughed out of court or otherwise shown false. Recounts happened multiple times in the battleground states. Republicans verified their own state elections, while other Republicans cried fraud without presenting any evidence. “Stop the Steal” never had more substance than a slogan.
Meanwhile, the recording of Donald Trump asking the Georgie Secretary of State to find him 11,780 votes in order to overturn the election is well publicised, as is his campaign team putting together slates of fake electors to overturn the real results on January 6, when Mike Pence was supposed to do Trump’s bidding, instead of fulfill his ceremonial duty.
When Trump makes an accusation, it is often a confession.
“dismantling the CBP” False
“tearing down border walls” – A complete lie. Where do you get this stuff? Did Trump say this and you’re just repeating it? Are you going to google and come back with, “He stopped building it, which is as good as tearing down walls because it tore down President Trump’s plans.”
“unilaterally forgiving student debt” – True. His first attempt was blocked by SCOTUS? Did he call the courts corrupt? No. He acceded to the law and sought another route. He’s not the first president to forgive debt. Even Trump forgave student debt, though Biden’s forgiveness was for a much greater sum.
“weaponizing the DOJ” All the evidence is to the contrary. Biden did not replace the attorney investigating his son, even though it is customary for each new president to replace those positions. Rather than shutting down the probe, he stood by as Garland made Weiss, the Republican attorney, an independent counsel, giving him greater independence, to further separate the probe from the DoJ. Biden never spoke about DoJ cases, or called on the DoJ to do anything.
But Trump through his first presidency publicly criticised the DoJ for not going after his political enemies, and frequently urged the DoJ to take action in tweet after tweet. Have you forgotten? Trump tried to weaponise the DoJ. Another instance of an accusation being a confession.
Also, Trump fire fired the head of the FBI after asking him to be loyal, for not stopping the Russia investigation. Meanwhile Biden kept on Trump’s FBI pick Chris Wray, even while he was investigated for possession of government documents in his garage. The two president’s different actions speak loudly.
“having hundreds of pieces of classified information in his possession while as a Senator or VP which he had no authority to do so”
Hundreds? Rubbish. You’re confusing that for Trump’s haul.
Let’s break it down. Number of classified documents.
Biden ~24
Pence ~12
Trump 300+
Voluntarily surrendered them:
Biden – Yes
Pence – Yes
Trump – No
Charged with obstruction for not handing the documents over
Biden – No
Pence – No
Trump – Yes
Trump was asked, asked again, then subpoenaed, then after 18 months was raided because he wouldn’t give everything back. And they found another 103 classified documents. He got indicted with 40 counts for that.
But this isn’t about tit for tat presidents. Every president tests the boundaries of their authority in various ways. But none in their full term/s comes close to the overreach in just the first month of the Trump administration.
Biden is gone, so how about live in the present? Stop being a stooge for these radicals and take a good hard look at what they are doing.
“No tax on tips.
No tax on seniors social security.
No tax on overtime.
Forgiving student loans”
I’m not sure why Stephen is for all of these pure cash-giveawys to placate the public except the last one.?
I’m for none of them, because none of them are FAIR.
If I put money in a retirement fund, and it earns interest, then when I take the money out, I get taxed on it.
If I am well off I get back more social security than I paid in, and it adds to all my income, then why shouldn’t I pay taxes on it?
If I work overtime at a job with no overtime pay then I get taxed on all of it.
If I went to college years and paid back all my loans, the I get no forgiveness.
Barry,
Stop deflecting, and then you deflect and create a straw man. No, my argument is Trump had the authority to have as many classified documents as he wanted. Biden had no authority. Trump broke no laws. Biden broke many.
“No, my argument is Trump had the authority to have as many classified documents as he wanted.”
1. You didn’t make that argument.
2. It’s wrong. No president is allowed to take presidential records home, let alone 300 classified documents, and especially after they are no longer the president.
This is regulated by the Presidential Records Act of 1978, which:
“Establishes that Presidential records automatically transfer into the legal custody of the Archivist as soon as the President leaves office.”
https://www.archives.gov/presidential-libraries/laws/1978-act.html
this is government legislation. Trump broke the law when he refused to hand over all the records after being twice asked by National Archives, subpoenaed and finally raided.
Why do you not get this? The law has been on the books for nearly half a century.
This also applies to the vice-president, so Pence and Biden also held records unlawfully. Unlike Trump, they volunteered that they had them and promptly delivered them. Subsequent investigation cleared them both of any ill-intent, or that they held any more documents. They both co-operated.
Trump did the exact opposite, which is why he was charged on 40 counts.
Ian, this issue has always been about politics.
If it were only about science, it would not be an issue. CO2 can NOT heat the planet. Just as passenger jets cannot fly backward, and ice cubes cannot boil water.
… and as the GHE doesn’t exist, global warming is 100% natural, viruses cannot be shown using electron microscopes, evolution is pseudoscience, time exists only in human mind and… the Moon cann’t rotate about its polar axis because it shows always the same face to us.
Rien de nouveau à l’Ouest!
Well, I don’t know about viruses and time, but the rest is accurate.
You’re getting there, Bindi. Progress is slow but steady.
Blinny,
Your fellow German Albert Einstein understood the Equivalence Principle. Why don’t you?
Until now, we had two major dictators: Putin in Moscow and Xi in Beijing.
Now we can add the Trumping boy in Washington, DC.
What a silly comment,the EU abounds with dictators
“Most of those are Trump administration lies, Ken.”
Sec. 3. Assistance. (a) All executive departments and agencies (agencies), including the United States Agency for International Development, shall, to the maximum extent allowed by law, halt foreign aid or assistance delivered or provided to South Africa, and shall promptly exercise all available authorities and discretion to halt such aid or assistance.
https://www.whitehouse.gov/presidential-actions/2025/02/addressing-egregious-actions-of-the-republic-of-south-africa/
Lauren Southern ‘Farmlands’
https://www.youtube.com/watch?v=a_bDc7FfItk
You quoted me on other issues. So you’ll just sail past all those lies and on to the next thing.
Straight out of Trump’s playbook. Just keep hammering out the message and to hell with the truth.
See the Lauren Southern video? If it weren’t white farmers being targeted it would be called out as genocide.
Did you check all the lies the Whitehouse put out from the comment you quoted me from?
Are you going to repeat those lies at some point in the future, because you didn’t want to see if the corrections were true?
Or do you care about truth, and you made an effort to ascertain the truth of those statements, and you won’t repeat them?
“See the Lauren Southern video? If it werent”
Ken, please get your ‘facts’ from You-tube propaganda videos.
Please don’t get fake news from such sources.
“Since 2004, as a key implementing agency for the U.S. President’s Emergency Plan for AIDS Relief (PEPFAR), USAID has delivered the majority of the more than $5.6 billion invested in South Africa’s response to prevent and treat HIV/AIDS and TB”
Nate,
We are broke. We don’t need to be giving $5.6 billion to South Africa. If it is so important to you leftists, then you guys have more than enough money to pay for it.
$5.6B over 20 y, Stephen, started by noted leftist GW Bush.
The point is to use low cost soft power and to have allies in the world, as opposed to much more expensive military power.
If we don’t do it in Africa and elsewhere, China will fill the vacuum and reap the benefits.
SOLAR MINIMUM UPDATE
WASHINGTON – Several Alabama agencies and organizations Tuesday were trying to determine what [Donald]’s freeze on some federal grants could mean for them and their services.
[…]
Alabama received $18.7 billion or 43.1 percent of its total revenue from federal grants in fiscal year 2022, according to The Pew Charitable Trusts.
https://aldailynews.com/how-the-federal-funding-freeze-could-impact-alabama/
Everything is fine. Trust Tommy.
Strong thunderstorms from Louisiana through Alabama to Tennessee.
Snowfall and frost in the Midwest. Very large temperature difference means high humidity on the eastern side of the front.
ian brown….”…why has this blog suddenly gone political?”
***
Ian, it’s basically because the AGW theory is political. One cannot ignore the politics behind it.
Roy’s colleague at UAH, John Christy, has served on several IPCC reviews as a lead author and a reviewer. He has reported back on the politics involved in the reviews, how certain reviewers go the the reviews with foregone conclusions based on the political views of the governments that send them. Ergo, they have no intention of peer reviewing papers, there sole role is to rubber stamp them as approved.
The IPCC is itself a political body. Lead authors are all political appointees and they create the Summary for Policymakers, with which the main report must agree. Lead Authors are further appointed by Coordinating Lead Authors, two of which, Kevin Trenberth of UCAR and Phil Jones of Had.crut have claimed an interest in blocking papers from skeptics. They have already blocked a paper from John Christy of UAH and Trenberth was directly involved with the harassment of a journal editor, forcing him to resign, simply because he approved a paper by John Christy et al.
The current interest in Trump is related to his views on AGW. Put simply, he thinks it’s a crock, which it is, and he will be taking steps to withdraw the US from the Paris Accord.
Much of the venom directed at Trump on this blog is coming from climate alarmists. Thus, they are attacking Trump roundly. Whereas I agree with certain things he is doing I am beginning to see many of his executive orders as being poorly thought out and based on his misguided ego.
X in the UK is dominated by alarmists,most who nothing about the climate history of their own country, people like Edward Sabine, Gordon Manley and Hubert Lamb might as well be Martians for all that they know of them,my local MET office forecast page has a heading,Reasons For Climate Change, with the IPCCs burden of proof leading the way,with no mention of the fact temperature fluctuated before 1850. It is a propaganda driven money maker, they ignore the fact that all natural events cancel out any C02 effects, the planet was already warming untill a serious of volcanic eruptions and a solar minimum combined to to drive temperatures down again,i think Lamb mentioned at least 5 major eruptions, the last being Tambora ,
binny…” and as the GHE doesnt exist, global warming is 100% natural, viruses cannot be shown using electron microscopes, evolution is pseudoscience, time exists only in human mind and the Moon cannt rotate about its polar axis because it shows always the same face to us”.
***
I have never stated that a virus cannot be seen on an EM and neither has Stefan Lanka, who is disclaiming that many modern viruses claimed to be isolated have never been seen on an EM. Lanka, who discovered the first virus in the oceans acknowledges that viruses do exist, he simply thinks there is no proof that any virus is contagious to human cells.
All we really know about viruses has been developed since 1970, when the field of retrovirology was formed. Montagnier, credited with discovering HIV circa 1983, only 13 years after the field of retrovirology was formed, has freely admitted he could not see HIV on an EM. Therefore, he proceeded to apply theory from a brand new field where the theories he applied to infer HIV were unclear.
Since he produced his inferential theory, other scientists, in an attempt to amplify an unseen virus, have turned literally to smoke and mirrors to claim the amplification of a virus. Still no virus that can be seen, only strands of RNA that are inferred to be from a virus.
The current method for claiming a virus via inference is to convert certain strands of RNA, ***INFERRED TO BE FROM A VIRUS***, to DNA then amplifying the DNA using PCR, a method of amplifying strands of DNA. The final claim based on the number of iterations of amplification, and not on the physical identification of a virus, has come under considerable criticism partly because the process is flaky. With HIV, it can produce a positive result one day and a negative result within a day.
The inventor of PCR, Kary Mullis, balked at the idea of using PCR diagnostically to infer a virus. He claimed that amplifying a sample wherein no virus could be seen on an EM, would provide no better results when amplified.
Think about it. After RNA is converted to DNA, and the latter amplified, there is still no virus that can be viewed. The only proof offered is that strands of DNA, sourced from RNA, represent the genetic makeup of a virus. Not a shred of evidence offered that the RNA and a virus are related, just an inference.
Think about this too. Why was there a need to amplify a sample with PCR? Montagnier already offered the answer, his team could find no evidence of a virus using an EM. So, why have all these images appeared on the Net of HIV when no one in the past could see it?
re time…Eben posted a good link the other day in which the site author claimed much of modern science is obfuscated by math. In other words, sciences like modern quantum theory cannot be visualized or verified physically, we must take the word of the mathematicians that the claims are valid.
Basic quantum theory is the basis of electronics and chemistry but that part of quantum theory can be verified, because it is simple, obvious, and verifiable. In fact, Linus Pauling used Bohr’s basic quantum theory, adjusted by Schrodinger, to develop the shapes of complex molecules.
Problems arose when Bohr insisted on taking quantum theory into the sci-fi world through inference only. Entanglement theory came from his divergence and it infers that an electron can communicate with another electron at a distance, sheer poppycock.
The theory of time shares the same obfuscations and inferences. Einstein had to redefine time in order to make his relativity theory work. Basic time, as we know it, is an invention of the human mind, and it is based on the rotation of the Earth on its axis. The second, which has become a universal measurement, not of time, but of the physical period of the Earth’s rotation.
That period of rotation is dimensionless until the human mind defines it and quantifies it. We humans measured the period using a basic rotating dial which we synchronized with the Earth’s rotation, and we named the rotating dial a clock. Therefore, a clock measures no time, it measures a period with no dimensions. It was only after we divided the dial face arbitrarily into 24 hours and sub-divided the hours into minutes and seconds, that we could declare the length of a second.
Along came Einstein, who for some unfathomable reason decided that the relatively constant second could be altered via thought experiment, another human imposed analysis, that he could claim the dilation of time.
If the second used in Einstein’s equations is taken as a constant, as it should be, his entire theory of spacetime falls apart. Newton regarded it as a constant but his input is now regarded as wrong, according to theorists who use only thought experiments and the likes.
That was the basis of the argument in Eben’s post.
ps… hours, minutes, and seconds are not universal constants, nor are feet, metres, degrees C, etc. That is, these quantities have meaning only to the human mind.
Imposing time on the universe, as if it exists, is nothing more than another function of the human mind…ego.
Barry,
Musk has identified over $100B of social security going to people with no SSN. Don’t you want stuff like that to stop? Also, they are not going to deport people who are working, contributing to social security, and are a benefit to society even if they are illegals. If they are a net positive, they stay.
Musk said USAID was sending condoms to the Gaza strip. In fact the health services he was talking about were for Gaza in Mozambique.
Why on Earth would I trust a single word coming out of Musk’s mouth?
I will believe it when DOGE is subject to freedom of information laws (it’s been positioned so that it isn’t), and when there is an independent audit verifying it.
Unfortunately, Trump has been firing inspectors generals and getting rid of oversight committees, so non-DOGE audits are probably not going to happen.
Do you think government transparency is essential, or not?
stephen, what is happening is that the Trump administration is churning out endless propaganda and activity, much of it little connected to truth or law.
They know that if they keep up a firehose of outrageous commentary, their followers will lap it up, and by the time the fact-checkers publish the tranche of falsehoods, the followers will already have moved on.
You do not know that you are being lied to on a daily basis. Most of the ‘bad’ USAID funding Musk listed recently isn’t actually funded by USAID – it’s funded by the State Department. This was fact-checked by multiple different news organisations, but his followers have already moved on to the next outrage. They’ll never know that 90% of what was said about USAID was a lie.
And the Trump administration know that. It is a strategy.
“much of it little connected to truth or law”
I agree with Barry.
RLH,
“I agree with Barry,”….surprise, surprise.
The only propagandists around here are the leftists. They live in subterfuge. DOGE is completely transparent. Everything it does is completely open. They talk about it all the time. USAID was subterfuge and leftists bribes and giveaways. Why don’t the leftists want the treasury opened up? DOGE is going to find out things. The only thing I’m concerned about is another assassination attempt. The Deep State doesn’t want things uncovered.
I’m sorry RLH but I don’t want to give the BBC 8% of its budget.
All what Anderson, the 6.9L pickup driver is able to say is ‘leftist’.
I’ll never forget a post of him in which he brazenly, disgustingly claimed that Chile’s bloodthirsty dictator Pinochet, responsible for murdering thousands of communist, socialist and social-democratic people, was a ‘leftist’.
*
” But Musk has bristled at criticism leveled at him or Doge, and has lashed out at injunctions issued by federal judges. Over the weekend, Musk promoted a series of posts that contemplated defying a court order that temporarily blocked the Department of the Treasury from giving Doge access to its payment systems. ”
I trust the Guardian 1,000 times more than the Trumping boy and Musk put alltogether.
A guy named ‘Donald trump’ is known to have been candidate for US president.
A day after he became president-elect, everybody (except his MAGA groupies) quickly understood that the new US president’s name in fact rather is Elonald Muskrump.
Blinny,
Hitler was a leftist too. He hated and murdered communists and socialists because they weren’t National Socialists, like you. Pinochet was a leftist. He was a National Socialist, like Hitler. But you know that, don’t you?
I assume that the absolute ignorance of non-American (and – who knows? – also domestic) history is typical of all true followers of Elonald Muskrump, as is their fatal tendency to distort reality.
*
Especially the 6.9-liter pickup driver is a perfect example of this – who else would think that Hitler’s Nazis had anything in common with ‘left’, communism and socialism, since in addition to 6 million Jews they murdered about a million of them, along with 1/2 a million Sinti/Roma and an incredible number of mentally/physically disabled people?
*
Elon Musk’s patted Alice Weidel – a German lesbian who lives with a foreign wife and yet is leader of the ultra-rightwing ‘Alternative for Germany’ (a party that openly glorifies Nazism and hates homosexuals and foreigners) – has also claimed to Musk that Hitler was a communist [sic].
*
Here we see who the 6.9-liter pickup driver feels really close to, right?
“DOGE is completely transparent.”
In your dreams.
“DOGE is completely transparent.”
What transparency? Have you been to the website? There is no documentary evidence of any of those claims they’ve made. There are a total 5 webpages on it, with no links to any evidence, no description of how they operate or what accountability they have.
There is a page entitled Savings. And this is all that’s on it.
Receipts coming over the weekend!
https://doge.gov/savings
5 days ago it said
Receipts coming soon, no later than Valentine’s day
https://web.archive.org/web/20250212192400/https://doge.gov/savings
What do you think the chances are of the Savings page presenting documentary evidence, instead of just announcements?
Do you think they’ll issue a correction about getting the wrong Gaza?
DOGE is exempt from FOIA laws. It replaced the USDS, which was created to improve the digital platforms (websites and applications) for government agencies.
DOGE’s function is much more sweeping, being given the remit to restructure government departments, reallocate funding and fire people while overseeing and retaining approval rights on new hires.
DOGE has a mandate to send teams of 4 with to each agency to audit the agencies and execute DOGE directives. How these teams operate, what actual legal powers they have and who they are is not disclosed. So we have unknown teams with with unknown powers and security clearances, with unknown legal authority, sent by people who were not elected or or confirmed by the representatives of the people, taking over federal agencies.
Because of its greatly expanded powers DOGE should be subject to oversight and FOIA. They are not transparent. And YOU should not be satisfied with a “just trust us” posture. Anyone that cares about government intrusion should demand DOGE be restructured to be more transparent and subject themselves.
Agencies with broad powers like this are normally created by congress, not by decree from a president. But I guess conservatives enjoy autocracies now. Separation of powers is so last year.
Amending one sentence
Anyone that cares about government overreach should demand DOGE be restructured to be more transparent and subject themselves to oversight.
I was going to direct you to the OMB wesbsite, stephen, which is another executive agency similar to DOGE in that it oversees budgeting, so that you could compare how transparent each agency is. OMB has reams of links to their structure and accountability.
Sadly, it is one of many government agency websites that the current administration has taken down. If you attempt to go the OMB website, you are directed to the Whitehouse homepage.
How is denying access to information on government agencies transparent?
No doubt the OMB website has been taken down to avoid any conflict with DOGE’s messaging.
Here is an archived page from the OMB, that names OMB officers who will take FOIA requests, how to make a request, with email addresses and phone numbers.
https://web.archive.org/web/20250117185818/https://www.whitehouse.gov/omb/freedom-of-information-act-foia/
It also provided the calendars of OMB directors, so you knew what meetings they had attended, who they called, etc.
The page also has links to all their previously provided information from FOIA requests.
THAT is what transparency looks like.
Now compare that with this:
https://doge.gov/
There are no links to documents. The home page is only a series of tweets. Really, that’s all it is. Click on that link and tell me this is how you want to get information from a government agency.
The more I look into it the worse it gets.
The home page of the DOGE website has dollar signs and Elon Musk’s branding for X all over it. This is an official government website, and the front page promotes his company.
This is stunningly self-serving and a patent conflict of interest. it’s incredible how brazenly corrupt these clowns are.
“I’m sorry RLH but I dont want to give the BBC 8% of its budget.”
Another lie. Every time you repeat what these clowns say you’re just funneling a lie. BBC Media is NOT the BBC news service.
“BBC Media Action is the BBCs international charity. Although we are part of the BBC family, we are editorially completely separate from BBC News. We are an independently funded charity, registered in England and Wales as a charity with the UK Charity Commission regulator.
We support local media, and ensure people on the frontlines of conflict and crisis have access to trustworthy information. A free and trustworthy press is essential to freedom and democracy and 75% of people around the world live in countries without a free press.
We work in nearly 30 countries and in around 50 languages and we follow the editorial values and standards of the BBC.
We rely solely on generous donors and supporters for funding to carry out our work. USAID has been one of these donors.
All of our funding goes to our own projects. It is completely separate from the journalism of BBC News. We have no influence over the editorial decision-making of BBC News.”
https://www.bbc.co.uk/mediaaction/press-releases-and-statements/simon-bishop-feb-2025
So many lies from the Trump Administration, swallowed by muppets.
“So many lies from the Trump Administration, swallowed by muppets”
Indeed.
“Ask Elon Musk, show me the 12 people that are 150 years old. He cant. Show me the 200 million that are still receiving checks. He cant. These 19-year-old nitwits from DOGE that are violating the law and plucking peoples personal identifying information, they dont know what theyre looking at,”
Martin OMalley former SS administrator said.
I think the left will eventually turn to the banks and Wall Street to try to wreck it all. They can’t infiltrate the administration like they did in Trump’s first term. Now, Trump’s appointees are more MAGA than he is. America has woken up to the collective madness of the left.
Not much of what you say is connected to reality.
Leftists didn’t infiltrate his administration. Experienced conservatives disagreed with him, and every. single. one. of those that did is immediately branded as a leftist because they were not loyal.
John Bolton is a leftist. Yeahright!
Trump’s obsequious, submissive puppet Vance not only made an incredible fool of himself during his appearance at the Munich Security Conference, he also exposed the USA to international ridicule.
The most incredible thing is what the German Foreign Minister announced in an interview on February 15: namely, that Vance’s conversation behind closed doors the day before had absolutely nothing in common with his public appearance in which he parroted Musk’s blah blah word for word.
*
The most interesting thing, however, is that while Vance arrogantly called on the Europeans to grant more freedom of speech to the (of course especially ultra-right) extremists, Elonald Muskrump simultaneously banned the AP news agency from the Oval Room and Air Force No. 1 – just because AP refused to use the worldwide unrecognized name ‘Gulf of America’ instead of the worldwide accepted name ‘Gulf of Mexico’.
*
Finally, ultimate sign of cowardice: comments on Google Maps about ‘Gulf of America’ are now… banned.
*
Poor, poor USA. How deep will you fall?
The more Trump goes after fraud and waste, the more the Left hates him.
Responsible adults understand the connection….
The only thing Elon Muskrump is going after is to remove everything that prevents him from becoming US dictator.
Only naive children like Clint R merely see the visible foreground instead of looking behind the scenes, and have yet to learn to read between the lines.
Nowhere as far as the depths Germany has descended to over the last 20 years, and of course not remotely comparable to the “bottom of the barrel” level that Germany reached twice in the 20th century. But it’s not just Germany as of late — much of Europe is in a mess (immigration, public safety, national debt, defence, cultural decadence, personal freedoms, etc.) thanks to their politicians. This was all evident to Wally the Walrus when he visited northern Europe a few years ago (as reported in various leading newspapers).
Thank goodness for the new USA administration. Hopefully they will straighten out the self-serving clowns at the EU, UN, NATO, etc.
Apart from all that, it’s endlessly amusing to see the increasing severity of Bindi-dong’s meltdowns in recent months. As we all know, Windi-Bindi is famed for his nastiness towards fellow humans who do not follow his peculiar lines of thought (although they are in fact very hard to follow). I wonder if he is still coming to grips with the Moon’s lack of annual rotation?
The G.W. is now planning a holiday in the Gulf of America, a little south of Mount McKinley.
Thanks to the human being with brain contents actually quite near to the walrus level.
Moon spins monthly about its polar axis, as hundreds of historical and contemporary scientists discovered and proved.
Ein Hoch auf Denali und den Golf von Mexiko, die Elonald Muskrump und seine bornierten MAGA groupies 100% sicher überleben werden!
GW,
Blinny is a Nazi. That should explain everything for you.
“Blinny is a Nazi”
No he isn’t.
We don’t need you here, Stephan. Please don’t come back until you’ve developed some couth and culture.
Obsequious, submissive? JD Vance? LOL…….
Ken,
Develop some couth? What are you talking about? Blinny calls for harm or imprisonment of anyone who disagrees with him and his absurd science. Ask him. That is a Nazi.
You don’t know Nazi from a hole in the ground.
Godwin’s Law applies. You have nothing to add to the discussion here. Get lost.
So, you support Blinny. What does that make you? You get lost.
The larger story is that the EU will have an emergency meeting of European leaders to discuss peace for Ukraine. It is not clear whether they are opposed to peace, or just want to make sure Putin does not win too much. He will win something. He is not going to just run home.
They do not like the idea that after 3 years of war, Trump is the one who has to show them how to make a peace deal. The fact is, that the USA has done a lot more to support Ukraine than all of the EU combined, and Trump says that well over a million dead soldiers is enough.
I would like a story book ending just like everyone else, but the war is a stalemate with nobody really gaining ground and hundreds if not thousands dying every day. Putin will claim victory. Ukraine will rebuild. Trump will fulfill his promise to stop the war (day one?), and the EU leaders will wake up to the reality that they depend on the USA for their security.
That is how deep the USA will fall to answer your question.
They do not like that they who live next to thw aggressor, Russia, and Ukraine the country who was invaded, are being excluded from the Peace talks, so far.
They also don’t like how Trump appears to be acting unilaterally, giving away Ukraine and its future security via NATO, before any negotiation even began.
They are deeply familiar with the results of Appeasement of aggressors in their history.
Update:
The propaganda reporters on CNN now have their heads exploding. US officials and Russian officials will meet in Saudi Arabia without Ukraine or EU officials. The location in not even in Europe. Oh no! How can this happen?
This is a very old concept going back to before Henry Kissinger who made it famous. It is called shuttle diplomacy. All of the interested parties will be included one at a time in different meetings and different places. This cuts down on a lot of the chest pumping and grandstanding that always happens in a large group of people with different interests and priorities. It will be a big test for Marco Rubio.
I would not be surprised if Putin and Zelenskyy never do meet face to face. There is a history of bad blood and nasty comments between them.
Stay tuned!
Trump and Hegseth have already publicly capitulated to Russia. The ‘deal’ will be that Russia gets what it wants, the Eastern province of Ukraine and no NATO alliance.
I wonder if they have spent a few seconds wondering what consequences this would have for Russian ambitions and the region. The lesson Russia will have learned is that if they invade other countries and hang in long enough no one will ultimately stop them.
If Trump is a great deal maker, why did he give away THE 2 major cards that could be used as leverage in negotiations?
Likely he’s already made the deal with Putin, and now he’ll pressure Zelensky to accede to it.
Zelensky won’t, and then Trump will blame Zelensky for the failure, instead of himself for failing to actually negotiate.
Here is some more actual news involving Zelensky himself and his personal conversation with Trump. This is a sometimes reliable source without too much media bias thrown in:
https://www.axios.com/2025/02/13/zelensky-trump-call-putin-afraid-peace-deal
Zelensky’s message to Trump was you have leverage over Putin, one source briefed on the call said.
He also told Zelensky who would be part of the U.S. negotiating team.
Three sources said the call between Trump and Zelensky was positive and went on for about an hour, longer than the call Trump had with Putin immediately before.
“Putin told you he wants a deal only because he is afraid of you, because you are strong,” Zelensky told Trump, according to the sources.
He … asked that Zelensky appoint his own negotiating team.
Trump ended the call by giving Zelensky his personal number and said he can call him directly, one source said.
They HAD leverage, before Trump made it clear that he is willing to give it away.
For what?
Meanwhile, they already talked about business deals…
..between the US and Russia.
Just imagine instead of helping the UK and France etc in WWII, we just met with Hitler to make business deals!
Tim,
A few days after that phone call…
“Zelensky had said hours before that Ukraine was not invited to participate in any peace talks, a notion which Witkoff pushed back against to Fox News’ Maria Bartiromo.
“Ukraine is part of the talks,” Witkoff said, adding, “I don’t think this is about excluding anybody.” ”
https://www.axios.com/2025/02/16/zelensky-putin-war-against-nato-trump
The peace talks have just concluded in Saudi Arabia. No Ukrainian representative was invited.
“Ukrainian president Volodymyr Zelenskyy said Kyiv would not accept the results of talks between the US and Russia in Saudi Arabia that were held “behind Ukraine’s back” on Tuesday. “It feels like the US is now discussing the ultimatum that Putin set at the start of the full-scale war,” he said after a meeting with Turkey’s president, Recep Tayyip Erdogan.”
Mark my words, Tim. The Trump administration has already capitulated to Russia, and the ‘deal’ they offer will be what Russia wants. They’ve already said it publicly – before they even entered negotiations.
My bad. I left out 2 important quotes from the link. Some may not have had the time to read it. It seems that Trump is serious about having Europe take more responsibility for their own defense. 8 years ago he successfully strengthened NATO by threatening to pull out if they did not meet their obligations. Most of the NATO countries are now meeting their obligations rather than just relying on the USA to defend them.
Here are the quotes. This could have something to do with the EU holding emergency meetings:
While Trump and Defense Secretary Pete Hegseth this week ruled out NATO membership for Ukraine, or sending in U.S. troops to guarantee Ukraine’s security, Trump expressed support in the call for a European peacekeeping force, the sources say.
The U.S. president told his Ukrainian counterpart that he understands Ukraine will need security guarantees as part of any future deal, and that he thinks a European peacekeeping force along the front with Russia could be one solution, the sources said.
I read all that. I do open links, Tim.
So as well as giving Russia what they want, Trump will leave Europe to police what he and Russia foist on Ukraine.
Some might see this as great America First deal-making. But the rest of the world will see the US (Trump) capitulating to Russia, abandoning Ukraine and the spirit of the UN Charter, and then running from the mess they leave.
I now realize Bindidon may be on to something here. Who benefits from allowing the war to continue. It is not Putin, he is getting weaker in every way. It is not Ukraine, they are dying. It is not the US, we are spending a lot of money and depleting our stockpiles.
The EU benefits from a weakened Russia. They are perfectly happy to let us fund the war effort. More to the point, they may not really want Ukraine in NATO after all. It is a liability. They already have Turkey, and that does sit well with all of the members.
I do not know if there a difference between the public statements and private conversations, but it is thought provoking.
The EU have had three years to come up with a plan,i use the word plan, but it is nothing more than a knee jerk reaction,maybe if the EU and others had not been so keen on helping activists remove an elected government,pro Russian or not,this whole mess could have been avoided, as an aging Brit, i find it amussing that our self serving PM now thinks he can have influence , i am not a fan of Putin,but unless some one was prepared to talk to the man ,nothing will change.Sanctions were a huge propaganda boost for Putin,but that was the wests only responce , not a good idea with the EU and the rest of Europe depending on Russian gas.sanctions dont work. and since the formation of BRICS they have zero effect, BRICS will soon have more economic clout than all the western economies put together.Trump may not be every ones cup of tea,but he is a quick learner, keep your friends close,and your enemies even closer.Jaw Jaw, is better than War War, Winston Churchill.two quotes our pathetic bunch of Leaders should take heed of.they should all read, Down To A Sunless Sea, a novel by David Graham, it might give them pause for thought,but given there silly view on Climate , i wont hold my breath.
Tim believes in Trump the peacemaker.
But he just blamed one of the parties for starting the war, and for being a dictator-run country.
Guess which one:
Yep, Ukraine.
https://thehill.com/homenews/administration/5151545-trump-ukraine-zelensky-war-russia/
This alteration of the past reminds me of the book ‘1984’.
‘Oceania is (now) at war with East-Asia, we have always been at war with East-Asia.’
It is amazing that the fake news media and other bottom-dwellers will take an extremely ill-advised comment and blow it up to mean something different. One of my primary concerns with fake news is the sound bite. They will recklessly take a single sentence out of context. The fact is that context matters.
Here is the full quote from The Hill. Is Trump suggesting that Ukraine fired the first shot or dropped the first bomb, or did he use the wrong language in one sentence while making the point that negotiation was possible? People can debate whether negotiation was possible or not. Nonetheless, that clearly was the point Trump was making. Don’t listen to the fake news or take the word of bottom-dwellers.
Here it is:
[Trump vowed to end the war during his presidential campaign and on Tuesday repeated his claim that the war would never have started if he had been president. He spoke after U.S. and Russian officials met in Saudi Arabia, without Ukrainian officials.
I think I have the power to end this war. And I think its going very well, Trump told reporters at Mar-a-Lago on the heels of the meeting.
But today I heard, Oh, well, we werent invited. Well, youve been there for three years, Trump continued, referring to Ukraine. You shouldve ended it in three years. You should have never started it. You could have made a deal. I could have made a deal for Ukraine that would have given them almost all of the land, and no people would have been killed, and no city would have been demolished and not one dome would have been knocked down. But they chose not to do it that way.
Trump went on to rail against former President Biden as so pathetic before again criticizing Zelensky.
Look, you have leadership and I like him personally. Hes fine. But I dont care about personally. I care about getting the job done. You have leadership now thats allowed a war to go on that should have never even happened, even without the United States.]
“Sen. John Kennedy, R-La., said he disagreed with Trump’s suggestion that Ukraine was responsible.
“I think Vladimir Putin started the war,” Kennedy said. “I also believe, from bitter experience, that Vladimir Putin is a gangster. Hes a gangster with a black heart”
https://time.com/7259420/trump-calls-zelensky-dictator-tensions-rise-over-russia-ukraine-war/
Anderson Cooper, who was once a highly respected journalists, is on CNN tonight behaving like a child. He had a long segment proving that Russia really did start the war. They have proof!
If you take the sentence “You should have never started it”, and replace it with “You should have never [allowed it to start]”, which is clearly what he meant in context, then everyone can go back to behaving like adults. People can then debate what he meant to say, which is wrong anyway. They don’t have to lie or present fake news.
The fact is that there was a long period of buildup and people did try to talk to Putin. I seem to recall that President Macron of France was criticized for traveling to Russia and meeting with Putin at some point. There was a lot of effort. Trump claims he could have done better, and now claims he still can. That is the story.
After the meeting in Riyadh, Rubio said it was only a start and “all parties have to agree”. We can assume that includes Zelensky and the EU.
Trump has another good point that most everybody thought the invasion was done deal until Ukraine was able to fight back against Putin’s extremely poor invasion plan. It was only then, that military assistance was considered, and then at a pace that was too slow to be effective. The Europeans had to debate every new weapon system that was proposed. They seemed to be afraid of Putin. Trump is not.
“They seem to be afraid of Putin. Trump is not”
Evidence?
The fact that Trump has given away the key bargaining chips to Putin, says something else.
The fact that NATO was greatly strengthened in last couple of years says something else.
Appeasement is the easy way to ‘peace’.
Here is an example of someone making a fool of themself while trying to appear relevant.
I made a statement of fact:
[It was only then, that military assistance was considered, and then at a pace that was too slow to be effective. The Europeans had to debate every new weapon system that was proposed.]
That was immediately follow by my comment as follows:
[They seemed to be afraid of Putin. Trump is not.]
Then I get this in response:
[Evidence?]
Really? Why make a comment just to appear relevant, when the result is to appear completely irrelevant?
After Trump suggested Ukraine started the war, and called Zelensky a dictator…
“Foreign Minister Sergey Lavrov stopped short of referencing the attack on Zelensky but applauded Trump for saying previous American support of Ukraine’s bid to join the NATO military alliance was a major cause of the war.
‘He is the first, and so far, in my opinion, the only Western leader who has publicly and loudly said that one of the root causes of the Ukrainian situation was the impudent line of the previous administration to draw Ukraine into NATO,’ Lavrov said.
‘No Western leaders had ever said that, but he had said it several times. This is already a signal that he understands our position.’ ”
maybe Trump misspoke? The point is that every European leader and most of the rest of the world thinks he meant that Ukraine started the war. Many have corrected him.
If he didn’t mean it he should correct it, instead of giving the impression he is Putin’s lapdog.
But he isn’t a statesman. He won’t correct it, and it is likely he has fully soaked up the Russian propaganda and is just parroting it. He is hitting all the Russian propaganda notes correctly, as if he read them right off Russia Today.
He is giving full support and comfort and validation to a brutal dictator. If he thinks Russia started the war, he should clarify his words, so as not to aid any further this enemy to international peace and democracy. that’s what a real statesman would do.
But he’s not a statesman, he is a salesman and a bully, and he’ll align with any one he thinks is strong. All you have to do is observe who he admires most.
For Trump, might makes right. That is it.
Tim,
The way your mind draws inferences from available facts is so often a great mystery.
The facts I stated make it abundantly clear why I questioned your post. But of course you ignore inconvenient facts.
Another one is that the available weaponry to Ukraine in the early part of the war was sufficient for them to stop and push back the powerful Russian military, and thus survive to bravely continue their defense.
“Sen. Thom Tillis took to the Senate floor Thursday afternoon and denounced Russian President Vladimir Putin while alluding to comments by President Donald Trump that Ukrainian President Volodymyr Zelenskyy is ‘a dictator’ and that Zelenskyys actions have ‘led Millions unnecessarily’ to die.”
https://www.newsobserver.com/news/politics-government/article300696264.html
One or two Senators are brave enough to speak their mind.
” Blinny is a Nazi. ”
It was 100% predictable: the 6.9L pickup driver resorted to his usual perverse lies.
No wonder that sometimes I happen to hope that some extremely tough descendants of those many Germans, who died in Hitler’s GESTAPO dungeons after horrific tortures, will search for the 6.9L pickup driver, find him and teach him ‘in situ’ in the most brutal way possible (but without killing him) what Nazis were really like.
Alternatively, they could put him on a plane to experience as near as possible what happened to over three thousand democrats shortly before their gruesome death when they were thrown over the Atlantic in one of the famous ‘vuelos de la muerte’ by the henchmen of the Argentine ‘left’ dictator Jorge Videla.
There’s the Nazi coming out. Blinny always shows his stripes. This ones not afraid of you Nazis.
Dumb, dumber, dumbest, … Anderson.
Thanks 6.9L pickup driver for showing your mental level. Frogs would say when looking at your brazen, stubborn, perverse stuff:
” Plus bête qu'Anderson tu crèves. “
Pressure is building from members of the UK and international scientific community to expel Elon Musk from the Royal Society. Musk was elected a fellow of the UK’s national academy of sciences in 2018.
Elon Musk’s fellowship of the Royal Society is utterly incompatible with the fundamental values of the Royal Society, and it does a disservice to the entire UK scientific and academic community to maintain his fellowship.
There is no room at the Royal Society for Musk who stands against the core principles of supporting science, the environment, and human rights.
The Royal Society makes a major mistake in aligning with the likes of Elon Musk who suffers from too many ethical lapses to enumerate. Let’s not make the mistake of supporting someone who has supported brazenly racist statements, is engaged in illegal activities in the American government and will be relegated to the dustbins of history.
https://en.wikipedia.org/wiki/Royal_Society
Ark,
What does Musk’s politics have to do with his contributions to science and technology? Also, do you think Musk cares?
Musk’s behavior is damaging to the Society’s reputation and goes against its values. Therefore, to protect the integrity and credibility of the institution, he should be expelled.
So, was Prince Charles expelled when he ran around on his wife?
His behavior? That’s funny. So trying to keep the US from going bankrupt is bad behavior?
Ark,
where are you from?
Who said ‘Trust but verify’, Stephen?
With Musk, much of the country does not trust that he has their interest in mind or heart.
And because Congress has relinquished their power, there is no way to verify.
Nate,
Too bad Trump and Musk are two steps ahead of the looney left.
Stephen will enable the next President to give another billionaire keys to the Treasury and the IRS.
Maybe it’ll be George Soros.
That be ok with you, Stephen?
stephen p anderson,
It would appear that your brain is just a jellyfish in the ocean of your head. Good luck with that.
ARK: Well, you’re certainly an expert on ethical lapses. Your posts on Roy’s blog in recent years show poor judgement in all matters of consequence, from science to politics, probably because you adopt “identity politics” rather than look into any subject throughly and independendly. For a start, try reading JoNova’s blog today on the Royal Society’s idiocy. It may improve your shallow perspective (which you bring to all topics, accompanied by boring pretentious rhetoric). The big problem with the Royal Society has been itself.
HA HA HA HA…
No thanks.
How ’bout you be you and I’ll be me.
Check out the DOGE website home page.
https://doge.gov/
Dollar signs and X branding are all over it. It’s nothing but a bunch of tweets. Really, that’s all it is. The links on the tweets direct you to X.
The director of DOGE is promoting his private company on the home page of the agency – an official government website. And oh yes, there is a ‘Follow on X’ button at the top.
Stunning.
barry
Stunning? Why?
What else could we expect from people like Elon Musk and – indirectly – from Elonald Muskrump?
Both of them are egomaniacal and megalomaniacal to an immeasurable degree. And above all, nothing about them reminds me of what I understand as ‘grown-up’. Both remind me more of children of very rich parents.
It will take at least a decade to reconstruct what these two will have destroyed in four years.
Yes, they’re finding billions of dollars, fraud and waste.
And, it’s only beginning….
Your heroes are crooks and liars, Clint, and they are going to ruin the US if the system of checks and balances fails.
The DoJ is now actually being weaponised, and a replay of Nixon’s Saturday night massacre has just occurred. Attorneys on both sides of the political spectrum have resigned after being ordered to dismiss a case for political reasons.
Yep. And in the time of Nixon, Congress had the ability and the balls to hold the President accountable.
Not anymore. Now they have self-castrated.
Barry,
Ahhh, typical leftist, harkening back to the days of Watergate, when the Republicans were a bunch of feckless bluebloods.
“Republicans were a bunch of feckless bluebloods.”
Yeah, like that famous leftist, Barry Goldwater, who talked Nixon into resigning.
The events speak for themselves. There have been far more resignations in today’s Saturday Night Massacre, and for the same reason.
We are rapidly descending to the level of muck-slinging and name-calling that Roy warned about recently. There is no need, on this site, to be arguing over Trump and his excesses. Certainly not to the level of bringing Nazi comparisons into it.
There has been an obvious emotional bent to the polarized nature of discussions here. However, we have managed, to an extent, to keep it fairly civil.
Can we get back, voluntarily, to civilized exchanges before Roy has to read the riot act again? Or, would we prefer that he close the site to comments?
Gordon, what a joke!
YOU are the biggest blog-clogger here. You never have any science. You only have YOUR OPINIONS about science, which are 90% WRONG. And you can’t learn.
So in frustration you sling insults and false accusations. YOU are the one with the muck-slinging and name-calling:
https://www.drroyspencer.com/2023/12/uah-global-temperature-update-for-november-2023-0-91-deg-c/#comment-1584186
Now, clog the blog with another 500-word rambling hodgepodge of misinformation.
binny…”Moon spins monthly about its polar axis, as hundreds of historical and contemporary scientists discovered and proved”.
***
There is a parallel here to climate alarm. This is exactly what the fellow was talking about in Eben’s video. People are settling for obfuscated answers from authority figures when the real answer is totally obvious.
A car driving around an oval has an equivalent motion to the Moon moving in its oval orbit. The mechanisms (forces) are different but the actual motions are identical. The car on the oval always keeps the same side pointed at the oval centre and so does the Moon.
If you reduced the COG motions of each to vectors, the vectors would be identical except for the scalar components.
If the car rotated once on its COG per revolution of the oval, all sides of the car would point to the oval centre. That is called ‘a 360’ in track vernacular. It means the tires have lost grip on the track, allowing the car to rotate 360 degrees about its COG. That is what is being claimed for the Moon but with the car, it would have to slowly lose control while spinning through 360 degrees in one revolution of the oval track.
It’s hard to imagine a car doing that over the entire oval since friction between the car tires and the asphalt would limit the motion. Also, at the speed required to produce a spin-out, the rotation would be fast and abrupt, leading to a rotation off the track It is conceivable that with the right surface and a controlled spin, the car could spin exactly once per orbit of the oval.
Anyone who cannot see this analogy is mired in the realm of an authority figure who cannot understand the problem. Same with climate alarm. Those who support the notion are caught in the clutches of pseudo-scientists who don’t understand the problem either.
“the car could spin exactly once per orbit of the oval.”
As it does.
all sides of the car point to people in the crowd.
Movement like a ball on a string could be described in two ways:
a) Rotation about an external axis with no rotation about an internal axis (one single motion).
b) Translation in a circle with rotation about an internal axis (two motions).
Both a) and b) could apply, regardless of frame of reference. Wrt an inertial reference frame, the a) or b) description could apply. Wrt a rotating reference frame, the a) or b) description could still apply to the overall movement. Therefore, reference frames do not resolve the issue of which description, a) or b), should apply to movement like a ball on a string.
Or, I can put it even more simply:
Overall movement like a ball on a string could consist of either one, or two motions. Whether it is to be described as consisting of one or two motions does not depend on frame of reference.
Anyone who disagrees is wrong.
“Anyone who disagrees is wrong.”
As are you.
What I wrote is correct. Just making sure it is understood that reference frames are not the issue. Looks like the thread above was going down that wrong path.
SOLAR MINIMUM UPDATE
In a surprising announcement, Louisiana’s surgeon general announced late Thursday that the state health department “will no longer promote mass vaccination.”
https://abcnews.go.com/Health/louisiana-health-department-stop-promoting-mass-vaccination/story?id=118819674
Happy Valentine’s Day!
” People are settling for obfuscated answers from authority figures when the real answer is totally obvious. ”
Says a boastful pseudo-specialist
– who incessantly engages in 360 degree denial (greenhouse effect, global warming, virus detection, time dilation, evolution, relativity, lunar spin, etc., etc.)
and
– whose most recent authority figure he always highly vaunts not only denied the existence of measles viruses, but also brazenly and falsely twisted a Supreme Court decision – by insinuating that the Court supported his denial, which of course it did not at all).
–
*
Simple-minded people cannot understand that although our Moon shows us the same face every night, it does so in a completely different place and on a completely different trajectory.
*
Cassini was the first to compute the lunar spin’s sidereal period and the inclination of the lunar spin axis wrt the Ecliptic; Newton agreed to him, as can be seen in his Principia (Book III, Prop. XVII, Theorem XV).
*
But Cassini did not publish his results in a treatise; 75 years later, Mayer however did. I posted the link to his treatise many times on this blog, in which he published in 1750
– numerous observations of the positions of the lunar crater Manilius (using a small telescope and a self-made micrometer)
and
– the computation of the lunar spin’s period, using spherical trigonometry, with an incredible accuracy (27.321665 days instead of the contemporary 27.321661 computed using LLR data).
*
Instead of endlessly repeating their alleged ‘proofs’ (car on an oval track, merry-go-round, ball-on-a-string, MOTL-MOTR, etc. which appear for what they are: useless pseudoscience), all these people should disprove the scientific results obtained by Mayer, Lagrange, Laplace, d’Alembert and hundreds of those who refined the historical results during the following centutries.
*
But… they all will never be able to do that – because they lack technical skills and scientific education.
Instead, such ignoramuses claim that since centuries, not one astronomer, mathematician or physicist observed nor even computed any lunar spin about its polar axis; they all merely observed and computed the lunar orbit around Earth.
Denial without proof is childish behavior.
For interested readers
List of historical and contemporary references to treatises and papers about Moon’s spin around its polar axis
https://drive.google.com/file/d/13DRDH1OFOUHYM_6HKH19sbj28yckJMF7/view
A 1000 links won’t change science, Bindi.
This issue has been thoroughly discussed. The conventional concept has been completely debunked. As with the CO2 nonsense, people don’t want it solved.
If one understands orbital motion, then the Moon issue goes away. Cassini’s “laws” are NOT laws of physics. They are beliefs of astrologers. They can easily be disproved with a simple coffee cup and a pencil.
People don’t want their false beliefs exposed. We see this with the Moon issue and the CO2 nonsense. Now, we’re seeing it as the fraud and waste in GOV is being exposed. The Left hates reality.
“The conventional concept has been completely debunked.”
No it hasn’t.
Sorry RLH, but it’s been completely debunked. You just don’t know enough science to understand.
Remember the simple vector problem you couldn’t understand?
Remember your pathetic attempt to come up with a “viable model of orbiting without spin”?
Trailing after me childish remarks ain’t science.
Maybe Clint can regale us with his luney tall tales-like the one where the Moon has no angular momentum, or maybe the one where the far side of the Moon moves at the same speed as the near side!
DoJ is now making decisions for political reasons. 2nd in command accepted a resignation from a Trump-appointed Federalist (deeply conservative) attorney at the DoJ, who couldn’t comply with a nakedly political order, and told her that she should have complied with Trump’s policy directives instead of relying on her understanding of the constitution. As the order went down the line, attorneys kept resigning rather than comply, until one stepped forward only to end the massacre.
The radicals in the Trump administration are so zealously ideological that they keep saying the quiet part out loud.
https://edition.cnn.com/2025/02/14/politics/eric-adams-justice-department-tick-tock/index.html
Project 2025 is the policy direction of the Trump administration. Increase the power of the presidency and staff the executive branch with loyalists. These people want a king-president.
barry, you weren’t concerned with Biden’s perversion and corruption of GOV. But this Administration starting to fix things has you in another panicked meltdown.
It’s fun to watch….
Barry,
Trump is the chief law enforcement officer in the land. He can decide who gets prosecuted and who doesn’t. Eric Adams was prosecuted because he didn’t tow the Democrat line. Yes, he might have accepted gifts he shouldn’t have, but name one politician in Washington, besides Trump, who doesn’t do that.
Trump.
Can you hear yourselves? For years the right has been accusing Biden of weaponising the justice department, and now that Tr4ump is doing it, you just turn right around and say that this is ok.
“Trump is the chief law enforcement officer in the land. He can decide who gets prosecuted and who doesn’t.”
What a weird idea. The executive branch enforces the law. It does not order the DoJ who to investigate. The separation of powers is in the constitution and several laws that affirm DoJ independence.
It is on this basis that accusations against Biden were levelled.
But if you think that the president can use the DoJ as their private police force and court, then why were you complaining about Biden using the DoJ like this? How could he weaponise an agency that you believe is already mandated to do his bidding?
Because you have one standard for Trump, and one for everyone else.
Barry,
Again, go back to civics class. You’ve obviously never taken American civics. Garland did Joe’s bidding. The DOJ works for Trump now. It is just another department like the State Department, no different.
“The DOJ works for Trump”
Now.
“Garland did Joe’s bidding.”
Where is the documentary evidence of that?
I can quote Trump over and over again publicly calling for the DoJ to investigate Hilary Clinton, Hunter Biden and other political rivals.
Bill Barr is on the record saying Trump pressured him to go after his political rivals. I can quote him for you.
The guy who replaced Barr, Acting Attorney General Rosen is on the record saying that Trump pressured him to declare the 2020 election was corrupt. Rosen quoted Trump:
“Just say the election was corrupt and leave the rest to me and the Republican Congressmen”
I can go on and on.
Now, what similar evidence do you have that Joe Biden directed the DoJ to undertake any investigation or prosecution? You don’t have any public calls from Biden. You don’t have DoJ officials saying that he did it. So where do you get your ‘evidence’ from?
Republican politicians and operatives that themselves offer zero evidence?
Yes, the DoJ is not part of the judiciary. But because it is an instrument of law its operation is independent of the executive, in keeping with the separation of powers. The president establishes administrative policies and agenda. A president can prioritise the illegal drug trade, or human trafficking. But they cannot direct the DoJ to undertake or drop specific investigations.
Attorneys at the DoJ take an oath to uphold the constitution. The oath says nothing about doing the president’s bidding.
“The DOJ works for Trump now.”
It takes on his policy agenda. It does not operate as his personal attorney.
Adams was being prosecuted by a staunch Republican attorney for bribery and fraud.
The Republican prosecutor resigned because they were ordered by the 2IC of the DoJ to file for dismissal, based on the idea that the mayor would be unable to execute Trump’s immigration policies, which the mayor agreed with.
Basically, the DoJ was helping a Trump ally.
The Republican prosecutor pointed out that the reason given by the DoJ for dismissing the case amounted to a quid pro quo arrangement where charges would be dropped so that the president’s immigration agenda would be implemented by the mayor.
She resigned. Her co-prosecutor, also a Republican and Iraq war veteran, wrote his own letter to the DoJ explaining his resignation. It is very much worth reading to learn what the values of a real Republican are.
“Mr Bove,
I have received correspondence indicating that I refused your order to move to dismiss the indictment against Eric Adams without prejudice, subject to certain conditions, including the express possibility of reinstatement of the indictment. That is not exactly correct. The U.S. Attorney, Danielle R. Sassoon, never asked me to file such a motion, and I therefore never had an opportunity to refuse. But I am entirely in agreement with her decision not to do so, for the reasons stated in her February 12, 2025 letter to the Attorney General.
In short, the first justification for the motion – that Damian Williams’s role in the case somehow tainted a valid indictment support by ample evidence, and pursued four different U.S. attorneys – is so weak as to be transparently pretextual. The second justification is worse. No system of ordered liberty can allow the Government to use the carrot of dismissing charges, or the stick of threatening to bring them again, to induce an elected official to support its policy objectives.
There is a tradition in public service of resigning in a last-ditch effort to head off a serious mistake. Some will view the mistake you are committing here in the light of their generally negative views of the new Administration. I do not share those views. I can even understand how a Chief Executive whose background is in business and politics might see the contemplated dismissal-with-leverage as a good, if distasteful, deal. But any assistant U.S. attorney would know that our laws and traditions do not allow using the prosecutorial power to influence other citizens, much less elected officials, in this way. If no lawyer within earshot of the President is willing to give him that advice, then I expect you will eventually find someone who is enough of a fool, or enough of a coward, to file your motion. But it was never going to be me.
Please consider this my resignation. It has been an honor to serve as a prosecutor in the Southern District of New York.
Your truly,
Hagan Scotten Assistant
United States Attorney”
These aren’t leftists foaming at the mouth. These are traditional Republicans who remain faithful to the constitution.
https://en.wikipedia.org/wiki/2025_U.S._Department_of_Justice_resignations
“Trump is the chief law enforcement officer in the land. He can decide who gets prosecuted and who doesnt”
In other words, Stephen is fine that justice is no longer blind. He trusts that Trump will prosecute only the people that Stephen hates.
stephen, if you really think the Democrats would turn the US into a socialist enclave, then you should be totally against what the Trump administration is doing in gutting the checks and balances against executive power.
Because there will one day be a Democratic president, and this administration will have removed the fetters that kept the socialist zealots from changing the US.
Do you really not see that Trump et al are removing obstacles to the will of the executive? If congress legislates these changes, as they might with the Republican party providing no resistance, then the next president will have far more power than any before, and if you really believe what you say about Democrats, that should make you very worried.
Barry,
Give me one example where he is gutting the checks and balances. He’s doing exactly the opposite. Instead of ignoring the court which he can do because the Judge in NY is acting unconstitutionally, he is appealing the ruling. And, wasting time might I add.
1. He removed 17 inspectors general, whose job it is to independently audit the federal agencies of the Office of the President they are assigned to.
2. He fired enough members of oversight committees (only the Democrats) that also audit these agencies, so that they could not meet their quorum, which completely disempowers them.
3. He fired several hundred members of the FAA after the helicopter/plane collision, compromising oversight on air safety. Turns out the helicopter was at fault, not the commercial airliner.
4. His DoJ has undertaken numerous initiatives to seek political vengeance on the judicial branch, most notably demanding the names and activity history of anyone in the FBI who worked on any Trump case, with the suggestion of mass firings.
5. He is firing, or having one of his departments fire, anyone whop dares to speak or act against against the president’s agenda. At the DoJ in the last few days, there have been mass resignations in the face of an order to comply with a political directive.
6. He and his allies have attacked judges that have ruled to delay or dismiss some executive orders, which undermines the separation of powers, and the independence of the courts as arbiters of law.
I don’t know if you realize it, but this habit of Trump’s is not normal. Historically presidents do not comment on the judiciary, and certainly don’t wage campaigns against rulings they don’t like. This entire mode of behaviour undermines the third co-equal branch of government, that provides a check on the other two (congress and the presidency).
7. Every funding freeze, or impoundment of congress-authorised payments is a violation of the constitution, which charges the president to faithfully carry out the duly enacted laws of congress. Richard Nixon attempted to argue in a multitude of court cases that the president had authority to withhold some or all of congressionally authorised payments. He lost every case, and Congress afterward passed the Impoundment Control Act to make clear to future presidents that this is illegal. Trump is now seeking to overturn that ruling.
You can see Trump’s own words on using impoundment in his campaign brief.
https://www.donaldjtrump.com/agenda47/agenda47-using-impoundment-to-cut-waste-stop-inflation-and-crush-the-deep-state
8. He has given DOGE, Elon Musks’ agency, the keys to the treasury, and extensive powers to restructure and defund congressionally mandated government departments and agencies,bypassing standard legislative and oversight procedures. Decisions are being made with no documentation that can be publicly accessed (tweets are NOT documentary evidence), no oversight, and without being subject to FOIA. All these are pillars of checks and balances that DOGE is immune to.
9. DOGE has accessed the private, sensitive information of US citizens, which crashes through the checks and balances that protect them (YOU) from government intrusion into their private data.
10. By centralizing significant authority within DOGE and enabling it to operate with minimal external oversight, the Trump administration has effectively weakened the traditional separation of powers. This consolidation allows for unilateral decision-making without the customary checks from legislative and judicial branches.
There’s a lot more, but this is surely sufficient to make the point?
Thank you Barry for your search for irrefutable facts.
You’re obviously not from the US and never took a course in civics and completely misunderstand the system of checks and balances. Go listen to Professor Dershowitz’s youtube channel where he discusses checks and balances. He voted for Biden but agrees completely with what Trump is doing. The left’s strategy of divide and conquer isn’t working too well, is it?
Barry,
Again, give me an example of where Trump is not applying or misusing the system of checks and balances.
So you agree he is gutting the system of checks and balances? Is that why you have now changed your challenge?
The “irrefutable facts” are easily refuted.
Just take #3 — “He fired several hundred members of the FAA after the helicopter/plane collision, compromising oversight on air safety.”
barry implies the employees were fired because of the crash. The FACT is they were fired because they were new hires under Biden’s effort to pervert/corrupt the FAA. One of the positions was “environmental protection specialist”! The FAA’s mission is air safety, not some WOKE agenda to “save the environment”.
What will barry try next?
“give me an example of where Trump is not applying or misusing the system of checks and balances.”
Trump can’t “apply” or “misuse” the system of checks and balances. He is or should be subject to them. He is not their author.
Do you not understand your own constitution? The separation of powers (congress, executive, judiciary) is enshrined in the constitution. The Bill of Rights provide checks and balances on government’s power over the people.
In the more than two centuries since the constitution was ratified, there have been numerous laws detailing and strengthening the checks and balances. The Impoundment Control Act was a more recent law, which forbids the president freezing funds that have been appropriated by congress.
Trump broke that law when he froze funds recently in a number of agencies. Various courts – the judiciary – have ordered him to stop, but still funds were held back. I linked for you Trump’s 2024 campaign platform of using impoundments. He had already signalled he was going to defy the law.
Trump withheld funds from Ukraine in his first term, breaking the Impoundment Control Act, for which he was impeached.
In this way, I suppose you could say he “misused” checks and balances, in that he ignored them completely.
His recent tweet says it all.
“He who saves his Country does not violate any Law”
He thinks checks and balances don’t apply to him.
There really is a lot more on Trump’s overreach.
In one of the most bizarre turn of events, recently Trump dismissed the entire board of trustees of the Kennedy Arts Centre, and replaced them with his political allies and their wives. Whereupon he was unanimously elected by them to be chairman of the Kennedy Arts Centre, and he will do the programming.
The board of trustees for decades had been made up of an assortment of presidential appointees from both parties, and because of its bipartisan appointments was meant to be non partisan.
Trump has in one stroke installed his cronies who made him chairman.
Pure megalomania.
Or should that be MAGAlomania?
Barry,
Again, grasping at straws. He couldn’t have replaced them if he didn’t have the authority. You somehow believe Trump exercising his authority, I repeat, his authority, is overreach. Biden didn’t overreach. He violated the Constitution. Trump isn’t, so far.
Of course he has the authority.
In this case the ‘checks and balances’ was customary. No president before Trump dismissed the entire board and replaced them entirely with political allies. Biden, Bush, Clinton, Reagan, Carter, they all left some of the other president’s picks on the board so that it would have legacy and political balance. And no president ever installed their pals to make themselves the chairman of the board.
Trump just came in and upended the table to set his own.
In the UK the government has an arms length approach to the Arts. They don’t tell the arts what to do. It’s the basis of freedom of speech and dissent that the arts sector shines a light on the society housing it, even if that light isn’t very flattering.
In this move Trump has muted freedom of speech and squashed dissent because he will now program what goes on at the Kennedy Centre.
Another incredibly self-serving bit of demagoguery. Just adding to his power portfolio.
He couldnt have replaced them if he didnt have the authority.
He did.
“Biden didnt overreach. He violated the Constitution. Trump isn’t, so far.”
As long as Trump freezes funds without notifying or getting approval from congress, he is in direct violation of the constitution, which enjoins the president to faithfully execute the laws. This is why those actions have been reversed by the courts.
The people behind Trump pushing these freezes are trying to remove the checks and balances on presidential power. The new head of the OMB is a Project 2025 author, and he wants to remove the power of congress from the purse strings.
“Four years ago, on the last day of Trump’s first presidency, Russell Vought and Mark Paoletta, who then, as now, served as top budget officials, wrote in a 14-page letter to a congressional committee that a 1974 law asserting Congress’ powers over the purse was “an albatross around a President’s neck.” In another part of the letter, they said that the president “must be permitted to take time to consider how to best execute” spending federal dollars and that “if that requires a temporary pause in spending, it must be permitted…”
In New York, a top accounting official wrote that, as of Wednesday, the state could not access money that low-income people use to buy groceries, a block grant for maternal and child health services and nearly $6 million in education funding. In New Mexico, the official who heads services for the elderly and disabled adults said further spending pauses could force them to stop delivering hot meals.”
https://www.propublica.org/article/trump-administration-funding-freeze-workarounds
Trump tweeted:
“He who saves his Country does not violate any Law”
Even though it’s been clear since his first term that he believes he is above the law, it’s still gob-smacking to witness him say it out loud.
Standard dictator talk.
All of them, from Caesar, Mussolini, Hitler, to Putin and Assad said similar things.
Nate,
Go back to civics class. The DOJ is not part of the Judicial Branch. Also, not prosecuting Adams is not a miscarriage of Justice. It is righting a wrong. You somehow believe Biden was above the law but Trump is below the law. Typical leftist.
You somehow believe Biden was above the law but Trump is below the law.
Only you believe that.
https://www.justice.gov/about
Here’s what the Justice Dept states are their principles:
“The mission of the Department of Justice is to uphold the rule of law, to keep our country safe, and to protect civil rights.
Our Values
Independence and Impartiality. We work each day to earn the publics trust by following the facts and the law wherever they may lead, without prejudice or improper influence.”
“Also, not prosecuting Adams is not a miscarriage of Justice.”
False. The Trump appointed lead prosecuter resigned because she stated that the case against Adams was strong.
Hence she wanted to “follow the facts and the law wherever they may lead, without prejudice or improper influence.
Most of you who post here aren’t US citizens. You don’t give a rat’s ass about the Constitution. You hate Trump because he’s in the way of your crazy climate agenda. Trump is in the process of dismantling the Department of Education. I think he will go after agencies like the IRS, EPA, and FBI. Hopefully, it isn’t too late to go back to something closer to what our founders intended.
Yes, he is in the process of dismantling many government agencies. We’ll see how much damage he does. He’s already had to oops! rehire the people who were working on nuclear weapons.
These people don’t know what they’re doing.
You think Trump bothers my “climate agenda?”
Hang on. Are you like, 17 or something? Do you really think I’m all about climate?
If I was all about climate I would have talked about Trump’s attack on climate change stuff.
No, I’m watching Trump (actually the people around him) attempting to draw more power to the presidency than it has ever had. The people advising him are Project 2025 people, who fervently believe the power of the presidency should be far greater than it is. He literally has a dozen of the authors and advisors of this document in key positions of his administration.
No joke, I can name them.
stephen, do yourself a favour and read the following to understand what is driving the flurry of presidential activity over the last month.
https://en.wikipedia.org/wiki/Project_2025
Latest news.
https://www.youtube.com/watch?v=S6ZQfFTID14
“what the founders intended”
Which was quite specific: they did not want a King. Thus they gave the President limited powers. And they gave the rest to Congress and the Courts.
They did not envision that Congress would simply hand over their powers, as they are doing now, to the President, making him a King.
“Most of you who post here arent US citizens. You don’t give a rats ass about the Constitution.”
On the contrary.
I think one of the most amazing things about the US is that in many and varied institutions an oath is sworn not to the country or to the government, but to the constitution.
Even the military swears to defend the constitution. So does the DoJ, SCOTUS, most (all?) state judicial branches, governors, secs of state, congress members etc.
Most people in government branches and subsidiaries with authority swear allegiance to the constitution. They swear allegiance not to the state, but to the ideals that govern it.
So does the president.
Make The Constitution Great Again
Barry,
You are a piece of work. I firmly believe leftist have this abberant gent that interferes with their thought processes. You believe up is down and down is up. Again, why don’t you study history and civics? What about Roosevelt during WWII? Was he acting tyrannical? Or Lincoln? Was he acting tyrannical. Our situtation as a nation is as dire. But, no, you apparently want no reduction in the size of government. You want large federal agencies to do the left’s bidding. Barry, what has socialism ever done. It produces nothing. It only takes from one and gives to another, inefficently, I might say, according to the planners and masterminds who think they know better than nature. Does socialism work in nature? Does socialism work in economics? Is socialism efficient?
Sorry, aberrant gene.
Barry,
You’d have much more credibility if you had posted about Biden’s abuse of the Constitution. You, not a peep.
When Stephen runs out of answers to Barry’s valid evidence on the President’s unconstitional actions, he returns to name-calling usually attaching ‘Leftist’ or ‘socialist’ to anyone opposed to these King-like power-grabs.
Again and again he suggests that the policies he likes are a fair trade for giving unchecked power to one man.
I don’t agree Biden abused the constitution, but that may be because it is some arcane thing I haven’t noticed. I don’t see a constitutional issue with the border or immigration. I think his pardons were an abuse of power.
Why don’t you spell it out for me? You mentioned student loans. I know a court banned them. Was this an unconstitutional act?
“Our situtation as a nation is as dire.”
The situation in the US is as dire as WWII? Gimme a break.
The analogy with the pre civil war strife may be more apt, but it is the right who are up in arms, not the left. What’s the slogan? “A revolution back to normal?”
Trump’s EOs are based on the notion of a national emergency, which gives the executive broad powers. The US is in no more danger than it has been for the last 20 years, but stirring up fear and crying alarm is the usual cover for despots.
“But, no, you apparently want no reduction in the size of government. You want large federal agencies to do the lefts bidding.”
I am perfectly fine with reducing government waste, bloat and corruption. I don’t want the fed to do the bidding of the left but work for the betterment of the people, which is the point of a democratic government, or any system of governance with modern values. Agencies should be no larger than required to meet the goals set out in legislation. Legislation determined by a democratic process in congress voting on it.
But the current administration has the meither the interest nor the capability of taking a scalpel to the institutions of government. They are overriding congressional appropriation, and they are hacking and slashing at agencies and screwing it up.
A perfect example is that they fired hundreds of nuclear safety workers, whose work includes matters of national security, and had to rehire them when they were made aware of the error. DOE heads had tried to prevent them, but as usual they were ignored by DOGE’s team. Unfortunately DOGE had locked the fired employees out of their official communication channels and couldn’t contact them, so they had to ask the National Nuclear Security Administration to contact them on their private emails.
This ham-fisted slash and burn is reckless. DOGE has to keep walking back their ill-researched claims (like mistaking Gaza in the ME for Gaza in Mozambique) and actions. Department heads are trying to warn them and prevent them doing damage, but the administration removes anyone who gets in the way. The administration is deaf to the people with years of experience that could help them navigate streamlining the bureaucracy. They are seen as the enemy. Of course, they are not.
These people in DOGE and the administration are ideologues and klutzes. There’s no way they could do proper reviews of government spending in a matter of days. The fact that their entire “documentation” for the people is presented on a social media platform that is owned by the head of the agency clearly indicates their shoddy attention to detail and their corrupt ideas about transparency and accountability. It is stark, almost comically blatant. Are they really so ignorant of how an official government body should operate?
I don’t think they are. i think they are just so arrogant that they don’t feel a need to put any effort into transparency or accountability. Fire off some tweets with the screenshots of documents and voila! Here is your archive of the newly created and most powerful agency of the federal government.
I read a tweet where someone tweeted some DEI language in a government institution. What documentation followed describing the actions undertook? A capture of the tweet and and one word. Fixed.
This is an epic joke.
Elonald Muskrump should soon give order to remove two bidened, disturbing sources of misinformation.
*
1. Rutgers Snow Cover
https://drive.google.com/file/d/1SOaXDMyp-ELNhE370LB41xfOQwN2_UiA/view
Source
https://climate.rutgers.edu/snowcover/files/wkcov.nhland.txt
*
2. Arctic sea ice extent
https://drive.google.com/file/d/1zduPq2XEOZgj6X3CLezp2OZvEPgVAhac/view
Source
https://masie_web.apps.nsidc.org/pub/DATASETS/NOAA/G02135/north/daily/data/
rlh…”the car could spin exactly once per orbit of the oval.
As it does.
***
Richard, old chap, a spin or a rotation about an axis requires an angular momentum about that axis. If the rotating body lacks a rigid axle, it can be described as rotating about a centre of gravity, as is the case with our planet, which rotates once every 24 hours about its COG.
Spin, as you put it, or rotations about a COG, requires an angular momentum about that COG. The tires on the car prevent such a rotation about the COG. Ergo, the only way for the car to spin about its COG is for the tires to lose grip on the track surface. When that happens, the car does actually spin, out of control, about its COG. It’s out of control since the steering wheel no longer functions to keep it moving with an instantaneous linear velocity even though an experienced driver can use the steering wheel to minimize the effect of the spinning car.
The actual motion of the car, under control, on the oval, is described by Newton as curvilinear motion. In the case of the Moon, he described it as the natural linear motion of the Moon in its orbit, converted to curvilinear motion by Earth’s gravitational field. At each instant, the Moon’s orbital motion is purely linear and tangential to the elliptical path it creates and the effect of gravity it to tug (re-orient) the velocity vector slightly to re-orient it into an orbit.
Such a re-orientation is not rotation wrt the Moon’s COG, it is a re-orientation wrt the distant stars. Same with the car on the oval. Although its velocity vector is re-oriented through 360 degrees per lap, due purely to the car’s steering mechanism, the re-orientation is not wrt the car’s COG, it is wrt to an observer inside or outside of the track.
Hence the motion observed is not rotation about the car’s COG, hence cannot be classified in physic’s terms as a rotation or spin. It can be. however, as Newton described, a curvilinear motion.
Note the distinction between re-orient and rotate. You spinners fail to grasp the difference between a body in an orbit continuously re-orienting its linear tangential vector wrt to the stars and a body, like the earth, actually rotating on an axis while performing the same curvilinear motion.
Note…the Earth does not keep the same face pointed at the Sun.
In the case of the car on the oval, the steering mechanism provides the curvilinear motion as the turning front tires convert the car’s natural linear motion into a curvilinear motion. The driving wheels can only power the car in a linear direction. The purpose of the steering mechanism is to redirect the resultant linear momentum in a curvilinear motion.
Same action with the Moon, just a different mechanism at play.
There can be no rotation about the car’s COG, otherwise the car would spin out, in the vernacular, and begin rotating about its COG.
If such a car does spin out, the rotation is on top of it’s natural linear motion. That is, the car continues in a linear direction while spinning about its COG.
“The tires on the car prevent such a rotation about the COG”
Maybe you are not a driver Gordon. Drivers understand that turning the steering wheel turns the tires, and the car turns!
It can even turn 180 or 360 degrees!
“a spin or a rotation about an axis requires an angular momentum about that axis.”
As it does.
RLH says:
”As it does.”
A totally meaningless point as that angular momentum is also included in the moon’s rotation around the earth. The fact that one can attribute it to either place is basic physics. But the non-spinner position is that as long as the moon orbits the earth as part of a cohesive system its best and more logical to attribute that angular momentum as being around the COG of earth. As systems and objects breakup some angular momentum will be redistributed to linear momentum depending upon how it breaks up.
Thus both linear momentum and angular momentum or indestructible forms of energy whose character changes based upon the ”glue” that holds the system or object together.
Thats why mathematically one can attribute the angular momentum of orbiting and rotating bodies where ever one chooses.
We have discussed all sorts of balls on strings, floating bowls on larger spinning bowls, merry-go-rounds ad nauseum. Yet the spinners remain 100% indoctrinated without any valid argument not already recognized by the non-spinners whom choose to look at the larger system and distinguish that angular momentum of the orbit separately from the angular momentum of say earth which both orbits the sun with one angular momentum and spins on its own axis with another, manifested by the differences between days and sidereal days.
Yet the spinners remain religiously devoted to their viewpoint. Why? One might ask. The only answer appears because they are sycophants of their chosen daddy’s and most likely even misinterpret what they think their daddy told them as they tend to do on every topic. I am not including you RLH in that though but your skepticism on this particular topic tends to lean in that direction.
clint…”YOU are the biggest blog-clogger here. You never have any science. You only have YOUR OPINIONS about science, which are 90% WRONG. And you cant learn”.
***
Clint, old chap, you are one of the sole reasons Roy’s blog is teetering on the edge of oblivion wrt to posters being allowed to comment. Roy read the riot act to us re cleaning up our negative acts and you cooperated for a bit and now you are back to the same bitter, cynical comments.
You were banned once, for attacking Roy directly, and managed somehow to butt-kiss your way back into Roy’s good books.
Re your link, you have never participated in a discussion with me re the points you mention. Your idea of a discussion is a one-sided diatribe featuring your misguided opinions. For some reason, after I backed you solidly on certain points, you turned on me, making you a back-stabber of the highest order.
I stand by what I claimed in the post at your link, and I know I am right.
My replies were as follows…
1)Clint saysheat is not energy, it is a measure of the transfer of energy. Since the energy being transferred is heat, then heat is a measure of heat, in Clints limited understanding of science.
2)Clint saysflux is not energy, according to Clint it is an undefined concept he blows out of his butt.
3)Clint believes electrons, which are negatively charged particles, flow from positive to negative.
4)Clint saysentropy is a measure of disorder. The equation for entropy as defined by Clausius, who invented entropy, is stated as S = integral dq/T. No reference to disorder, only heat, dq.
4)?? make it 4a)…Clint saysan IR thermometer measures heat directly. An IR thermometer detects infrared frequencies from a source. It cannot detect heat directly.
5)Clint thinks a change in direction of a vector constitutes an acceleration. Yet I can be represented by a vector as I run an oval track. I can keep my velocity constant on the straight portions and the curves, where the vector must change direction and there is no acceleration present. Even when the vector changes 180 degrees in direction between straight sides of the track, acceleration does not change if I run at a constant velocity.
6)Clint thinks a watt can measure anything from temperature to a massless entity like electromagnetic energy. The watt is a unit of mechanical energy that relates the work down to a time period over which the work in done. There are 746 watts in 1 horsepower and I seriously doubt that anyone would be so stoopid as to measure EM in HP.
WellClint is that stoopid.
Clint does not get it that heat stated in units of the watt is not a measure of heat per se but a measure of the amount of work that can be done to produce a quantity of heat. Clausius pointed this out some 180 years ago but Clint has not caught up yet.
7)Even though Neils Bohr went to a great deal of trouble explaining the concept of electron transitions in atoms, Clint seems to be one of the few naysayers who fail to grasp the concept. I have been meaning to ask him if he thinks the Earth is flat.
Clint thinks there is a magical box in an atom or molecule that generates and absorbs EM.
gordon, doubling down on your insults and false accusations just means your therapy isn’t working.
I am already enjoying the world-renowned astronomy ‘specialists’ endlessly posting their nonsense on this blog: namely, when they start teaching Musk’s astronomy specialists at Space X that their figures for the lunar descent/ascent procedures, which of course have to take into account Moon’s rotation (4.7 meters/second at its equator), are completely wrong because they ‘know’ that the Moon does not rotate on its polar axis at all.
On va bien s’amuser, croyez-moi!
You are mistaking a re-orientation of the velocity vector of the Moon with a rotation on its axis.
The re-orientation is natural wrt the stars as a body undergoing curvilinear motion in an orbit, while keeping the same face pointed to the earth, orbits the Earth.
There is no local rotation about an axis through the Moon.
Please try replying to the facts rather than trotting out a line of authority figures who have not thought the problem through.
I repeat for the dumb, opinionated pseudoscience replicator:
I am already enjoying the world-renowned astronomy specialists endlessly posting their nonsense on this blog: namely, when they start teaching Musks astronomy specialists at Space X that their figures for the lunar descent/ascent procedures, which of course have to take into account Moons rotation (4.7 meters/second at its equator), are completely wrong because they know that the Moon does not rotate on its polar axis at all.
” Please try replying to the facts (????) rather than trotting out a line of authority figures… ”
Tell that to Space X’s astronomy specialists.
Meanwhile, it’s amazing to see you writing about ‘authority figures’.
Your latest ‘authority figure’ is Dr Stefan Lanka who utterly lied about the ruling of Germany’s Bundesgerichtshof’ (Supreme Court) in 2016.
I have proved that so many times but like every person suffering of dementia, you always ignored the fact.
You are such a laughable boasting ignoramus, Robertson.
You perfectly know that this blog, lacking any moderation, is the one and only place where you can post such permanent, daily utter nonsense.
…and I repeat, for a dense Frenchman banished to Germany, that Musk’s boys and I are in agreement. The near face of the Moon’s tangential plane does re-orient through 360 degrees per orbit, but the degrees measured are wrt the stars, not a local rotation.
Think of yourself standing on a platform that can rotate. What does it take to cause your body to rotate on the platform? A force must be applied tangentially to the platform to cause your body to rotate on the platform.
Now imagine this rotatable platform attached to a device in a concentric slot in the track so the entire platform can move around the track. You stand on the platform facing north and the platform is locked so it cannot rotate. As the platform is driven around the track the platform cannot rotate but you would face every direction (re-orient) of the compass during a 360 degree orbit of the track.
That is not rotation about a local axis!!! Dremt described it accurately as a rotation about an external axis. Rotation requires an angular momentum about an axis and with the device described above, there can be no angular momentum about an axis since the platform is locked so it cannot rotate.
“Nate, is orbit the motion like the MOTL, or the MOTR? That is the issue. Nothing else matters.”
All else, that I summarized above, addresses just that issue. Apparently you simply choose to ignore these facts and logic.
It explained clearly that there really is not a free choice here to change the meaning of standard words to suit your desires.
You said yourself, there is more than one meaning for the word “orbit”. We’re not talking about it meaning “path”. We’re talking about it meaning “motion”. MOTL or MOTR. That sort of motion.
Every time you tell me that “orbit” is just a path, or “orbit” involves motion of the CoM, you are just dodging the issue, completely.
“Spinners” version of “orbit” (MOTR) plus “spin” equals movement like the MOTL.
“Non-Spinners” version of “orbit” (MOTL) plus “spin” equals movement like the MOTR.
“Spinners” version of “orbit” (MOTR) plus 366.25 “spins” equals movement like the Earth.
“Non-Spinners” version of “orbit” (MOTL) plus 365.25 “spins” equals movement like the Earth.
https://www.drroyspencer.com/2025/02/uah-v6-1-global-temperature-update-for-january-2025-0-46-deg-c/#comment-1699362
When Nate starts losin’, he starts calling my winning arguments “talking points”, as if that somehow dismisses them.
No argument much less logic presented.
When he starts flat out lying, you know it’s over.
The fact is, in the sub-thread below I’ve made some of the clearest arguments I’ve ever made for why reference frames are not the issue, and exactly what I mean by that. It’s not my fault if you refuse to understand them.
If “orbit” is motion as per the MOTL, then “spin” rate must be quantified wrt a rotating reference frame.
If “orbit” is motion as per the MOTR, then “spin” rate must be quantified wrt an inertial reference frame.
That is the correct way round to look at it. If you look at it the other way around, and say:
“Spin” rate must be quantified wrt an inertial reference frame, therefore “orbit” is motion as per the MOTR.
You would be defining “orbit” based solely on “spin” rate – a property of the other motion! You would not at all be considering what “orbit” actually is, i.e. what motion the force and momentum involved in “orbit” actually produces!
“Nate, gravity produces no torque on a sphere.”
Yep, so you claim to understand, but keep ignoring.
“We are talking, after all, about orbit without spin. Why would I be arguing that gravity produces torque on the sphere, making it spin”
Pure obfuscation by use of your ‘spin’!
When we both discussed the physics behind Orbit, you suggested gravity could conspire with to turn (re-orient) the body to always face the center.
While I pointed out that for a body to change its orientation requires torque, which gravity does not provide, and you agreed.
No mattwr what you want to call that orientational change, that’s what we are talking about.
Please try to focus and avoid getting yourself all confused with the labels.
Nate, please try to comment in the correct place.
Above post in wrong place. Arrggh.
“If orbit is motion as per the MOTL, then spin rate must be quantified wrt a rotating reference frame.
If orbit is motion as per the MOTR, then spin rate must be quantified wrt an inertial reference frame.
That is the correct way round to look at it. If you look at it the other way around, and say:”
So you say, but without offering any sound rational for using the first.
“Spin rate must be quantified wrt an inertial reference frame, therefong pf orbit is motion as per the MOTR.”
You would be defining orbit based solely on spin rate.”
Not all. Here you are AGAIN ignoring all the facts you have been given on the historical meaning of the word ‘orbit’, and the physics based rationale for defining orbit as the position vs time without regard to orientation.
Then, when we account for orientation of a body in space we use the inertial frame to measure its change, as we dp for all other motions!
To use a rotating frame for just this motion makes absolutely no sense, and thus no one in Astronomy does that.
Sorry Nate, but defining “orbit” as “position vs. time” does not settle the issue either way. It’s just a dodge.
So you say, while dodging all the points I made in the post.
We can see that you still have no sound rationale to convince anyone to change how we define Orbit.
I have (again) successfully explained why reference frames are not the issue. All you have to do is concede that point, and that a ball on a string is not “spinning”. I’ll wait.
And the dodging continues!
This time by changing the subject.
It is obvious that the jig is up.
The subject is, “are reference frames the issue?”
The answer is, “they are not”.
Concede to proceed.
False, the subject of recent posts was ‘what is an orbit?
Only because you insist on steering the conversation away from the original subject. Me and barry were talking about “are reference frames the issue?”
You then jump in and try to take over, as usual. You’re just after whatever it is you want from a discussion. No interest in staying on topic. No intention of ever conceding anything. Mostly just wanting to contradict anything I say.
In any case, there are two motions that are the backbone of the moon issue. You can call them whatever you want, but one of them is “spin” and the other one is either motion like the MOTL or the MOTR. Don’t want to call it “orbit”? Then don’t. I’m not the one who is overly focused on semantics. That would be you. “Orbit without spin” usually works fine.
Sorry Bindi, but if Moon were actually spinning on its axis, we would see all sides of it from Earth. You just don’t understand orbital motion.
You can bet Musk understands that.
Got a viable model of “orbiting without spin” yet?
Feel free to use the simple ball-on-a-string. There’s no patent or copyright on it….
” You can bet Musk understands that. ”
If you had ‘balls between the legs’, you would ask the Space X specialists and post their answer in a way anybody sees it’s real.
But since you obviously lack them, you will prefer to continue spreading your endless lies on this unmoderated blog.
If you can supply a reliable contact addy for spacex I’ll be happy to contact them.
“if Moon were actually spinning on its axis, we would see all sides of it from Earth.”
From the same vantage point we see the sun orbiting the Earth.
Perhaps we shouldn’t rely on this vantage point for our understanding of celestial mechanics.
Nobody is suggesting that we do, barry.
Once again, reference frames are not the issue:
https://www.drroyspencer.com/2025/02/uah-v6-1-global-temperature-update-for-january-2025-0-46-deg-c/#comment-1698614
“Nobody is suggesting that we do, barry.”
Really?
Clint: “if Moon were actually spinning on its axis, we would see all sides of it from Earth”
…which is not a suggestion that we should rely on this vantage point for our understanding of celestial mechanics.
It’s inherent in his point. The Earth (and the line from it to the moon) is the only vantage point where we don’t see all sides.
Except for the above the poles, where you would definitely see rotation.
No, barry, it is not inherent in his point at all.
Switch the vantage point to one like this:
https://upload.wikimedia.org/wikipedia/commons/5/56/Tidal_locking_of_the_Moon_with_the_Earth.gif
Any good “Non-Spinner” could tell you that the “moon on the left” (MOTL) is not spinning. Anything that moves differently to the MOTL would then be spinning.
Vantage point is irrelevant. Reference frames are not the issue.
Yeah, flat out denial doesn’t really make your point.
“if Moon were actually spinning on its axis, we would see all sides of it from Earth.”
If you don’t understand that this invokes an Earth-bound perspective to check the rotation of the moon, then you are simply blind.
And if you can’t work out that the moon does show “all sides” from nearly any other perspective, then you’re incredibly dim.
But you are neither blind nor dim, just obstinate.
barry, the point I made, which you carefully avoided responding to, is that a “Non-Spinner” can judge if an orbiting object is spinning or not from a vantage point outside the orbit just as easily as they can from a vantage point within the orbit. Reference frames are not the issue.
None of that is what you challenged me on in the first place, which YOU are now avoiding by saying “Look over here at what I said spinners think.” Don’t be a weasel.
Clint’s argument was that, viewed from the Earth, the moon doesn’t spin. You said you didn’t see that argument being made. Because you are obstinate, not blind.
You’re a non-spinner, so stop spinning.
I’m happy that the point I made refutes the central premise of your argument, and settles the issue. I have no need to respond to your false accusations and hyper-aggressive tone.
(The central premise of barry’s argument is that “Non-Spinners” are reliant on an Earth-based vantage point for their “understanding of celestial mechanics” – more specifically, whether or not an orbiting body is spinning – and since I pointed out that “Non-Spinners” can tell if an orbiting object is spinning or not from a vantage point outside the orbit as well, that premise is refuted)
“The central premise of barrys argument is that Non-Spinners are reliant on an Earth-based vantage point for their understanding of celestial mechanics”
Yes indeed your teammates Gordon and Clint are reliant on it.
Both you and Clint have defined ‘spin’ as rotation wrt a rotating vector connecting Earth’s center and the Moon. Which is obviously a rotating reference frame.
The ‘observation’ of a non-spinning Moon from the Earth vantage point using the rotating reference frame, has been the only physical rationale ever given to support the non-spinner model
No, Nate. They are not reliant on it. Just ask them to identify which of the two GIFS, MOTL or MOTR, is spinning. They will both tell you, “MOTR”. Thus, they are not reliant on an Earth-bound vantage point to discern if an orbiting object is spinning or not.
“Both you and Clint have defined ‘spin’ as rotation wrt a rotating vector connecting Earth’s center and the Moon. Which is obviously a rotating reference frame.“
Incorrect. “Spin” is just rotation of an object about an internal axis, and must be kept separate from “orbit”.
Reference frames are not the issue.
“The ‘observation’ of a non-spinning Moon from the Earth vantage point using the rotating reference frame, has been the only physical rationale ever given to support the non-spinner model”
Ridiculous.
“Incorrect. Spin is just rotation of an object about an internal axis, and must be kept separate from orbit.”
which is vague, and does not tell us what spin = 0 means.
How do you determine when spin=0, without referring to the rotating line connecting Earth to Moon, as Clint explicitly did (then you did not disagree)?
“Ridiculous”
The proof is that lately, whenever you have been asked for a sound science rationale, to support the claim that the Moon is not spinning, you have nothing to offer.
I have already explained a number of times in the past that to actually quantify the spin rate of the orbiting body, “Non-Spinners” must use a rotating reference frame. However, that is a consequence of the fact that “orbit” is as per the MOTL. It is not the reason “Non-Spinners” realise “orbit” is as per the MOTL.
In other words, reference frames are not the issue. The issue is, and always has been, is “orbit” motion like the MOTL, or the MOTR?
You know very well that you and I disagree on the meaning of ‘spin’ in the context of the Moon in orbit.
But we don’t disagree on the fact the the Moon has rotation (orientational change). I keep trying to use language we agree on.
While you keep insisting on substituting in the vague word ‘spin’, which can only have one purpose: to obfuscate.
So again I ask, why are you evading agreeing with your previous ‘one motion’ stance?
What are you afraid of?
“is not the reason Non-Spinners realise orbit is as per the MOTL.”
Then this is a prime opportunity to give us the reason. A sound science rationale.
“The proof is that lately, whenever you have been asked for a sound science rationale, to support the claim that the Moon is not spinning, you have nothing to offer.“
Nothing but the preceding 50,000 comment discussion, over eight years. Take a look through it, and find all the sound “science rationales” you need. Your recent “science rationale” for the “Spinner” viewpoint turned out to apply equally to the “Non-Spinner” position. So, you’re not doing too well yourself on that front.
The spinners are consistent in defining spin = 0 wrt to the inertial frame, regardless of the orbital motion.
The non-spinners define spin =0 in reference to the orbital motion, without a clear scientific reason for doing so.
All recent discussion on that had to do with devices and mechanisms unrelated to
Plantary motion.
“The spinners are consistent in defining spin = 0 wrt to the inertial frame, regardless of the orbital motion…”
…which automatically treats “orbit” as though it were motion like the MOTR. But, that doesn’t mean that “orbit” actually is motion as per the MOTR.
What sound scientific rationale do you have for thinking “orbit” is motion like the MOTR?
False. There is no link between rotation and orbit whatsoever.
Only your team links them, without rationale to do so.
Nor can your team find any source that concurs with your vague definition of spin.
What I wrote is not “false”, Nate.
“which automatically treats orbit as though it were motion like the MOTR.”
Non-sequitur. MOTL, MOTR, and the path of Halley’s Comet are all orbits.
The rotations of these bodies are all different.
You can either agree that my 9:15 AM comment is correct, or the discussion is over.
Bullying won’t get you anywhere near the truth. Sorry.
If you have no sound answers, then quit pushing your absurd argument, and head for the hills.
There has to be limits, Nate. You seem to just disagree for the sake of disagreeing. My comment is obviously correct. If you are not going to admit that, why bother?
At the end of the day, you are desperate to talk to me. Not the other way around.
”
The spinners are consistent in defining spin = 0 wrt to the inertial frame, regardless of the orbital motion
which automatically treats orbit as though it were motion like the MOTR.”
This makes no sense to me. And it never made sense to me.
Orbit is the translational motion of a body on a path in space. It tells you where in space the Moon is going to be tonight.
Rotation is separate variable. It tells you what the Moon’s orientation will be tonight.
A body has an orbit, and it can also have rotation or not, without affecting the orbit, just as it can be red or whit without affecting the orbit.
My 9:15 AM comment is correct. There is nothing to discuss until you understand it, and accept it.
“Rotation is separate variable. It tells you what the Moons orientation will be tonight.”
And as is standard for astronomy, they will not measure that orientation wrt to the Earth vantage point as Non-Spinners do, but wrt the inertial frame, and determine that the Moon has a steady rotation rate and tilted axis of rotation.
There is no logical reason for Astronomy to then return to the Earths vantage point to decide its spin.
That would differ from how it treats all other bodies and would unduly complicate its description.
Again, quantifying the “spin” rate wrt an inertial reference frame automatically treats “orbit” as being motion like the MOTR. But, that doesn’t mean “orbit” actually is motion like the MOTR.
Just repeating yourself.
“I have already explained a number of times in the past that to actually quantify the spin rate of the orbiting body, Non-Spinners must use a rotating reference frame.”
And for our Moon, that frame is rotating at a varying rate, because of the eccentricity of the Moon’s orbit.
To use that rotating frame to find ‘spin’, we need to subtract the frame’s rotation rate from the Moon’s steady rotation rate. This would give a ‘spin’ that is varying, and not 0 throughout the orbit.
Of course physically this makes no sense. The Moon is not spinning at a variable rate over its orbit.
I am just going to be repeating myself until you either agree with that comment or stop responding, yes.
The rest of us have to make convincing arguments.
But you are exempt?
Your assertions should just be accepted, regardless of their illogic.
Got it.
Sorry, Nate, but the minimum requirements for discussing the moon issue are that you understand your own position. Like it or not, the “Spinner” position is that “orbit” is motion like the MOTR. That is what you have to defend. If you cannot be bothered to, neither can I be bothered to argue against you.
I understand my positions very well. And they are in agreement with 300 years of development of Astrophysics.
All the planets are in orbits. Their motions are that of bodies in orbit.
The rotation of the body is independent property, like color, topography, mass.
Kepler had no knowledge of the planets rotations. Yet, he could perfectly describe their orbits.
I’m just baffled why you would tell me that I think only the MOTR is an orbit.
When I obviously don’t.
“Spinners” think “orbit” (one single motion) is motion as per the MOTR. Thus, every other possible type of movement in an enclosed loop that you can think of (including, for example, movement like the MOTL) involves “orbit” and “spin” (two motions). That is their position.
Spinners think orbit (one single motion) is motion as per the MOTR.”
False. As explained a body’s orbital motion is its position in space vs. time, and has nothing to do with its rotational motion or orientation.
The position or orientation of a body are measured in the inertial frame of the stars.
I have already stated that a body in orbit can ALSO have rotation (spin), such as Earth, Mars, or the MOTL.
In sharp contrast, you want to measure the orientation of a body wrt the planet it is orbiting and measure spin in a rotating frame of reference.
This undoes the effort of Astronmers to measure all planetary motion in reference to the inertial frame.
As explained this leads problems, like a
time varying spin rate. And mixing of rotations in different planes.
It is not done. And has no point.
Nate, the “Spinner” position is as I outlined. Not just the first sentence, which is all you have quoted and responded to, but the whole thing.
You cannot even accept what your own position is!
I’m sorry, but this discussion is just absurd. I have better things to do with my time.
“The position or orientation of a body are measured in the inertial frame of the stars…”
…doing so automatically treats “orbit” as being motion like the MOTR. But, that does not mean “orbit” actually is motion like the MOTR.
Nate, either find some “scientific rationale” for the idea that “orbit” is motion as per the MOTR, or the discussion is over (and you were wrong, again).
Look you are just repeating your unproven assertions, while ignoring the contradictory facts.
In 1919 Tesla had a golden opportunity to convince Astronomers to adopt the non-spinning Moon.
But he failed to convince them. Because, it makes no sense for Astronomy.
And you are hardly Tesla. Thus you haven’t convinced anyone.
There are two separate motions in this discussion, “orbit” and “spin”.
If you quantify “spin” wrt an inertial reference frame, you automatically treat “orbit” as being motion like the MOTR. The reason for that should be obvious to anyone who can mentally add two motions together, but assuming you lack that ability, I will try to explain.
Take movement like the MOTL. If, as the “Spinners” assert, that movement consists of two motions, then those motions must be your “orbit” and “spin”. The “spin”, quantified wrt an inertial reference frame, would be said to be occurring at a rate of once per “orbit”, in the same direction as the “orbit”.
Now, remove the “spin” from that movement. What are you left with? Movement like the MOTR. That, then, is your “orbit” as a single motion. That is the “Spinners” idea of “orbit”, exactly as I’ve been saying. It must be, for the MOTL to include “orbit” and “spin”, at the rate and direction claimed.
Further, if you try to claim that your concept of “orbit” is just a path, rather than being a motion, that is rendered false as soon as you claim that “spin” should be quantified wrt an inertial reference frame. Since, as we saw, the spin rate of the MOTL (when quantified wrt an inertial reference frame) was once per “orbit”, in the same direction as the “orbit”, and that leaves only motion as per the MOTR when the “spin” is removed from the overall movement.
So “orbit” is clearly, then, a motion and not just a path, and it is motion like the MOTR according to “Spinners”.
“If you quantify ‘spin’ wrt an inertial reference frame”
and Astronomers consistently use the inertial frame for all motions, positions, orientations, axis orientations.
“you automatically treat orbit as being motion like the MOTR.”
No. I don’t know why you have so much trouble with this. ‘orbit’ is a motion like that of the MOTL or Halleys comet, or Neptune.
How do you explain why Kepler could find the orbits of all the planets while knowing nothing about their rotations.
Obviously learning later about the planetary rotations changed Nothing about the orbits.
“No“
Wrong, Nate. I just fully explained why. I wrote an entire comment on it, and you simply ignored it. This is how you operate:
1) Quote me stating the claim.
2) Repeat your objection to the claim.
3) Completely ignore all parts of the comment that actually substantiate the claim.
It’s really something to watch.
The position you have to defend is that “orbit” is motion as per the MOTR. Your problem is, you know you can’t actually defend that. So, you refuse to accept that it’s even your position.
“Further, if you try to claim that your concept of orbit is just a path, rather than being a motion, that is rendered false”
Strawman. The dictionary has it both ways.
“as soon as you claim that spin should be quantified wrt an inertial reference frame. Since, as we saw, the spin rate of the MOTL (when quantified wrt an inertial reference frame) was once per orbit, in the same direction as the orbit, and that leaves only motion as per the MOTR when the spin is removed from the overall movement.”
Where is this purely semantic game going?
Spin is and should be quantified wrt the inertial frame. Get over it.
That makes it independent of orbit. They do not affect each other.
While in your view, you make quantifying spin dependent on the orbit, for no conceivable reason.
You measure spin and planetary orientation wrt their
It’s not semantics, Nate. Call the two motions you think are present in movement like the MOTL whatever you want. Call them “Geoffrey” and “Bob” rather than “orbit” and “spin”, if you want. If “Geoffrey” and “Bob” are both present in movement like the MOTL, then only “Geoffrey” is present in movement like the MOTR.
Thus, the MOTR is “Geoffrey” as a single motion, from your perspective.
Because you measure spin and planetary orientation wrt an observer on the orbited body.
Again, this is not measuring that motion in the inertial frame, as Astronomers seek to do for all other motions.
The only conceivable purpose that serves is to model the orientation of the Moon from the Earth vantage point.
Wrong again, Nate. Since “orbit” is as per the MOTL, a rotating reference frame must be used to quantify “spin”.
Reference frames are not the issue. The issue is, and always has been, is “orbit” motion like the MOTL, or the MOTR. That consideration comes first, always.
“Call them Geoffrey and Bob rather than orbit and spin, if you want. If Geoffrey and Bob are both present in movement like the MOTL, then only Geoffrey is present in movement like the MOTR”
I have already clearly stated that an orbiting body can have spin or not. The MOTR has no spin.
However both MOTL and MOTR have the same orbit. They are both orbits.
While you have been striving to get me to say that only MOTR is an orbit.
I don’t agree, as I’ve thoroughly explained, they are independent variables.
If that is what you think, Nate, then you have not been paying attention to what I’ve been saying. No surprises there.
So I think we can agree that an orbiting body can have spin or not.
Then where are you going with that?
1) Scroll up.
2) Carefully re-read everything I have said. Take your time. Relax. Do not feel the need to knee-jerk respond. Take a few days, if you need.
3) Once you understand, and have agreed with my 9:15 AM comment, discussion can continue.
“Once you understand, and have agreed with my 9:15 AM comment, discussion can continue.”
This is the way a spoiled child argues.
I gave you my logical reasons why I don’t agree. Such as:
“However both MOTL and MOTR have the same orbit. They are both orbits.”
which you offer no rebuttal to.
So go back, read my reasoning, understand it, then make a proper, non-bullying, response.
I don’t need to rebut something I agree with. Of course, both the MOTL and the MOTR are “orbiting”. However, only one of them is just “orbiting”.
The “Spinners” think “orbit” is motion as per the MOTR.
“Of course, both the MOTL and the MOTR are orbiting. However, only one of them is just orbiting.”
OK.
“The Spinners think orbit is motion as per the MOTR.”
No. Bait and switch.
As I stated both MOTL and MOTR are orbits. An orbit can be like either one or many others, because the orbit has nothing to do with the rotation.
Deal with it.
Do I need to go back to calling it “orbit without spin” for you to understand, Nate?
I assumed your English comprehension was better than that.
Then finally your point is..?
https://www.drroyspencer.com/2025/02/uah-v6-1-global-temperature-update-for-january-2025-0-46-deg-c/#comment-1699032
Re-phrasing so Nate can understand:
“The spinners are consistent in defining spin = 0 wrt to the inertial frame, regardless of the orbital motion…”
…which automatically treats “orbit without spin” as though it were motion like the MOTR. But, that doesn’t mean that “orbit without spin” actually is motion as per the MOTR.
What sound scientific rationale do you have for thinking “orbit without spin” is motion like the MOTR?
Overall point: reference frames are not the issue. The issue is, whether “orbit without spin” is motion like the MOTL or the MOTR. Always has been the issue, always will be.
That is the only point relevant to my discussion with barry, and is thus the only point that needed to be made.
Discussion over.
“What sound scientific rationale do you have for thinking orbit without spin is motion like the MOTR?”
Where have been for this whole discussion? Not paying attention.
The orientation of the MOTR is obviously fixed when appropriately measured in the inertial frame. Therefor it has no rotation (spin) which like all other motions is measured in the inertial frame!
Orbit, the position vs time of the body, for both MOTR and MOTL is the same.
Nate will not understand why that is circular logic.
And, I don’t have the time, patience, or inclination to attempt to explain it to him.
Discussion over.
Translation: DREMT has another feeling that he cannot adequately explain.
Enjoy your retirement.
No feeling, Nate, the logic is definitely circular.
Briefly (since you baited and I’m in a hurry), if you state that spin must be quantified wrt an inertial reference frame then it obviously follows that “orbit without spin” will be motion as per the MOTR. However, that doesn’t mean that “orbit without spin” actually is motion as per the MOTR. It just follows from your initial premise. So, your conclusion is embedded in your premise. You actually need a reason, separate to any consideration about “spin”, for why “orbit without spin” is motion as per the MOTR. You know, something to do with the physics of orbital motion itself.
Discussion over.
“if you state that spin must be quantified wrt an inertial reference frame”
Yep, Astronomy’s goal for centuries has been to determine planetary motions in that frame. Eg separate them from the Earth vantage point.
There is NO sound reason to treat rotation differently, by measuring it and only it from the Earth vantage point.
Good reason.
…unless “orbit without spin” is motion as per the MOTL. In which case, all of astronomy’s efforts, though useful, would be wrong.
I guess Nate realised that his logic was circular, then. He still has no reason why “orbit without spin” should be considered to be as per the MOTR.
Discussion over.
“There is NO sound reason to treat rotation differently, by measuring it and only it from the Earth vantage point.”
It’s nothing to do with the “Earth vantage point”, though, Nate. In practice, all “spin” rates would be worked out the same way they always have been…then just subtract 1. So, for the Earth, 366.25 times per orbit would become 365.25 times per orbit, etc. Nothing complicated.
Discussion over.
“Nothing complicated.”
Sure if one chooses to ignore all the complications introduced by your model for no good reason, as discussed above.
I notice the pattern from you is:
‘The discussion is over’, then
‘One more point’, then
‘The discussion is over’, then
‘One more dig’
On and on.
How bout we just agree that the whole discussion matters, and not just what is said last.
I want the discussion to be over, as I just want to get on with my life…but you just keep baitin’ for more. For you, each time you enter a discussion on the moon you want resolution to the entire issue. I just want to correct the misrepresentations on whatever sub-topic has been raised, and move on.
The only thing that matters is whether “orbit without spin” is like the MOTL, or the MOTR. Reference frames are not the issue. I don’t see why, having successfully made that point, which is the only one relevant to my discussion with barry, that this sub-thread can’t be finished.
Discussion over.
As I predicted? there would be one more one more patting yourself on the back.
“Reference frames are not the issue. I dont see why, having successfully made that point”
Not at all true. Throughout this thread it should have become clear that reference frames were central to the discussion. Astronomy’s reason for defining spin as they do was to put this motion, along with all other motions i into the inertial frame. As thoroughly explained.
Still don’t get it, do you Nate? Perhaps you never will.
Astronomy’s reasons for quantifying (not defining) “spin” rate wrt an inertial reference frame are perfectly understandable, and fine. They are what has led to the misunderstanding, though. It is only actually correct to quantify the “spin” rate that way if “orbit” is as per the MOTR. Quantifying the “spin” rate that way obviously is not in itself a reason for “orbit” to be as per the MOTR.
So the issue still remains, is “orbit”, or “Geoffrey”, or whatever else you want to call it, motion like the MOTL, or the MOTR.
Discussion over.
“It is only actually correct to quantify the spin rate that way if orbit is as per the MOTR”
Nonsense. Measuring motions in the inertial frame is the principle. It stands all on its own.
“The discussion is over’ has just become a joke.
OMG Nate, of the two motions under discussion for eight years, the difference is between how “orbit” is seen by either side. Not “spin”. Why do you think Clint R keeps asking for the “Spinners” viable physical model of “orbit”, or “Geoffrey”, or “orbit without spin”, whatever you want to call it?
The entire argument is about “orbital motion”. You simply refuse to argue about things that are actually relevant to it. It’s misrepresentation and obfuscation all the way down.
Discussion over.
“how orbit is seen by either side.”
I see the problem clearly now.
In physics and science in general, we find the guiding principles, the rules, like the laws of physics. Then we apply them to different problems, and let the principles guide us to the answer.
For Astronomy, the general principle is to describe motions of bodies in the inertial frame. So when Kepler observed Mars motion from Earth, it moved to the East for awhile, then back to the West, then again moved East. That is how we see it from the Earth vantage point.
But when he derived Mars orbit wrt the stars, it became a smooth ellipse
around the Sun.
Whereas you look at a special case, the MOTL, choose what you believe the answer is for that case, and go from there. If there is guiding principle that gets in the way, then you ignore it.
That is why when asked for the rationale for your choice, you cannot offer one.
You think the choice of what is an orbit is arbitrary. It is not.
All wrong, Nate. It’s you that thinks “orbit without spin” is arbitrary. In fact, you think it’s so irrelevant that you can base it on how “spin” rate is quantified!
If all that is relevant is quantifying “spin” wrt an inertial reference frame, explain the CSAItruth equipment when it replicates movement like the MOTR. The model moon is “spinning”. There is a motor beneath it, turning it! “Spin” rate clearly needs not be quantified wrt an inertial reference frame.
“explain the CSAItruth equipment when it replicates movement like the MOTR”
Already addressed. Already explained.
https://www.drroyspencer.com/2025/02/uah-v6-1-global-temperature-update-for-january-2025-0-46-deg-c/#comment-1699085
I’m sure you have other talents. But scientific thinking is not one of them.
The point is, you cannot say “spin” rate must be quantified wrt an inertial reference frame when doing so would tell you that the model moon is not “spinning”…when it clearly is. You cannot say that a ball on a string is spinning!
“The point is, you cannot say spin rate must be quantified wrt an inertial reference frame”
For Astronomy, for planetary motion, yes we can, and do.
You are taking the table top models way too literally. The are roughly representing the planetary motions.
It should be obvious they are not using the same physics.
So there is one rule for astronomy and another rule for everything else? Come on, Nate. You’re just desperate, now. You’re just making it up as you go along.
Another rule is planets or Moons don’t need a motor to spin.
Only the ignorant would be misled by the motors in the models.
Instead of attacking ridiculous straw men, why do you not come up with a reason for why “orbit without spin” is motion like the MOTR? You know, a reason not based on circular logic. Or, even better…just stop responding.
Nope. No circular logic pointed out.
Here, Nate:
https://www.drroyspencer.com/2025/02/uah-v6-1-global-temperature-update-for-january-2025-0-46-deg-c/#comment-1699154
“if you state that spin must be quantified wrt an inertial reference frame then it obviously follows that orbit without spin will be motion as per the MOTR.”
Yep that is simply consequence.
“However, that doesnt mean that orbit without spin actually is motion as per the MOTR. ”
Now you go off the rails again with fantasy invented rotations.
“It just follows from your initial premise. So, your conclusion is embedded in your premise.”
Not at all. It is just a straightforward observation that in the inertial frame there is no rotation.
“You actually need a reason, separate to any consideration about spin, for why orbit without spin is motion as per the MOTR.”
No you dont. Physically objects in space have rotatations that need no mechanism to keep them going.
“Now you go off the rails again with fantasy invented rotations.”
Now you go back to circular logic. You conclude you are right because your premise is that you are right.
“No you dont.”
Yes, you do.
“Physically objects in space have rotatations that need no mechanism to keep them going.”
Sure, but nothing to do with what you were responding to.
I give up. Just think what you like.
There is premise, which simply a factual statement about Astronomy measures all motions.
Then there is consequence: the motr Is observed to have no rotation (spin).
That’s all.
Nothing circular.
If it were circular the consequence would lead back to the premise.
But doesnt. So you are silly.
The circularity appears when you assume that just because Astronomy chooses to quantify “spin” rate wrt an inertial reference frame, this means there absolutely is no “spin” in motion like the MOTR. There is no “spin” according to that choice…but what if the choice is wrong?
You are flailing and failing at logic.
Astronomy measures motions in the inertial frame. Learn to live with it.
The rest is straightforward observations of motion in the inertial frame!
Nate’s premise is that he’s right…so he concludes he’s right.
In his mind, there is not even the slightest possibility that Astronomy’s choice is wrong. Which it would be, if “orbit”, or “Geoffrey”, was motion like the MOTL, rather than the MOTR.
Which is why the consideration of whether “orbit”, or “Geoffrey”, is motion like the MOTL or the MOTR is the real issue. Reference frames are not the issue, but they are a great way to endlessly obfuscate a simple problem. So, Nate goes for that.
“Which is why the consideration of whether orbit, or Geoffrey, is motion like the MOTL or the MOTR is the real issue”
Which brings it back to your favorite place, where YOU look at a special case, and make a choice what to call that. Then let the chips fall where they do.
And you can’t tell us what the rationale is for your choice, that requires to measure spin wrt a rotating reference frame. While denying the obvious: that it makes the Earth vantage the ‘reality’.
Rather than letting guiding principles guide you to it, which is what science does. It puts all motions on an equal footing, removed from the Earth vantage point, which was the goal of Astronomy for 2000 years.
“Why do you think Clint R keeps asking for the Spinners viable physical model of ‘orbit'”
Apparently you have not yet figured out what the rest of us, even Gordon, have figured out: that Clint is clueless about physics.
The viable physical model is Newton’s solution, using his physics, of the 2 body gravity problem. It finds the position vs time of a mass orbiting another mass. That is the ORBIT.
For the umpteenth time: it finds nothing about the orientation, rotation rate, color, roughness of the body.
Those are all independent variables that have no affect on the ORBIT.
The ORBIT answers the question: where will the Moon be in inertial space tonight, and the night after, etc.
It does not find what the Moon’s orientation will be tonight, and the night after.
Nate, you are the one obsessed with the “special case” of the moon. I’ve been trying to make clear for years that this issue affects all “orbits”. My “favourite place” is trying to get the discussion focussed on the actual issue. Not things that are not the issue, like reference frames.
” Ive been trying to make clear for years that this issue affects all orbits. ”
which are elliptical, and have tilted rotational axes, which you always run away from discussing.
Your model is derived from a special case where rotation of the body can be described as a rotation around an external axis.
Which fails to apply to real orbits in general.
“For the umpteenth time…”
Yes, Nate, you can make arguments that clearly do not resolve the issue either way hundreds of times if you like. I will simply continue to point out that they do not resolve the issue either way, and will remind you of what the issue actually is.
With the point settled that reference frames are not the issue, I think we can both move on. No need to go down any more of your rabbit holes.
“orbits in general,
which are elliptical, and have tilted rotational axes, which you always run away from discussing.”
Yep! And we see that here again. Up to now you had ready answers. But now it seems you realize the jig is up.
“Your model is derived from a special case where rotation of the body can be described as a rotation around an external axis.
Which fails to apply to real orbits in general.”
Obviously this reminds you that you have no answer for this key criticism.
So you again try to run away, but not before a last self-pat-on-the-back and pretense that there is nothing to see here:
“can make arguments that clearly do not resolve the issue either way”
No patting myself on the back, Nate, just stating the facts of the case. The point has been settled that reference frames are not the issue. That will be clear to all astute readers. Since that was the only point relating to my discussion with barry, why would I discuss anything else? Stop trying to bait with other issues just to drag the conversation on and on.
“Nate, just stating the facts of the case. The point has been settled that reference frames are not the issue.”
That is quite a disconnect from the key content of this discussion. With me posting that Astronomy seeks to put all motions in the inertial frame of reference. And that leads to measuring orientation and rotation (spin) of all bodies wrt the inertial frame.
You suggest, weirdly, that orientation and spin are exempt and don’t need to be measured wrt the inertial frame. And want them to measured wrt a rotating reference frame, which just so happens to make the Moon not spin in the frame of Earth observers oriented to the Moon.
After all that, you absurdly claim reference frames are not the issue.
The discussion has involved reference frames, Nate, since it has been necessary to involve them in order to explain why they’re not the issue.
Yes, Astronomy quantifies “spin” rate wrt an inertial reference frame. It’s perfectly understandable why they do so, but it is what has led to the misunderstanding. If you quantify “spin” rate wrt an inertial reference frame you are automatically treating “orbit”, or “Geoffrey”, as though it were motion like the MOTR. You have already agreed that this is the case. The trouble is that it doesn’t necessarily mean that “orbit”, or “Geoffrey”, actually is motion like the MOTR. It could be motion like the MOTL, as the “Non-Spinners” contend. After all, it has to be one, or the other. If it’s motion like the MOTL, then a rotating reference frame must be used to quantify “spin rate”…note this is a consequence of, and not the reason for, “Non-Spinners” saying “orbit” or “Geoffrey” is motion like the MOTL.
To understand why its motion like the MOTL, many explanations have been given by all the “Non-Spinners”, over several years. It’s usually explained as a combination of the orbiting object’s linear momentum acting at right angles to the force of gravity to turn the orbiting body around the orbited body like a ball on a string.
In contrast, Nate has thus far refused to try to explain why “Spinners” think “orbit”, or “Geoffrey”, is motion like the MOTR.
In any case, the issue is clearly whether or not “orbit”, or “Geoffrey”, is motion like the MOTR or the MOTL, and any reference frame differences are just a consequence of that decision. Not the reason for it.
Thus, reference frames are not the issue.
DREMT starts out his comment with reference frames are “not the issue”. Then DREMT’s conclusion is “reference frames are not the issue.”
Talk about circular reasoning! Properly announcing which particular reference frame is in use does settle the entire lunar spin issue since the start. DREMT has been wrong about that for all of his “eight years.”
All motion is relative.
Ball4, please stop trolling.
Interesting. Trying some new things.
“Yes, Astronomy quantifies spin rate wrt an inertial reference frame. Its perfectly understandable why they do so”
Wow, well then that ought to be the end of it!
“but it is what has led to the misunderstanding. ”
Alas, No.
“If you quantify spin rate wrt an inertial reference frame you are automatically treating orbit, or Geoffrey, as though it were motion like the MOTR.”
You have already agreed that this is the case. The trouble is that it doesnt necessarily mean that orbit, or Geoffrey, actuallyismotion like the MOTR. It could be motion like the MOTL, as the Non-Spinners contend. ”
Not really. Because Astronomy’s principle applied to the MOTL gives it spin, because it’s orientation clearly is changing wrt the inertial frame. It can only be an orbit with spin.
“After all, ithasto be one, or the other. If its motion like the MOTL, then a rotating reference frame must be used to quantify spin ratenote this is a consequence of, and not the reason for, Non-Spinners saying orbit or Geoffrey is motion like the MOTL.”
Which is weird, because Astronomy would be making orientation and spin exempt from the guiding principle for all motions.
“To understand why its motion like the MOTL, many explanations have been given by all the Non-Spinners, over several years. Its usually explained as a combination of the orbiting objects linear momentum acting at riBecaudght angles to the force of gravity to turn the orbiting body around the orbited body like a ball on a string.”
The fact that Clint suggested such things should be a clue that this is not correct physics! But you guys have had years to check this out and find a real physics source for this, and you havent.
In addition, we understand that some bodies are tidally locked and that requires millions of years, and yet others are not. And yet having tidal locked bodies doesn’t compel a change in the definition of orbit!
“In contrast, Nate has thus far refused to try to explain why Spinners think orbit, or Geoffrey, is motion like the MOTR.”
False and disingenuous. Historically, Orbit has been defined that way. It is the position vs time, the path, that a body follows through space.
I showed you what Kepler and Newton did to explain the path, the orbit.
There is no evidence from history to define an orbit as a path plus a specific rotation.
And my first post explained why the orbital motion is physically distinct from rotation and should be treated as independent.
It is the observation that the MOTR has no spin. And yet it is obviously in orbit.
No, Nate, I was not trying anything new, that was just a summary of everything I have said up to this point. Proves that you don’t listen to a word I say. Which is also proven by the rest of your response to me.
Do you now, at least, understand why reference frames are not the issue?
“Historically, Orbit has been defined that way. It is the position vs time, the path, that a body follows through space. I showed you what Kepler and Newton did to explain the path, the orbit.”
You are conflating two different meanings for “orbit”. “Orbit” the path, and “orbit” the motion. I have, throughout, been at pains to point out I’m talking about “orbit” the motion. I even went so far as to go back to calling it “orbit without spin” to try to get that across to you. But here you are, still talking about “orbit”, the path!
Nate, is “orbit” the motion like the MOTL, or the MOTR? That is the issue. Nothing else matters. As you think it is motion like the MOTR, then for the first time this discussion, please explain why you think so.
“You are conflating two different meanings for orbit. Orbit the path, and orbit the motion. I have, throughout, been at pains to point out Im talking about orbit the motion.”
As was I.
“It is the position vs. time. The path.”
Do you not understand that position vs. time fully describes the motion of ORBIT?
It is this motion that was understood to be what ‘orbit’ has meant throughout history. It should be obvious when you consider that only the path of planets was observable for most of that history.
And yet Ptolemy, Copernicus and Kepler were able to come up with their models for orbits.
Gee whizz. Fine, I will go back to calling it “orbit without spin”. This is the name of one of the two motions you believe is present in movement like the MOTL. The other motion is “spin”. If you subtract the “spin” you believe is present in movement like the MOTL, you are left with one single motion: “Orbit without spin”. You believe this to be motion like the MOTR.
For the first time this discussion, explain why you think this motion is motion like the MOTR. There should be no need to mention reference frames, or the history of what Astronomy has done, or anything of that nature.
“Nate, is orbit the motion like the MOTL, or the MOTR? That is the issue. Nothing else matters.”
Well all that I summarized above, addresses just that issue. Apparently you failed to understand or choose to ignore these facts and logic.
It explained clearly that there really is not a free choice here to change the meaning of standard words to suit your desires.
Nate, this comment:
https://www.drroyspencer.com/2025/02/uah-v6-1-global-temperature-update-for-january-2025-0-46-deg-c/#comment-1699266
Refutes your response to it.
I have asked you to do something. Either do it, or stop responding.
“For the first time this discussion, explain why you think this motion is motion like the MOTR. There should be no need to mention reference frames, or the history of what Astronomy has done, or anything of that nature.”
I explained, already several times, as well as I know how. There is no way to avoid history when you are talking about the meaning of words.
I don’t make the rules. I’m just following them to where they straightforwardly lead.
It is really unclear what else you are seeking. I cannot simply validate your feelings when they make no sense to me.
Playing dumb? OK, then.
I’m happy with the win.
“Nate, is orbit the motion like the MOTL, or the MOTR? That is the issue. Nothing else matters”
Then its
“Gee whizz. Fine, I will go back to calling it orbit without spin.”
So clearly you are not even sure what you are seeking.
Perhaps you are asking AGAIN,
why this:
orbiting objects linear momentum acting at right angles to the force of gravity to turn the orbiting body around the orbited body like a ball on a string”
is not correct physics.
My answer was:
“The fact that Clint suggested such things should be a clue that this is not correct physics! But you guys have had years to check this out and find a real physics source for this, and you havent.
In addition, we understand that some bodies are tidally locked and that
requires millions of years, and yet others are not. And yet having tidal locked bodies doesnt compel a change in the definition of orbit!”
I could elaborate further.
As explained many times over the years, gravity does not produce torque on a sphere.
Thus it cannot induce a sphere to TURN to follow its orbital path.
Examples on Earth are balls in sports. A launched basketball follows a parabolic path through space to the basket. Gravity does not turn it to follow that path. In fact the ball can have backward spin forward spin or no spin as it is launched and gravity has no affect on it.
Then we Newton’s solution for orbit. As I said many times, he only found that the gravity force only affects the path of the COM of the ball, while leaving its orientation or spin untouched
Thus the MOTR represents a sphere that entered its orbit with no spin. And being it orbit did not make it acquire any spin.
Because gravity acts as if it is only applied to the COM of a sphere.
What I’m looking for you to do is explain why you think the motion “orbit without spin”, or “orbit”, or “Geoffrey”, is motion like the MOTR.
You’ve started to (sort of) attempt to make an argument, but you’ve put it in terms of why you think it’s wrong to say “orbit without spin”, or “orbit”, or “Geoffrey”, is motion like the MOTL.
“As explained many times over the years, gravity does not produce torque on a sphere.“
Of course not. What is being suggested is that gravity and the orbiting object’s linear momentum together produce motion like the MOTL. Like a ball on a string, the string is acting through the CoM of the ball. Of course, to discuss a ball on a string, you first have to accept that the ball on a string is not spinning.
“As explained many times over the years, gravity does not produce torque on a sphere.
Of course not.”
By saying that, I assume you understand what torque does. It is ‘turning force’. If a body is not already turning (rotating) then unless there is a torque, it will not acquire rotation.
So this:
“What is being suggested is that gravity and the orbiting objects linear momentum together produce motion like the MOTL.”
cannot happen.
“Like a ball on a string, the string is acting through the CoM of the ball.”
It is attached to the surface, and can make a slight angle with it, and provide torque. Obviously that happens as you start.
The string provides no torque to the ball, Nate. The ball on a string is not spinning. I told you, to discuss this, you have to (like Bindidon) understand that the ball is not spinning. You’ll never get it until you do.
“The string provides no torque to the ball, Nate.”
False. Without torque it cannot have acquired any rotation.
As you claimed to understand. Do you?
It clearly gas rotation (regardless of what you want to call it). So there had to have been torque!
‘ it has rotation’
Point 1), Nate, from the famous list of points 1) to 4). The ball on a string is not spinning. It’s not rotating about an axis going through the ball itself. We’ll get nowhere until you understand and accept that. So, once again, I’m putting my foot down on that. Locking it down to a strictly “concede to proceed” basis.
Two things for you to concede:
1) The ball on a string is not spinning.
2) Reference frames are not the issue (point 3) from the famous list).
Concede to proceed.
I have no interest in getting you to understand how the BOS gets going. It is irrelevant to the Moon.
If you understand as you claim to that gravity produces no torque on a sphere, then you SHOULD be able understand that your notion that gravity turns a sphere’s orientation to follow its orbit is orbital path is bunk.
But it looks you will not allow yourself to understand.
Two things for DREMT to properly concede:
1) The ball on a string is not spinning when the accelerated reference frame DREMT uses is properly announced,
2) Properly announced reference frames always completely resolve the spin issue (point 3 from the famously incorrect list). DREMT has never raised a spin issue that could not be resolved by properly announcing his frame of reference which DREMT famously neglects to do.
Concede all motion is relative to properly proceed.
Nate, gravity produces no torque on a sphere. We are talking, after all, about “orbit without spin”. Why would I be arguing that gravity produces torque on the sphere, making it “spin”, if I was arguing that the sphere doesn’t “spin”!? Once again, you are simply conflating a change in orientation wrt an inertial reference frame, with “spin”. Despite the fact that you know a ball on a string, which changes in orientation wrt an inertial reference frame, does not “spin”.
If you can’t concede the two points, we’ll never get anywhere, so I guess this is done.
Ball4, please stop trolling.
Nate, gravity produces no torque on a sphere.
Yep, so you claim to understand, but keep ignoring.
We are talking, after all, about orbit without spin. Why would I be arguing that gravity produces torque on the sphere, making it spin
Pure obfuscation by use of your spin!
When we both discussed the physics behind Orbit, you suggested gravity could conspire with linear momentum to turn (re-orient) the body to always face the center.
While I pointed out that for a body to change its orientation requires torque, which gravity does not provide, and you agreed.
No matter what you want to call that orientational change, thats what we are talking about.
Please try to focus and avoid getting yourself all confused with the labels
Two things DREMT gets wrong at 1:16 am:
1) Any ball changing orientation wrt to the inertial system has positive & measurable rotational inertia so the ball has observed spin on its own axis wrt to that inertial system.
2) Gravity produces torque on a sphere if the sphere has non-constant density such as the torque Earth’s gravity produced on Earth’s orbiting Moon when there was lunar spin wrt to Earth.
That torque eventually slowed the Moon’s rotational inertia wrt Earth to zero similar to ball on string as observed by (or wrt) the ball spinner.
DREMT doesn’t yet concede all motion is relative by not properly announcing ref. system he is using, so (as Nate points out) DREMT’s writing on motion remains confused & will be confusing until DREMT concedes.
Concede to proceed, Nate.
Oh, and false accusations will not be tolerated.
You are in no position to be trying to bully again.
Address the content of my post without obfuscating or trying to change the subject.
It’s not so difficult.
Sorry Nate, but in a discussion you have to try to meet people halfway. You have to actually concede points, occasionally. Ball4 has been wrong about reference frames for eight years. I think you owe it to him, to correct him.
Concede to proceed.
DREMT hasn’t ever offered a good reason for why proper use of reference frames is wrong. Pity. No need for any correction by Nate except when NATE is correcting DREMT since:
All motion is relative.
Ball4 taunts, goads and trolls, which is all he can ever do…feigning ignorance of the clear and irrefutable arguments made for why reference frames are not the issue, and exactly what I mean by that. He simply pretends the comments have not been written.
So back to what youve been desparate for me to explain, which is why orbit without spin is like MOTR.
So to be clear:
When we both discussed the physics behind Orbit, you suggested gravity could conspire with linear momentum to turn (re-orient) the body to always face the center.
No matter what you want to call this
orientational change, thats what we are talking about.
While I pointed out that for a body to change its orientation requires torque, which gravity does not provide, and you agreed.
So orbit is simply the translation of a body around another, like the MOTR
.
So you have my answer. No I had hoped that you would have something to say about these points.
Please try to focus and avoid getting yourself all confused with the labels
Clear and irrefutable arguments for why reference frames are not the issue have never been written by DREMT who clearly & necessarily avoids doing so 7:17 pm yet again. Pity.
All motion is relative.
I told you, Nate – you’re never going to understand what I have to say in response until you accept that a ball on a string is not “spinning” (rotating about an axis going through the ball itself). Thus you must concede that before we proceed. You should also concede the other point, about reference frames, since that’s actually the topic of this sub-thread! You know, it’s only right for you to concede that before the discussion moves on to a different topic. Ball4 needs correcting, so off you go.
Concede to proceed.
So you continue to not address the content of my post, which are the heart of the issue, but instead change the subject, try to bully obfuscate. The usual tactics.
It is obvious that the jig is up and you are stuck with no answers.
There is no sound rationale offered to change the historical meaning of orbit.
Nate, you’re the one that’s changed the subject, you’re the one that obfuscates, and you’re the one that is trying to bully me into a response right now. What I’m doing is calmly requesting that you concede two essential points before the discussion continues, and I’ve even explained why I’m asking. Clearly you know that the jig is up: namely, Ball4 and many others have been wrong for eight years on reference frames.
Concede to proceed.
DREMT, of course, demonstrates again 7:37 am nothing to counter properly announcing which reference frame is used settles all his spin observation issues ever raised. I’m delighted to again read DREMT avoid any substance in his response.
DREMT will carry on avoiding addressing the fact all motion is relative.
More blah blah from boring Ball4…
DREMT,
“Nate, youre the one thats changed the subject.”
Here is you defining the topic days ago,
“Nate, is orbit the motion like the MOTL, or the MOTR? That is the issue. Nothing else matters.”
“youre the one that is trying to bully me into a response right now”
Oh just stop.
If you have no response, then you don’t and the jig is up.
Nate continues to bully for a response. That was not me changing the subject – part of explaining why reference frames are not the issue is stating what the real issue actually is. I am not moving on to discuss that real issue until you concede the two points.
Concede to proceed.
“I am not moving on to discuss that real issue until you concede the two points.”
Do whatever you need to do to distract yourself and self soothe.
Everyone understands, even you, that this is the end of the road for the ‘non-spinning’ Moon.
There is clearly nothing else you can offer to defend this point of view.
Lol, the bullying continues. I have a response in mind, Nate. Want to hear it?
Then concede to proceed.
” … and I repeat, for a dense Frenchman banished to Germany, that Musks boys and I are in agreement. ”
So? The allegedly ‘dense’ guy still awaits your proof, Robertson.
But since you lie about everything in this blog, I fear that I will have to wait a long time for confirmation of your claim I emphasized above.
Ask them instead of writing your usual non-committing blah blah, Robertson.
” If you can supply a reliable contact addy for spacex Ill be happy to contact them. ”
If you were an honest person, you would look for this ‘reliable contact’ yourself.
What Gordon has tried to explain to you is the same as what we have all tried to explain to you for the last seven years. You keep making this silly argument that “Non-Spinners” would get the lunar ascent/descent procedures wrong because they don’t think the moon spins, and you must have made this blunder about twenty times at least over the last seven years, and you can’t learn.
Once again, “Non-Spinners” agree with “Spinners” that the moon re-orients itself wrt an inertial reference frame at a rate of 4.7 meters/second at its equator. So no, we would not get it wrong. It’s just, we do not consider this re-orientation to be spin, we consider it to be a part of the moon’s orbital motion. And, considering it that way makes no difference to anything.
So, please stop attacking silly straw men in future.
Pseudomod
Spare me your useless, arrogant and smug tone.
You never were able to disprove any of the results obtained by so many scientists since Mayer in 1750.
*
Ask Space X instead of writing your usual non-committing blah blah:
https://www.spacex.com/humanspaceflight/moon/
There is one general email address for everything:
” For inquiries about our human spaceflight program, contact sales@spacex.com ”
*
Maybe you are courageous and honest enough to send them a mail.
I don’t need to disprove a thing, or contact anyone. As you’d know, if you had understood my response to you.
Pseudomod
” Its just, we do not consider this re-orientation to be spin, we consider it to be a part of the moons orbital motion. And, considering it that way makes no difference to anything. ”
” I dont need to disprove a thing,… ”
Let alone would you feel any need to prove the emphasized sentence.
Do you really believe that a spacecraft polar-orbiting the Moon every two hours, for example, would not see the same point on the surface below it at the end of each orbit if the Moon did not rotate?
The reorientation of the moon below the satellite would be due to the moon’s orbital motion.
How many ways can you fail to understand my original response to you?
“The reorientation of the moon below the satellite would be due to the moons orbital motion.”
Evidence? Logic? Scientific rationale?
Or is it just a feeling?
Yeah, it’s that.
Nate, it’s not necessary to prove that the reorientation is due to the moon’s orbital motion to refute Bindidon. I don’t have to prove that the moon doesn’t rotate on its own axis to “win” every argument on the subject.
Then there is no reason or rationale to choose, as you do, the non-spinner POV.
In contrast, the spinner POV has a solid physical rationale.
Orbital motion is accelerated motion. It can only happen when a FORCE is acting on the body to pull it into its orbital path, which is not circular in general
Rotational motion is quite different. If a body in space has rotation (spin), then no force is required, and it is maintained indefinitely.
Thus orbital motion and rotational motion are quite distinct, and have different properties.
Thus there is no sound science rationale to treat them as one motion.
…and nobody is.
But, there is no need to get into a two week long back and forth on matters only tangentially related to this discussion.
Bindidon’s comments are refuted. No need to discuss anything else.
Good. The long luney argument is finally over.
The argument was over some time ago, with the “Non-Spinners” victorious. No need to keep going over it. I just comment here to address the misrepresentations.
“the Non-Spinners victorious”
In the reality: The opposite is true.
“Thus there is no sound science rationale to treat them as one motion.”
“and nobody is.”
Yes, Nate. Both “Spinners” and “Non-Spinners” agree that “orbit” and “spin” are completely separate motions. They disagree on what “orbit” entails.
“Thus orbital motion and rotational motion are quite distinct, and have different properties.
Thus there is no sound science rationale to treat them as one motion.”
“…and nobody is”
Indeed, Nate.
Perhaps you’ve never really understood the “Non-Spinner” position. That’s OK. “Non-Spinners” agree that “orbit” and “spin” are separate motions, as I said. It’s just that “orbit” is motion like the MOTL. Whereas “Spinners” think “orbit” is motion like the MOTR.
Clearly you didn’t understand my post.
https://www.drroyspencer.com/2025/02/uah-v6-1-global-temperature-update-for-january-2025-0-46-deg-c/#comment-1698884
“Orbital motion is accelerated motion. It can only happen when a FORCE is acting on the body to pull it into its orbital path, which is not circular in general.
Rotational motion is quite different.”
You guys have consistently argued that our Moon’s rotational motion is part of its orbital motion. And that it is ‘one motion’.
And now you are trying, as always, to have it both ways.
I have correctly represented the dispute between “Spinners” and “Non-Spinners”. You have not.
Good day.
False. I’ve shown two things here.
a. that you’ve taken contradictory positions:
1. “Thus orbital motion and rotational motion are quite distinct, and have different properties.
Thus there is no sound science rationale to treat them as one motion.”
Your answer:
“and nobody is.”
2. “Its just that orbit is motion like the MOTL.” which most definitely is a moon with rotational motion.
and
b. The non-spinner model has no sound scientific rationale. Which you are unable to dispute.
Thus this:
“the Non-Spinners victorious.” Is unsupported nonsense.
a) There is no contradiction, Nate.
b) I do not need to dispute what you are asking me to dispute. That is not part of my discussion with Bindidon, that you butted in on.
Good day.
a. The evidence is plain.
b. You are unable to dispute it.
Thus the sudden need to head for the hills.
a) Nate, my position is obviously not that the MOTL is “most definitely” an object that is “orbiting” and “spinning”…that’s the “Spinner” view. You are assigning your own view to me and then claiming that I’m contradicting myself!
b) That’s just childish baiting.
“Nate, my position is obviously not that the MOTL is most definitely an object that is orbiting and spinning”
The words I used were ‘rotational motion’
You have been consistent in stating correctly that the Moon is rotating.
And clearly the MOTL is rotating.
They have rotational motion.
So yes your positions taken in this thread contradict that.
Specifically “…and nobody is”
your statement:
”
the Non-Spinners victorious”
was childish baiting.
You said:
“If a body in space has rotation (spin)…”
The “Non-Spinner” position is that an object orbiting like the MOTL is not “spinning”. Only “orbiting”.
The “Spinner” position is that an object orbiting like the MOTL is both “orbiting” and “spinning”.
I have never said the moon is “spinning”, Nate. Why are you trying to assign to me your position!? This is so weird…
From the beginning of this discussion we both you and I clearly were discussing the Moon’s orientational change, ie its rotational motion.
Here was your claim that I first took issue with:
“The reorientation of the moon below the satellite would be due to the moons orbital motion.”
Which is your long stated consistent opinion.
And my point was that you (non spinners) have no scientific rationale to support this position.
Then you ducked:
“Nate, its not necessary to prove that the reorientation is due to the moons orbital motion…”
And I pointed out that Spinners do have a sound scientific rationale to separate orbit from rotational motion.
And thus there is no science rationale to treat them as one motion. Which has also been your long standing position.
And your response:
“…and nobody is”
And now it is abundantly clear that you have NONE.
Yet you then falsely claim that there is
“the Non-Spinners victorious”
But are unable to support the claim.
Nate, both “Spinners” and “Non-Spinners” separate “orbit” and “spin”. They just disagree on what “orbit” entails. As I’ve repeatedly explained.
You’re not making any sense.
You jumped into an argument I’d just won, demanding I provide proof of something which did not need to be proven in order for me to win the argument. Understandably, I couldn’t be bothered to provide you with said proof, and get into another two week long back and forth with you over something where you would never accept anything I said in any case.
In the meantime you’ve dragged me into this bizarre situation where you are trying to impose your own view as if it were my own. Please stop t-word-ing and just leave me be.
“And thus there is no science rationale to treat them as one motion. Which has also been your long standing position.”
False. It is not my “long standing position” that “orbit” and “spin” are one motion. It is my “long standing position” that “orbit” and “spin” are separate motions!
Either stop with the misrepresentations or stop responding to me.
From the beginning of this discussion both you and I clearly were discussing the Moons orientational change, ie its rotational motion.
But now you try to pretend the discussion is not about rotational motion but instead about the vague
term ‘spin’
Since you and I use a different definition of spin, let’s stop using it.
“False. It is not my long standing position that orbit and spin are one motion.”
Which is not at all what I said.
And I have made it clear what I meant.
“The words I used are rotational motion.
You have been consistent in stating correctly that the Moon is rotating.
And clearly the MOTL is rotating.
They have rotational motion.”
And you have been consistent in stating that the Moon’s rotational motion and
its orbital motion, are one motion.
Yet this has no science rationale. As I said there is a science rationale to treat them as distinct separate motions.
You indeed made it clear that by “rotational motion” you meant “spin”:
“If a body in space has rotation (spin)…”
…and thus I’m completely correct to point out that your “scientific rationale” for “orbit” and “spin” to be treated as separate motions is all well and good, and indeed “Non-Spinners” agree – “orbit” and “spin” are separate motions.
And you can claim I have said otherwise for the rest of your life, if you cannot provide a link to me stating that the moon spins, or that “orbit” and “spin” should be lumped together as one motion, then maybe you should rephrase what you’re trying to say.
I used the word ‘spin’ in parentheses, because an isolated body in space that has rotation has the same amount of spin. I think you agree.
Then this triggered you, and you latch onto ‘spin’ and keep substituting it in whenever I say rotation.
Why?
Why are you working so awfully hard to avoid agreeing that this clear statement
“And you have been consistent in stating that the Moons rotational motion and
its orbital motion, are one motion.”
has been your long standing position?
This is the clearest statement of the “Non-Spinner”/“Spinner” positions:
1) Both “Spinners” and “Non-Spinners” agree that “orbit” and “spin” should be treated as separate motions (you hate this because it renders your argument moot).
2) The two groups disagree on what is meant by “orbit”. “Spinners” think MOTR, “Non-Spinners” think MOTL.
I have no idea why you are trying so hard to equivocate over the word “rotate”. “Orbit” and “spin” adds clarity.
“, then maybe you should rephrase what youre trying to say.”
Did just that. Several times already.
Not at all, Nate. You keep using the same phrasing, seemingly looking for maximum obfuscation. On the other hand, I’m keeping it so clear and simple a child could understand.
https://www.drroyspencer.com/2025/02/uah-v6-1-global-temperature-update-for-january-2025-0-46-deg-c/#comment-1699019
Allow me to make the same argument you are making, but from the “Non-Spinner” perspective. Perhaps then you will understand how silly you are being.
Here is a sound scientific rationale for why we should keep “orbit” and “spin” separate:
“Orbit” is accelerated motion. It can only happen when a FORCE is acting on the body to pull it into its orbital path, which is not circular in general.
“Spin” is quite different. If a body in space is “spinning”, then no force is required, and it is maintained indefinitely.
Thus “orbit” and “spin” are quite distinct, and have different properties.
Thus, there is no sound science rationale to treat them as one motion, as the “Spinners” do with movement like the MOTR.
The you would seem to be equating spin with rotation, which spinners agree to.
The the Moon because it has rotation must have spin.
“Spin” means “rotation about an internal axis”. There is absolutely no ambiguity about its use.
“Rotation” alone could refer to either “spin” or “rotation about an external axis”. Hence there is ambiguity over its use.
Which is why you prefer it.
“Spin means rotation about an internal axis. There is absolutely no ambiguity about its use”
Sure..show us how to use it for our Moon to determine its spin is 0.
This comment is where the discussion has got to:
https://www.drroyspencer.com/2025/02/uah-v6-1-global-temperature-update-for-january-2025-0-46-deg-c/#comment-1699024
Either respond to it, or concede.
“‘Spin’ is quite different. If a body in space is ‘spinning’, then no force is required, and it is maintained indefinitely.”
Then ‘spin’ should be definable in such a way that it can be measured.
So tell us how you define in such a way that it can be measured for Our Moon.
“Thus, there is no sound science rationale to treat them as one motion, as the Spinners do with movement like the MOTR.”
False. The MOTR has an orbit. And
, apart from that, it has no measurable rotation (spin).
Nate, it has been your “long-standing position” that the two motions which are present in movement like the MOTR, “orbit” and “spin”, are just one single motion. How do you justify that, in light of your agreement that “orbit” and “spin” should be kept separate?
“Then spin should be definable in such a way that it can be measured.
So tell us how you define in such a way that it can be measured for Our Moon.”
If you can’t answer, then admit that you have no sound definition of spin that actually works.
Why are you taking this discussion down the same route we have already gone down in the discussion you jumped in on up-thread?
https://www.drroyspencer.com/2025/02/uah-v6-1-global-temperature-update-for-january-2025-0-46-deg-c/#comment-1699018
Answer my question to you, Nate. Or not. I can’t actually be bothered with a two week long back and forth on this subject.
I refuted Bindidon. You jump in to steer the discussion down some other rabbit hole, expecting me to follow.
I refuted barry. You jump in to steer the discussion down some other rabbit hole, expecting me to follow.
How about you just stop jumping in on my discussions?
It is debunking the main non-spinner argument that the Moon is not spinning.
Which you chimed in on with “the Non-Spinners victorious”.
Oh well.
Yeah, right. Sure it is.
Nate, it has been your “long-standing position” that the two motions which are present in movement like the MOTR, “orbit” and “spin”, are just one single motion. How do you justify that, in light of your agreement that “orbit” and “spin” should be kept separate?
” that the two motions which are present in movement like the MOTR, orbit and spin”
The premise is absurd. There is no evidence of any rotatonal motion (orientational change) present.
If we want to know the Moon’s orientation tonight in the inertial frame (which is the purpose of a sound model) it is simple: same as last night and the night before.
There is no orientation change present with the CSAItruth equipment when it replicates movement like the MOTR, but we know that, objectively, the model moon is spinning. There is electricity being used to power a motor that is spinning the model moon. There are two motions present. Each is driven by its own motor.
“There is electricity being used to power a motor that is spinning the model moon”
Uggh..
Which is not relevant to the Moon, since there are no motors or arms present.
And such devices get the physics entirely wrong. As I discussed earlier, Newton found that bodies in a vacuum require no force to keep them spinning.
The point is simply that there can be two motions behind movement like the MOTR. That has been empirically proven.
Science’s job is to explain what is observed. Only.
Then there is no need to explain rotations that cannot be observed.
Nate, your responses are just getting sillier and sillier.
I mean, there are many ways I could dispute what you just said, but I will go with:
By your logic, I could just as easily argue that since we cannot directly observe two motions in movement like the MOTL, science insists we should not investigate any further.
“since we cannot directly observe two motions in movement like the MOTL, science insists we should not investigate any further”
Of course we can detect orientation and position as they change day to day. And for orbits in general that is the only representation possible.
Change in orientation and position could be the result of only one motion, Nate. So no, you cannot directly observe two motions in movement like the MOTL. Sorry, but you’re wrong again.
“Nate. So no, you cannot directly observe two motions in movement like the MOTL”
Of course you can, as I just explained.
The MOTL is special case, in that it can also be described as a perfect external axis rotation.
But in general NO. And for our Moon definitely not.
I just explained why you were wrong.
“But in general NO. And for our Moon definitely not.”
Because I know that you know that our Moon is not the MOTL.
I know that you know that in general orbits are elliptical, and rotation is not just in the orbital plane.
So for all these cases it makes absolutely no sense to treat their orbit and rotation as one motion.
Thus astronomy treats orbit and rotation as separate motions.
Learn to live with it.
“Orbit” and “spin” are indeed separate motions, Nate. The “Non-Spinners” agree.
So, why do you treat the “orbit” and “spin” inherent in movement like the MOTR as being one single motion?
“Orbit and spin are indeed separate motions, Nate. The Non-Spinners agree.”
You say such things that are in reality not at all true for the non-spinner model.
The very definition of spin in your model makes it dependent on the orbital motion. The orientation of the Moon is determined wrt a line between Earth and Moon, which itself is rotating, at a non-constant rate, making your version of ‘spin’, absurdly, a varying quantity through the orbit.
Your model makes hash out of the Moon’s motion.
Wrong again, Nate. “Orbit” and “spin” are separate motions from the “Non-Spinner” perspective in exactly the same way that “orbit” and “spin” are separate motions from the “Spinner” perspective. Any difference is entirely in your imagination (besides the obvious, that “orbit” is motion like the MOTL for the “Non-Spinners”, and motion like the MOTR for the “Spinners”).
Will that be eternally all?
You don’t seem to understand your own model.
You admit that your version of spin is measured wrt the rotating orbital frame.
That makes your spin mathematically DEPENDENT on the orbital motion.
That means an astronomer observes a distant rotating body and measures its spin. But No, she can’t!
Not until she determines what other planets and stars it might be orbiting and how fast,
Thus your spin is not independently measurable, which in Astronomy is just absurd!
Nate, you don’t seem to understand your own model.
You admit that your version of “spin” is measured wrt the inertial orbital frame.
That makes your “spin” mathematically DEPENDENT on the orbital motion…
Your arguments are no longer dependent on logic or facts.
It’s the same, Nate. “Spin” is “dependent” on “orbit” for the “Spinners” in the same way as it is for the “Non-Spinners”. I would consider them as separate motions in both cases.
As for your point about “spin” rate not being measurable for “Non-Spinners” – it would be done the same way as it always has been done – just subtract 1 from the “spin” rate per “orbit” to convert.
“just subtract 1 from the spin rate per orbit to convert.”
a. There is no sound reason to do that.
b. It Just does not work. Remember elliptical orbit and tilted spin axis.
“‘Spin is dependent on orbit for the Spinners in the same way as it is for the Non-Spinners”
Assertions lacking logic or evidence can be safely ignored!
OK, Nate.
Your point, here:
https://www.drroyspencer.com/2025/02/uah-v6-1-global-temperature-update-for-january-2025-0-46-deg-c/#comment-1698884
Has been refuted. It is not my problem if you wish to pretend otherwise, whilst darting down various rabbit holes and expecting me to follow.
“been refuted”
More assertions lacking any evidence, can be safely ignored.
Just rinse and repeat.
The main point is you think the Moon should not be spinning, and that is your sole guiding principle.
Then you derive the rest of your thinking from that.
That ain’t science.
Once again, I refuted you by showing that your logic was circular. I did that, first, here:
https://www.drroyspencer.com/2025/02/uah-v6-1-global-temperature-update-for-january-2025-0-46-deg-c/#comment-1699024
“Thus, there is no sound science rationale to treat them as one motion, as the Spinners do with movement like the MOTR.”
There is no rotation detectable in the MOTR. There is only the translational motion produced by its orbit.
I have no need to explain your fantasy imaginary motions.
The problem with the argument I presented there (which is just your own, but from the “Non-Spinner” perspective) is one of circular logic. Bizarrely, you continue to attack it for other reasons. I guess logic is not your strong suit.
Don’t you get tired of just endlessly repeating these talking points?
While the discussion has gone well beyond them to explain the rationale for these differences.
I never get tired of winning arguments.
barry…”Likely hes already made the deal with Putin, and now hell pressure Zelensky to accede to it”.
***
Barry…if you really want to understand the complexity of the situation, look up ‘Ukraine on Fire’ by Oliver Stone. If you watch it and try to verify each point revealed, as I did, you might be astounded with the far-reaching treachery that has gone on in the Ukraine, dating back to 1929.
I have no interest in discussing this with you further till you have at least watched the film. Each point made is easily verifiable using reliable sources. Even Wiki has an accurate depiction of the UON. Look it up.
It appears to me that the formation of the current Ukraine was seriously botched from the start circa 1990. Borders were set arbitrarily without thought to native Russians being trapped in the new country. No provisions were made to ensure the protection of these Russians from the excesses of nationalistic Ukrainians and the same is true for Latvia, Estonia, and Lithuania.
The Ukraine is far from the fairy tale image created by the Western media, where Zelensky takes on the image of a valiant warrior trying to protect his country. It does not take much research to get an idea of what he is really doing in the Ukraine, setting himself up as a petty dictator.
If you watch the video, you will become familiar with the UON, a nationalist movement in the Ukraine dating back to 1929, when the Ukraine was a Russian soviet. You can look up the UON anywhere on the Net and get an idea of what they are about, White Supremacy. They make the KKK look like a boy scout troop.
The scary part is that the UON descendants are still very active in modern Ukraine. They were involved, as an armed group, in a coup in 2014 that lead to a democratically-elected president being driven from power. There is no reason not to think they have an influence hold on Zelensky, even though he is a Jew.
Trump is far from the ideal person to be negotiating with Putin, but he is the only Yank who has desired to talk to Putin at all. I am sure the reason Zelensky is being excluded is that he must answer to the UON and their descendants like Right Sektor.
UON descendants imposed a desire on a Ukrainian president in 2016, to honour Ukrainian Nazi war criminals like Stepan Bandera and the SS Galacia, a Ukrainian division who fought with the Nazis in WW II. Each year, they hold a candle light vigil to honour these criminals and thousands take part.
You’re clogging the blog again. Stop it.
Go have a good, long poop, and I’ll arrange for someone to pick up your clothes when you’ve finished. That’s all that will be left.
Alternately, go soak you head in Lake Cowachin.
There is only one good reason to invade a sovereign nation, and that is if that nation has initiated war with another, or has joined forces with an aggressor.
There are no other good reasons in the modern world, not even internal strife. The UN Charter was written with WWII freshly concluded.
Lest we forget.
What a load of pompous bs. Careful not to fall of your soapbox.
Don’t you think for 1 second, that if several million US citizens were living in another country and they were threatened as native Russians are being threatened in the Ukraine that the US would hesitate for 1 second about invading.
The pro-Russian separatists are not Russian citizens. If you want to hypothesise about the US, you would have to imagine that the US arming pro-US Mexicans who love the States and speak English natively, and backing them with forces as a pretext to invade Northern Mexico.
In 1991, 80% of the Donbas supported Ukrainian independence. In 2014 Russia stoked the unrest and protests in the Donbas, agitated and supplied separatists with arms and intelligence against the Ukrainian government. There had been no great suppression of the Donbas prior to 2014. A small group of pro-Russian secessionists were bloodlessly disbanded by the government. But Russia fuelled the fire after the 2014 ouster of the then pro-Russian president, and then later used the conflict it had artificially magnified as a pretext for invasion.
The UN Charter is not pompous BS, it is the guiding principle behind a peaceful international order. Russia’s actions in 2014, and wit Crimea, and now in Ukraine, are at odds with it many times over.
Sweden and Finland joined NATO after the invasion of Ukraine. They know that Russia is not to be trusted.
The logic of your reasoning leads to this:
Any of Israel’s neighbours would be justified waging war against Israel.
Their fellow Arabs and Muslims are being killed in the tens of thousands, 70% of their buildings have been destroyed, and this is causing Gazans to flow into the neighbouring countries, straining their resources. Furthermore, the great deal-maker, Donald Trump has suggested part of his peace plan will include off-loading Gazans into the neighbouring countries.
By your logic, Israel deserves to be invaded.
Bindidon,
Your chart just happens to leave out the latest data showing Northern Hemisphere snow cover hitting a 20-year high:
https://globalcryospherewatch.org/state_of_cryo/snow/multisensor_4km_nh_snow_extent_by_year_graph.png
https://www.drroyspencer.com/2025/02/uah-v6-1-global-temperature-update-for-january-2025-0-46-deg-c/#comment-1698696
Adjustments?:
https://postimg.cc/d7r1JHfp
https://www.bbc.co.uk/news/articles/c9q4gw45nvdo
Peace in our time?
The BBC propaganda machine is still in high gear. They have no idea why Russia is in the Ukraine, not the entire Ukraine, but only the region with Russian-speaking Ukrainians who were being suppressed and brutalized by native Ukrainians.
Why has the plight of native Russians in the Ukraine been suppressed? They have been portrayed as troublemakers yet their beefs have never been aired by the western media. The views held by many of us in the West can be nothing more than naive since we too are deprived of the reality. However, that is no justification for outright propaganda against a race of people represented by corrupt leaders.
And why have the Russian people as a whole been villanized when most have had no choice in the matter? The Russian people have been oppressed, first by tsars, then by Bolsheviks and Stalin. They can’t seem to catch a break.
Today, they have to face Mafioso, the gangs of thugs lead by oligarchs. Without the likes of Putin to keep them in line, the oligarchs would take over the entire country as they have in countries like Georgia. No, the situation in Russia is far from perfect for the Russian people but it is likely somewhat better than what people endured under Stalin.
We can only hope things get better in Russia. Meantime, we could help the Russian people by communicating with their leaders and encouraging them toward democracy. The lack of communication and the propaganda spread by us has only made matters worse.
When the USSR broke up circa 1990, I am sure many Russians were hopeful they’d have freedom and democracy. However, countries in the West who could have helped them realize that democracy were more interested in picking their pockets trying to get at their resources. Other Neanderthals have blamed the Russian people for the actions of clowns like Stalin and the Bolsheviks when the average Russian had no say in the matter.
We treat Russians as if they had voted democratically for the brutes running their country.
You are defending an invasion of a sovereign nation. Neither the plight of pro-Russians in Eastern Ukraine nor anyone’s ignorance of it justifies this invasion.
If internal strife and suppression justified international war we would be satisfied with dozens of invasions around the world.
You’re a narrow-minded person Barry, typical of some people from Australia I have met. I have described in detail why the Russian invasion was justified but you don’t want to hear it let alone discuss it intelligently. You’d rather rely on lies from authority figures who disregarded democracy, while blaming Russians for doing the same.
There was absolutely no excuse for the Ukraine running off a democratically elected president in 2014. They should have been censured for that act but they were applauded instead. As ye sow, so shall he reap.
I am already familiar with the previous situation in Ukraine, the conflicts between separatists and the government in the Donbas region, and the polls taken in the region. I am familiar with the realities (rather than the propagandistic characterisation) of neo-Nazi elements in Ukraine.
None of it, and even it those things were worse justify one sovereign nation invading another.
Or e4lse the same justifications could predicate a dozen new wars around the world. There are many even more benighted countries than Ukraine, but there is extremely good reasons why the world does not tolerate invasions of even the most conflicted countries.
Reasons that you have either forgotten or actually dismiss in favour of international war.
I do not think anyone should be forced to get vaccinated. Healthcare workers and first responders are free to quit their job rather than be vaccinated. On the other hand, it is unfair to innocent children when parents believe that exposure to a serious and life-threatening virus is preferred to a simple, safe, and effective vaccine.
https://www.cnn.com/2025/02/18/health/texas-measles-outbreak/index.html
https://www.foxnews.com/health/measles-outbreak-continues-worsen-among-kids-us-state
The side effects from any vaccine are proof of two things. First, the immune response means the vaccination was effective. Second, it means that you needed the vaccine because the actual infection is always, yes always much worse, with all of the same “chemicals” in your body.
Disclaimer…I don’t know what to make of the vaccine issue but I think it far better to discuss the pros and cons rather than sweep the issue under the rug.
Part of the argument against the claim that vaccines prevent infection is that many vaccines were introduced after the diseases began to decline on their own due to better health conditions.
How are we going to get at the root of the problems if there is a narrow-minded approach based on the belief that vaccines are solving a problem?
Most vaccines have been developed following WW II when health conditions in general began to improve dramatically. I just read an article on health conditions in my native Scotland around 1900 and they were abysmal. In the city of Glasgow, and to an extent in Edinburgh, people were crammed into housing, sometimes with 8 people sharing a single room.
Washrooms were essentially non-existent in the 19th century. In Dundee in 1861, for a population of 90,000, there were only 5 toilets. Drinking water came from wells and a main well was polluted by the slaughterhouse. About 1% of all homes had no windows therefore 8000 odd families had no access indoors to light. There is a comment about ‘offal’ being deposited on streets.
Little improvement had been noticed at the beginning of the 20th century. The lifestyle presented a health hazard. Children in particular in major cities had death rates (0 – 5 years) of 100 per 1000. Other children suffered from various ailments like impaired hearing and poor eyesight. Poor hearing could come from illnesses like swollen throats, where the Eustacian tube becomes damaged.
In fact, there were likely many diseases that were still to be discovered. Health conditions began to improve only after 1919 when council houses were introduced. Of course, many were government subsidized and many capitalists likely protested just as they likely protested when children were forbidden by law to work in coal mines and factories.
Polio peaked in the pre WW I era then went away on it own. It flared up several times and disappeared on its own. naturally, when the polio vaccine was introduced in the 1950s, it was given credit for eradicating polio.
It was only after WW II that healthy conditions began to improve but there was likely a delay before health improved. Meantime, in the same era, rocket scientists who were issuing vaccines claimed credit for the freedom from diseases like measles and polio.
How do we know it was the vaccines and not a general increase in immunity die to better health?
The campaign launched by the World Health Organization in 1967 against smallpox, one of the oldest and most devastating viruses to affect humans, is a good example of how vaccination reduces transmission. Smallpox transmission declined proportionally with increased inoculation rates. The last known case occurred in Somalia in 1977, largely because the region was among the last to reach sufficient vaccination coverage to stop the virus entirely.
https://www.cdc.gov/smallpox/about/history.html#:~:text=Smallpox%20dates%20back%20at%20least,in%20the%2010th%20century.
https://www.indigenousmexico.org/articles/smallpox-comes-to-the-americas-1507-1524?format=amp
As stated earlier, the smallpox epidemic broke out in Tenochtitln around September 1520. The epidemic lasted for at least seventy days and struck people in every corner of the city, immobilizing much of the population. Many of the afflicted could not walk or move. While many died from the plague itself, some died from hunger. Individuals who were sick with smallpox could not get out to procure or prepare food. They were also too sick to care for their other family members, so some native people starved to death in their beds. Some people came down with a milder form of the disease and would eventually recover. However, their looks were ravaged, for wherever a sore broke out, it gouged an ugly pockmark in the skin. And a large number of survivors lost their sight.
Gordon cannot be taken seriously. He thinks he is being funny by mixing completely false crap in with an occasional fact.
Is anyone actually amused? Anyone? Bueller?
No matter what he writes about, Robertson never bothers with real information, instead posting either his own nonsense or pseudo-scientific stuff he reads on contrarian blogs.
His blabber about time, the Moon not rotating or NOAA’s 1500 stations is pretty funny, but his deliberate misinformation about polio or the Russian war on Ukraine is incredibly disgusting.
*
I remember all too well an acquaintance in France who contracted polio in California in the 1950s because, unlike me, he had not been vaccinated against poliomyelitis as a child.
From then on, he was confined to a wheelchair.
*
I’m 100% sure that Robertson is vaccinated since evah against diphtheria, tetanus, pertussis and… polio.
Barry,
Didn’t you argue That Jack Smith was legally appointed? You said he’d win the appeal of Cannon’s dismissal. Didn’t you say that?
Special Counsels are legal appointments. The DoJ under Republican presidencies have appointed many in the 21st century. Same with Democrat presidencies. The arguments that it is not constitutional have been rejected many times by the courts, and this conclusion has never deviated after multiple attempts. The opinion that it is unconstitutional is as bipartisan as it is opportunistic. Both Repubs and Dems have tried to get rid of special counsels when it suited their political interests.
“You said he’d win the appeal of Cannons dismissal.”
I don’t know what you mean by this. Dismissal of what?
I can’t remember if I said that, but I am sure he would have won the dismissal of the case on the grounds Canon gave, that Smith’s appointment was unconstitutional.
Jack Smith dropped the appeal in November after Trump’s win, on DoJ policy of not indicting a sitting president, and DoJ dropped the appeal on the co-conspirators recently I just read.
So we’ll never know.
The DoJ said it would not release Jack Smith’s report fully while the appeals case was ongoing.
I’ll bet you a hundred dollars than the DoJ was keep it out of the public eye now that the appeals process has been abandoned.
The Cannon ruling was just recently ruled on by the Appeals Court. Her ruling was affirmed by the court.
Sorry, Canon. The SCOTUS has never ruled on the Special Counsel. If it goes to this court then I believe the court will rule against the Special Counsel. The AG has not Constitutional authority to appoint a Special Counsel.
Could you provide a link to the 11th circuit ruling? I understood that they accepted the file for dismissal and never ruled.
Please corroborate.
The Special Counsel office is a DOJ regulation that has no Constitutional authority. Durham has legitimacy because he was appointed as a Federal Prosecutor by President Trump and then assigned as a Special Counsel by Barr. But, he had been appointed by a President and confirmed by the Senate. Jack Smith? No.
Stephen,
That makes no sense. The AG works for the President. He appoints or fires people all the time. None of it is Unconstitutional.
He could have appointed an existing DOJ prosecutor under him to do the investigation.
But he wanted to remove himself as much as possible from cries that he is unduly influencing the investigation.
Makes good sense for investigation of Trump or Hunter.
So this is all a red herring.
It has constitutional authority under the Appointments Act of the US constitution under the title of ‘inferior officers’, and this position was codified into law by congress, which authorised the Attorney General to appoint them.
This has been upheld in courts over and again. I’ve listed some below.
BTW Stephen, special councils have been appointed for at least 150 years. US Grant’s Admin did it.
So if just now it is decided that it is unconstitutional, that would be quite a reversal of ordinary practice.
stephen, I can point to many of Biden’s failings, missteps and bad decisions, most recently his presidential pardoning of his family members. I’m not one-sided.
Few of the criticisms you parrot from MAGAland are rooted in any kind of fact. Weaponising the DoJ is one of those, for example.
How long do you think I’ll be waiting for documentary evidence of that, of the same quality of Trump’s documented efforts?
The appointment of Jack Smith was weaponizing the DOJ. He was illegally appointed. Not rooted in the Constitution. The DC case and the Mar A Lago case were illegal.
Then the case against Hunter biden was illegal. The Meuller investigation was illegal. The Durham investigation was illegal. Robert Hur’s investigation of Joe Biden’s document handling was illegal.
When Garland gave Hunter Biden’s prosecuting attorney special counsel status, this removed DoJ oversight, allowing the prosecution that began under the Trump administration to continue outside the new DoJ under the Biden administration.
Let’s quote the Appointments Clause from the constitution:
“He shall have Power, by and with the Advice and Consent of the Senate, to make Treaties, provided two thirds of the Senators present concur; and he shall nominate, and by and with the Advice and Consent of the Senate, shall appoint Ambassadors, other public Ministers and Consuls, Judges of the supreme Court, and all other Officers of the United States, whose Appointments are not herein otherwise provided for, and which shall be established by Law: but the Congress may by Law vest the Appointment of such inferior Officers, as they think proper, in the President alone, in the Courts of Law, or in the Heads of Departments.”
Because Special Counsels are temporary positions, they have been treated as Inferior Offices, and this argument has been held valid in every court case (there have been dozens) that has sought to challenge the constitutionality of special counsels.
Tell me, can you honestly say that you ever objected to Republican appointed special counsels? Or did you only object to Democrat appointed ones?
Honestly, now.
Hey, you might have some hope of understanding this at some point.
I’ll take your non answer as a concession to the constitutional provision for inferior officers applying to special counsel, as courts have confirmed in numerous cases.
We don’t live in a Democracy. We live in a Bureaucracy. We want to restore the Democracy…..Elon Musk.
Actually you live in an oligarchy.
Rule by the wealthy.
That’s rich coming from a Brit.
If I wanted to stand as a Member of Parliament in Northern Ireland the spending cap for my campaign is 54,000.
Elon Musk purchased his current position as consigleri to Donald Trump with a campaign donation of $200 million.
There’s no comparison.
Yup, the two most powerful people in the US right now are billionaires from wealthy families. Musk is the richest man on the planet.
He is performing government functions with zero oversight. The administration has been and continues to remove oversight instruments as they gut the bureaucracy.
You are a sneaky propagandist. No oversight? Are you corrupt or clueless? He has reported to Congress several times and everything he does is completely open. He reports it on X.
You cannot be serious that a government agency makes official reports on a social media platform. What is wrong with you? Do you think Congress should just do their stuff on facebook?
Good God.
As far as I am aware, Musk has never reported DOGE’s work to congress.
I keep asking you for links to corroborate things you say. You never provide.
Are you going to corroborate this, or just let this slide, too?
He reports on X?
Absurd, Stephen.
Congress asks hard questions. That is their job to do oversight.
Just as the IGs job, before they were fired, was to protect us from a rogue government, which you should be all for.
I can find no evidence that Musk has reported to congress on DOGE.
Come on stephen, put up a link or be honest and admit you got that wrong. If you corroborate, I won’t let it slide, I’ll acknowledge it.
I’M not sneaky.
https://www.youtube.com/watch?v=74Xrd2bEGMk
“I can find no evidence that Musk has reported to congress on DOGE.”
And that ain’t it.
Clicking on the video I get:
“This live stream recording is not available.”
The description suggests that this was not a report to Congress.
Barry,
Should we do to ourselves what Germany has done to itself? It is imploding. Is that what you want? Of course it is.
I’m saying that the Trump administration shouldn’t do what Germany did in the late 1930s and draw unreasonable power to the executive branch.
So you accuse Trump of doing something he hasn’t done all the while saying nothing when Biden didn’t defend our border, let illegals go and gave them money, and unilaterally forgave student loans. Not to mention stealing classified information when he was a Senator and VP.
stephen,
“Morrison v. Olson, 487 U.S. 654 (1988), was a Supreme Court of the United States decision that determined the Independent Counsel Act was constitutional. Morrison also set important precedent determining the scope of Congress’s ability to encumber the President’s authority to remove Officers of the United States from office. In Seila Law LLC v. Consumer Financial Protection Bureau (2020), the Supreme Court distinguished Morrison as a narrow exception applying only to inferior officers.”
https://en.wikipedia.org/wiki/Morrison_v._Olson
United States v. Concord Management & Consulting LLC (2018)
“Concord Management and Consulting LLC moves to dismiss the indictment on the ground that Special Counsel Robert Mueller was appointed unlawfully by Acting Attorney General Rod Rosenstein. Dkt. 36. The Court will deny Concord’s motion. The Special Counsel’s appointment complies with the Constitution’s Appointments Clause because (1) the Special Counsel is an “inferior Officer”; and (2) Congress “by Law vest[ed]” the Acting Attorney General with the power to make the appointment. U.S. Const. art. II, 2, cl. 2.”
https://case-law.vlex.com/vid/united-states-v-concord-888675686
IN RE: GRAND JURY INVESTIGATION (2019)
“Because the Special Counsel is an inferior officer, and the Deputy Attorney General became the head of the Department by virtue of becoming the Acting Attorney General as a result of a vacancy created by the disability of the Attorney General through recusal on the matter, we hold that Miller’s challenge to the appointment of the Special Counsel fails. Accordingly, we affirm the order finding Miller in civil contempt.”
https://caselaw.findlaw.com/court/us-dc-circuit/1982569.html
I can go on providing court rulings like these.
Please provide at least two appeal court rulings that that uphold the contention that special counsel is unconstitutional.
I’ve also provided a SCOTUS ruling, so you get bonus marks for finding a supreme court ruling on the matter.
Over to you.
Barry,
You are lost. The Judge Canon ruling that was recently affirmed by the Appeals Court. The Special Counsel regulation is dead.
You’re wrong. That’s why you can’t provide a cite of the ruling or a link to it.
Go on, try.
“That was recently affirmed by the Appeals Court. The Special Counsel regulation is dead.”
Totally false Stephen. Stop posting this misinformation.
Barry,
You are a sly little obfuscator, aren’t you? Either you are doing it intentionally, or you’re just that corrupt or stupid. The Independent Counsel Act expired and has nothing to do with Special Counsel. The Supreme Court has never ruled on the Special Counsel Regulation established by Janet Reno. It is unconstitutional.
The Supreme Court verified that special prosecutors did not need to be confirmed. Read the ruling:
“The independent counsel is an ‘inferior officer’ under the Appointments Clause by virtue of the fact that she is subject to removal by a higher Executive Branch official and empowered only to perform certain, limited duties.”
I also quoted two recent rulings from appeals courts that verified special counsels are inferior officers and therefore constitutional.
The constitution makes the provision for inferior officers contingent on congress making law allowing it. And here are the relevant passages from the relevant Acts.
28 U.S.C. 533(1): – Investigative authority of the DoJ
“The Attorney General may appoint officials(1) to detect and prosecute crimes against the United States.”
28 U.S.C. 515(a): – Authority for Special Counsel to Conduct Investigations
“The Attorney General or any other officer of the Department of Justice, or any attorney specially appointed under law, may, when specifically directed by the Attorney General, conduct any kind of legal proceeding, civil or criminal, including grand jury proceedings and proceedings before committing magistrate judges, which United States attorneys are authorized by law to conduct.”
Special Counsel are constitutional.
Speaking of slyness, I notice you did not present even one appeals case that contradicted what the court cases even from 2018 and 2019 have confirmed.
You will not find any, because except for Eileen Canon all courts have ruled that temporary appointments are not required to be confirmed by congress under the Appointments clause of the constitution.
stephen,
The Presidential Records Act states:
“(g)(1) Upon the conclusion of a President’s term of office, or if a President serves consecutive terms upon the conclusion of the last term, the Archivist of the United States shall assume responsibility for the custody, control, and preservation of, and access to, the Presidential records of that President. The Archivist shall have an affirmative duty to make such records available to the public as rapidly and completely as possible consistent with the provisions of this chapter.”
https://uscode.house.gov/view.xhtml?path=/prelim@title44/chapter22&edition=prelim
In light of this law, why do you think Trump or any president has the right to hold on to presidential records or classified documents after their term, and when the Archivist requests them, as National Archives did repeatedly?
(You can check the link for what presidential records are)
I thought this was a climate blog? its turning into the comments page in The Guardian.meanwhile the climate continues as before just as it has for over 3 billion years.
Ian Brown
Why don’t you move to Watts’ WUWT?
There you find all you need.
Ian,
Do you think there is a difference between the Climate Crazies and your standard run-of-the-mill leftist?
Barry,
The Presidential Records Act is a civil statute. Presidents have great deference about what they can and can’t keep. It is a negotiation between the archives and the President. How do we know this? The courts have ruled this. Presidents can decide what is classified or not instantly. If you walk into the President’s office and he hands you a piece of TS material, then it is immediately declassified. When I was in the military with my TS/ESI clearance it was stamped by the National Command Authority. Who is the National Command Authority? It is the President. The Biden Administration and Garland turned it into a joke, two numbskulls along with Jack Smith.
None of this is true.
A statute IS a law. The federal law against murder is a statute.
18 U.S.C. 1111
(a) Murder is the unlawful killing of a human being with malice aforethought
The statute on presidential records is binding.
It doesn’t matter if the president declassifies a document, it is still government property, not his personal property, and subject to the Presidential Records Act, which is legally binding and enforceable, which is why a grand jury issued a subpoena to Trump for the documents, and how the FBI obtained a warrant.
Trump never negotiated on the documents. He simply took them and then refused to hand them all over.
“Presidents have great deference about what they can and cant keep.”
Complete fiction.
I’m wasting my time asking you for corroborating links, aren’t I? You got this rubbish off facebook, right?
“Presidents can decide what is classified or not instantly.”
But not ex-Presidents!
Stop defending ridiculous behavior, Stephen!
Given all the characters passing through Mara Lago, it would be a total deriliction of duty for the govt to allow highly classified docs to be there in a non-secure closet.
Thus they first politely asked for them back. Then got more insistent.
Nate,
Sure they can. The FBI breaks into MarALago and Trump says “All that is declassified.” A President only has to think it. The courts have already ruled on this Nate.
Barry,
It is a civil statute. It isn’t a criminal statute. Civil matters are arbitrated and negotiated.
I need to amend. The subpoena was for classified documents, the warrant was for all presidential records.
Civil statutes are still law. They are more susceptible to negotiation than the criminal law (plea deals, sentencing), but the PRA is very clear, and Trump clearly contravened sufficient to have a subpoena and a warrant visited on him.
A neutral reading of the case shows that not only did Trump not declassify the records (his subordinated confirmed there was no blanket order, and his lawyers never made that claim when in court), he wilfully obstructed their retrieval.
The president is not a king. While he has the power to declassify (and classify) documents, he does not then retain the authority to keep them after his presidency. Trump clearly violated several laws in doing so (espionage act, obstruction of justice), which if you read the documented evidence is quite clear. How else could it be that there were still 300 classified documents and many more government records found when Trump had claimed it was all accounted for in the first and second round of records being retrieved from him? The security footage of boxes being moved after the subpoena had been issued, and testimony from administration aides confirmed why even more documents were found during the raid 18 months after NARA’s first request to get the documents back.
As has been remarked, it was not the crime but the coverup that was the greater fault.
Like all law, Trump got to argue his case in court. The DoJ just shut the case down, but the evidence is now public, and an objective reader shouldn’t have to work too hard to arrive at the reasonable conclusion Trump hid the records, including classified documents, from the government after he left the presidency.
“Presidents have great deference about what they can and can’t keep. It is a negotiation between the archives and the President. How do we know this? The courts have ruled this.”
I challenge you to show me a ruling post the PRA that corroborates a president should be deferred to on what presidential records they can and can’t keep, in negotiations with NARA.
If you know the courts ruled on this, it shouldn’t be too hard to furnish a link.
Otherwise we will be forced to consign this notion to where it belongs.
Oh, you challenge me do you? Is your ignorance willful or plain ignorance?
“The National Archives does not have the authority to designate materials as presidential records. It lacks any right, duty, or means to seize control of them…..Judge Amy Berman Jackson in her ruling in the Clinton vs. National Archives case. No court has ever overturned her ruling.
Only a bunch of arrogant leftists would charge a former President with violating the Espionage Act for keeping records. It didn’t work out too well for them, did it?
I looked up Clinton vs. National Archives, and this only applies to sitting presidents. Once the president leaves office PRA applies and presidential records are to be handed over to NARA. The PRA describes what constitutes a presidential record.
While I haven’t always said ‘former’ president, that is what I’ve meant, as I’ve elaborated on here and there, also acknowledging his rights to hold documents while sitting as president (eg, in this post). I have assumed this was understood.
Once the president leaves office, NARA must receive all presidential records as outlined in the PRA.
And this is also sensible in terms of national security, as no president should causally retain classified documents that could be stolen.
“Sure they can. The FBI breaks into MarALago and Trump says All that is declassified. A President only has to think it. The courts have already ruled on this Nate.”
Utterly stoopid and wrong Stephen. An ex-President no longer has the powers of the President.
“A President only has to think it.”
This is parroting Donald Trump, and it is BS.
It’s so BS that at no time during the case over a year and a half did his lawyers ever make that case. They did not even argue that Trump had declassified the documents. Because they had no record of it, and no judge was going to acept that the president just has to imagine that classified documents are declassified for that to be true.
stephen is just parroting Honest Don here.
A former attorney for Trump was on CNN (that conservative news channels that always favors Trump — sarcasm for those who don’t get it). He said it was the Archivist to blame. He suggested it was a classic setup. He explained that all presidents just grab everything and go at the end of their administration. Nothing is initially sorted. This claim was never challenged by the CNN fact checkers.
The Archivist sets up a location were items are sent to be sorted by type to include, government property, classified documents, and personal documents. That never happened with Trump. The Archivist never set up the location, so Trump kept everything on his own.
Now it gets fuzzy. Remember that statements by the attorneys are not facts — they are arguments. Prosecutors and critics will claim that although the Archivist was late — apparently very late — Trump should have been more cooperative when the location was finally setup. That is the legal battle. Who was late, and how late were they?
This attorney stated he was not longer on the case because he disagreed with the way the case was being handled. What does that mean?
So why didn’t Trump’s attorneys blame the Archivist in court? They had plenty of time to do so as they sought to delay.
Because this argument is probably false, or so weak that it couldn’t be contended in a serious setting.
Here are the issues they did contend.
https://www.cnn.com/2024/02/22/politics/trump-moves-dismiss-classified-documents-case/index.html
It’s very hard to give much credence to Trump’s attorneys, who have been lambasted by judges time and again for shoddy and/or fallacious argument.
What does what Trump’s attorneys argue have anything to do with the price of tea in China? Just because Trump’s attorneys didn’t argue it doesn’t make the point valid. Trump’s attorneys argued what they thought would work best for their client at the time. However, many including Mark Levin and Alan Dershowitz have question Trump’s attorneys strategies. It took outside sources Like Justice Thomas to show Trump’s attorneys how to argue the Florida Case.
Not a scientist here, but studied climate about 50 years agoB.S. one year of grad school, 4 years working in funded research. I remember well the current science on climate change back then (global cooling because of earths changing albedo). I have read many of the popular books of the warming critics. Still fascinated with weather and climate. So, not a newbie to this topic either.
I have taken one of these monthly satellite temp graphs and simply marked on the graph the general time periods of la Ninas and el ninos. As Andy Griffith would say surprise, surprise! Almost every temp spike – up or down – coincides with the stronger ENSO periods.
No surprise at all.
The lower troposphere watched by e.g. UAH, RSS and NOAA STAR (microwave sounding) or RATPAC (radiosondes) is extremely sensitive to ENSO signals.
Something that’s dropped out of the news.
A few weeks ago tens of thousands of (mostly) hispanics were arrested and seem to have disappeared.
What happened to them?
How many have been deported, how many are in concentration camps and how many are dead?
Looks like Ent has some fake news to go along with his fake science.
Has Trump not made good on his promise to round up illegal immigrants?
I believe he has. How many, and where are they held and processed?
Barry, Youre clogging the blog with leftist crap. Stop it.
Barry only replies to those who clog up the blog with their ultra-rightwing crap.
Let him do it.
Ken
I think barry is doing a great job of research and challeging stephen p anderson with evidence and facts. What is he actually posting that is “leftist crap”?
Trump Derangement Syndrome is basically leftist crap.
Evidence and fact it is not.
Actually I’m talking more about the radicals running the administration. Trump is mostly a passenger, or a useful….
I’m substantiating with numerous links to legislative records, court filings and other source material, while my cointerlocutors are providing zero substantive evidence.
So complain about a lack of facts and evidence to whom deserves the attention.
First, you claim the Supreme Court has ruled on the Special Counsel regulation, it hasn’t. Second, the Appeals Court just affirmed Judge Canon’s ruling that the Special Counsel as a prosecutor is unconstitutional. Mueller never brought a case he only investigated. However, the Special Counsel office was never established by law according to the Constitution. So, Special Counsel fails on two fronts. You can agree with Barry all you want Norman. You’re both wrong.
SCOTUS in 1988 (Morrison v Olson) ruled on the constitutional principle that inferior officers may be appointed as independent prosecutors without congressional confirmation.
“We therefore hold that the independent counsel is an ‘inferior’ officer under the Appointments Clause.”
The reasons they held this were that, they were temporary, had limited jurisdiction, and that they could be fired (are subordinate to the agency head). These terms are the same for modern special counsel. Note also that the ruling was not based on the manner of appointment, only on the status of it.
The relevant part of the constitution states:
…but the Congress may by Law vest the Appointment of such inferior Officers, as they think proper, in the President alone, in the Courts of Law, or in the Heads of Departments.
Congressional statutes passed long ago give the Attorney General full authority over DoJ (28 U.S.C. 509), lets the Attorney General delegate functions to other officers, (28 U.S.C. 510), allows the Attorney General to appoint “special attorneys” to conduct investigations and prosecutions (28 U.S.C. 515), and grants authority to investigate federal crimes, (28 U.S.C. 533).
515 is most explicit about the authority for DoJ to appoint special counsel.
(a) The Attorney General or any other officer of the Department of Justice, or any attorney specially appointed by the Attorney General under law, may, when specifically directed by the Attorney General, conduct any kind of legal proceeding, civil or criminal, including grand jury proceedings and proceedings before committing magistrate judges, which United States attorneys are authorized by law to conduct, whether or not he is a resident of the district in which the proceeding is brought.
b)Each attorney specially retained under authority of the Department of Justice shall be commissioned as special assistant to the Attorney General or special attorney, and shall take the oath required by law….
As the AG is statutorially authorised to delegate responsibilities under his full authority of the DoJ, he may appoint special counsel under law.
Judge Canon was twice overruled by the 11th Circuit on the case about Trump’s documents. Had the appeal against her ruling been heard, she would have been overruled again.
When are you going to provide a link or court reference to what you claim was the ruling on the appeal? You haven’t yet, just claimed it happened, and I have not been able to corroborate. So I think you have it wrong.
Link up, stephen, or find a good source and get someone to show you how to link it here.
Barry,
Listen to yourself. You don’t even listen to what you read. The Office of the Independent Counsel was established By Law. The Office of the Special Counsel was not established By Law. The AG had no authority to establish the office. If Congress had established the office then yes the AG could appoint a Special Counsel. They didn’t. And, you keep going in circles.
Also, another point that will probably need to be litigated is whether a Special Counsel is an inferior officer. A Special Counsel has all the powers supposedly of a Federal prosecutor. That is not an inferior officer.
“The AG had no authority to establish the office”
No office was established. An Office is a permanent, ongoing instrument.
There is an Office of Special Counsel, an entity separate from the DoJ, and nothing to do with what we are talking about. It is also congressionally authorised.
Special counsels are temporary appointments by the AG. These positions are not invested under their own office. Congress has authorised the AG to appoint such officers when he/she deems necessary. I just cited and linked for you the relevant congressional statutes. Which you have ignored while you try to assert straw men notions like Offices.
Read the post again. The constitution establishes that inferior officers are non-confirmed appointments appointed by the president or heads of agencies, eg the AG. Congress has to pass laws to authorise.
Congress has passed laws specifically authorising “The Attorney General or any other officer of the Department of Justice, or any attorney specially appointed by the Attorney General under law, may, when specifically directed by the Attorney General, conduct any kind of legal proceeding, civil or criminal, including grand jury proceedings and proceedings before committing magistrate judges, which United States attorneys are authorized by law to conduct…”
The statutes covering the AGs authority to appoint people, and the statutes that describe the powers and limits of these appointees are the law under which they may be appointed. I’ve cited those statutes above. They are short, Go and read them, and then explain to me how these statutes fail to give the AG authority to appoint special counsel. Which is not an “Office.”
“Also, another point that will probably need to be litigated is whether a Special Counsel is an inferior officer. A Special Counsel has all the powers supposedly of a Federal prosecutor. That is not an inferior officer.”
An inferior officer, as described by SCOTUS, is a temporary position that may be fired by the appointer, and their appointment has limited jurisdiction.
Special counsel fits all these. There powers are not circumscribed in the constitution, but they are set out in the congressional statutes, where they are given the same powers as any attorney in the DoJ, as long as their appointment is by the AG, who is the only person given the power to appoint them.
Man, you’re a genius Ent. Why don’t you ask Biden what happened to the millions of illegals he released?
I know a couple of them remodeled my bathroom.
We need a few more in California and North Carolina.
Found this.
https://www.bbc.co.uk/news/articles/c3rndygqll7o
900 deportees imprisoned in Panama.
Current temperature in Texas.
https://i.ibb.co/bMhfSs6V/Screenshot-2025-02-19-17-15-16.png
Thanks for this very valuable hint on… Global Cooling!
Bindidon, please stop trolling.
Aaah… The pseudo-moderator has a very active imitator, as we can see.
https://www.drroyspencer.com/2025/02/uah-v6-1-global-temperature-update-for-january-2025-0-46-deg-c/#comment-1698715
1. Did you possibly overlook a tiny detail?
1.1 This is the image of daily data dated Feb 16:
https://postimg.cc/d7r1JHfp
Extent: 50.25 Mkm^2
1.2 This is the image of daily data dated Feb 18:
https://i.postimg.cc/3N6CtqBd/multisensor-4km-nh-snow-extent-by-year-graph-18-Feb-2025.png
Extent: 43.62 Mkm^2
And… where are the 50.25 Mkm^2 obtained two days ago??
Adjusted?
*
1.3 This is the image of weekly data till 2025, week 5:
https://drive.google.com/file/d/1SOaXDMyp-ELNhE370LB41xfOQwN2_UiA/view?usp=drive_link
which is the last week in this year for which Rutgers offers data.
Feel free to search for the daily data used to present the cryosphere images, and to generate the weekly average.
*
2. Should you actually not understand why to average the daily data into weeks, here is a hint showing the difference between daily and monthly data.
2.1 This is the image of SSN daily data till Feb 19 (Feb 1-19 estimated):
https://drive.google.com/file/d/1ZrnKNnn63zLZaseEefLhlBGjJcS27IhQ/view
2.2 This is the image of SSN monthly data till Feb (Feb estimated):
https://drive.google.com/file/d/1ZXKy96mHyuMttcg2vy7k0b3DeLfKzmML/view
*
Maybe rather you should finally stop trolling…
https://i.ibb.co/Y7yzvttF/ventusky-temperature-2m-20250220t1300.jpg
stephen, the appeal on Canon’s ruling cannot have been heard because the 11th circuit granted the DoJ’s motion to dismiss the case without being heard.
“Washington A federal appeals court formally granted the Justice Department’s request to drop the case against two of President Trump’s co-defendants in the prosecution over his handling of classified documents, bringing an end to the last remaining case stemming from former special counsel Jack Smith’s investigations.”
https://www.cbsnews.com/news/trump-documents-case-walt-nauta-carlos-de-oliveira-case-dismissed/
As I said.
The agreement to dismiss was a one-line response. But if you truly believe “the Appeals Court just affirmed Judge Canons ruling that the Special Counsel as a prosecutor is unconstitutional,” please provide a reference, preferably a link.
Because I think you’ve mistaken the DoJ closing the case for an actual hearing and ruling on the appeal.
How would this affect climate change?
https://www.sciencealert.com/odds-of-city-killer-asteroid-impact-in-2032-now-even-higher-says-nasa
As a followup. What if it hits the moon? How would that affect the spin of the moon?
Discuss.
Whether it increased or decreased the Moon’s rotation would depend on where it hit.
However it’s mass is too small to have a measurable effect.
Averaged over a large number of impacts there is a tendency to spin up a planet in the direction of its orbit, as happened when the Solar System formed.
This is why, viewed from above the Sun’s North Pole, most of the planets orbit anticlockwise and rotate anticlockwise.
Testing
“As a followup. What if it hits the moon? How would that affect the spin of the moon?”
The Moon is tidally locked with Earth.
The Earth and our Moon are constantly been impacted with space rocks- and that is not a very big space rock.
Tim S
Asteroids hitting the Moon can if large enough cause perturbations in the Moon’s rotation, called free physical librations (as opposed to the forced librations caused by surrounding celestial bodies such as the Sun, Earth, etc.).
Unlike the more familiar optical librations (longitudinal, latitudinal, diurnal librations), which have been directly observable for millennia, physical librations are real irregularities in the rotation that can only be detected with appropriate observation equipment and complex calculations, e.g. high-resolution, star-calibrated photography for a century or Lunar Laser Ranging since the late 1960s.
*
See the list
https://drive.google.com/file/d/13DRDH1OFOUHYM_6HKH19sbj28yckJMF7/view
and select more recent work, e.g. B. Mulholland (1974), Calamé (1976) and following.
Even though I, as a layman, cannot follow the mathematics in such essays, the texts are nevertheless very interesting.
*
Finally, I doubt that the impact of such a small celestial body could influence the rotation of the Moon. However, this could be the case with e.g. a 20-50 km large asteroid.
It would depend on whether it made impact on the surface or disintegrated in the atmosphere, whether it hit the land or oceans, what kind of land it hit, or what kind of ocean water it hit (coastal, polar, deep sea).
I’d guess that generally a land hit would temperarily cool the surface of the Earth from atmospheric dimming due to debris flung aloft. An ocean hit would cause short-term warming (maybe a few weeks at most) from the millions of tonnes of water vapourised into the atmosphere. But this would rain out before long.
That’s setting aside any other kinds of probably devastating impacts. An ocean hit would generate a massive tsunami, I would imagine, which would affect a huge length of coastline.
A 100 meter rock wouldn’t cause a tsunami. The mega tsunamis we have witnessed are the result of massive land shift that displaces a lot more water than a 100 meter rock.
The biggest risk will be to anyone unfortunate enough to be within a hundred kilometers of impact. The article correctly describes a potential impact as a ‘city killer’. Its not going to cause ELE.
“A 100 meter rock wouldnt cause a tsunami.”
I looked it up and you’re right.
” How would this affect climate change? ”
Very certainly much less than violent eruptions like Samalas in 1257, with VEI 7/8.
stephen…”Only a bunch of arrogant leftists would charge a former President with violating the Espionage Act for keeping records. It didnt work out too well for them, did it?”
***
Could not agree more. There is little doubt that Trump was targeted by misanthropes bent on destroying democracy to realize their bent views of the world.
I tend to agree with you on matters and I would appreciate an objective response, if you feel like responding. I am interested in how Trump’s policies will affect you as an individual.
Anyway, although I supported Trump from afar I am not influenced by the same nationalistic fervour as you, and when he attacked Canada, I began to see a meanness in his approach. I am not supporting Canada from a blind nationalism, I am supporting Canada as a great place to live, a place that Trump would reduce to a basic political and economic common denominator simply to get his hands on our resources. Since we told him to beggar off, he has gone after the Ukraine and Greenland in search of those resources.
Even when I supported Trump, I was fully aware of his uber-right wing agenda and how I had nothing in common with him in that respect. I have nothing against responsible capitalism, in fact, I have participated in it. However, it appears that unless you are a millionaire, I hope you don’t think his interests are your interests. You don’t see any working class people in his entourage, now or ever.
It appears to me that what Trump has envisioned, making the US great again, is exactly the opposite of what he has accomplished in one month. He has essentially alienated large portions of the planet against the US.
The US had never been great without support of allies, that Trump is working hard to alienate.
The problem, as claimed by a former US envoy, is that he is now treating problems as he did a land developer in New York. He now regards former allies as competitors with whom he has to negotiate, using every devious tactic imaginable. That’s how corporate negotiators work and it is part of the reason they are roundly detested.
That’s not what we expect from a US President, especially compared to Franklin Roosevelt who played a major role defeating Nazism. Even when the US, in general, wanted to remain neutral in WWII, FDR saw the implications if the UK fell to Hitler, and acted behind the scenes to ensure the UK survived. Had they fallen, a totally unprepared US would have had to face Germany from the east and Japan from the west.
Even the most optimistic person would doubt the US would have survived. They were simply not ready.
It appears that Trump’s MO would have been to negotiate a deal with Hitler, much like Joseph Kennedy proposed, before FDR recalled him as ambassador to the UK for shooting off his mouth.
There are times when people need to put away their right wing and left wing political views and see exactly what is going on. It appears to me that Trump lacks such an ability. Maybe I am wrong but that’s what I am seeing.
As far as I see it, democracy and freedom far outweigh the beliefs of the right and left wing and there are times when people of opposing views need to drop their beliefs and work together, as they did in WW I and WW II.
thomas hagedorn…”I have taken one of these monthly satellite temp graphs and simply marked on the graph the general time periods of la Ninas and el ninos. As Andy Griffith would say surprise, surprise! Almost every temp spike up or down coincides with the stronger ENSO periods”.
***
We knew that just from looking at Roy’s monthly graphs. The problem is, the sharply spiked 1998 EN fell off quickly then inexplicably rebounded 0.2C, then leveled off for he next 15 years with a flat trend.
The 2016 EN was different. It did not feature a sharp decline as in 1998, rather it hung around for six years, featuring another 0.2C rise culminating in a flat trend during the six years.
The most recent spike seems related to the Hunga Tonga explosion. Too many unexplained events to simply blame it on ENs. Anthropogenic warming has never been proved and the continual warming is likely related to an on-going recovery from the Little Ice Age.
Actually, broader research was done by Tsonis, dating back a century, and it involved all the ocean oscillations, not just ENSO. The study concluded that warming occurs when the oscillations are in phase and cools when out of phase.
What we are seeing with warming periods the last 25 years could simple be a local phase in an overall longer term change. For all we know, it could start cooling off again.
ian brown…”I thought this was a climate blog? its turning into the comments page in The Guardian.meanwhile the climate continues as before just as it has for over 3 billion years”.
***
Barry, an Ozzie, and a US political expert, in his own mind, has taken up the fallen Democrat cause and has been quoting the US Constitution to us. Barry has decided to support the sore loser cause rather than get on with the reality that Trump is now President and deal with that reality.
Re climate…this is but a small diversion. Trump has only been in office a month yet he has managed to flood the US with executive orders, some justified by dubious means. One of his plans is to withdraw the US from the Paris Accord, and I applaud him on that.
However, he has imposed a tariff on Canada based on the mistaken notion that Canada is enabling drug traffickers and not patrolling our borders, allowing aliens to enter the US illegally. When the smoke settles, I imagine we will get back to climate issues.
Barry fails to grasp that the Democrats set all this up by allowing a minority of so-called progressives to thumb their noses at a democratic way of life US voters had taken for granted as a civilized way of life. The same has happened in Canada, where similar Progressives have essentially ruined the fabric of our country. The backlash has caused the Prime Minister to resign and his party is left not only scurrying to regain voter support but to face an uber-right wing government running the US.
Unfortunately, one of the leading candidates for leader of the Liberal party, Carney, is a dyed in the wool climate alarmist. Some people never learn.
barry…”Im saying that the Trump administration shouldnt do what Germany did in the late 1930s and draw unreasonable power to the executive branch”.
***
By the late 1930s, there was no executive branch in Germany. By 1933, Hitler had grabbed power through brute force after having been elected to get in such a position.
Hitler grabbed power by literally beating people up in the streets. His Brown Shirts, or SS, were drawn from crude people with biker mentalities, like Martin Bohrmann, who terrorized people through brute force.
Where in present day US do you see that happening?
All Trump is doing at present is using questionable business tactics to negotiate. Agree or disagree, there is no comparison whatsoever to Nazi Germany in the 1930s.
I do question his tactic of harassing the Ukraine, a country literally on its knees, to negotiate a deal that would give him unprecedented power over the Ukraine economically and perhaps politically. Trumps tactics are in the scumbag category, and Zelensky had the spine to reject him.
You’re clogging the blog again.
Do you really think that your ‘startled virgin’ posts will stop a guy suffering under dementia, egomania and megalomania?
Hitler consolidated power by moving the purse strings from parliament to the executive, and took on parliament’s role of eliminating or restructuring government agencies and departments that didn’t suit his agenda.
Unlike Nazi Germany, the US has the system of checks and balances. Unfortunately, one third of this system is currently pliant to the trump administration – I’m still reasonably confident that the moderates in the Republican party won’t allow the worst impulses of the MAGA revolution and Project 2025 to come to fruition. The Department of Justice has been staffed with loyalists who put the presidency over the constitution, so the judicial branch is going to have a harder and harder time keeping a check on the overreach of the executive.
That being said, the Trump administration sees the whole system as corrupt, and thus have little respect for the law or for congress. They are quite blatantly not just testing to see how much power they can weild, but going ahead and wielding more than they’re due, trusting that no one will be able to hold them back.
I seldom pay attention to the politics here because I see that debate as never ending. People with invalid opinions and closed minds seldom change. That’s why I stick with facts. It’s easy to see who is denying reality. For example, responsible adults understand that there are no microwave ovens in the atmosphere.
The cult, like barry, Nate, Ent, Bindi, and Norman, should review “Godwin’s Law”. That’s the concept that once you invoke Hitler/Nazi in an Internet debate, you lose.
But, I’m enjoying the “Trump Derangement Syndrome” meltdown of the cult kids. It’s fun to watch. Please continue….
” The cult, like barry, Nate, Ent, Bindi, and Norman, should review Godwin’s Law. That’s the concept that once you invoke Hitler/Nazi in an Internet debate, you lose. ”
Once again, Clint R intentionally distorts the reality, by accusing those he denigrates as ‘the cult’ to ‘invoke Hitler/Nazi’.
The only one who does that here is Anderson, who is much, much nearer to Clint R than those the two regularly insult and denigrate.
Sorry Bindi, but I didn’t distort reality. That’s just one more of your false accusations.
When you ignore barry’s references to Hitler and Nazis, and ignore the fact that the ball-on-a-string is not spinning, then you prove me right, again.
Clint R
Again, you distort reality.
I did not ignore Barry’s reference to Hitler. It’s visible on the thread.
You continue to intentionally dissimulate the fact that Anderson is the true origin of talking about Hitler and the Nazis on this blog.
*
Concerning your ridiculous ball-on-a-string, I don’t claim that it is not spinning, this was done by others.
I claim that your ridiculous ball-on-a-string is not a valuable model for Moon’s motion.
“Concerning your ridiculous ball-on-a-string, I don’t claim that it is not spinning, this was done by others.”
Did you mean to write, “I don’t claim that it is spinning, this was done by others”?
Pseudomod
Thank you for the correction, I wrote a bit too quick indeed.
I don’t know how some people can manage to claim that a ball-on-a-string can spin (of course about the axis interesting us, namely that perpendicular to the plane containing the ball’s orbit).
Yes, it is a great mystery. I guess some people are perhaps blinded by their education? Who knows.
All I do know is, that I’ve spent years arguing against people who think a ball on a string is spinning. They’re utterly convinced that it is.
And, of course, none of those people would ever have the integrity to argue against you, Bindidon.
” And, of course, none of those people would ever have the integrity to argue against you, Bindidon. ”
About what?
Do ‘those people’ (whoever they are) not like me accept the results of about 300 years of observation & processing of lunar data?
About the ball on a string.
Believe it or not, most “Spinners” seem to think a ball on a string is spinning.
Also, believe it or not, you can have a discussion just about the ball on a string and whether or not it spins. It doesn’t have to be about the moon at all.
” It doesn’t have to be about the moon at all. ”
Maybe for you and your ‘friends’; but not for me.
I have stated so many times that I am only interested in technical, scientific refutations of the work presented in
https://drive.google.com/file/d/13DRDH1OFOUHYM_6HKH19sbj28yckJMF7/view
and NOT in discussions of purely gut-based thinking a la merry-go-round, ball-on-a-string, MOTL vs. MOTR and the like.
Thanks for accepting this.
OK, you only care about the moon. Got it. That’s understandable, because you haven’t spent years of your life being relentlessly personally attacked, belittled and ridiculed for simply arguing that a ball on a string doesn’t spin. You haven’t invested your time in those discussions, learning that apparently well-educated people can get such simple concepts so completely and utterly wrong, and how that reflects on the state of science and the people that claim to be here to teach it.
Fair enough.
Elliott Bignell
You did good work in enhancing your Tarderase with small bricks like bold’ing, itali’ing or quoting the selected areas.
A great help would be to add a fourth brick replacing the selected area with the result of
https://mothereff.in/html-entities
thus making UTF-8 characters ignored on this blog automatically visible.
Isn’t it amazing how the people of Europe have accepted JD Vance. I’m not talking about the leaders, or the media, but the people. They agree with him and everything he is saying.
Who told you that?
People in Europe do not accept JD Vance.
Correct grammar: Some people in Europe do not accept JD Vance’s speech.
I would suggest its the Marxist Woke Leftists that are unable or unwilling to accept any factual information that goes against their rather naive beliefs. The false Climate Change Narrative is one such belief.
Apparently, Ken belongs to those far right wing boys who think that anyone being a millimeter left to them is a ‘Marxist Woke Leftist’.
That’s one of the best political ‘ball-on-a-string’s I’ve ever heard about.
https://youtu.be/4scWf4WKiic?si=hHE7qoirxms1KhMm
You say?
No wonder Blinny is the way he is. Germany just fined a politician for posting a fact about immigrant crime. She was fined for speech.
How come the Lower Troposphere does not include Jan 2025 but the rest do?
See
https://vortex.nsstc.uah.edu/data/msu/v6.1/tlt/uahncdc_lt_6.1.txt
Yes, I queried Roy about it upthread, but who knows if he saw the post?
Ok, it’s been posted.
And
https://vortex.nsstc.uah.edu/data/msu/v6.1/tmt/uahncdc_mt_6.1.txt
No surprise that a dumb, aggressive liar like the 6.0L pickup driver (I mean Anderson of course) who denigrates and insults me as a ‘Nazi’ tries to claim nonsense like this:
” Isnt it amazing how the people of Europe have accepted JD Vance. Im not talking about the leaders, or the media, but the people. They agree with him and everything he is saying. ”
*
Anderson is, as are probably 80% of the lovers of Elonald Muskrump, 100% fixated on misinformation sources like Breitbart, Fox News, etcetera.
*
That’s the reason why he doesn’t understand that only those ‘people of Europe’ who belong to the ultra-rightwing part of Europe’s society are fans of Musk, Trump and Vance.
Means for example
– in Germoney, the AfD together with the ultra-rightwing end of CDU/CSU
– in France, the Rassemblement National
– in Spain, Vox
– in Italy, Fratelli dItalia (Postfascists)
– in Hungaria, Fidesz
etc etc etc.
*
Is it a suprise that all these ultra-rightwing guys & dolls are fans of not only Musk, Trump and Vance, but also of… Putin?
For me, not at all.
Cuz all these people and the parties they vote for are fans of fascism and dictatorial systems.
Bindidon says:
”Anderson is, as are probably 80% of the lovers of Elonald Muskrump, 100% fixated on misinformation sources like Breitbart, Fox News, etcetera.
*
Thats the reason why he doesnt understand that only those people of Europe who belong to the ultra-rightwing part of Europes society are fans of Musk, Trump and Vance.
Cuz all these people and the parties they vote for are fans of fascism and dictatorial systems.”
Bindidon you are sounding like a typical Communist, namely a globalist control freak who doesn’t believe there isn’t anybody in the world doesn’t give a twit controlling the world’s peoples. Thus you believe anybody a millimeter right of the most extreme left is a fascist and counter revolutionary and out to control the world with their vision to the detriment of your thoughtlessly adopted vision.
Fascist ideology is imperialist and dictatorial as is communism.
But the fact is the vast majority of people in the world care much much more about their families than your twisted vision of global domination both physically and metaphysically.
But you see such thoughts as dangerous and subversive with hidden agendas of world domination which is merely a projection of your own world view.
. .thus your instant adoption of the elitist viewpoint where the unwashed masses must be closely controlled while being ignorantly unaware that you are on somebody else’s menu within your adopted philosophical ultra-control group.
Hunter boy
” Thus you believe anybody a millimeter right of the most extreme left is a fascist and counter revolutionary and out to control the world with their vision to the detriment of your thoughtlessly adopted vision.
As mostly, even when talking about the lunar spin, you are completely wrong.
I’m no communist at all, Hunter boy: I’m just a social-democrat – what is for many people (like you?) the same as communist, of course.
I think you misunderstood, misinterpret and hence intentionally misrepresent what I wrote.
Try to read it again, without your distorting glasses.
Fact is that Anderson is also completely wrong in his false opinion about ‘… how the people of Europe have accepted JD Vance. ”
He doesn’t know anything about us in Europe, Hunter boy.
What about your opinion on this, Hunter boy?
” RLH says:
February 21, 2025 at 5:21 AM
People in Europe do not accept JD Vance. ”
*
I was a bit suprised about such a general, 360 degree statement, to which I can’t agree, as there are many Europeans who accept him, as I myself listed.
Why didn’t you reply to RLH?
Blinny thinks he speaks for the typical European. Blinny, is it true that a German politician was just fined for exercising free speech?
Bindidon says:
”Im no communist at all, Hunter boy: Im just a social-democrat what is for many people (like you?) the same as communist, of course.”
Indeed Bindidon. What that makes you is a communist ”tool”, i.e. somebody so naive as to believe they can relinquish absolute power to the government, disarm themselves, disarm others and not end up under a communist dictator.
It is in fact the groups that you label as ”extreme right” that fight against unreasonable government power and free speech is precisely that which keeps your bacon out of the fire.
That fact can be seen in that it tends to cause your daddy to weaponize the government in attempts to squash that which in turn wakes up those who simply want to live their lives as they choose without being political, brings into focus the threat, and sets it back on its ear.
So you should be thankful for these people who prevent your ignorance from becoming your nightmare.
In fact fighting against excess government powers and for free speech is precisely a different direction, by 180 degrees, from fascism and communism.
Bindidon says:
”He doesnt know anything about us in Europe, Hunter boy.”
I think he probably knows Europe was the birthplace of both communism and fascism which grew out the childish and idealistic concepts of social democracy that found a place in Europe to prosper that primarily arose from a quick-witted aristocracy who wanted to maintain their traditional inherited powers without having ever learned how to actually earn it.
Global
https://climatedatablog.wordpress.com/2025/02/21/uah-mean-and-median-global-for-jan-2025/
Tropics
https://climatedatablog.wordpress.com/2025/02/21/uah-mean-and-median-tropics-for-jan-2025/
Here is the correct comparison of cascaded running means and medians performed on UAH 6.1 LT’s data, using Excel, a spreadsheet calculator that is 40 years old, and used by millions of people.
*
1. 12/10/8 months
https://drive.google.com/file/d/1S_YhqAC3w7WBv7yanp0nt8gdedS-1QYt/view
2. 60/50/39 months
https://drive.google.com/file/d/1NuDlpNz2ujFwbQ7Jf-7wRBVSklyb3Mgm/view
*
I’m still awaiting RLH’s ‘UAH Global 5 year Median low pass’… will it ever appear?
See
https://www.drroyspencer.com/2025/02/uah-v6-1-global-temperature-update-for-january-2025-0-46-deg-c/#comment-1698956
I’m still awaiting RLH’s ‘UAH Global 5 year MEDIAN low pass’… will it ever appear?
It’s ON the graph. Idiot. Squared.
Strange how your version has high frequencies still there (when they should rightfully be removed).
1. ” Its ON the graph. Idiot. Squared. ”
*
Firstly, I’m NO idiot at all, Blindsley H00d.
YOU are a liar, as so often.
*
If a UAH Global 5 year MEDIAN low pass there would be FOUR low pass curves, and FIVE specification lies at the graph’s top left edge:
– UAH Global 12 month MEAN low pass – present
– UAH Global 12 month MEDIAN low pass – present
– UAH Global 5 year MEAN low pass – present
– UAH Global 5 year MEDIAN low pass – MISSING !!!
That’s the RED curve in MY 60/50/39 graph:
https://drive.google.com/file/d/1NuDlpNz2ujFwbQ7Jf-7wRBVSklyb3Mgm/view
*
2. ” Strange how your version has high frequencies still there (when they should rightfully be removed). ”
NO. This graph is based on EXACTLY the same technique as that used by Greg Goodman which he has shown in his Climate Etc guest head post dated November 22, 2013; but… I use of course Vaughan Pratt’s coefficients for triple cascades (1.0, 1.2067, 1.5478) instead.
Look for it!
*
You are such a dishonest little boy… what saves you in my eyes is that you at least stay away from the Musk/Trump euphoria and the lies around it.
*
More later… on your 2014 op-ed where you showed that you weren’t even able to accurately copy Goodman’s work.
So what are the ripples on the red trace in your graph? They are the high frequency ripples I am talking about.
https://drive.google.com/file/d/1NuDlpNz2ujFwbQ7Jf-7wRBVSklyb3Mgm/view
” So what are the ripples on the red trace in your graph? They are the high frequency ripples I am talking about. ”
*
For the umpteenth time: I’m still awaiting RLH’s UAH CLOBAL 5 YEAR MEDIAN LOW PASS.
Then maybe the utterly opinionated Brit boy would finally understand where ‘the ripples on the red trace’ do come from.
Because his UAH CLOBAL 5 YEAR MEDIAN LOW PASS would 100% certainly look quite similar to mine.
*
He was until now still not able to provide it. will it ever appear?
So Blinny does not respond, but instead goes on about his ‘procedure’ does not let high frequency through (even though his own graphs show that).
” So Blinny does not respond… ”
But I did respond:
For the umpteenth time: Im still awaiting RLHs UAH CLOBAL 5 YEAR MEDIAN LOW PASS.
*
You, Blindsley H00d, are the one who does not respond by providing what I ask you all the time, and keep dodging instead.
*
Maybe you are not able to provide a graph containing this 5 YEAR MEDIAN LOW PASS… because you are not the author of the software generating the graph?
See the graph I posted which contains the line you are looking for (without the high frequency faults you are unable to see).
Why are you still lying, Blindsley H00d?
Here is your graph:
https://climatedatablog.wordpress.com/2025/02/21/uah-mean-and-median-global-for-jan-2025/
*
I repeat:
If a UAH Global 5 year MEDIAN low pass there would be FOUR low pass curves, and FIVE specification lines at the graphs top left edge:
– UAH Global 12 month MEAN low pass – present
– UAH Global 12 month MEDIAN low pass – present
– UAH Global 5 year S-G Mean ‘projection’; present, irrelevant
– UAH Global 5 year MEAN low pass – present
– UAH Global 5 year MEDIAN low pass – MISSING !!!
*
Why are you unable to admit that you STILL did not post a graph containing this 5 year MEDIAN low pass?
” If a UAH Global 5 year MEDIAN low pass there would be… ”
should read
,
” If you had added a UAH Global 5 year MEDIAN low pass there would be… “
” So what are the ripples on the red trace in your graph? They are the high frequency ripples I am talking about. ”
*
Ah well ah well, Blindsley H00d!
Even more of these horrible ripples on the red trace…
https://drive.google.com/file/d/1OVdyXa1WK0HVXd6HQiei1goDXL4y5QkV/view
*
When will you be able to exactly reproduce THIS graph, Blindsley H00d?
Just because you let high frequencies through on other graphs doesnt mean that you are faultless. High frequency wriggles are easy to see. Except for you apparently.
Blindsley H00d continues to manipulate us with his lies and baseless claims, resorting to general, non-committing statements rather than contradicting in a technically binding way, such as doing the same work as the work he is cheaply criticizing with only words.
*
Why does he not (want to) understand that in all my graphs above, the C3RMedian Excel functions have always exactly the same arguments as the C3RMean functions, and hence the difference between mean and median traces are due to how the medians are computed, and not to alleged ‘high frequency faults’ ?
*
It’s too boring, I give up: Blindsley H00d behaves exactly like Robertson with his stubborn 1500 stations or Clint R with his lunatic ball-on-a-string.
So the high frequencies are let through by YOUR use of standard functions, even though that is impossible according to normal filter theory.
Maybe you are just an idiot?
You may name call me an idiot as long as you want.
I name you more precisely disrespectful, dishonest and above all incompetent.
*
If you were honest and competent, you would have checked my Excel based result by using an old Excel file of your own which you could have updated right now:
https://wattsupwiththat.wordpress.com/wp-content/uploads/2010/07/uah-with-annual-ctrm.xlsx
[Oh oh oh! Last week it was still accessible, but now no longer:
” — 403: Access Denied — ”
No problem for me, as I downloaded the file in June 2022:
https://docs.google.com/spreadsheets/d/1kw1cBmVdNp76dW2DJHX76UCKuVnfHp0J/
Due to Google Drive’s automated switch to the Google Docs format, it’s not quite the same as what I downloaded, but this doesn’t matter much here.
Your file is incorrect.
The C (‘8’) column is in 4-3 format instead of 3-4, the whole cascade is 8/10/12 instead of 12/10/8, you know that for sure.
Luckily for you, the ‘8’ mistake is tiny, and cascades are commutative operations. ]
*
You would then have
– corrected your file;
– duplicated the spreadsheet;
– in the spreadsheet copy, duplicated the source and its cascade;
– in the cascade copy, replaced all calls to the function ‘average’ by calls to ‘median’;
– in the graph, added a plot for the median data;
– duplicated the spreadsheet again;
– in the spreadsheet copy, switched the UAH data from 5.6 to 6.1;
– finally, in that copy, moved the two cascades from 12/10/8 to 60/50/39.
*
And so it would look like:
https://docs.google.com/spreadsheets/d/13O7bV3s4HUG06aZnPiQzeuux2qI8cgaT
*
As you can see when comparing the data columns of the two 60-month cascades in the last spreadsheet, your “ripples” and “wiggles” in the median plot are nothing more than an illusion. The reason for this is the fact that unlike moving averages/means, which change continuously, moving medians have rather discrete behavior and look more like successive plateaus.
*
However, there is no chance of you doing such things, let alone accepting them when others do them, because you never accept that you are wrong and hence prefer to resort to your usual gut ‘thoughts’ and insults.
Final comment about mean vs. median on this thread
https://docs.google.com/spreadsheets/d/174CxYCkDKfQMUhAR4TnWXeKj58yhIiCYvCOF4koSfec
The Excel cells in the data spreadsheets might appear somewhat unusual but are of a much more general character.
I use an even more general but more complex variant, but it is too cryptic.
*
Hopefully you manage to finally understand that the two graphs below are – against your endless claims – 100% correct:
12/10/8
https://drive.google.com/file/d/1S_YhqAC3w7WBv7yanp0nt8gdedS-1QYt/view
60/50/39
https://drive.google.com/file/d/1NuDlpNz2ujFwbQ7Jf-7wRBVSklyb3Mgm/view
*
I repeat: in the graph
https://climatedatablog.wordpress.com/wp-content/uploads/2025/02/uah-global.jpeg
your 12 month Mean low pass is correct, but your 12 month Median low pass is not.
¡Basta ya!
stephen, you say DOGE is being completely transparent.
Let’s ask the most basic question – follow the money.
Who is funding it?
Who’s funding what? DOGE are government workers.
Who pays them? Which budget does the money come out of?
Is that your next plan of attack? DOGE workers haven’t been funded by Congress. Is that it?
You don’t know, do you? You couldn’t find out.
DOGE’s funding is obscure. There’s no transparency.
DOGE’s budget is undocumented. There’s no transparency.
DOGE’s decision-making process is not documented. There’s no transparency.
DOGE’s powers are not documented. There is no transparency.
DOGE has not named an officer to take FOIA requests, nor detailed how to apply for them. There is no transparency.
DOGE has not provided impact statements about the effects that their cuts will have on the various agencies. There is no responsibility.
DOGE’s administrator, or director, or head, is not officially named. There’s no accountability.
DOGE’s chain of command and accountability is not documented. There is no accountability.
DOGE has not said who reviews their processes and budget to ensure compliance with the law and with DOGE’s objectives. There is no accountability.
DOGE’s ‘savings’ have not been submitted for independent verification. There is no accountability.
DOGE has not formalised what kind of government agency it is, or said what statutes its function rests on. There is no transparency.
At the moment, DOGE is operating in the dark. All we get are tweets and a list of ‘savings’ with no detail on how decisions were made regarding these cuts, who was consulted on them, what administrative steps were taken, who made the decisions, what impact it will have on the agencies affected, and how they are verified.
Except for FOIA, which is variable across agencies, every other of these instruments of transparency and accountability is available to the public, either directly through a link or through congressional records, OMB budget reports, agency charters and authorizing statutes, FOIA disclosures and inspector general reports, and congressional hearings and testimonies.
However, the Trump administration has made it harder to access information in the usual way, especially if you have to go to a government website that has been truncated or shut down altogether.
For example, here is the OMB page at usa.gov.
https://www.usa.gov/agencies/office-of-management-and-budget
This is where the public could go to get budget reports from the OMB.
There is a link in the middle of the page to the Office of Management and Budget website. Click on it and see where you are directed.
And tell me if you think that is the gateway to transparency.
Here is what the OMB homepage looked like prior to January 20, 2025.
https://web.archive.org/web/20250117163624/https://www.whitehouse.gov/omb/
Click on their FOIA page to see what transparency looks like. They even have the calendars of their directors so you know who they met and spoke to throughout their tenure.
https://web.archive.org/web/20250117185818/https://www.whitehouse.gov/omb/freedom-of-information-act-foia/
Check out the website and see what transparency looks like.
I went back and checked how long it takes after each new president has been sworn in before the OMB website is active. For Obama and Biden it was 2 days. For Trump, it took a month in his first administration, and the website was down most of the time for the first year.
https://web.archive.org/web/20170501000000*/https://www.whitehouse.gov/omb
It’s been a month and the OMB website still redirects to the Whitehouse homepage with a picture of Trump.
I also checked the website under Trump, first term. Compared to the reams of information available under the other presidents, including George W, the site was threadbare, and full of praise for Trump, instead of access to budget information.
Dunno why it’s taking so long. The guy he has appointed to head the OMB has already been in that position in the first Trump administration. He’s one of the Project 2025 authors who wants to increase the powers of the presidency, decimate the federal bureaucracy, and ensure those who remain are unquestioningly loyal to the president.
Adding for clarity:
“Except for FOIA, which is variable across agencies, every other of these instruments of transparency and accountability in any other federal agencyis available to the public, either directly through a link or through congressional records, OMB budget reports, agency charters and authorizing statutes, FOIA disclosures and inspector general reports, and congressional hearings and testimonies.”
But not for DOGE.
Wow, what histrionics. You’re a Brit, right? What are you so vested in our elections? Is it because you think somehow Britain might lurch back to the right? Nope, it will never happen. Too far gone. I know you’ve probably never had US Civics but you might start by reading Article 2 of the Constitution. Once the election decides the President, he gets to appoint staff. DOGE is part of that staff. It is formerly The Office of Digital Services. Trump decided he didn’t need that office. He renamed it DOGE and hired new staff. There was money already in the budget however Musk isn’t taking a salary. DOGE is an open book. They are reporting on everything they are doing, unlike the former administration.
Barry,
Trump has only been in office for a month. Calm down. Give him time.
No, stephen, the budget for DOGE is not on the books. It’s not anywhere. There is no documentary evidence that USDS leftovers are funding DOGE.
Here is the federal website for searching the funding allocation to federal agencies.
https://www.usaspending.gov/agency
Every federal agency is listed there, except DOGE. So there is no record of their budget.
After the first 30 days DOGE should have at least listed their employee salaries and any consultant fees.
The Federal Register is the repository of agency directives, regulations and public guidance. I searched under the term Department of Government Efficiency. There are 3 entries only, and they are the 3 executive orders establishing DOGE.
https://www.federalregister.gov/documents/search?conditions%5Bterm%5D=%22Department+of+Government+Efficiency%22
DOGE has not submitted any of its activities to the registry.
Everything I listed is something you can access in any government department. Except for DOGE. None of the information is public, and I doubt whether any of it is documented anywhere.
When public funds are spent, even by the president, it needs to be accounted for. The purpose of agencies, the names of the directors, and the means by which they conduct business should be the property of the people they serve.
It’s not even known how DOGE is supposedly redetermining the budgeting of agencies and even eliminating them.
What is DOGE’s legal basis for overriding congressional prerogative? Unknown. No statutes have been cited to give DOGE, or whoever is calling the shots, that authority. Even the president has to present details of funding changes they wish to effect to congress, when attempting to restructure congressional appropriations.
Maybe DOGE will become more transparent, and give detailed information on funding and operations later on.
But right now it is the opposite of transparent (I can’t believe you think that tweets are the soul of accountability). And this opacity is highly unusual for a government agency of any stripe. Your uncritical faith in DOGE is not a substitute for supplying any of the things listed above that any normal agency makes public. DOGE is not transparent. You are dreaming.
I checked out DOGE’s web page promising to bring the receipts the other day, and ‘receipts’ had landed. I already noted that large number of them represented no savings at all.
But the ‘wall of receipts’ is apparently full of errors.
“But among the 1,100-plus contracts purportedly canceled, POLITICO found:
Contracts that had not yet been awarded
Instances where a single pot of money is listed multiple times tripling or quadrupling the amount of savings claimed
Purchase agreements that have no record of being canceled, but were instead stripped of language related to diversity, equity and inclusion
Contract savings identified by DOGE that do not match with records they refer to in the Federal Procurement Data System
Contracts where the underlying document is for an entirely different contract
…
Among those errors are myriad duplicated contracts, beyond the ones DOGE has already removed. POLITICO identified at least 14 instances where items are repeated, totaling $325 million in claimed savings.
In one example, DOGE repeated a single $25 million item under the Agriculture Department four times, reporting each vendor that was eligible to bid on the work and quadrupling purported savings to a total of $100 million. In reality, there are only two finalized contracts from the vendors listed that have been awarded less than $1 million, according to records on USA Spending.
Other contracts have not actually been canceled, but instead modified to remove language related to diversity, equity and inclusion.
For one repeated $30 million contract under the Department of Homeland Security, the latest update for each vendor is for a complete or partial termination. The fine print is more illuminating: The purpose of the update was to partially terminate the order to remove all language and ending rendering of services to diversity, equity, and inclusion, effective immediately.”
https://www.politico.com/news/2025/02/22/doge-data-errors-inconsistencies-00002576
This is slapdash and shoddy work, to be expected of an agency that shoots first and doesn’t ask questions later.
Of course, the tweets go out with much fanfare that DOGE has slashes $55 billion worth of waste. That’s great PR. But when the fact-checkers point out the errors, what are the odds that there will be corrections issued on the same platform?
You could tell us, stephen, as apparently that’s where you’re getting all your information.
Musk has already been confronted on some egregious errors, and has come up with a catch-all response.
“Some of the things that I say will be incorrect and should be corrected.”
But DOGE/Musk won’t be doing that. There will be no self-adjudication, and we will have to rely on the press to get to the truth of things, because DOGE won’t tell us, and there is no oversight mechanism to check them, apart from the courts.
DOGE isn’t transparent. It’s all PR.
“know youve probably never had US Civics”
Stephen lacking answers, just attacks the messenger.
“What are you so vested in our elections?”
I’m not vested in US elections, but the US is the global superpower, and it still has military supremacy, thought it’s main exercise of power and influence is the ‘soft’ variety. I’m vested in what the US does, because it effects the whole world in ways that other countries do not, or barely do.
Of all economies in the world the US economy has the most impact in the rest of the world. It’s corporate policies, tariffs regimes and interest rate changes have direct financial impact abroad, and far more impactful than any other nation (unless, perhaps, if China starts global trade wars).
The US is a major contributor to the international world order for peace, both financially and, even more importantly, with its alliances and commitment to peace and promotion of democracy, backed by the largest military force in the world.
US policy on pharmaceuticals has wide-ranging implications for the world.
I’ve been following US politics fairly closely for nearly a quarter century, since 2001, and observing the emergence and increased purchase on the political landscape of far-right parties, who are encouraged by US politics, where the centre of the political spectrum is further to the right than most other developed countries.
For example, the Democrats would be a centre-right party in most countries in Europe. It would be firmly in the middle in Australia, where I’m from.
I don’t comment much when it’s business as usual in the US. There is certainly government waste, tests on the checks and balances, some corruption and other argy bargy, but this is de rigeur. These things should be improved, for sure, but it matters how it is done, especially in light of recent developments.
I think the best example of my concern with the trend in US politics is the overturning of Roe v Wade. Whatever you feelings on abortion, the result is that women have less choice in their own health care decisions. This is a step back from the emancipation and independence of women. It’s fine by me if you think abortion is reprehensible and a sin. Fine by me if you would never contemplate it for yourself. But it is not fine that a liberty has been taken away from women.
You ask why I’m interested. I taught a class one day a few years ago and the young women in it were very distressed. They had been reading about the overturn. They keenly felt their sisters’ loss in the US.
We talked about it in class. The subjugation of women in African or ME countries – old world cultures – is a point of distress, but it is different when the US does it, because, what with media dominance for decades and the major media presence in Australia, the US is always showing us the guardrails on freedom. Their freedom is ours, in a sense. It hits home when you own ‘family’ does something awful. It means it could happen here. Because US domestic policy strongly echoes in the developed world.
I don’t get active when it’s business as usual. But when I see the US going off the rails, as I did in the early 2000s, then I get genuinely concerned.
The worst of the moment is that Trump, the agent of chaos heading an administration with more deliberate designs, has just shaken up the international peace order, rewarding a murderous dictator with ambition to expand his territory, by parroting his justifications and blaming his victim. He has also handed dynamite and matched to the ME with his talk of removing Palestinians to other countries and turning Gaza into a resort.
Hopefully much of what Trump has said is brain farts, and won’t actually lead US foreign policy, but he has already done damage. His complete lack of understanding of geopolitics and international diplomacy is a significant liability for the whole world.
Climate Change is real and already happening. I have to admit that I find most of the claims of Climate Change to be nothing more than natural variability in the weather. Well, this new study will end all doubt. This is real science from an actual science website, not just some obscure news anchor. How could anyone refute this compelling evidence? This is the definitive study that will put the whole issue to rest. Climate Change is real!
https://www.livescience.com/planet-earth/climate-change/rats-numbers-are-skyrocketing-across-us-cities-and-its-only-going-to-get-worse
Here is the original research:
https://www.science.org/doi/10.1126/sciadv.ads6782
Controlling climate change itself requires international collective regulations to limit increased warming, which is outside of the ability of individual cities. Furthermore, slowing human population growth in cities is also unlikely, given the global trends of people shifting to a more urban distribution. Therefore, the management of urban rats will need to focus on aggressive strategies that cities can implement to slow the increase of rat numbers that is likely to continue.
I think we all need to learn to examine the physical evidence for AGW through the social sciences. Well done, Tim!
tim s…”Rat populations are growing in cities around the world because of climate change”.
***
Your article is based on a presumption of climate change without offering proof of it.
A far more likely cause of increased rat population is what we have here in the Vancouver, Canada area. It is obviously related to the number of green boxes used to recycle waste products from kitchen scraps, to grass cuttings. Many people are dumping containers of uneaten food in blue boxes, meant to be used for recycling paper and plastic products. They don’t bother to clean off the products of food before dumping the containers in recycling boxes.
The length of our seasons has not changed measurably nor has the weather changed noticeably. What has changed is this insane penchant for recycling. Some of our recycling containers absolutely reek of decaying food and the rats seem to love it. They also love the barbecue utilities left out on porches and in back yards. Many people don’t bother to clean them of greasy food since they are likely too drunk to bother.
Another problem is people putting out food for birds and even raccoons. Although I agree with feeding birds, the seed provided drops on the round when eager birds spill the seeds. Rats soon congregate below the feeders to scavenge the dropped seeds. Squirrels like to feed on the seeds as well.
Let’s face it, rats grow in population due to human uncleanliness. Without our garbage and scraps the rats have nothing to feed on. I mean, why else would wild animals want to live near humans other than to feed off our garbage?
To be fair, I guess I need to clearly identify sarcasm. Some thought it was a serious comment. Rats? really? What is next, earthquakes and asteroids?
https://www.livescience.com/planet-earth/earthquakes/will-we-have-more-earthquakes-because-of-climate-change
bill hunter…”Fascist ideology is imperialist and dictatorial as is communism”.
***
Good to see you back, Bill, we have missed your measured input.
Solutions are never as easy as they seem and if you dig deep enough there are often two distinct sides to the argument.
We have to be careful with words like fascism and communism for the simple reason that whatever we have seen as examples are abject corruptions. The USSR model under Stalin is a model of that corruption and the Chinese model, naively modeled on the Russian model, is just as corrupt.
The concept of communism has been around since the times of Socrates, Plato, and Aristotle.
Where is Christos??
As such, the basis of communism as proposed by the aforementioned pholosphers was one time of purity and intelligence, not the brutality and arrogance of the Stalin model. For a pure communism to exist, it must of necessity involve democracy based on intelligence and we have never seen that. In other words, there would need to be an overwhelming majority in favour of such a lifestyle by people who are fully aware of the ramifications.
Has anyone ever seen a democratic fascism or communism? Actually, one of the three above described a democratic fascism run by scholars who had the best interests of the whole in mind. We know today that such a system often leads to corruption, so nothing is easy to come by.
Israel operates partly on a system of communes (kibbutz) and from what I have read it works fine. A presumption in a capitalist society is the everyone should be supportive. However, in an ideal case, who would do the work if everyone exercised his/her right to be a capitalist? It seems to me, that Israelis participating in the kibbutz system do it because they want to do it. Who is to say that is wrong?
The Chinese model emerged out of necessity since millions of people were on the run and some form of central government was required. When you have many people running for their lives and trying to establish a base in the mountains of northern China, free enterprise and capitalism simply could not work.
In those days, Mao, as leader, experimented with different forms of democratic government because he knew that a wholesale implementation of Stalin’s communism was unworkable. However, he had been completely mislead into believing that Stalin was an honourable man and reports from Chinese envoys to Russia failed to impress him as to Stalin’s corruption and brutality.
Mao was never a mean person like Stalin, but obviously he suffered from terminal naivete with regard to his willingness to accept idealism as opposed to practicality. In fact, Mao dramatically upped the level of democracy in China for women and students, even under a totalitarian state. Women and students received rights they had never experienced before.
What drove Mao toward communism was the Russian revolution after which a communism was allegedly imposed. What was actually imposed was a massive ego-trip lead by arrogant people who had no interest in the average person. They were idealists operating out of a manual. The irony is that the Russian people as a whole are being blamed for the arrogance of a few fascists.
Any pure communism would have to be arrived at through agreement and awareness. We are unlikely to ever see such conditions in the human race in the foreseeable future since the human mind has yet to transform to a level where such intelligence can operate uniformly.
Unfortunately, we have naive people today who think we can legislate such intelligence. What they fail to grasp is that the motif behind their legislation comes not from intelligence but a conditioned belief system that itself is corrupt. So called Progressives are not helping the poor and disenfranchised, they are only scaring voters into rejecting their naive approach.
The same applies to capitalism. As originally laid out by Adam Smith, it was based on intelligence, but today, intelligence has been replaced by pure greed and arrogance. I cannot see Adam Smith and Trump or Musk seeing eye to eye or anywhere near to that.
A healthy capitalism must include on social values. Problem is, current capitalist leaders are interested only in making themselves wealthier while reducing costs and taxes. Corporations are based on the credo of maximizing returns for shareholders. That means reducing wages and conditions for workers and making the light of the poor and disenfranchised even worse.
Capitalism does not have a proud history. In the days of Marx, children were forced to work in coal mines and poor people could be sent to debtors prison. That does not address imperialism where countries like Britain, the US, and Germany, pillaged the resources of other countries.
Capitalists of yore were dragged, yelling and screaming, into a gentler world by true socialists (unionists). The plight of the poor and working class, prompted the manifesto by Marx and Engels and we need to keep firmly in mind the horrendous conditions for the poor and disenfranchised that led to their work.
Speaking of unionists, the early unionists were true blues, fighting a corrupt capitalist system. As unions made gains with better wages and conditions, they were infiltrated by opportunists who had no interest in unionism, or the welfare of others. We owe much of what we have today to the true blues since no known capitalist has ever voluntarily upped wages and conditions.
Urban rats are seemingly everywhere.Mostly in the capital cities of many nations. Their population can be controlled at times..by elections, revolutions, etcbut they eventually come back. When they get completely out of control, they bring poverty, misery, and even death to other, more benign and less aggressive species. They are an apex predator.
Latest figure from NASA is 3.2% or 32 in one thousand.
Just checked. Today’s figure is back down to 0.28% or 2.8 in 1000.
Here is the problem with out educational system. Bill Nye, the science guy, says the newly discovered asteroid has a 0.16% chance of hitting earth in the year 2032 and that is a 16 in 1,000 chance. Which number is correct?
tim…to convert a fraction to a percent, the fraction is multiplied by 100%. That means the 0.16% has already been multiplied by 100 and to retrieve the original fraction, we need to divide by 100.
So, 0.16%, as a fraction, is 0.0016. Since we are measuring chance, that should mean 1.6 chances in 1000.
It’s late and I am bleary-eyed. Anyone disagree?
Working it backwards, if someone claims we have a 1.6 chance in 1000 of something happening, that reduces to a fraction of 1.6/1000 = 0.0016. To get a percent, we multiply by 100% to get 0.16%.
That’s my story and I’m sticking to it.
Having aid all that, I am inclined to go with Mark Twain, that there are three kinds of lies: lie, damned lies, and statistics.
The problem with the education system is that you’d bother to listen to anything Bill Nye has to say instead of looking it up yourself.
1% is 1 in 100 or 10 in 1000.
0.16% is 1.6 in 1000
The latest figure from NASA is 3.2% or 32 in 1000.
0.16% is 1.6 out of a 1000.
Once again my comment seems to have missed the mark. The guy, science guy that is, who is one of the primary proponents of climate change, goes on television to announce to the world that he cannot do simple math. Maybe he was just having a bad day and got confused.
Where is this from Tim? I cannot find it anywhere.
Yes, easier to get your point if we can see what you’re referring to.
Has anyone noticed that it is the people who lack any credibility at all who challenge my honesty?
I have no interest in arguing with anyone, and certainly not fools who just want to argue, and argue reflexively whether there is any substance involved or not.
I share information. If I am wrong, I will be the first one to admit it.
Tim, we don’t know what you’re referring to. Do you have a link or something? Then we can check.
Must be from one his ‘propaganda news’ sources.
Now that Nate has accidentally made an accurate observation, I have to respond. CNN is indeed a propaganda news source, with their chief propaganda anchor, Jake Tapper and his colleagues. It was Pamela Brown on Saturday with a live interview who was serving up the softballs. Nye explicitly stated “zero point one six percent” and then went into a long explanation of all of the things you would not want to do with 16 out of a thousand odds.
Thanks for the reference, it’s not available online.
If he said it, it was wrong.
I think we can allow Bill a brain fart. Everyone has them. Even the leader of the free world.
There is a simple way to do percent conversion without a calculator. 0.1 percent is 1 part per 1,000 or 1,000 ppm.
dedicated to Ken and Clint…
bill hunter…”Bindidon says:
Im no communist at all, Hunter boy: Im just a social-democrat what is for many people (like you?) the same as communist, of course.
[bill]Indeed Bindidon. What that makes you is a communist tool, i.e. somebody so naive as to believe they can relinquish absolute power to the government, disarm themselves, disarm others and not end up under a communist dictator.
***
Bill…no attempt to alienate you, I am counting on the fact that you are a clear thinker.
I have lived in Canada all my life, in a social democracy, and at no time have I had to relinquish absolute power to the government. I have not been required to disarm myself, I own two hand guns and shoot them at the range. I cannot carry them on the street, which is OK with me, since I don’t want a country where people can shoot it out on the street. Our firearms laws were changed only to target automatic rifles such as AR-15s. I disagree with that but I don’t see it a a major problem unless we are invaded and need to run for the hill.
We can still buy and use hunting rifles and shotguns. My firearms are classified as prohibited, meaning I required special training to get them. I have to keep them safely stored at home and when I go to the range, I need a license to transport them. It’s a bit of a nuisance but I regard it as a fair trade off to prevent any ijit from walking into a firearms store and buying a firearm of any power.
Citizens of the US and Canada have much in common and it bugs me that we in Canada are suspected of harbouring some kind of communist conspiracy due to our social democracy. We in Canada were over fighting Hitler well before the US and that should indicate how much we value democracy and freedom. Same in WWI.
I know you as a clear thinking guy and it alarms me that my good friends south of the border have such a jaundiced view of social democracy. When I tried once to explain our Medicare system to an otherwise clear thinking guy from LA, he stated…’that’s communism’. He had no interest in the pros and cons, where the pros far outweigh the cons, his only interest was in seeing a fantastic medical system as ‘communism’.
He saw the centralized form of government required to implement a nationalized health care system as communism. Where he got that sort of mental conditioning is beyond me.
I fail to grasp the US paranoia about communism. It has never happened here in the US or Canada nor will it ever happen, simply because no one wants it. We all value our freedoms too much.
We have the same kinds of checks and balances in Canada to prevent the overthrow of our government by subversives whose intent is to deprive people of their freedoms. You saw what happened with the truckers ‘Freedom Convoy’ and that protest was over our government trying to enforce their covid vaccination agenda. In the end, they got the message and backed off.
Our current government went too far down the road toward wokism and paid the price. The PM was forced to step down and hopefully the Liberal party got it that we in Canada don’t want Progressive nonsense. The Liberals in Canada actually represent an amalgam between right-wing and left-wing. They tend to lean more to the right but recently we have suffered the same nonsense as you in the US where fringe groups have gained far too much way in the government.
Trump seriously misread us when he made cracks about Canada becoming the 51st state. I know he thinks we are dying to have your values in the US, but he missed the boat as to what we really want: democracy, freedom, and the ability to help others with health car and so on.
In fact, I think he has missed the boat with regard to what US citizens want.
Gordon, Canada isn’t a social democracy by any overall standard.
Having a national healthcare system doesn’t make you a social democracy, though it can move you somewhat closer to one.
Likewise the US healthcare system isn’t much different.
Also not all republicans voted for Trump. But DOGE was a prominent promise so any who did simply wasn’t paying attention which means it was just a random vote on that issue that could have gone any way and not made a difference in the outcome.
Harris made it clear that the vote was for continued cancel culture, control of sources of information, and forever wars, particularly by teaming up with Liz Cheney. Trump is very much for a strong military but not an accelerated depletion of its resources in a foreign policy that lacks net benefit to the nation.
Unfortunately the mainstream media has distorted what DOGE is doing. USAID, for example, is going away in name but not in regards to its publicly known mission. Its clandestine mission is going away. Who knew that USAID was spreading DEI and gender weirdness worldwide? Fact is you can’t have all these rogue agencies and commissions running amok without decent executive oversight and transparency to the people of the nation.
Some see extra money as an opportunity to do stuff off the books, others see it as a way of improving the US economy.
I am realistic enough to realize that all this is not going to get fixed in 4 years. Trumps going to ruffle some feathers but I will patiently wait two years to see if his efforts are positive or not. Even that is going to be difficult with the debt that has piled up from the pandemic and out of control spending.
We can’t have a government afraid of ruffling a few feathers or politicians who make a living with a finger in the air waiting for an issue they can eke a few more votes out of no matter how misguided it is.
But Trump has some tremendous resources at his disposal and he plans on using them. Primarily its the main topic of this forum as to the efficacy of restricting fossil fuel use and burdening the economy with over wrought fears of climate change. Yes the climate is changing and has always changed. Anybody with 5 cents worth of ability to balance a checkbook can see that climate has changed naturally and if you have any ability to look to the entire historical record of climate change it occurs on all scales of time, not just once every 100,000 years as some mindless folks around here believe.
barry…you underestimate the US system. In Georgia, Republicans are up in arms over DOGE since it does not differentiate between Democrat and Republican workers. The laid of Republicans are angry with Trump and are already pressuring their Reps to do something.
The Republicans have a 3 seat majority in Congress and without them, Trump is a lame duck President. That’s why I don’t regard him as being very smart with his Presidential orders. If he alienates a few Republicans, he cannot pass anything.
The corporate mentality is not well thought out. It comes from the presumption that a minority should have free access to profits while the rest do not. That is fascism, albeit with some checks and balances from democracy. However, in the end, the wealthy have privileges the rest of us don’t have.
There is no doubt in my mind that Trump’s executive orders are aimed at aiding only the wealthy.Why else would he enable Musk and put him in a position of unilaterally firing people? Trump goofed big-time by involving Musk.
Gordo,
You really have some strange notions about economics. Not sure if it is because you are Canadian or what but I know quite a number of Canadian small business people who do very well in the free market. I come from a family of small business people who make hundreds of thousands to a few million every year in the free market. I have many friends who are small business people who do extremely well. The idea that it is Corporations against the rest of us is odd and quite frankly, a Marxist notion. Corporations don’t stop the rest of us from making money. There is an infinite number of opportunities out there. Maybe if you get off this blog and explore those opportunities you might have a realization.
My ideal lifestyle is one where I have enough wealth to retire comfortably, enjoying solitude and a modest level of luxury – no private jets, yachts, flashy sports cars, or multimillion-dollar mansions.
I don’t understand the drive for hundreds of millions, let alone billions – at that point, it seems more like greed. That said, for that lifestyle to be possible, the opportunity for greed needs to exist, because it’s that very incentive structure that enables wealth generation in the first place.
Imagine a world where there was a strict limit on wealth accumulation. What would the average person strive for?
that said, for *my ideal lifestyle* to be possible
It is notable that most of Elon Musk’s money is tied up in stock ownership and other business interest. He flies around in business jets that probably are owned by his businesses, and are almost necessary for someone of his status. He is noted for sleeping on a couch in his office at work when he is involved in a project. For him, the money is a tool and not an emotional desire. I read somewhere that he used to have a lot of personal real estate holdings and sold most of it.
“For him, the money is a tool and not an emotional desire. ”
Tool for what?
Why did he get behind the far-right parties in Germany?
While I don’t agree with the way he put it, there is no question that the corporate model leads to practises that are incompatible with capitalism and a free market.
Monopolies or duopolies do not happen by accident, it is the logical consequence of the contract between a company and its shareholders, and the corporate ethos that is profit maximisation pure growth to the limit of the legal framework in which the market sits. If a healthy market is rooted in competition, monopolies are the antithesis of a healthy market.
In Australia more than half the alcohol retail market is controlled by Endeavour group. I’ve watched them swallow up and digest smaller fry, and buy up large retailers, keeping their banners but controlling their pricing and practises. There is less variety as a result, and independent producers are falling out of the market.
Independent small businesses still exist, but there are far fewer in the retail sector – fashion, groceries, alcohol to name a few.
The capitalist system can work well within a body of judicious regulation that safeguards genuine competition and wards against worker and environmental exploitation. On its own, capitalism is a psychopathic predator, as there is no morality, care or drive for sustainability built into its ethos or engine.
I don’t agree. Corporations are just people. Most corporations want to do business ethically and honestly. The market punishes corrupt and unscrupulous corporations. A corporation’s first loyalty is to its shareholders and bondholders, not to its employees or customers. It wants to promote the idea of customer loyalty but customers are only loyal if they feel they’re treated fairly and offered a product at a good price. So, corporations are continuously having to win the loyalty of their customers. So bad practices don’t work within that framework. Longterm it doesn’t bode well for them to harm the environment. The environment is also their customer so they will be punished. The market corrects bad behavior. Corporations are the major creators of wealth. Socialism has never created anything. It is a drain on wealth production.
“I don’t agree. Corporations are just people. Most corporations want to do business ethically and honestly. The market punishes corrupt and unscrupulous corporations.”
Corporation hire and retain people based on their adherence to the core values of the corporation, which is about maximising profits. People sign NDAs and are punished for whistle-blowing. Go to any group meeting that discusses and educates on core values and you will not find these listed – integrity, decency, honesty. I know, I’ve been to many of these meetings. The values discussed are diligence, innovation, efficiency, sometimes loyalty.
Capitalism is by definition exploitative. Competition isn’t about helping your neighbour. And that’s fine, as long as there is a regulatory framework around the corporate world that protects people from the worst of it.
I have friends who work for the Big Four auditing major companies around the world. They have endless tails of corporate corruption. Their job is to keep rich people rich, as they say. And they cannot speak out because they will lose their jobs, and then be prosecuted. Those who have the greatest insight into corporate fraud are the most chained by contractual agreements. Naturally.
No, employees of large corporations do not determine the corporate agenda. They accede to it or they are moved on. And the consumer doesn’t have time to wade through the fine print, or check the bona fides of every company they deal with, especially when those companies pour millions into PR and advertising to find ways to make themselves and their product look much better than it actually is. They lie to us, constantly.
We could sit here all day and point to examples of corporations exploiting workers, the environment, the consumer. Like water, profit maximisation will find any crack to seep into, especially when there is a large volume creating pressure.
Don’t get me wrong, I don’t have a problem per se with a healthy competitive market, but I don’t have the rosy view of libertarians, who believe that the consumer is like a voter, and that if they are ripped off or otherwise exploited it’s because they didn’t study hard enough. People will usually go for the cheaper goods, not the most ethically sound, and that is where the corporate world and monopolies are strongest.
The libertarians argue for little to no government regulation or oversight. But doing away with those regulations would remove some of the transparency required of corporations that would enable consumers to make wiser choices. If they had the hours and days to investigate each company they purchase from.
While some on this blog seem to have nothing better to say about how to make themselves feel best, the Trumping boy is degrading the USA in an unprecedented way by butt-kissing Putin with a UN resolution against Ukraine, signed jointly with… North Korea and Belarus.
Bindi know as much about dealing with Putin as he does about science — NOTHING.
Clint,
We kicked the krauts asses twice in the last century, then we saved them from the Russians and have been saving them ever since. We bailed out the Brits and France twice in the last century but, all those guys want to tell us how to run things. If we were like them we’d sorry sad sacks who couldn’t defend ourselves too.
Why is this not a national news story. I heard about this and had to search for it. None of the major broadcast networks seem to be carrying the story. A Tesla car fire is one thing, but this seem to me like a huge news story.
https://apnews.com/article/battery-storage-plant-fire-california-moss-landing-7c561fed096f410ddecfb04722a8b1f8
Here are some highlights:
SAN FRANCISCO (AP) A fire at the worlds largest battery storage plant in Northern California smoldered Friday after sending plumes of toxic smoke into the atmosphere, leading to the evacuation of up to 1,500 people. The blaze also shook up the young battery storage industry.
“This is more than a fire, this a wake-up call for the industry. If were going to be moving ahead with sustainable energy, we need to have a safe battery system in place,” Monterey County Supervisor Glenn Church said at a Friday morning briefing.
Battery storage is considered crucial for feeding clean electricity onto the grid when the sun is not shining or the wind is not blowing, and it has been used in significant amounts only in the last couple of years. But the batteries are nearly all lithium, which has a tendency toward thermal runaway, meaning it can catch fire and burn very hot, releasing toxic gases.
I just searched under “news fire battery plant california” and got hits for all the major news outlets. Added a few of the majors to the search term (CNN, MSNBC, FOX) and immediately came up with multiple hits. CNN and MSNBC mostly ran it on video, as did Fox. CBS, La Times, USA Today covered it in print…
Isn’t this national coverage?
I can see that I may not have framed the question correctly, even though I forgot to use a question mark. I thought it was obvious. The question really should be what is the story?
Fires happen all the time. Big fires that burn for days, emit thick clouds of toxic smoke, and cause evacuations get really good news coverage. It seems that the local news covered that story really well. Maybe I have been indoctrinated by all of those conspiratorial websites that I am accused of following (even though I do not — sarcasm there for the record). Maybe that really is the whole story. Time to move on.
From my perspective, this is a fact:
The Green New Deal and the electric economy do not work at all without a massive network of reliable battery storage. Period. The entire concept rests on this fact. Do I need to explain?
If current battery technology literally does not work, then why are we rushing into it? The follow-on story is that they tried to restart with the remaining batteries that did not burn up and they had another fire! Congratulations!
Electric cars already have future dates for mandates in some states. Many local governments have now outlawed natural gas. This effectively forces people into heat pumps, which have their own problems.
Unless you already have an AC system, or excess breaker capacity nearby, you could be hit with a very expensive electrical upgrade. Then you can purchase expensive equipment that has a rather short useful life, and is less efficient than burning natural gas anyway. As refrigerants continue to get outlawed for environmental reasons, and replaced with less efficient types, that loss of efficiency will get worse.
On the positive side, there are advances in battery technology on the horizon. Calm down people. Take a deep breath. Climate change is not an emergency. The very biggest project management mistake is to rush into a project without knowing the scope of work or the technology involved. People who do not understand basic technological or economic principles are running around with their hair on fire. Where are the adults in the room?
Trump, the great peace maker, is now asking ‘what’s in it for me?’ How can I exploit the weaker party, to bully Ukraine into giving up its mineral wealth.
This and many other actions, like ending support for fighting diseases in developing countries, makes it clear that the world can no longer look to the US for moral leadership.
We’re becoming just another exploiter, like Russia or like the colonial powers in the 19th century.
Stop being shocked. https://www.mind-war.com/p/stop-being-shocked
Nate,
So Trump said, “What’s in it for me?”
Is that the same as America First?
Can you show us when he said that?
That’s clearly not a direct quote.
America First = What’s in it for me?
Sounds about right.
Ask not what your country can do for you, ask “What’s in it for me?”
I do solemnly swear that I will faithfully execute the Office of President of the United States, and will to the best of my ability get what’s in it for me.
We hold these truths to be self-evident, that all men are created equal, that they are endowed by their Creator with certain unalienable Rights, that among these are Life, Liberty and what’s in it for me.
barry, Trump didn’t say that.
Now make up some more nonsense.
No need, Clint. You’ve got that well covered.
Barry,
Yes, it is America First. And all that it implies.
Can you conceive of a universe where what might seem to be in the immediate interest of the US (say, saving money), might have long term ill effects?
America First seems to be: Screw the rest of the world.
Unfortunately, right now the middle and lower classes in the US are being screwed. Gutting government services only doesn’t matter for people who are rich.
Have you seen the latest budget passed by the House? Massive tax cuts for the wealthy paid of of Medicaid.
Broken promise to boot.
Supreme self-interest is a self-defeating strategy.
BREAKING NEWS
After all of the huffing, puffing, and chest pounding from people who have no knowledge of the negotiation, Ukraine, yes Ukraine has announced they have signed a deal they like, because it benefits them. Just like I predicted somewhere. Mining requires a lot of technology from the basic geology to the ore processing. I am willing to bet this is a technology transfer agreement, and that is why Ukraine will benefit.
https://www.cnn.com/2025/02/25/europe/us-ukraine-resources-reconstruction-deal-intl-latam/index.html
The source said the terms were agreed after everything unacceptable was taken out of the text and it is now more clearly spelt out how this agreement will contribute to Ukraines security and peace.
The US has not confirmed whether the terms of a deal have been agreed. However, Ukrainian President Volodymyr Zelensky is now expected to travel to Washington in the coming days.
I hear that hes coming on Friday. Certainly its okay with me if hed like to, and he would like to sign it together with me. And I understand thats a big deal, very big deal, US President Donald Trump said from the Oval Office on Tuesday.
I will add that this is exactly how oil companies “exploit” crude oil resources from foreign countries. They arrive with a whole slate of technologies that allow the host country to develop their natural resources and they share the profits.
The exception to this is Venezuela where they ran all of the companies out after the wells were setup. Nice guys!
We’ll see how the deal progresses, it’s not finalised. The original deal came with no security guarantees from the US, and seemed to treat previous assistance as a loan to be paid back. That deal was rejected, and now it seems the US will continue to provide military assistance for access to Ukraine’s resources.
So Trump has potentially succeeded in moving the US from a principled stance focussed on world security to a transactional arrangement.
“it is now more clearly spelt out how this agreement will contribute to Ukraines security and peace.”
Such as?
https://www.bloomberg.com/opinion/articles/2025-02-19/trump-s-insistence-ukraine-has-rare-earth-elements-is-wrong?
Even as a pure businessman Trump is an easy mark.
“Despite the talk about its huge potential, Ukraine isn’t known to hold any reserves of the main rare earths elements sought after by Donald Trump”
“Simply put, follow the money doesnt work here. At best, the value of all the worlds rare-earth production rounds to $15 billion a year emphasis on a year. Thats equal to the value of just two days of global oil output. Even if Ukraine had gigantic deposits, they wouldnt be that valuable in geo-economic terms.
Say that Ukraine was able, as if by magic, to produce 20% of the worlds rare earths. That would equal to about $3 billion annually. To reach the $500 billion mooted by Trump, the US would need to secure 150-plus years of Ukrainian output. Pure nonsense.”
The last time I checked, the BBC was considered a reliable source. They are in the UK after all.
I hate to say that I predicted this, but here it is. I honestly just came across this article, and it is precisely what I predicted. Even a stopped clock is correct twice a day. That means I get one more accurate prediction today (attempted humor, irony, and sarcasm all in one sentence).
https://www.bbc.com/news/articles/c20le8jn282o
Some commentators have described the US offer as “colonial”, but Kyiv is interested in joint exploration of its resources.
According to the World Economic Forum, Ukraine has about 20,000 mineral deposits covering 116 types, but only about 15% of sites were being actively exploited at the time of Russia’s full-scale invasion in 2022.
For instance, the country’s sizeable lithium deposits are still largely untapped. Likewise, rare earth deposits are known to exist, but none of them have yet been mined, because of a lack of investment.
Developing these mineral resources is extremely difficult and expensive, according to Iryna Suprun, chief executive of the Geological Investment Group, a mining advisory firm based in Ukraine.
She argues that if Ukraine can attract US investors to help develop its natural resources, it will be highly beneficial for the country’s economy.
“We will get technologies that our mining industry lacks so much,” Ms Suprun explained. “We will get capital. That means more jobs, tax payments. We’ll receive revenue from the development of mineral deposits.”
If only 15% of their natural resources were being tapped, why weren’t their deals well before the war started? Surely the US and other investors were interested in al this before the war.
What made the difference?
Written by a former US Air Force Secretary, who started his career in the military before working as an engineer on weapons systems.
“President Trump’s decision to fire senior military leaders without cause is foolish and a disgrace. It politicizes our professional military in a dangerous and debilitating way. What frightens me even more is the removal of three judge advocates general, the most senior uniformed legal authorities in the Defense Department. Their removal is one more element of this administration’s attack on the rule of law, and an especially disturbing part… the senior military professionals who interpret and enforce the Uniform Code of Military Justice, the rules that guide troops in the field. They have the independent legal authority to tell any military commander or political appointee that an order from the president or the secretary of defense is unlawful, cannot be given and should not be obeyed.
Of the three JAGs who were dismissed, I know Lt. Gen. Charles Plummer and worked with him for more than three years. His legal advice was always sound, professional and well supported. It is hard to imagine there was any reason to remove him, other than the obvious one of replacing him with someone more loyal to Mr. Trump and Defense Secretary Pete Hegseth – and therefore more willing to interpret the law consistent with their desires.
If there is one characteristic of this president and this administration, it is the utter lack of respect for legal constraints. Mr. Trump has been clear about his views. Among many examples, he recently wrote, “He who saves his country does not violate any law” It is clear from Mr. Hegseth’s confirmation hearing, public appearances, writings and support for convicted war criminals that he also does not believe JAG officers should constrain war fighters – or presumably the president and secretary of defense.
Mr. Trump and Mr. Hegseth will now get to choose the JAG leadership for all three military departments. One has to ask why JAG leadership was singled out for replacement. This is part of a much larger pattern of disrespect, even disdain, for the rule of law. We do not need JAG leaders who fit this pattern.
… Our country is in uncharted territory. We have an administration that is waging war against the rule of law. The evidence is everywhere. We don’t yet know how far it will go as it seeks to control, reinterpret, rewrite, ignore or defy legal constraints, including the Constitution itself. The replacement of the military JAG leadership is one skirmish in that war, but it’s time for the American people, across the political spectrum, to recognize what is happening. America has a rogue president and a rogue administration, and we need to acknowledge that and respond.”
https://www.nytimes.com/2025/02/24/opinion/trump-hegseth-cq-brown-pentagon-firings-jag.html
barry found another source he can’t understand.
He knows so little about the issues that he picks quotes from one of the most anti-Trump sources, the New York Times.
That’s why he can’t learn.
Notice Clint has nothing of substance to add. No rebuttal. No facts.
Just the usual insults.
Too bad.
So the former Air Force Secretary doesn’t understand they politicized the military when they started introducing DEI and turned the military into a social laboratory.
But did they really, stephen, or are you just trotting out the talking points? Got an impact assessment to go along with the ideology?
The JAGs had nothing to do with DEI. No reason was given. But it’s clear why they were shuffled off. The administration values fealty above all else, and so they will just replace anyone they haven’t vetted with people who are aligned with the ideology.
Ironic that they complain about merit-based hiring. To the administration skill and experience is of less importance than ideological loyalty.
All what the ‘ball-on-a-string’ specialist Clint R is able to write is
“xyz found another source he can’t understand.”
or
” The cult children are at it again. As with all children, they can’t accept reality. ”
*
The reality that you, Clint R, can’t grasp is that except for those who live in countries that are
– economically dependent on the US
or
– in some sort of ‘big deal’ with the US (i.e. Russia and China)
everyone on Earth is convinced that the US President is a 100% rogue boy, and that he and his butt-kissing court jesters are in the process of quickly turning the US into a rogue state.
*
If you were able to look just a little bit beyond the borders of the US, you could understand that the US’s refusal to condemn Russia in the UN Security Council for its aggression against Ukraine will lead to
– neither the US or Russia condemning China for a future aggression against Taiwan,
– nor Russia or China condemning the US for a future aggression against Panama and… Greenland.
Bindi, you’re too immature to understand ANY of this.
Putin has failed in this attempt to invade Ukraine. He has devastated the Russian military. Trump understands Putin is desperate. Yet Trump wants the war ended. He must find a way to end it without Putin doing something completely insane.
Let the adults handle this. You can’t even understand the simple ball-on-a-string.
Perhaps you can explain the tactical brilliance of Trump posting an AI video of Gaza as the Arab riviera with a giant gold statue of him in it, and him and Netanyahu shirtless and sipping cocktails.
I’m not sure this is ‘adult’ behaviour, although it was slightly risque, with bearded belly-dancers (DEI!) and Trump seeming to be touching a sheerly clad woman in a nightclub.
https://www.9news.com.au/world/donald-trump-instagram-video-vision-for-gaza/98329fe6-b56e-4530-bbed-ee2f79da1e48
Federal employees a week ago started a blog to describe what DOGE is doing, and how it impacts people through government services.
https://www.wethebuilders.org/
LOL….a bunch of entitled brats.
Might just be me, but I'[d want to know what a government agency is doing when they take a chainsaw to social security, health and education.
But you have complete trust, so don’t worry your pretty little head. Daddy will make it all better.
Huh, 21 DOGE employees just quit in protest about DOGE’s actions.
A bunch of entitled brats.
a link from from Barry’s link…
https://www.wethebuilders.org/posts/im-an-auditor-elon-has-no-idea
Reveals possibly the true reason for DOGE, which is not to cut government waste but to cut oversight committees and the likes who monitor government to keep it honest.
It is a repeated pattern across government agencies. 17 inspectors general were removed a month ago, and as far as I can find out, they have not been replaced. Firing the Democrat members of oversight committees of various federal agencies means the committees have no quorum, and therefore cannot do anything.
The Trump administration doesn’t want oversight.
The cult children are at it again. As with all children, they can’t accept reality.
Trump was left with a mess after the corrupt/incompetent Biden/Harris train wreck.
Russia had invaded Ukraine, the US Military is Woke, Gaza is in ruins, Iran is close to having nuclear weapons, China is hovering over Taiwan, millions of illegal aliens, FBI corruption, the Federal GOV is bloated, the ISS astronauts can’t get home without Musk saving then, and GOV “science” is badly perverted.
What the cult kids don’t understand is:
1) Trump is not a typical politician.
2) Trump is trying to remove corruption and incompetence from the Federal bureaucracies.
Clint R
Thank you for answering my questions about Trump supporters. I always was curious how so many could be mislead by falsehood. I can see you are fed endless lies and false information from Fox news and others. It makes you an unthinking parrot. You believe all they report withiut question and repeat their disinformation and are proud of yourself!
“Trump is trying to remove corruption and incompetence from the Federal bureaucracies.”
No he isnt.
By attacking, with certain oligarchs, the federal state and the American social contract, the Trumping boy speaks the same language as his Russian ex-counterpart and new friend Putin: the language of a power that no longer tolerates the counterweights of democratic institutions.
barry…”You ask why Im interested. I taught a class one day a few years ago and the young women in it were very distressed. They had been reading about the overturn. They keenly felt their sisters loss in the US”.
***
Good grief, you’re a teacher???
Presumably you are taking the part of these distressed women, that is, you care. So, tell me why you threatened to kick your girlfriend out during the covid hysteria because she was opposed to being vaccinated. That was one of the more insensitive actions I have encountered in my life in any kind of relationship.
Had the vaccines been scientifically developed and proved to prevent a covid infection, that might have excused you. However, they were an abject failure, as predicted by some experts like Robert Malone, an expert in mRNA theory, who was subsequently ostracized for stating his opinion that mRNA cannot prevent a covid infection. The numbers here in Canada proved him right, when it was indicated that 70% of new infections and hospitalizations featured people who had been doubly vaccinated.
Having said that, it is typical of you as observed from my end. With you blind support of the AGW theory, you are dismissing the rights of millions of people world-wide who desperately need fossil fuels to enjoy a healthy and secure life. We have not found a viable, clean alternative but you alarmist hordes are rushing toward a zero emissions policy by 2030. Were it 2130, I might agree, but not 5 years from now.
clint…”What the cult kids dont understand is:
1) Trump is not a typical politician.
2) Trump is trying to remove corruption and incompetence from the Federal bureaucracies”.
***
The Canadian soccer national team coach is a US citizen. He recently came out and lambasted Trump, telling him to back off with his rhetoric about Canada becoming the 51st state. I have confidence in millions of average US citizen, that they agree with the coach. According to recent polls, at least 50% likely agree with him.
I agree with 1), he is nothing like the average politician. The average politician has far more sense than him and have the sense to at least try taking a civilized approach to matters that concern all citizens and all allies.
Trump clearly cares only about his wealthy corporate buddies. He is already facing a backlash from disgruntled Republicans in Georgia and Texas who have suffered from the crazy and poorly thought out DOGE initiative. Furthermore, he fails to grasp the very basis of statesmanship, preferring to treat the world and the country as serfs working for a corporation.
This reveals Trump’s intelligence quotient. He has a 3 seat majority in Congress, meaning, if he loses the support of 3 Republicans he is a lame-duck president.
Re 2)…a former government official revealed how the Clinton administration managed to cut $500 billion from the books using a scientific study into the problem. They weighed up the pros and cons before acting. Trump sent in Musk, an unelected official, to bludgeon people into submission.
What kind of jerk illegally sends out emails to workers demanding that they list their productivity for the past few days, threatening them with being fired if they fail to comply? Is he not doing that in the US, which claims to be the land of the free? Every true-blue Yanks must know that is wrong.
Musk is a raving ijit, but Trump feels indebted to him due to the millions he contributed to his campaign. That underlines a major problem in US government in that only the wealthy need apply for office.
Trump is just doing right wing things. They will be reversed.
The people behind the gutting of the bureaucracy want as much as 50% of it cut. If they succeed in firing a million government workers that will be an enormous pool of experience and skill – 30% of whom are military veterans, who often continue their service working for the government and the people. It would take at least a decade to get that pool of experience back to where it was, while government services fail or become excessively delayed.
The hyper accelerated, slapdash and shoddy way they have fired and then had to rehire when they realized they screwed up, demonstrates how unthinking and reckless this slash and burn initiative is. Musk holding up a chainsaw and laughing is an image that a satirist could have come up with.
If the budget gets passed in the senate and DOGE succeed in their aims, ordinary Americans will feel the effects in short order. Trump and Musk may bribe everyone with a check, but they’ll need to keep issuing them to head off the backlash.
All this power grabbing because we’re supposed to going broke. We’re swimming govt Debt.
Well the cavalry (Congress) will come to the rescue!
Their bill will make unspecified cuts in Medicaid or Medicare, while also cutting Taxes with the NET result of INCREASiNG the Debt by $3 Trillion over 10 y!
Read today in the French Newspaper Le Monde
” Amazon founder and Washington Post owner Jeff Bezos announced on Wednesday, February 26, that the newspaper’s opinion pages would focus on defending “personal freedoms” and the “free market economy” and that views that run counter to these would no longer be published.
The Amazon founder’s decision, highly unusual for a newspaper with the reputation of the Washington Post, is part of a push toward greater interference in the decisions of the capital’s leading newspaper, which he bought in 2013.
Before the presidential election in November, Jeff Bezos notably prevented the Washington Post from calling for people to vote for Kamala Harris, while editorial endorsements are a tradition in the United States.
The businessman, who opposed Donald Trump on defense contracts during his first term, has grown significantly closer to the Republican in recent months and was present in the front rows at his inauguration on January 20.
“We will write every day in support and defense of two pillars: personal freedoms and free markets,” and thus against economic regulation, Jeff Bezos wrote in a note to the newspaper’s editors on Wednesday. “We will of course cover other issues as well, but views that run counter to these pillars will be published by others” than the Washington Post, he added. ”
*
One of many small indications that the United States is clearly moving toward an oligarch-driven dictatorship and is on the way to what is called “ploutocracy.”
Bezos is trying to bring WaPo back to reality. It has been a rag of the left wing for too long.
Leftists don’t understand that “personal freedoms” and “free markets” are good things.
Clint doesn’t understand that billionaire owners of news services editing content is a bad thing. He would thrive as an apparatchik in whatever autocratic regime matched his beliefs.
Kinglet Elonald Muskrump claims that the European Union was ‘designed to annoy the United States’.
That’s exactly in the same vein as ‘Gulf of America’, Mt Mc Kinley, his utter lie against Ukraine (‘They never should have started the war’) etc etc etc.
*
Anser of the European Union:
” The European Union has been a “godsend” for America, the Commission responded to Donald Trump on Wednesday.
“The European Union is the largest free trade market in the world,” a spokesperson for the European executive said in a long statement responding to the Republican billionaire’s remarks.
The Commission called for “working together to preserve these opportunities for our citizens and businesses. Not against each other,” the text added.
“By creating a large and integrated single market, the EU has facilitated trade, reduced costs for American exporters and harmonised standards and regulations across 27 countries,” it insisted. ”
*
It seems that Elonald Muskrump doesn’t see much further than the tip of his long nose.
He doesn’t understand anything but hustle and loyalty – to him.
Oh oh oh…
https://www.ourcommons.ca/petitions/en/Petition/Details?Petition=e-5353
Comme ils sont méchants ces petits habitants de ‘notre’ 51ème état!
Three hundred thousand signatures is no joke.
Just looked it up. This is the most signed e-petition to the Canadian government, nearly doubling the last one on firearms control that resulted in policy changes.
My mistake – no policy changes. The government banned the ‘assault-style’ weapons anyway.
stephen and bill h….I don’t want to turn Roy’s blog into a forum for political ideology. In other words, I am not trying to proselytize, only to communicate with my friends south of the border while trying to set them straight about social democracy in practice.
My understanding of socialism (now called social democracy by the politically-correct) is not at all like your definitions. I have always been supportive of responsible capitalism and I have no time for communism of any kind. Maybe one day, a human race with a much improved awareness could make it work, but I have no desire to live under a communism.
I believe strongly in a person’s right to run a business but I also believe strongly in protecting consumers and workers from those capitalists who insist on treating them disrespectfully by using them and fleecing them.
I came across proof to support my theory that socialism has nothing to do with communism and that true socialists do not see eye to eye with communists or irresponsible capitalists.
I was surprised to learn that socialism as an ideology began in the early 1800s, well before Marx issued his manifesto and the Russians stole the word socialism to describe their obscene corruption and intent of Marx’s work. Socialism began as a workers’ movement geared to making life better for the working class.
In those days, social reform was sorely needed. I think that is still true.
The following article is written by an expert who was with the Canadian Royal Military college when he wrote it. I think he is now a professor at Simon Fraser University.
https://www.thecanadianencyclopedia.ca/en/article/socialism
“Socialists favour collective action by workers to overcome their unfavourable condition. They advocate direct economic organization (eg, the formation of trade unions, labour protests and strikes) and political action (eg, the formation of socialist and/or labour parties) with the goal of reorienting the state from defending the powerful few to protecting ordinary workers”.
The recent truckers’ Freedom Convoy is a good example of the civil disobedience required to grab the attention of politicians and the likes.
There is nothing there to equate socialism, or it’s modern incarnation, social democracy, to communism. The reason people equate the two is due to misinformation spread by right-wingers who lumped the two together to discredit socialism.
Addressing Bill’s comment about Canada not being a social democracy, this is from the link above…
“Over the years, a number of Canadian parties of varying orientations have arisen claiming to be socialist. These have included the Socialist Party of Canada (1904), the Social Democratic Party of Canada (1911), the Communist Party of Canada (1921), the Co-operative Commonwealth Federation (CCF) (1932), the New Democratic Party (NDP) (1961). In Canada, the peaceful, evolutionary tradition of socialism prevails”.
The fact is, Bill, the present day Canadian government, although they appeal largely to right-wing interests, have adopted many socialist policies introduced by the Canadian working class. Mdicare was instituted federally when Paul Martin Sr., fostered a bill by socialist Tommy Douglas, a great man by anyone’s opinion, presented his idea of medicare. Douglas has started the idea of Medicare while he was premier of Saskatchewan.
In the 1930’s, communism was en vogue in both Canada and the US. Today, it has died off, being replaced by the word social democracy, which does not include communist ideology. The NDP (New Democratic Party) now runs the province of BC and they came from the CCF Party (Co-operative Commonwealth Federation) who were openly calling themselves socialists.
It might surprise you to learn that the good, old US of A was once a hotbed of socialism. I predict it will come back, once young people get past their natural stoopid factors and get organized. Today, they are wasting their energies supporting sexual dysfunction inherent in LBGTQ and the likes rather than getting smart and focusing on their plight as young people.
Hahahaha! They continually self-satirise!
Trump is now spruiking an upgrade to the green card – the gold card! Spend $5 million to get it.
Of course. It was an obvious step, really. Now rich people can just buy their way to permanent residency in the US. And it’s going to be even more attractive to these high-rollers if the senate passes the budget.
The best image I could ever imagine to represent Kinglet Elonald Muskrump…
https://i.postimg.cc/13L2z4m0/Kinglet-Elonald-Muskrump.png
barry…”My mistake no policy changes. The government banned the assault-style weapons anyway”.
***
Something needs clarification. There is no such thing as an ‘assault rifle’. That mistake comes from the AR-15 model number for a popular semi-automatic rifle where the AR was incorrectly translated as assault rifle.
The AR in AR-15 stands for ArmaLite, the name of the manufacturer. The term assault rifle makes no sense whatsoever since in war, the rifle can be used in defense as well as assault.
The AR-15 has been around since the 1950s and has never posed a problem till recently when an insignificant number of whack-jobs used such a rifle in mass shootings. The Canadian government seriously over-reacted by banning all such firearms.
Canadians have had access to such semi-automatic firearms since the 1950s and the number of mass shooting could be counted on one hand.
Not being a gun owner, could you explain what semi-automatic means, and if these kinds of rifles have more rounds than a hand gun or less tactical rifle, if they are quicker to load, and why, in general, these are the weapons most used in mass shootings? U’ve read that mass shootings with these weapons tend to have more casualties than with other kinds of gun. Does that sound right to you (or anyone else who knows about guns)?
I’m aware that gun enthusiasts are peeved that semi-auto weapons are referred to as if they’re fully auto, buy I’d like to move away from the political stoush to a technical understanding.
Barry…there are basically two kinds of firearms, those that are manually operated, that is loaded by hand or mechanical action, and those that are automatically loaded by the gas pressure from a fired round of ammo. If you have to operate a lever to move the next round into the chamber, that is classified as a manual load.
The revolvers used in the old west were typical of the manually operated type. To fire the ‘single-action’ type, you had to manually pull back the hammer with the firing pin then fire it. Once the hammer comes forward, when activated by the trigger, and the firing pin in the hammer activates a round, you have to manually pull the hammer back to fire a second round.
There are also double-action revolvers, where simply pulling the trigger cocks the gun again. With a revolver, the rotating chambers are fully loaded, so there is always a round ready to fire.
The designation ‘semi-automatic’, means you have to pull the trigger each time you fire a round. The difference between that and a revolver is that the ammo supply in a semi-automatic (either pistol or rifle) comes from a spring-loaded clip that can be detached and replaced easily. The ammo is under spring pressure so as one shell is ejected, the spring action pushes another round into the chamber.
There are two basic pistol types. With one you have to initially cock the firearm by pulling the slide back to ‘arm’ it. With the other, simply pulling the trigger arms it but on the first pull of the trigger, the action requires more strength to pull the trigger. After the first round is fired, gas from the discharged round aids/replaces the action.
Most rifles used by the infantry in a war are semi-automatic. The M1 rifle made popular by US Marines in WW II, were semi-automatic. That is, they had to pull the trigger each time to fire a round. It’s relative, the M2, could be fired as a fully automatic rifle, like a machine gun, simply by holding down the trigger.
In all the non-fiction stories I have read about WW I and WW II, I have never heard the term ‘assault rifle’ used. Assault can mean assaulting soldiers in a field or simply assaulting an individual. I’d say it’s safe to claim that 99.99% of rifles owned in public are never used to assault anyone.
Of course, in mass shootings, the semi-automatic rifle can be devastating, but not necessarily as devastating as a fully automatic machine gun. Although the effects are traumatizing to the victims who survive, and the public afterward, thankfully only a few psychologically disturbed individuals have taken part. Rather than blaming firearms owners in general, it would be much better to identify why some people flip out and use a firearm treacherously.
I have taken part in social events at the gun club I belong to and I have yet to encounter anyone I’d consider psychologically affected. There are even off-duty police using the range.
Here in Canada they probe for psychological issues before issuing a permit. In the course I took, they emphasized the word firearm rather than ‘weapon’, which I think helps get it across that a firearm does not need to imply weapon.
Would you say that the school shooters who kill so many kids favour AR-15s and other semi autos because they are more effective at doing the most damage?
Could a kid with a bolt action rifle or a handgun do as much damage? My guess is no.
There is also the psychological aspect. A tactical weapon is cooler, so perhaps their easy availability in the US makes it easier for these deranged killers to be ‘cool’.
The corruption-busters have outdone themselves. Elon Musk has just recommended that the FAA cancel a $2 billion dollar contract with Verizon and award it to his own company, Starlink.
The conflict of interest doesn’t stop there. The cull of agency heads and inspectors general and oversight committees are to do with various federal agencies that had almost unanimously been investigating and limiting, among other things, Musk’s business deals with the government (which currently run in the billions of dollars) as well as his private companies.
Musk is restructuring the federal agencies that directly impact his business so that he has fewer obstacles. And now he is awarding himself government contracts. It’s blatant.
Will the Republican congress do anything about it? Do they have any spine left?
A lengthy but incomplete list of Musk’s conflict of interest.
https://act.represent.us/sign/elon-musk-conflicts-of-interest
How on Earth did the richest man in the world get his hands on the levers of power to minimise his accountability?
The oval office meeting with Zelensky. God help me I watched the full tape.
I’ve never seen such incompetence and narcissism on display in a diplomatic meeting. Why on Earth are they having press gaggles that go on for ages, and in this case when the negotiations are so sensitive?
It could not be more amateurish and self-serving, particularly when the stakes are so high. Trump talking about his huge election victory, griping about Biden and trotting out his campaign messaging from last year. Overtly preening when asked a flattering question by an allied reporter. Vance chiding Zelensky like a schoolmaster talking to a kid kicked off an ugly display.
Absolute cretins, Clowns. Embarrassment after glaring embarrassment. Incompetence after glaring incompetence. Does MAGA see it yet, or are they just too mired in devotion to this nincompoop Trump and his awful administration?
Anyone see Musk at the cabinet meeting? Trump joked he’d throw any cabinet member out of the room who disagreed with Musk. And the cabinet literally applauded like this was the soul of wit.
Craven, boot-licking sycophancy. Putrid stuff to witness.
aigpkx