
 Home/Blog
Summary of Main Points
By choosing the “best” models and estimates of CO2 fluxes (those which best explain year-to-year changes in atmospheric CO2 content as measured at Mauna Loa, HI) for the period 1959-2023 as provided by the Global Carbon Project, a multiple linear regression of yearly Mauna Loa CO2 changes against those “best” estimates of sources and sinks leads to the following alterations to the “official ” Global Carbon Project estimates of the sources and sinks leading to the observed rise in atmospheric CO2. (NOTE: being a statistical exercise, this does not constitute “proof”… these are just some areas that carbon budget modelers might want to look into when tweaking their models):
- Global anthropogenic CO2 emissions appear to be 30% larger than reported (I find this hard to believe… again, statistics are not necessarily proof).
- The Land Sink of CO2 has been underestimated by an average of about 25%
- The Ocean Sink of CO2 has been overestimated by about 20% (I don’t know whether they include CO2 outgassing).
- The Land Use source of CO2 (primarily biomass burning) has been overestimated by about a factor of 2 (very uncertain)
- The cement carbonation sink has been underestimated by about a factor of 7 (very uncertain)
- There is a remaining unknown CO2 sink that has averaged 0.2 ppm/yr during 1959-2023 (this could just be a residual of other statistical errors).
Background
Many researchers have spent their careers trying to estimate the various global sources and sinks of atmospheric CO2. The main net sources are anthropogenic emissions (including cement production) and land use (mainly biomass burning). The main CO2 sinks are land (vegetation and soil storage), the ocean (mixing the “excess” atmospheric CO2 downward… biological uptake remains largely unknown), and cement carbonation (old cement absorbs atmospheric CO2).
The Global Carbon Project (GCP) periodically summarizes various estimates of these sources and sinks and produces easily-accessible spreadsheets of the data. I suppose for political expediency (don’t insult your peers), the GCP (like the IPCC does for climate models) just takes virtually all of the estimates of CO2 fluxes and averages them together to produce a single “best” estimate of specific fluxes on a yearly basis. For example, they average 20 (!) different land models results for yearly net CO2 fluxes into the land surface (I say “into” because the current atmospheric “excess” of CO2, around 50% above pre-Industrial levels, causes the land and ocean to be net sinks of CO2).
What I Did
But since I am not part of the global carbon budget research community, I can pick and choose which models and data-based estimates I use. Some of these models are better than others at explaining the yearly increase in atmospheric CO2 at Mauna Loa, Hawaii, and here I will provide an analysis using only the best estimates.
(Now, some researchers believe that an average of all estimates will be better than any individual estimates. I don’t believe that… and neither should you. As a simple example, you can’t make a better estimate of something by averaging a good estimate with a bad estimate.)
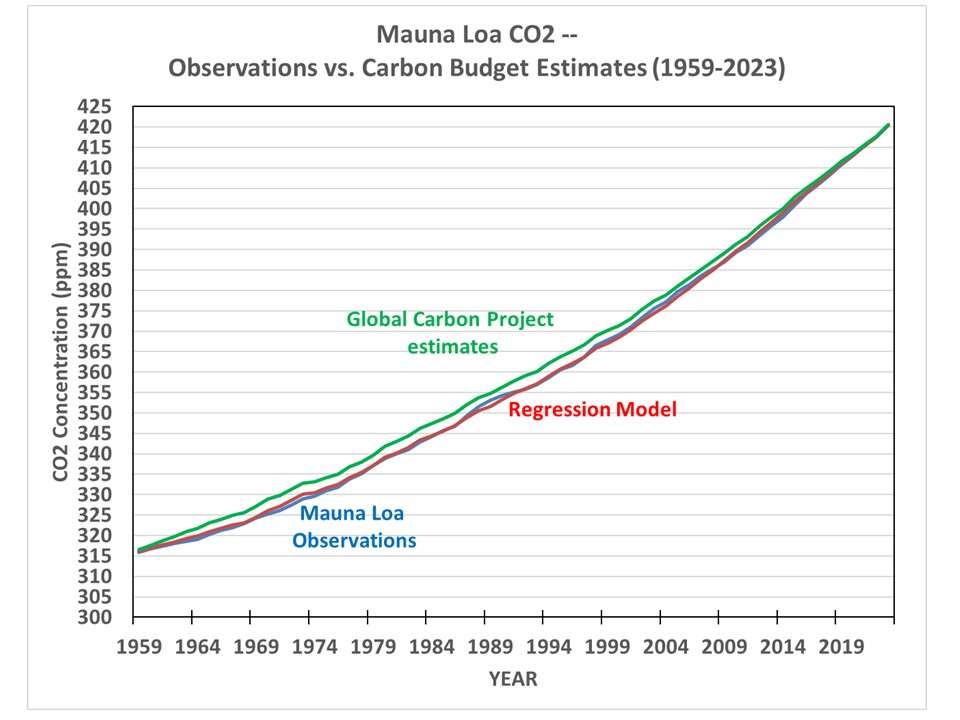
So, what I did was to examine how well each individual model estimate (or sometimes an observational estimate) helped to explain the yearly CO2 increases at Mauna Loa. I then chose the best ones, and averaged them together. Then I regresses the yearly CO2 changes at Mauna Loa against these averages. As Fig. 1 shows, this produces a much better estimate of the Mauna Loa CO2 record than the GCP estimates of CO2 fluxes based upon all available estimates from various sources.
Now, to be fair, part of this better agreement comes from the statistical regression. The GCP estimates (quite admirably) use all of the available estimates based upon physics and parameterizations, and then sees how well the results match the Mauna Loa record. And they even include the yearly “residual” in their spreadsheet to show how well (or how poorly) the models fit the data. Kudos.
But I used the best models and estimates, and then use multiple linear regression, to see how closely the data can be fit to the Mauna Loa observations. Again, the year-to-year changes in observed CO2 concentrations are statistically related to the sources and sinks of CO2 which come from (1) anthropogenic emissions, (2) land use emissions, (3) land vegetative and soil uptake, (4) ocean uptake, and (5) cement carbonation (old cement removes CO2 from the atmosphere).
The results give a total regression model explained variance of 81%. The regression coefficients tell us whether the individual CO2 budget terms (sources and sinks of CO2) have been underestimated or overestimated. If the terms equal +1 (for sources) or -1 (for sinks), then the model estimates of the yearly CO2 sources and sinks are (on average) unbiased in their explanation of yearly CO2 changes at Mauna Loa.
Again I emphasize that such statistical results can be misleading. Errors in one term’s regression coefficient can cause errors in other terms’ coefficients. But regression analysis can also sometimes can reveal insights into what physics might be missing. I have seen both in my 40 years of doing such calculations.
Here are the results:
Global Anthropogenic Emissions: Coefficient = 1.3 (+/-0.22) This suggests anthropogenic emissions have been underestimated by about 30%. I find this hard to believe. Energy use is pretty well known. Maybe the cement production source has been underestimated?
Global Land Use: Coefficient = 0.43 (+/-0.45) This suggests land use emissions have been overestimated (but the coefficient uncertainty is large). Also, if there is little skill in a term, a lower coefficient will result due to the “regression to the mean” effect. This result suggests to me that yearly land use as a source of CO2 remains very uncertain.
Global Land Sink: Coefficient = -1.26 (+/-0.16). This suggests the land (mainly vegetation) sink has been underestimated by maybe 25%. The error is the coefficient is pretty small, so I think this result is significant.
Global Ocean Sink: Coefficient = -0.80 (+/- 0.49) This suggests the ocean sink has been overestimated (but with rather large uncertainty) by about 20%. I haven’t looked at whether these ocean models include CO2 outgassing as the temperature rises (a small effect). I’m not convinced that this coefficient is significantly different than 1.0, which would be the case if the models are unbiased in their estimates of the ocean sink.
Cement Carbonation Sink: (-7.3 +/-4.9) This suggests the CO2 uptake by old cement has been greatly underestimated (but with large uncertainty). This is a surprisingly large number, and I don’t know what to make of it.
I’m not convinced of most of these conclusions, except maybe the vegetation sink of CO2 being underestimated by the models. There have been recent papers published finding some vegetation uptake processes have been underestimated by the models.
The global anthropogenic emissions source being underestimated is also intriguing. Being greater than 1, the 1.3 coefficient is the opposite of what we would get from regression if the yearly anthropogenic emissions estimates were poor. So, I’m inclined to believe this is real.
Anyway, this was an quick-and-dirty exercise. Maybe 4 hours of my time. You can access the GCP data spreadsheet here.
P.S. I’m sure someone will ask about adding various natural factors: for example, global surface temperature (land and/or ocean). Yes, that can be done.


Nice work.
What is the CO2 contribution from all things volcanic?
Thanks.
Harold The Organic Chemist Says:
CO2 Can Not Cause Warming of Air.
At the MLO in Hawaii, the concentration of CO2 in dry air is 424 ppmv. One cubic meter of this air contains 0.839 g of CO2 and has a mass of 1.29 kg at STP. This trace amount of CO2 (0.839 g )can heat up such a large mass of air by only a very small amount if at all.
In air at 70 deg. and 70% RH, the concentration of H2O is 14,780 ppmv. One cubic meter of this air contains 11.8 g of H2O, 0.78 g of CO2, and has a mass of 1.20 kg. To the first approximation and all things being equal, the amount of the greenhouse effect (GHE) due to H2O is given by:
GHE = moles H2O/moles H2O+moles CO2 = 0.66/0.66+0.018=0.97 or 97%
The above empirical data and calculations show that that the claim by the IPPC and the unscrupulous collaborating scientist is a fabrication and a lie. The purpose of this lie is to provide the justification for the maintenance and funding of the IPCC.
Keep in mind that 71% of the earth surface is covered with H2O.
The number of CO2 molecules in one cubic centimeter of well-mixed atmospheric air at STP is roughly 1 followed by fifteen zeroes. If each molecule were opaque to visible light you wouldn’t be able to see your hand in front of your face. Nice try. No cigar.
Huh? What are you trying to say?
My claims are quite simple: There is too little CO2 in the air to cause global warming, the IPCC has been lying to us and have perpetrating the greatest science fraud since the Piltdown Man. A second objective of the IPCC’s lies is to provide the UN the justification to distribute funds, via the UNFCCC and the UN COP, from the rich donor countries to the poor countries to help them cope with global warming and claim change. At the recent COP29 conference in Baku the poor countries came clamoring not for billions but trillions of funds. They left the conference empty handed with no pledge of funds from the rich countries. Go look up the budgets for the UNFCCC, the UN COP and the IPCC.
Look what the CO2 global warming lie has done to the economies of the UK, Australia, Germany, and California. I just saw on the MSN that a 6-year old coal-fired 3,ooo mW power plant in Germany, which cost several billion euros, was blown up and destroyed.
Now you should go to: http://www.John-Daly.com. From the home page scroll down to the end and click on “Station Temperature Data” On the “World Map”, click on “NA”. Scroll down and click on “Pacific”. Finally, scroll down and click on “Death Valley”. The chart shows plots of temperatures at the Furnace Creek weather station from 1922 to 2001. In 1922 the concentration of CO2 was ca. 303 ppmv, and by 2001, it had increased to 371 ppmv, but there was no corresponding increase in air temperature at this remote desert. The reason there was no increase in the air temperature in this arid desert is quite simple: There is too little CO2 in the air. John Daly found several hundred weather station that showed no warming up to ca. 2002. In 1900 the concentration of CO2 was ca. 295 ppmv and by 2001 it had increased to ca 371 ppmv.
Harold,
“My claims are quite simple: There is too little CO2 in the air to cause global warming, the IPCC has been lying to us and have perpetrating the greatest science fraud since the Piltdown Man.”
–
I totally agree with you, Harold, “There is too little CO2 in the air to cause global warming,”.
I do not think “the IPCC has been lying to us”. What I think is that science has taken a mistaken way of thinking – it is so much mistaken, they are so much sure they are right – politicians cannot deny those scientists conclusions, because otherwise politicians would be held responsible for the alleged future global overheating catastrophe.
–
Link: https://www.cristos-vournas.com
Michael,
And there are 2500 other molecules surrounding each CO2 molecule. No cigar.
Michael,
Have you ever calculated the cross section of those CO2 molecules?
“One cubic meter of this air contains 0.839 g of CO2 and has a mass of 1.29 kg at STP. This trace amount of CO2 (0.839 g )can heat up such a large mass of air by only a very small amount if at all.”
Harold,
You are ignoring optics.
The CO2 molecules, though small in fraction, are sufficient in number to abs.orb ALL of the IR passing through a few meters of atmosphere, within a CO2 abs.orption peak.
And once the energy is abs.orbed by a CO2 molecule, it shares it, with N2 molecules, THEN abs.orbs MORE, and repeats this process again and again.
Thus a tiny fraction of CO2 CAN abs.orb much of a significant fraction of surface emitted IR and warm the atmosphere, and prevent it from escaping directly to space.
As can be seen here in the spectrum of outgoing IR escaping to space. This is the GHE.
https://www.researchgate.net/profile/Fred-Ortenberg/publication/291164378/figure/fig2/AS:648594344390664@1531648350772/Spectrum-of-Earth-Thermal-IR-radiance-recorded-from-space-a-Desert-Sahara.png
Why don’t they report how much they have underestimated natural emissions? And, also how you can’t do a proper conservation of mass without including it?
Nate,
What are the CO2 sinks in the Sahara Desert?
Every analysis of the timing of CO2 change and temperature change shows that temperature change happens first. Therefore CO2 cannot be the cause of temperature change. Warming the oceans causes the release of CO2 which is standard chemistry and explains what is happening.
Wrong. The last century is case in point.
And the notion that if A can cause B, that rules out that B can cause A is flawed logic.
See eg chicken-egg.
In addition, at no time in the past did ~ 1 degree C of warming cause an ~ 50 % rise in CO2 (280 ppm to 420 ppm).
There is no known mechanism that produces that large of a response.
Then it is an unknown mechanism.
Not at all. The mechanism is organic carbon buried over millions of years being dug up and dumped into the atmosphere over 100 years.
This is not the end of severe weather in the US. Arctic fronts will continue to push westward on the US, bringing thunderstorms to the central and eastern US.
https://i.ibb.co/x8rttDb4/gfs-z100-nh-f72.png
It is, more likely, Earth is warmer than Moon, because Earth has a higher (N*cp) product.
Link: https://www.cristos-vournas.com
–
–
Also thinking Earth’s thin atmosphere makes Earth warmer than Moon that thinking is a mistake.
Link: https://www.cristos-vournas.com
Very strong thunderstorms in Louisiana and Alabama.
Strong thunderstorms are moving into Georgia and northern Florida.