
 Home/Blog
As a follow-on to my recent post regarding global surface air temperature trends (1979-2025) and how they compare to climate models, this is an update on a similar comparison for tropical tropospheric temperature trends, courtesy of tabulations made by John Christy. It also represents an update to my popular “epic fail” blog post from 2013.
As most of you know, climate models suggest that the strongest warming response the climate system has to increasing anthropogenic greenhouse gas (GHG) emissions (mainly CO2 from fossil fuel burning) is in the tropical upper troposphere. This produces the model-anticipated “tropical hotspot”.
While the deep oceans represent the largest reservoir of heat energy storage in the climate system during warming, that signal is exceedingly small (hundredths of a degree C per decade) and so its uncertainty is rather large from an observational standpoint. In contrast, the tropical upper troposphere has the largest temperature response in climate models (up to 0.5 deg. C per decade).
This shown in the following plot of the decadal temperature trends from 39 climate models (red bars) compared to observations gathered from radiosondes (weather balloons); satellites; and global data reanalyses (which use all kinds of available meteorological data).
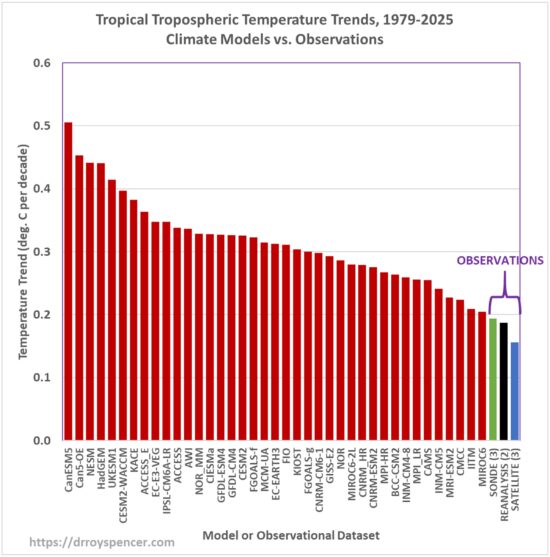
The sonde trend bar in the above plot (green) is the average of 3 datasets (radiosonde coverage of the tropics is very sparse); the reanalysis trend (black) is from 2 datasets, and the satellite trend (blue) is the average of 3 datasets. Out of all types of observational data, only the satellites provide complete coverage of the tropics.
Amazingly, all 39 climate models exhibit larger warming trends than all three classes of observational data.
Time Series, 1979-2025
If we compare the average model warming to the observations in individual years, we get the following time series (note that complete reanalysis data for 2025 are not yet available); color coding remains the same as in the previous plot:
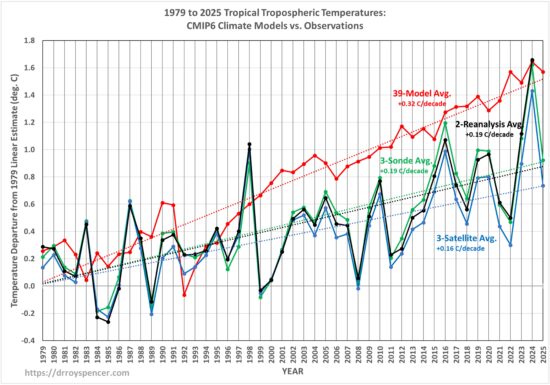
The unusually warm year of 2024 really stands out (likely due to a decrease in cloud cover letting in more sunlight), but in 2025 the satellites and radiosondes show a “return to trend”. Of course, what happens in the future is anyone’s guess.
“So What? No One Lives In the Tropical Troposphere”
What is going on that might explain these discrepancies, not only between the models and the observations, but even between the various models themselves? And why should we care, since no one lives up in the tropical troposphere, anyway?
Well, the same argument can be made about the deep oceans (no one lives there), yet they are pointed to by many climate researchers as the most important “barometer” of the positive global energy imbalance of the climate system caused by increasing GHGs (and maybe by natural processes… who knows?).
The excessive warming of the tropical troposphere is no doubt related to inadequacies in how the models handle convective overturning in the tropics, that is, organized thunderstorm activity that transports heat from the surface upward. That “deep moist convection” redistributes not only heat energy, but clouds and water vapor, both of which have profound impacts on tropical tropospheric temperature. While moistening of the lowest layer of the troposphere in response to warming no doubt contributes to positive water vapor feedback, precipitation microphysics governs how much water vapor resides in the rest of the troposphere, and as we demonstrated almost 30 years ago, that leads to large uncertainties in total water vapor feedback.
My personal opinion has always been that the lack of tropical warming is because positive water vapor feedback, the primary positive feedback that amplifies warming in climate models, is too strong. Climate models actually support this interpretation because it has long been known that those models with the strongest “hotspot” in the upper troposphere tend to have the largest positive water vapor feedback.
Will Climate Models Ever Be “Fixed”?
I find it ironic that climate models are claimed to be based upon fundamental “physical principles”. If that were true, then all models would have the same climate sensitivity to increasing GHGs.
But they don’t.
Climate models range over a factor of three in climate sensitivity, a disparity that has remained for over 30 years of the climate modeling enterprise. And the main reason for that disparity is inter-model differences in the moist convective processes (clouds and water vapor) which cause positive feedbacks in the models.
Maybe if the modelers figured out why their handling of moist convection is flawed, models would then produce warming more in line with observations, and more in line with each other.
Much of global warming alarmism arises from scientific publications biased toward (1) the models that produce the most warming, and (2) the excessive GHG increases (“SSP scenarios“) they assume for the most dire climate change projections. Those scenarios are now known to be excessive compared to observed rates of global GHG emissions (and to the reviewer of our DOE report who said this conclusion was in error because I didn’t account for land use changes, no, I removed land use changes from the SSP scenarios… it was an apples-to-apples comparison).
Finally, I don’t want to make it sound like I’m against climate modeling. I am definitely not. I just think the models, as a tool for energy policy guidance, have been misused.


Thank you, Roy. Your research and posts are always interesting and make important points. Now, I’ll sit back and watch the food fight begin (heads up in the cafeteria).
Dr Roy
Thanks for your work and expertise in this field. I have one question concerning the first post, which GHG scenario was used in the tabulation of model results?
Will
I believe John Christy used SSP245, although it doesn’t much matter because through 2025 there is little difference between scenarios.
This would make a good keynote talk at the upcoming ICCC (International Conference on Climate Change) in DC this April. I’ll be there.
(Preferably without a food fight.)
Santer et al. 2018 contradicts Spencer’s claims of wholesale model failure. Santer concludes that, with appropriate statistical testing and updated datasets, discrepancies between modeled and observed tropical tropospheric trends are not robustly significant in some layers and time periods.
https://link.springer.com/chapter/10.1007/978-3-319-65058-6_5
Ben twists himself up trying to explain away discrepancies, but he’s still wrong.
It’s impossible to evaluate the differences you claim without confidence intervals and explicit uncertainty quantification.
Your analysis commits a common error in model-observation comparisons, treating the multi-member ensemble mean as the expected outcome for a single realization of the climate system. Climate model ensembles are built to sample internal variability as well as the forced response, whereas you present observations as one single realization which can therefore legitimately fall toward one end of the ensemble distribution over a finite time period without implying systematic model bias.
This issue is particularly evident for CanESM5, which stands out in your opinion article as having one of the largest mean discrepancies. This particular ensemble comprises around 50 simulations, implying substantial spread due to internal variability.
The appropriate test of consistency is whether observed tropical tropospheric warming rates fall within the ensemble spread, not whether they match the ensemble mean. But I’m sure you already know that.
IMHO.
Well put.
Arkady,
Are you suggesting that a confidence interval should be calculated from an ensemble model?
It is a strained/absurd argument used by the GCM defenders to dismiss these clear trend inconsistencies. That is to say, the uncertainties in a given models response may be so large that it can still encompass virtually any observed result. Or, the more uncertain the model result, the more likely it is still consistent with observations. Or, models with the greatest uncertainty, are the least falsifiable! Isn’t that convenient!! All it really means is that the large GCM variability, and model to model inconstancy, make them virtually useless as a RELIABLE predictor. Only in Climatology (the orphan child of the sciences) are such arguments tolerated/promoted.
It is a strained/absurd argument used by the GCM defenders to dismiss these clear trend inconsistencies. That is to say, the uncertainties in a given models response may be so large that it can encompass virtually any observed result. Or, the more uncertain the model result, the more likely it is still consistent with observations. Or, models with the greatest uncertainty, are the least falsifiable! Isn’t that convenient!! All it really means is that the large GCM variability, and model to model inconstancy, make them virtually useless as a RELIABLE predictor. Only in Climatology (the orphan child of the sciences) are such arguments tolerated/promoted.
A funny thing is here that among the authors of the article
Consistency of Modeled and Observed Temperature Trends in the Tropical Troposphere
you find these three:
– Leopold Haimberger (U Vienna, Austria)
– Carl Mears, Frank Wentz (RSS, Santa Rosa)
*
The first one is, if I well remember, a radiosonde specialist who worked in the early 2000s with Spencer/Christy on homogenisation of radiosonde data using UAH’s satellite data, and developed with collabotators the RICH and RAOBCORE software packages (designed to improve homogeneity in radiosonde data).
*
The latter two are the head of REMSS, a group showing satellite data differing a lot from UAH’s (RSS v4.0).
Roy,
Isn’t the tropical troposphere extremely sensitive to the ENSO state?
Thus, our particular ENSO history matters a great deal.
It would be worthwhile to compare only to models with a similar ENSO history to the one we had.
Hard to compare the two updates.
Looks voluntary.
Care to elaborate on what you mean?
You said the observations moved up one place since 2024.
What’s the move since 2013?
Christy’s comparisons were misleading because they used unrepresentative data (tropics only) cherry picked to make the models look bad.
The average model from the mid 1970s, when programmed with actual CO2 growth since then, predicted 0.2 degrees C warming per decade.
Surface warming in those years was 0.2° C per decade. Total warming predicted was accurate, even though CO2 was over emphasized & increased absorbed solar radiation was under emphasized.
UAH GAT increased at a slower rate than surface measurements.
But nobody knows if UAH is more accurate than surface measurements.
There is no perfect measurement of GAT that we can compare Surface measurements or UAH to. Knowing the accuracy of these measurements is impossible.
Its even more staggering to realize that planetary motions have an impact here as well. They account for some of the variations seen the instrument and proxy records, along with variations in solar brightness.
Waffling again, Bill.
You opine, but you can’t produce data.
bindidon brought up a source that estimates the effect of this makes up 60% of the warming seen up to 2015.
https://www.drroyspencer.com/2026/03/uah-v6-1-global-temperature-update-for-february-2026-0-39-deg-c/#comment-1738380
Using this China delivery base totally changed how I shop abroad — everything just feels effortless.
Berkeley Earth just released their annual report on global temperatures for 2025.
It sure did:
https://berkeleyearth.org/global-temperature-report-for-2025/
NOAA as well.
https://www.ncei.noaa.gov/news/global-climate-202513
“Annual Highlights:
NOAA ranks 2025 as the third-warmest year in its global temperature record, which dates back to 1850.
Upper ocean heat content was record high in 2025.
Annual sea ice extent for both the Arctic and Antarctic regions ranked among the three lowest years on record.
The Northern Hemisphere snow cover extent was the third lowest on record.
There were 101 named tropical storms across the globe in 2025, which was above average.”
Meanwhile, so called skeptics will dismiss this by insisting that the long term trend has been global cooling for 3000 years.
They really said nothing at all,
“They really said nothing at all,”
Could you clarify what you are referring to and who this is directed toward?
Don’t mind Ian. He’s a nice chap, but also an ankle biter.
Let’s frame it this way:
Globally, there is not one single day in 2025 that was cooler than its 1991-2020 average.
(Via Andrew B. Watkins.)
How can NOAA claim it has records going back to 1850.,when it did not exist before 1970? They may have sourced data, but it is theirs.
How can you be post here while being so ignorant and unwilling to learn?
All institutions worldwide collect as much hstorical data as possible, and so doesn NOAA.
They started around 1990 GHCN-M (also named GHCN V1), the first project acquiring and maintaining as much monthly station data as possible.
In 1997, there were about 6000 stations; GHCN V2 and V3 then had 7280 stations worldwide.
Currently the V4 version is active, with over 27000 stations.
From where, do you think, does the data recorded by the numerous stations of GHCN daily?
For example:
ASN00001006 -15.5100 128.1503 3.8 WYNDHAM AERO
ASN00001006 1750 2023 274 WYNDHAM AERO
located in Australia?
What about starting here, instead of believing Robertson’s lies?
https://www.ncei.noaa.gov/products/land-based-station/global-historical-climatology-network-monthly
Ian,
The UK met office has 80% of their stations which are classified as junk that is a few degree centigrade out. Not only that, but some sites don’t physically exist or located in the sea at low tide.
If the UK is supposed to be a mark of quality then it’s anyone guess at how poor NOAA data is.
Anon for a reason
A paper titled ‘State of the UK Climate in 2024’, published in July 2025, reveals that sea surface temperatures near the UK have risen by nearly 1°C compared to the 1961-1990 baseline.
This can’t be urban heat island effect or bad station placement. So what’s the explanation?
https://rmets.onlinelibrary.wiley.com/doi/10.1002/joc.70010
Eldrosion,
I will have a detailed look at the report later. Initial scam did make me laugh.
Climate change cause spring to be a couple of days early. Taken by itself, then yes that is one possible causes. But their next remark that autumn was also a couple of days early suggests something else. Minor orbital changes. But characters like Entropic think you can work out orbital changes on a piece of paper.
But either way thanks for highlighting the paper.
You’re welcome.
I appreciate your commitment to learning more about this topic.
I am new to this and am confused about a fundamental point. When comparing a climate model prediction for 2025 to the observational data in 2025, how recent was the observational data used to construct the climate model? In other words, was the climate model constructed based on data until 2024 or based on data until some earlier year? If the latter, what earlier year? Also if the climate model projecting temperature to 2025 was based on observational temperature data until say 1990, did it then project CO2 levels from 1990 to 2025 or use observed C02 levels from 1990 to 2025 in the projection?
The CMIP6 models used observational data through 2014. From 2015 onward they ran a set of emissions scenarios that postulate emission levels out to the year 2100.
There’s an explanation and overview article at this link:
https://www.carbonbrief.org/cmip6-the-next-generation-of-climate-models-explained/
Mark,
These emission scenarios are based on economists, and unless they have a crystal ball then it’s worthless. Did they predict any pandemic, super scaling of ai data centers, work from home ?
In the UK we have zero trust in economists, doesn’t matter which political party you vote, the majority are very skeptical.
Stu at 2:57 PM
Adding to Mark B’s comment above, the CMIP6 models do not use observed temperatures to project future climate. Historical atmospheric concentrations of CO2, CH4, N2O, and halogenated gases are given as externally specified time series for the period 1850-2014; from instrumental measurements for recent decades, and ice-core reconstructions for earlier periods. Beginning in 2015, scenario-based concentrations are used.
So, when comparing model output to observations in 2025, any agreement or disagreement in 2025 reflects the model’s forced response to the scenario plus internal variability.
You can read more about it here: https://confluence.ecmwf.int/display/CKB/CMIP6%25253A%252BGlobal%252Bclimate%252Bprojections?utm_source
Ark, I think Mark’s point and your response shed light on a very important point, and flaw, in all these models. The models all have to START with temperature and other important physical conditions of the atmosphere, oceans, and cryosphere. In three dimensions. From 1850 to 1900. Really? And then project that out to 2100. Step, by step. Sounds like a Las Vegas magic trick. Entertaining, but not having much real world value. All that computing power would be better spent on AI or bitcoin mining.
After the insults die down, can you or someone else tell me why I am wrong?
Two thoughts:
1) One could argue that incomplete and imperfect observational data to set model initial conditions is a flaw in the data and a challenge for modeling, rather than specifically a flaw in the model. The way it is dealt with, as I understand it, is to run the model for an extended period under the conditions of the CMIP6 “piControl” experiment which holds relevant conditions constant at levels consistent with 1850 with a recommended run time of 500 years. From this one can evaluate consistency of the metrics produced with whatever observations are available.
Another experiment “AMIP” runs from 1850 to near present using historical forcing data to produce metrics whose consistency can be evaluated against observations such as they exist.
2) You’ve identified a real issue, one of many really, which is a fine trait for scientific inquiry. You’ve then used it to discard climate modeling as a useful tool of scientific inquiry without any apparent understanding or evaluation of how the issue is addressed or how plausible it might be that it has been reasonably mitigated.
It gives the impression of looking for a rationalization to discount climate modeling without applying a commensurate level of skepticism to the why your conclusion might be poorly reasoned. That is, “climate modeling useless because 1850 observations are sparse”, isn’t self evident.
The “after the insults die down” comment is bad form if you’re really interested in good faith discussion of the science.
Thomas Hagedorn at 7:01 AM.
Quite right, it’s all magic. Just like numerical weather forecasts that “somehow” predict hurricanes days in advance. And of course, the Moon landings were staged, GPS works by telepathy, antibiotics cure infections by suggestion, and the Sun revolves around the Earth once per day, because any scientific result that relies on maths, physics, and computation can be dismissed as a parlor trick when it leads to inconvenient conclusions.
Unfortunately I can’t tell you how it’s done because the first rule of Magic is: You don’t talk about how the trick is done. The second rule of Magic is: You DO NOT talk about how the trick is done.
Thomas
Remember Russell’s teapot.
The onus is on you to show that you are correct, not on us to show that you are wrong.
Wrong again, Ent.
The onus is on you, and your cult, to accept reality. Ice cubes cannot boil water, passenger jets do not fly backward, and false beliefs ain’t science.
Ark,
To take 50 years of data, with poor data quality, and try to build a model that accurately predicts 200 subsequent years is indeed like trying to pull off a magic trick. No need to be so dramatic about it. Why does questioning the accuracy have to be equal to questioning the lunar landings or heliocentric model?
If you reread my post, I was questioning the data used at the starting point of all the models – the INITIALIZATION. I DON’T question the use of climate models, or any models for that matter. I simply expect them to be built with cool, scientific detachment, seeking reality without respect to the outcomes, not driven by monetary, professional advancement and political goals that could flow from those same outcomes. I realize that is probably an unrealistic expectation.
So, I DO seriously question the astounding claims made by proponents of THESE particular models to start with such meager and unvalidated data collected during the 19th century, before meteorology had even begun as a serious science, and purport to predict temperatures and a host of other weather-related events and conditions over 100 years later. Is that possible? I highly doubt it, but maybe you can. Using Richard Feynman’s standard, can someone on here explain it as if you were talking to a first year grad student (or a bar tender, not sure which version of his quote is correct)? In a couple paragraphs please, not interminable dissertations and links to countless articles and websites and personal ad hoc research. Narrative, please. How can the serious flaw of the initial condition data be overcome, how has it been overcome? This isn’t a theoretical question. You are losing the battle to convince those not in your small group of specialists that the threat is existential. We are scientists, just trust us is not working. Even worse, people are losing respect for your important work.
I have good company in my heresy. Click on the link that Dr Roy included at the outset of his post to take a different look at this from 2013. Also, read the chapter that Dr Stephen Koonin has written in his book “Unsettled” (recently updated in 2024) that is highly critical of these climate models. Koonin authored a text on the use of modeling in physics, so I suppose he is somewhat an expert on these matters.
Now, let the food fight commence.
Thomas,
The sole focus on the initialization period (with sparse data) and the projection period (for which we don’t yet have data) misses the middle part where the model has to behave in a reasonable approximation of the earth during the period that we have more and higher confidence data.
It’s the comparison of model behavior with available observational data in that middle period that gives some confidence that the model is responding to forcing data in ways that provide useful insight into the earth’s behavior under other hypothetical scenarios.
It’s understandable to be skeptical of climate model projections. It’s useful to identify and understand their shortcomings and limitations and use this as the impetus to better understanding of climate dynamics and ultimately better climate modeling. It’s important to make good faith efforts to quantify uncertainty. In the end though models are useful because they’re likely providing more insight into the future than any currently available alternative.
Mark B, thank you for the reasoned explanation. I understand what you are saying. I also know of the controversy surrounding tuning of the models with that increasingly accurate data as we move forward in time (the “middle part” as you call it. I believe some critics suggest that the models are being forced to confirm to the more modern data and that the models are not necessarily being improved. My field (investments) is infamous for “back testing” an investment approach (hindcasting) in order to sell a particular approach only to result in great disappointment for investors when the future doesn’t align well with the model. I have no way to judge whether that is true for climate models or not. I guess one test would be if they are improving in accuracy over time. But thanks for your direct answer.
Let’s hope our in-house fund manager has heard of rolling windows:
https://gmd.copernicus.org/articles/17/191/2024/
This is great, Roy.
Is it possible to provide a printable version of this?
Thanks.
Have you reviewed the work of Paul Burgess who’s modelling exactly matches
Your comparison of actual v. model forecast temperatures of the tropical upper troposphere is interesting, and I have a few comments to make:
1. To what extent is the excess warming of the model output caused by incorrect assumptions about the anthropogenic CO2 emissions, i.e. dis the models assume emissions would follow the 2015 Paris Accord trajectory, or would rise exponentially, or were actual emissions retrospectively programmed into the predictions?
2. You write: “climate models suggest that the strongest warming response the climate system has to increasing anthropogenic greenhouse gas (GHG) emissions (mainly CO2 from fossil fuel burning) is in the tropical upper troposphere. This produces the model-anticipated ‘tropical hotspot'” I am unaware of such a prediction. We are only seeing predicted increases on 0.2 to 0.5ºC per decade from 1979. The largest predicted warming is at the surface in the Arctic region (as predicted by GS Callender in 1938), and the latest map (released today) shows up to 5ºC of warming from average 1951-1980 averages in some parts of the Arctic. See https://berkeleyearth.org . The same site shows average surface temperatures (the normal yardstick for judging global warming) highest in 2024, followed by 2025 with 2023 third highest, despite the lack of an El Niño in 2025.
3. What is the lower boundary of the “tropical upper troposphere”? You will doubtless be aware that the tropical tropopause typically extends above 100 hPa or about 17 Km, with a temperature of -90 to -80ºC. Above 500 Pa the humidity mixing ratio is generally below 1 gram per Kg of dry air, so water vapour makes little contribution to the greenhouse effect in the upper troposphere, even in the tropics.
4. You state “While the deep oceans represent the largest reservoir of heat energy storage in the climate system during warming, that signal is exceedingly small (hundredths of a degree C per decade) and so its uncertainty is rather large from an observational standpoint.” But data published today by Carbon Brief shows “The year 2025 was the warmest on record for the heat content of the world’s oceans. Ocean heat content (OHC) increased by around 500 zettajoules – billion trillion joules – since the 1940s.
“The heat increase in 2025 alone compared to 2024 – about 23 zettajoules – is around 39 times as much as the total energy produced by all human activities on Earth in 2023 (the latest year in which global primary energy statistics are available). It was also the largest increase in ocean heat content since 2017 (following the strong El Niño event of 2016).
“Human-emitted greenhouse gases trap extra heat in the atmosphere. While some of this warms the Earth’s surface, the vast majority – around of 93% – goes into the oceans. About two-thirds of this accumulates in the top 700 metres, but some also ends up in the deep oceans.” See https://www.carbonbrief.org/state-of-the-climate-2025-in-top-three-hottest-years-on-record-as-ocean-heat-surges/?utm_source=cbnewsletter&utm_medium=email&utm_term=2026-01-15&utm_campaign=Daily+Briefing+NASA+avoids+climate+reference+China+car+sales+to+cool+BP+takes+green+hit+ . The site shows a graph of Ocean Heat Content, published by “Cheng et al” at the Chinese Institute for Atmospheric Physics.
Sorry, a few typos in the above.
Line 5: “I.e. Do the models …”
Line 17 “warming from 1951-1980 averages”
Line 25, for 500 Pa read 500 hPa.
And my paragraph breaks have not been made.
1/16: What’s causing Colorado’s crazy warm and dry winter? And what is climate change’s role?
https://www.tiktok.com/@weatherchris/video/7595994271501602103?_r=1&_t=ZP-937yEr2ZPaQ
whatever the climate, we know have on record decades upon decades of erroneous predictions
and not a single iota of interest in addressing the problem
Spencer’s characterization that “While the deep oceans represent the largest reservoir of heat energy storage in the climate system during warming, that signal is exceedingly small (hundredths of a degree C per decade) and so its uncertainty is rather large from an observational standpoint” is contradicted by the latest peer-reviewed observational analysis of ocean heat content (OHC) presented in this paper: https://link.springer.com/content/pdf/10.1007/s00376-026-5876-0.pdf
The recent study finds that global upper 0-2000m OHC continued to increase in 2025, reaching record levels and showing a statistically robust warming signal well beyond trivial changes.
1/ From 2024 to 2025 the upper 2000m of the ocean gained ~23 ± 8 ZJ (zettajoules) of heat due to changes in Earth’s energy imbalance directly tied to GHG forcing.
2/ Long-term trends in OHC have accelerated from ~0.14 ± 0.03 W/m2 (1960-2025) to ~0.32 ± 0.14 W/m2 (2005-2025).
3/ The continued accumulation of ocean heat is consistent across independent datasets (IAP/CAS, Copernicus Marine, ocean reanalysis products), which substantially reduces the observational uncertainty.
So, ocean heat uptake is neither negligible nor poorly observed, and is consistent with observed Earth energy imbalance. And, because over 90% of excess heat from GHG forcing is a b s o r b e d by the oceans, OHC is a more reliable metric of AGW than surface temperature.
Dyakuyu za vashu uvahu.
1/ There is no valid science to verify “GHG forcing”.
2/ OHC is NOT measured in W/m².
3/ OHC is only evidence that Earth is in a warming trend, as also indicated by UAH Global. Earth is in a natural warming trend.
” OHC is NOT measured in W/m^2. ”
It is absolutely evident that the worldwide renowned lunar motion specialist knows that much better than all people who contributed to the paper Ivanovich linked to:
https://link.springer.com/content/pdf/10.1007/s00376-026-5876-0.pdf
*
As I have explained so often: the ball-on-a-string syndrome is mostly present in people suffering also from the Trump addiction syndrome.
That’s correct Bindi. OHC is NOT measured in “W/m²”. Thanks for quoting me correctly.
That link does get it correct in Fig 1, where the graphs are labeled using Zetta Joules (ZJ). So you’ve proven me right once again.
And you bring up Moon without having a viable model of “orbiting without spin”. Which proves me right yet again, as I repeatedly point out that you’ve got NOTHING.
I never get tired of being right.
Clint, little Bindy Brownshirt doesn’t understand much, that is why they/it/she/him/ze will spend ages on Wikipedia trying to cherry pick any misquote as proof.
Bindy Brownshirt struggles with graphs, struggles with programming, struggles with motion, struggles with… Everything
Just accept the Bindy is swayed by politics rather than facts hence it’s attempt at baiting. Bindy not really worth the time.
Another troglodyte who can’t read:
Op. Cit.
No wonder he’s revealing himself as an anon for Q-related reasons.
Clint R is ignorant to such an extent that he doesn’t even grasp the trivial and fundamental difference between ‘warm’ – expressed in Joule – and ‘warming’ – expressed in Watt/m^2/decade, what is plain correct.
What else could we expect from a 360 degree denier who is not even abkle to accept science backed by Sir Isaac Newton?
*
However, one has to blame here Ivanovich on his wrong pasting of the article’s original, as he forgot to add ‘(10 yr)⁻1 in his post.
Bindi must be working 24/7 trying to find ways to attack me. He’s becoming as obsessed with me as are Willard, Nate, Norman, and Ball4. But, they always end up just proving me right.
In his latest effort, Bindi shows his ignorance of thermodynamics.
* “Warm” is NOT “expressed in Joule”! “Warm” refers to temperature, which is expressed in one of the temperature scales such as Fahrenheit, Celsius, Absolute, etc.
* “Warming” is NOT expressed in “Watt/m^2/decade”! “warming” refers to “heat”, which is the transfer of thermal energy from hot to cold. “Heat” has units of “Watts”, or “Joules/sec”.
* “W/m²” is NOT energy, it is “flux”.
Can hardly wait for Bindi to prove me right again. We know it’s coming….
Hey Puffman, riddle me this –
Alabama is finding new ways to criminally charge undocumented immigrants. Federal courts in the state are using a law last applied during the U.S. internment of people of Japanese descent during World War II to charge immigrants who don’t register themselves.
https://www.al.com/news/2026/01/alabama-uses-japanese-internment-era-law-to-charge-immigrants-who-dont-self-register.html
Does that give you warm feelings expressed in whatever units you please?
Joule (J)
The joule is the SI unit of energy, work, and heat.
https://ib-lenhardt.com/kb/glossary/joule
Of course is Joule not the unit for temperature!
Clint R still does not understand the difference between ‘warm’ and ‘warming’. So let’s explain this:
OHC is, as it represents a measured quantity, associated to ‘warm’, something quite different from computed quantities like ‘ocean uptake’, expressed in Joule per time unit per surface unit, e.g. Watt/m^2, which is associated to ‘warming‘.
Finally, a warming trend is the amount of warming per time unit.
*
But anybody discrediting century-old astronomy as ‘astrology’ will never accept being wrong, for sure. S/he will forever keep on the eternal stance:
” And you bring up Moon without having a viable model of “orbiting without spin”. Which proves me right yet again, as I repeatedly point out that you’ve got NOTHING. “
Well you learned the first one, Bindi. Now try for the other two:
* “Warming” is NOT expressed in “Watt/m^2/decade”! “Warming” refers to “heat”, which is the transfer of thermal energy from hot to cold. “Heat” has units of “Watts”, or “Joules/sec”.
* “W/m$#xB2;” is NOT energy, it is “flux”.
What energy imbalance?
Top of the page here:
https://www.drroyspencer.com/2026/01/uah-v6-1-global-temperature-update-for-december-2025-0-30-deg-c/
This one’s on me.
“The data doesn’t matter. We’re not basing our recommendations on the data. We’re basing them on the climate models.”
–Prof. Chris Folland, Hadley Centre for Climate Prediction and Research
Tom Knutson, NOAA/Geophysical Fluid Dynamics Laboratory, Princeton, New Jersey, and Robert Tuleya, Center for Coastal Physical Oceanography, Old Dominion University, Norfolk, Virginia.
I read above without any surprise:
” The UK met office has 80% of their stations which are classified as junk that is a few degree centigrade out. Not only that, but some sites don’t physically exist or located in the sea at low tide.
If the UK is supposed to be a mark of quality then it’s anyone guess at how poor NOAA data is. ”
**
The poster ‘Anon for a reason’ whom I have good reasons to call ‘QAnon’ instead, belongs to the pseudo-skeptic maffia infesting the blog with a permanent mix of discrediting, denigrating and denying anything what does not match their superficial, egomaniacal narrative, but who all never would be able to offer any technical let alone scientific contradiction.
Anyway, a dirty poster insulting others with disgusting bullshit like
” Bindy, as you are the one who loves socialism tell us which colour shirt you would have worn during the 1930. I bet it would have been brown. ”
does not deserve much attention.
**
Thomas Hagedorn helpfully wrote on January 14, 2026 at 10:33 AM:
” Berkeley Earth [BE] just released their annual report on global temperatures for 2025. ”
*
Fair enough, thanks! This hint namely reminded me that BE provides us with not only global temperature time series but also with series restricted to single countries, for example… UK.
*
And a comparison of BE’s UK data to what I obtained out of GHCN daily (whose UK data of course is obtained from the local matador, i.e. Met Office) seems to be a good background to contradict QAnon’s nonsensical claims. (I added Irland aka Eire, as North Irland is included anyway.)
*
BE’s data actually has nearly nothing in common with my GHCN daily evaluation’s data, this for two reasons:
– completely different stations as sources;
– completely different source data evaluation procedures, especially regarding anomaly construction.
*
1. 1900 – 2020
https://drive.google.com/file/d/1R68exw6QiPMdxildCCPbq0MGNTvh30WK/view
Trends in °C / decade
– Jan 1900 – Dec 2020
BE: 0.10 ± 0.01
Bin: 0.09 ± 0.01
– Jan 1950 – Dec 2020
BE: 0.19 ± 0.02
Bin: 0.18 ± 0.02
2. 1978 – 2020
To Berleley Earth’s and my evaluation I have added my evaluation of that part of UAH’s 2.5 degree grid data encompassing UK+Eire. The grid rectangle contains of course some ocean data one could extract by using a very fine land/ocean mask, but I doubt this would change much.
https://drive.google.com/file/d/1Q8KYVf7WCUa1fEvjHJ9fkF8Vy7NEcdNL/view
Trends in °C / decade
– Dec 1978 – Dec 2020
BE: 0.31 ± 0.04
Bin: 0.32 ± 0.04
UAH: 0.16 ± 0.04
– Jan 2000 – Dec 2020
BE: 0.12 ± 0.11
Bin: 0.17 ± 0.10
UAH: 0.30 ± 0.08
Regarding surface data, the trend for the last 25 years is not very significant, as the standard error is simply too high.
However, we still can see that while the anomalies of the lower troposphere increased by a lot, those for the surface of UK and Eire do not. This surface region shows a clearly cooling trend for 2000-2025.
*
By the way, it is for me always amazing to see that the running means of not only two anomaly surface series but also that of the lower troposphere 4 km above show a similar shape at so many places.
Maybe Roy Spencer explains us what this is due to…
*
Final remark: if a layman evaluation of NOAA’s GHCN daily station data shows such a degree of similarity to that of the professional Berkeley Earth team, then the probability that so many Met Office stations (whose data is regularly transmitted to NOAA) are ‘junk’ is quite low.
Correction for the area UK+Eire
The statement
” However, we still can see that while the anomalies of the lower troposphere increased by a lot, those for the surface of UK and Eire do not. This surface region shows a clearly cooling trend for 2000-2025. ”
is incorrect: while the trend for the two sorface series was from 2000 till 2020 (end of Berkeley Earth’s data for UK), the trend for UAH LT was not adapted and remainded till 2025.
Trends in °C / decade
– Jan 2000 – Dec 2020
BE: 0.12 ± 0.11
Bin: 0.17 ± 0.10
UAH: 0.18 ± 0.11
– Jan 2000 – Oct 2025
BE: —
Bin: 0.31 ± 0.10
UAH: 0.30 ± 0.08
Thus, UK+Eire’s area is NOT cooling at the surface.
Monkey Monkey
The Google Drive’s link access mode to
https://drive.google.com/file/d/1Q8KYVf7WCUa1fEvjHJ9fkF8Vy7NEcdNL/view
has been updated.
Sources
Berkeley Earth TMEAN time series for UK
https://berkeley-earth-temperature.s3.us-west-1.amazonaws.com/Regional/TAVG/united-kingdom-TAVG-Trend.txt
GHCN daily
https://www.ncei.noaa.gov/pub/data/ghcn/daily/
UAH 6.1 LT grid
https://vortex.nsstc.uah.edu/data/msu/v6.1/tlt/
Bindy Brownshirt,
You may believe the UK met office is beyond reproach, that is your opinion and isn’t fact because you want to believe it.
Last year one of the max wind speed was recorded at the top of a hill, whereas the requirement like temperature readings are supposed to be aware from any local interference.
You believe in fiction, I prefer a more scientific approach.
Believe it or not, it is still necessary in 2026 to point out that winter weather somewhere on Earth is not inconsistent with global warming:
https://wattsupwiththat.com/2026/01/18/global-warming-deep-freeze-engulfs-parts-of-europe-and-russia/
That would be a very cogent point, except for the fact that alarmists and their allies in the media are quick to blame/attribute every heat wave, every major hurricane, etc on GHG caused climate change. Your observation would be a lot more persuasive for me if you had also pointed out those other observations on WEATHER, not climate. Of course, that would be a full-time job.
Berkeley Earth, who I do respect, is even claiming that the warming of 2023-4, which coincided with El Niño and Hunga-Tunga (?), may indicate a new accelerating level of warming – 2 years results have changed a 275 year trend (BE starts at 1750, somehow).
“alarmists”
https://climateball.net/but-alarmism/
“their allies in the media”
https://climateball.net/but-the-press/
“Your observation would be a lot more persuasive for me”
https://climateball.net/but-damascus/
***
As for our private fund underachiever’s jab at Berkeley:
https://berkeleyearth.org/global-temperature-report-for-2025/
I note also that AMO was fairly strong in the recent “record” warming period. Berkeley Earth described AMO as an important factor in their original research paper over 10 years ago, more important than ENSO. I note also that we are in a period of high solar activity. So, BE thinks, based upon two recent “record” years, that warming may be accelerating? Those years happened to coincide with strong AMO, strong El Niño, and more energy from the sun. Can we wait a few years first, and see where we go from here? I realize that we may be at the point of no return by then, of course. Oh, wait. We have had a lot of those “points of no return.” (Credit to the almost completely wrong forecaster, that eminent forecaster, Al Gole.) Remember what happened after 1998?
“BE thinks, based upon two recent “record” years, that warming may be accelerating?”
Minor point, but the last 3 years are the warmest in the Berkley Earth series as well as in UAH, so it would be three years even if that were the argument, which it is not.
The “acceleration hypothesis” is largely down to a net decrease in aerosol emissions over the past 15 years or so. There has, for decades, been large uncertainty in how much aerosols have been masking GHG warming, so we’re entering a period where there will likely be “unmasking” as the world (mostly China and international shipping) continues to decrease those emissions. If masking has been on the high side of the estimates then the effect will be relatively larger and vice versa.
There’s a good overview of aerosols here:
https://www.carbonbrief.org/explainer-how-human-caused-aerosols-are-masking-global-warming/
In particular the attribution charts and the component uncertainty bounds are illuminating.
Mark B, aerosols can definitely cause global cooling. We see this with conventional volcano eruptions. The bigger the eruption, the more the temperature drops. The science supports that, as sunlight is reflected by particles in the air.
But warming from CO2 is a hoax. There is NO valid science to support it. “Climate science” is unaware of basic radiative physics and thermodynamics, as we constantly observe here.
If marine diesel fuel or the way it was being used caused cooling due to aerosols being created in the atmosphere from So2 (?), why not go back to those prior practices? (See Berkeley Earth’s 2025 Report). These emissions are being released over the ocean, not near populated areas of the earth. Seems like it would be a net positive. It is sort of like geo-engineering (which I generally am skeptical of), except we have already done a real world experiment, to prove how it works. So, we could go back to using “dirty” fuel or power generation practices to produce a positive net result for climate change.
– Asking for a friend.
Thomas,
The biggest part of the aerosol emissions reduction in the last decade and a half are from China. The marine emissions dropped dramatically as well but they’re a smaller component to the total. China cut back aerosol emissions because their air quality was exceedingly bad.
Regardless of the immediate health impact of air pollution, the warming effect of CO2 emissions was larger than the masking effect of aerosols, so continuing prior practice simply makes the issues with future warming more difficult to manage.
The geopolitics of intentional climate geoengineering seems inherently more problematic than the already intractable problem of international cooperation on GHG reduction.
Thanks, Mark. Good point about China. I mentioned marine caused aerosols because BE singled out its reduction in its latest report as one of the causes of the recent warming. When I read it I did question the scale of its effect.
Mark, I am not convinced by the thesis that the cleaner marine combustion and lower Chinese emissions have created a cooling effect that masks CO2 warming. Albedo has actually been trending slightly down. And, apparently, many factors can cause this.
1) marine combustion – any estimate of the scale of this effect? It would have to be on the same order or similar to volcanic eruptions, wouldn’t it?
2) Chinese emissions – I have done a broad analysis of energy sources and uses by country since 1950. The IEA and the EIA have collected some really good and very accessible data on this. China talks a good game on wind and solar but coal is still king there. Doesn’t seem to be any meaningful move away from it. The same for India and many emerging nations that do some manufacturing. Are they installing scrubbers that are significant enough to reduce aerosol forming stuff? Apparently, that is not good enough for many in the west, as we are closing ours.
Dr Spencer,
You wrote : “My personal opinion has always been that the lack of tropical warming is because positive water vapor feedback, the primary positive feedback that amplifies warming in climate models, is too strong.”
Perhaps that’s not the case : https://www.zupimages.net/up/25/08/d69n.png
(For readability, the observation curves are related to the model results and not the other way around.)
Less global heating but more tropospheric amplification. So what ?
The more probable is that the hidden hypothesis of Manabe (a radiative imbalance is resolved solely by translation of the thermal profile) is false and that more CO2 correspond to a smallest tropsoheric lapse rate.
“As most of you know, climate models suggest that the strongest warming response the climate system has to increasing anthropogenic greenhouse gas (GHG) emissions (mainly CO2 from fossil fuel burning) is in the tropical upper troposphere. This produces the model-anticipated “tropical hotspot”.”
This might confuse some people into thinking that amplified warming in the tropical troposphere is a signature of GHG warming. As Roy alludes to later in the piece, the potential issue is about the modeling of moist convection heat transport in the tropics. Tropospheric warming is modeled to occur regardless of the cause of surface warming.
Weird. I just clipped that same segment of text to make the same observation.
That is, the tropical tropospheric hot spot is not “a fingerprint” of GHG induced warming. It’s something that appears in the models regardless of what drives the warming.
Thus we’re back to some combination of model error or bias or observation error or bias accounting for the discrepency.
As Arkady noted previously in the comments it would be helpful to have uncertainty bounds on the observations. It’s curious that Dr Spencer uses an “appeal to uncertainty” for the ocean warming metrics while not addressing uncertainty in the observations that are the actual subject of the post. It also would have been helpful had the individual observation data series trends in the first figure been broken out the same way the individual climate models are to show the spread in observation data sets.
While understanding the desire for conciseness in blogging, the difference between “politicking” and “sciencing” are down to what details are left out.
Mark B says: “…the difference between “politicking” and “sciencing” are [sic] down to what details are left out.”
Also, what misinformation is included, such as “flux is energy”, “fluxes simply adds”, “all infrared is heat”, etc.
Thanks to barry & Mark B for their comment.
Atmosphere doesn’t play role of a warming blanket.
—
https://www.cristos-vournas.com
Any special reason why data for all models are shown separately while the observational data are averaged by class?