My previous post described what I called “smoking gun” evidence of a spurious drift in the NOAA sea surface temperature (SST) product when compared to SSTs from the TRMM satellite Microwave Imager (TMI). The drift seemed to be mostly confined to 2001, almost a ‘step’ jump. The moored buoy validation statistics of the TMI sea surface temperatures from Frank Wentz’s web site (SSMI.com) suggested that the TMI SSTs had good long-term stability.
But 2001 was also the year that the TRMM satellite was boosted into a higher orbit, which concerned me. I asked Frank about the effect of this event on the TMI SSTs (which also come from his web site). Frank couldn’t remember the details, but said he spent quite a bit of time correcting for the altitude change on the retrieved SSTs since the microwave emission of the sea surface depends upon the TMI instrument’s view angle with respect to the local vertical.
I know from our many years of work together on the AMSR-E Science Team that Frank is indeed a careful researcher, yet it seemed like more than a coincidence that the TMI and NOAA sea surface temperatures diverged during the same year as the orbit boost. So, I went back to see what might have caused the problem. I went back and thought about the different ways in which one can compute area averages from satellite data.
To make a long story short, because the orbit boost caused the TMI to be able to “see” to slightly higher latitudes, the way in which individual latitude bands are handled has a significant impact on the resulting temperature anomalies that are computed over time. The previous results I presented were for the 40N to 40S latitude band, which is nominally what the TMI instrument sees today. But before 2001, the latitudinal extent was slightly smaller than it was after 2001.
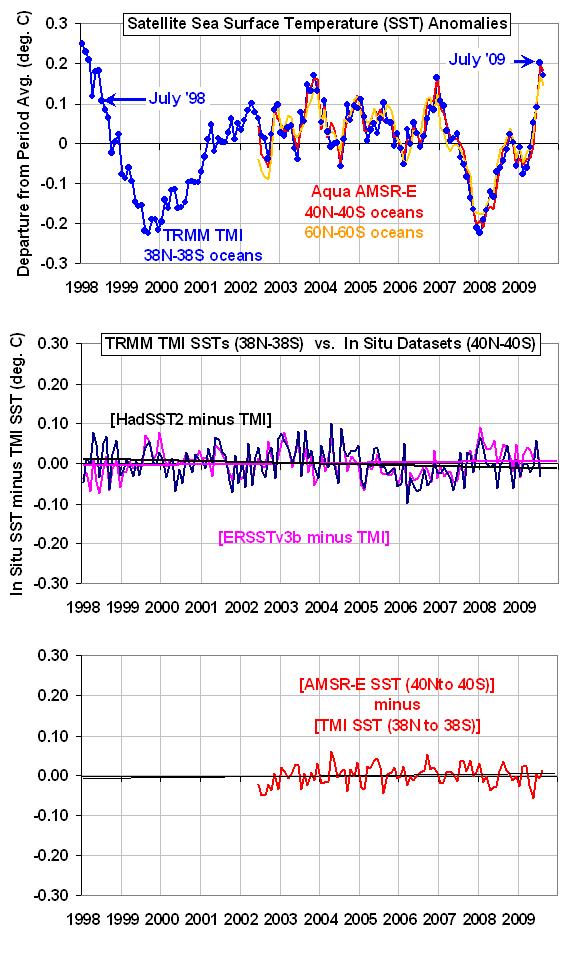
As shown in the following figure, if I restrict the latitude range to 38N to 38S, which was always covered during the entire TRMM mission, I find that the divergence between the TMI and NOAA average SST measurements essentially disappears.
Even though I was processing the NOAA and TMI datasets in the same manner, I should NOT have been. This is because there were not as many gridpoints over cooler SST regions going into the ‘global’ averages before the satellite altitude boost as after the boost. So, for example, one must be very careful in computing a latitude band average, say from 39N to 40N, to make sure that there has been no long-term change in the sampling of that band.
Based upon the above comparisons, I would now say there is no statistically significant difference in the SST trends since 1998 between TMI, the NOAA ERSSTv3b product, and the HadSST2 product. And it does look like July 2009 might well have experienced a warmer SST anomaly than July 1998, as was originally claimed by NOAA. (Remember, TMI can not see all of the global oceans, just equatorward of about 40 deg. N and S latitude.)
In the bottom panel of the above figure, I also have a comparison between the TMI and AMSR-E sea surface temperatures, which are available only since June of 2002 from the Aqua satellite. As can be seen, there is no evidence of a calibration (or sampling) drift in that comparison either.
So, what’s the moral of this story? Always question your results…even after finding the obvious errors. And maybe I should eliminate the term ‘smoking gun evidence’ from any results I describe in the future.
Oh…and don’t believe everything you read on the internet.

 Home/Blog


