This is the first of what might turn into a series of monthly updates of some maritime climate parameters monitored by the AMSR-E instrument on NASA’s Aqua satellite. All monthly statistics have been computed by me from daily global gridpoint data produced and archived by Remote Sensing Systems (RSS) under the direction of Frank Wentz, a member of our U.S. AMSR-E Science Team. Since Aqua was launched in 2002, the data are available only since June, 2002. A description of how these products were derived, and where they reside, is provided here.
There are 5 “ocean products”: sea surface temperature [SST]; near-surface wind speed; vertically-integrated water vapor; vertically integrated cloud water; and rain rate. I will present time series of monthly anomalies averaged over the global, ice-free oceans (56 deg. N to 56 deg. S latitude), and separately for the deep tropics (20 deg. N to 20 deg. S latitude). ‘Anomalies’ are departures from the average seasonal cycles in those parameters, which will be recomputed as each new month of data is added.
GLOBAL OCEANS
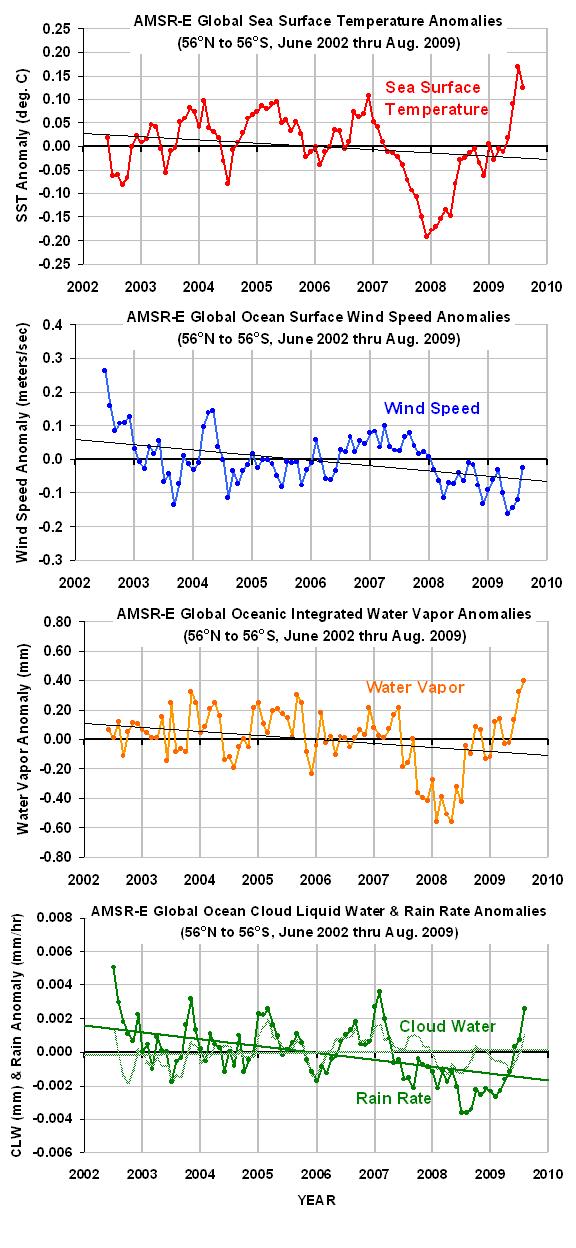
In the first figure below are plotted the 5 ocean products for the global ice free-oceans (56N to 56S). As can be seen in the top panel, SSTs in August cooled slightly from the unusually warm conditions experienced in July.
I have added linear trend lines to each time series, which you are free to misinterpret as you wish. 😉 Since the AMSR-E period of record is only 7.25 years long, a calculated trend won’t have much meaning…although it will be interesting to see how long it takes before the climate system obeys the UN’s command to warm, and the SST trend line begins to go uphill again.
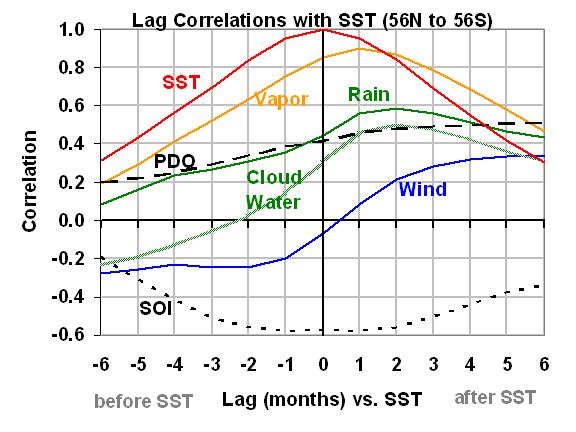
How these different variables change relative to each other is illustrated in the following lag-correlation plot of SST versus the other variables. “PDO” is the Pacific Decadal Oscillation Index, while “SOI” is the Southern Oscillation Index (negative for El Nino, positive for La Nina). A discussion of these curves is provided later, below.
TROPICAL OCEANS
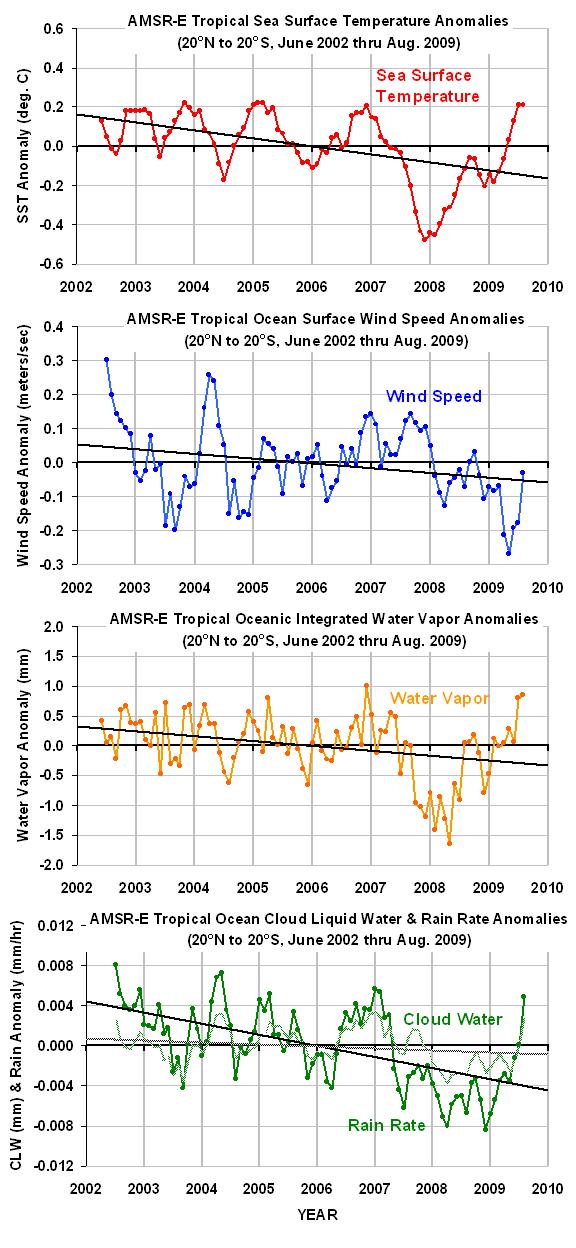
The next figure shows the ocean product anomalies for just the deep tropics, 20N to 20S latitude….
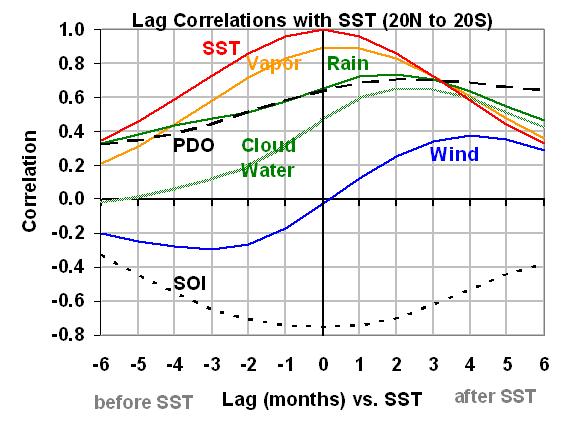
…and the lag correlation plot for the deep tropics is next:
DISCUSSION
Using the 20N-20S lag correlation plot as an example, you can see that total integrated water vapor is highly correlated with SST, which in turn is highly correlated with El Nino conditions (negative SOI values).
Also note that sea surface temperature tends to peak after months of anomalously low wind conditions, then falls as wind speeds increase.
Cloud water and rain rates increase as SST increases, reaching a maximum 1 to 3 months after the SST peaked.

 Home/Blog


