As I work on finishing our forcing/feedback paper for re-submission to Journal of Geophysical Research – a process that has been going on for months now – I keep finding new pieces of evidence in the data that keep changing the paper’s focus in small ways.
For instance, yesterday I realized that NASA Langley has recently updated their CERES global radiative budget measurement dataset through 2008 (it had previously ran from March 2000 through August 2007).
I’ve been anxiously awaiting this update because of the major global cooling event we saw during late 2007 and early 2008. A plot of daily running 91-day global averages in UAH lower tropospheric (LT) temperature anomalies is shown below, which reveals the dramatic 2007-08 cool event.
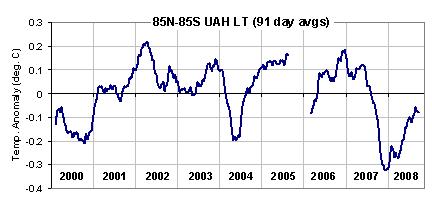
I was especially interested to see if this was caused by a natural increase in low clouds reducing the amount of sunlight absorbed by the climate system. As readers of my blog know, I believe that most climate change – including “global warming” – in the last 100 years or more has been caused by natural changes in low cloud cover, which in turn have been caused by natural, chaotic fluctuations in global circulation patterns in the atmosphere-ocean system. The leading candidate for this, in my opinion, is the Pacific Decadal Oscillation…possibly augmented by more frequent El Nino activity in the last 30 years.
Now that we have 9 years of CERES data from the Terra satellite, we can more closely examine a possible low cloud connection to climate change. The next figure shows the changes in the Earth’s net radiative balance as measured by the Terra CERES system. By “net” I mean the sum of reflected shortwave energy (sunlight), or “SW”, and emitted longwave energy (infrared) or “LW”.
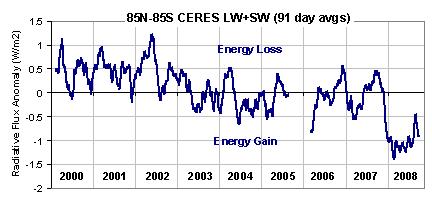
The changes in the radiative balance of the Earth seen above can be thought of conceptually in terms of forcing and feedback, which are combined together in some unknown proportion that varies over time. Making the interpretation even more uncertain is that some proportion of the feedback is due not only to radiative forcing, but also to non-radiative forcing of temperature change.
So the variations we see in the above chart is the combined result of three processes: (1) radiative forcing (both internal and external), which can be expected to cause a temperature change; (2) radiative feedback upon any radiatively forced temperature changes; and (3) radiative feedback upon any NON-radiatively forced temperature changes (e.g., from tropical intraseasonal oscillations in rainfall). It turns out that feedback can only be uniquely measured in response to NON-radiatively forced temperature changes, but that’s a different discussion.
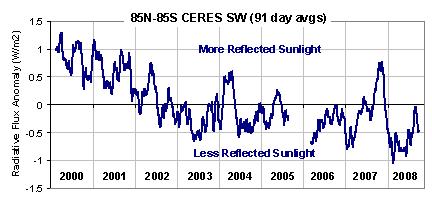
The SW component of the total flux measured by CERES looks like this…note the large spike upward in reflected sunlight coinciding with the late 2007 cooling:
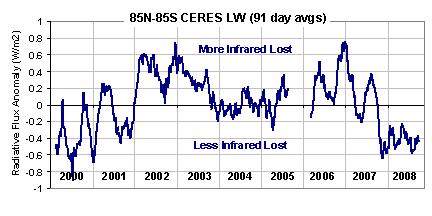
And here’s the LW (infrared) component…note the very low emission late in 2007, a portion of which must be from the colder atmosphere emitting less infrared radiation.
As I discuss at length in the paper I am preparing, the physical interpretation of which of these 3 processes is dominant is helped by drawing a phase space diagram of the Net (LW+SW) radiative flux anomalies versus temperature anomalies (now shown as monthly running 3-month averages), which shows that the 2007-08 cooling event has a classic radiative forcing signature:
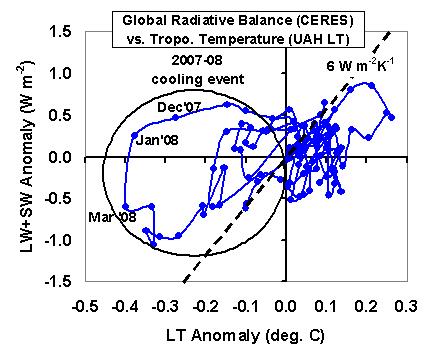
The spiral (or loop) pattern is the result of the fact that the temperature response of the ocean lags the forcing. This is in contrast to feedback, a process for which there is no time lag. The dashed line represents the feedback I believe to be operating in the climate system on these interannual (year-to-year) time scales, around 6 W m-2 K-1 as we published in 2007…and as Lindzen and Choi (2009) recently published from the older Earth Radiation Budget Satellite data.
The ability to separate forcing from feedback is crucial in the global warming debate. While this signature of internal radiative forcing of the 2007-08 event is clear, it is not possible to determine the feedback in response to that temperature change – it’s signature is overwhelmed by the radiative forcing.
Since the fluctuations in Net (LW+SW) radiative flux are a combination of forcing and feedback, we can use the tropospheric temperature variations to remove an estimate of the feedback component in order to isolate the forcing. [While experts will questions this step, it is entirely consistent with the procedures of Forster and Gregory (2006 J. Climate) and Forster and Taylor (2006 J. of Climate), who subtracted known radiative forcings from the total flux to isolate the feedback].
The method is simple: The forcing equals the Net flux minus the feedback parameter (6 W m-2 K-1) times the LT temperature variations shown in the first figure above. The result looks like this:
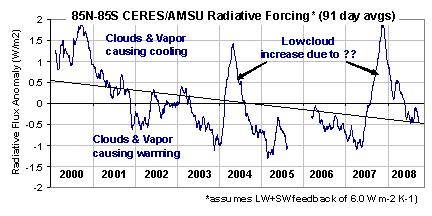
What we see are 3 major peaks in radiant energy loss forcing the system: in 2000, 2004, and late 2007. If you look at the features in the separate SW and LW plots above, it is obvious the main signature is in the SW…probably due to natural increases in cloud cover, mostly low clouds, causing internal radiative forcing of the system
If we instead assume a much smaller feedback parameter, say in the mid-range of what the IPCC models exhibit, 1.5 W m-2 K-1, then the estimate of the radiative forcing looks like this:
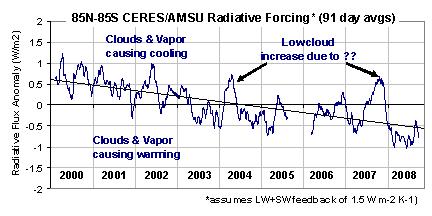
Note the trend lines in either case show a net increase of at least 1 W m-2 in the radiant energy entering the climate system. The anthropogenic greenhouse gas component of this would be (I believe) about 0.4 W m-2, or a little less that half. I’ll update this if someone gives me a better estimate.
So, what might all of this mean in the climate debate? First, nature can cause some pretty substantial forcings…what if these occur on the time scales associated with global warming (decades to centuries)?
But what is really curious is that the 9-year change in radiative forcing (warming influence) of the system seen in the last two figures is at least TWICE that expected from the carbon dioxide component alone, and yet essentially no warming has occurred over that period (see first illustration above). How could this be, if the climate system is as sensitive as the IPCC claims it to be?

 Home/Blog


