YR MON GLOBE NH SH TROPICS
2009 1 +0.304 +0.443 +0.165 -0.036
2009 2 +0.347 +0.678 +0.016 +0.051
2009 3 +0.206 +0.310 +0.103 -0.149
2009 4 +0.090 +0.124 +0.056 -0.014
2009 5 +0.045 +0.046 +0.044 -0.166
2009 6 +0.003 +0.031 -0.025 -0.003
2009 7 +0.411 +0.212 +0.610 +0.427
2009 8 +0.229 +0.282 +0.177 +0.456
2009 9 +0.424 +0.554 +0.295 +0.516
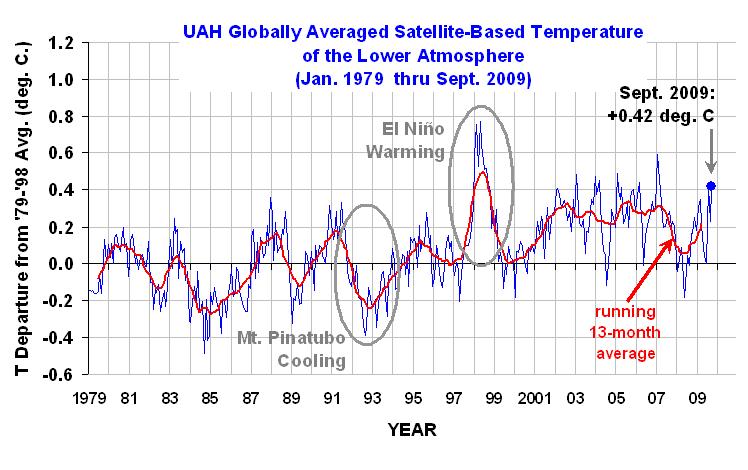
The global-average lower tropospheric temperature anomaly in September 2009 rebounded again, from +0.23 deg. C in August to +0.42 deg. C in September. The tropics and Northern Hemisphere continue to dominate the signal.
NOTE: For those who are monitoring the daily progress of global-average temperatures here, we are still working on switching from NOAA-15 to Aqua AMSU, which will provide more accurate tracking on a daily basis. We will be including both our lower troposphere (LT) and mid-tropospheric (MT) pre-processing of the data. We have added the global sea surface temperature anomalies from the AMSR-E instrument on board the NASA Aqua satellite, computed from files at Remote Sensing Systems, although we are still not done adjusting the display range of those data.

 Home/Blog


