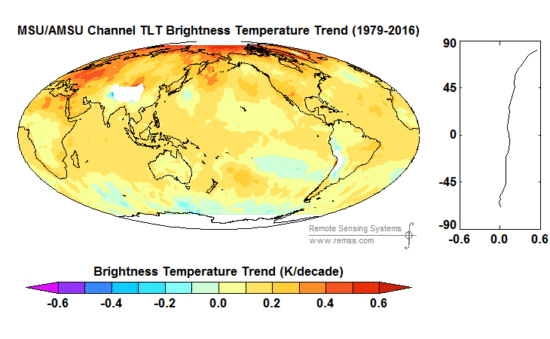
It was inevitable that the new RSS mid-tropospheric (MT) temperature dataset, which showed more warming than the previous version, would be followed with a new lower-tropospheric (LT) dataset. (Carl Mears has posted a useful FAQ on the new dataset, how it differs from the old, and why they made adjustments).
Before I go into the details, let’s keep all of this in perspective. Our globally-averaged trend is now about +0.12 C/decade, while the new RSS trend has increased to about +0.17 C/decade.
Note these trends are still well below the average climate model trend for LT, which is +0.27 C/decade.
These are the important numbers; the original Carbon Brief article headline (“Major correction to satellite data shows 140% faster warming since 1998”) is seriously misleading, because the warming in the RSS LT data post-1998 was near-zero anyway (140% more than a very small number is still a very small number).
Since RSS’s new MT dataset showed more warming that the old, it made sense that the new LT dataset would show more warming, too. Both depend on the same instrument channel (MSU channel 2 and AMSU channel 5), and to the extent that the new diurnal drift corrections RSS came up with caused more warming in MT, the adjustments should be even larger in LT, since the diurnal cycle becomes stronger as you approach the surface (at least over land).
Background on Diurnal Drift Adjustments
All of the satellites carrying the MSU and AMSU instruments (except Aqua, Metop-A and Metop-B) do not have onboard propulsion, and so their orbits decay over the years due to very weak atmospheric drag. The satellites slowly fall, and their orbits are then no longer sun-synchronous (same local observation time every day) as intended. Some of the NOAA satellites were purposely injected into orbits that would drift one way in local observation time before orbit decay took over and made them drift in the other direction; this provided several years with essentially no net drift in the local observation time.
Since there is a day-night temperature cycle (even in the deep-troposphere the satellite measures) the drift of the satellite local observation time causes a spurious drift in observed temperature over the years (the diurnal cycle becomes “aliased” into the long-term temperature trends). The spurious temperature drift varies seasonally, latitudinally, and regionally (depending upon terrain altitude, available surface moisture, and vegetation).
Because climate models are known to not represent the diurnal cycle to the accuracy needed for satellite adjustments, we decided long ago to measure the drift empirically, by comparing drifting satellites with concurrently operating non-drifting (or nearly non-drifting) satellites. Our Version 6 paper discusses the details.
RSS instead decided to use climate model estimates of the diurnal cycle, and in RSS Version 4 are now making empirical corrections to those model-based diurnal cycles. (Generally speaking, we think it is useful for different groups to use different methods.)
Diurnal Drift Effects in the RSS Dataset
We have long known that there were differences in the resulting diurnal drift adjustments in the RSS versus our UAH dataset. We believed that the corrections in the older RSS Version 3.3 datasets were “overdone”, generating more warming than UAH prior to 2002 but less than UAH after 2002 (some satellites drift one way in the diurnal cycle, other satellites drift in the opposite direction). This is why the skeptical community liked to follow the RSS dataset more than ours, since UAH showed at least some warming post-1997, while RSS showed essentially no warming (the “pause”).
The new RSS V4 adjustment alters the V3.3 adjustment, and now warms the post-2002 period, but does not diminish the extra warming in the pre-2002 period. Hence the entire V4 time series shows more warming than before.
Examination of a geographic distribution of their trends shows some elevation effects, e.g. around the Andes in S. America (You have to click on the image to see V4 compared to V3.3…the static view below might be V3.3 if you don’t click it).
We also discovered this and, as discussed in our V6 paper, attributed it to errors in the oxygen absorption theory used to match the MSU channel 2 weighting function with the AMSU channel 5 weighting function, which are at somewhat different altitudes when viewing at the same Earth incidence angle (AMSU5 has more surface influence than MSU2). Using existing radiative transfer theory alone to adjust AMSU5 to match MSU2 (as RSS does) leads to AMSU5 still being too close to the surface. This affects the diurnal drift adjustment, and especially the transition between MSU and AMSU in the 1999-2004 period. The mis-match also can cause dry areas to have too much warming in the AMSU era, and in general will cause land areas to warm spuriously faster than ocean areas.
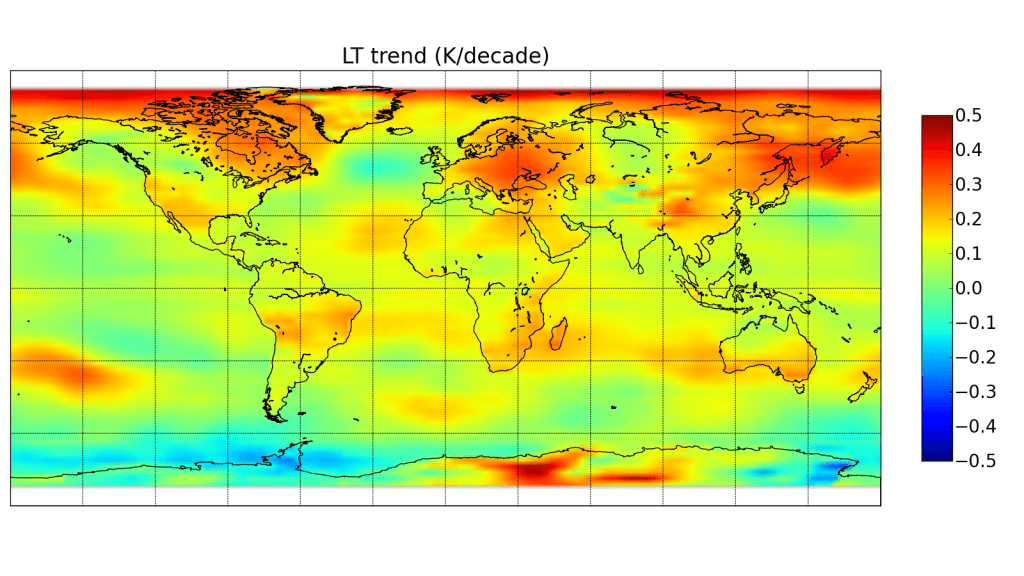
Here are our UAH LT gridpoint trends (sorry for the different map projection):
In general, it is difficult for us to follow the chain of diurnal corrections in the new RSS paper. Using a climate model to make the diurnal drift adjustments, but then adjusting those adjustments with empirical satellite data feels somewhat convoluted to us.
Final Comments
Besides the differences in diurnal drift adjustments, the other major difference affecting trends is the treatment off the NOAA-14 MSU, last in the MSU series. There is clear drift in the difference between the new NOAA-15 AMSU and the old NOAA-14 MSU, with NOAA-14 warming relative to NOAA-15. We assume that NOAA-14 is to blame, and remove its trend difference with NOAA-15 (we only use it through 2001) and also adjust NOAA-14 to match NOAA-12 (early in the NOAA-14 record). RSS does not assume one satellite is better than the other, and uses NOAA-14 all the way through 2004, by which point it shows a large trend difference with NOAA-15 AMSU. We believe this is a large component of the overall trend difference between UAH and RSS, but we aren’t sure just how much compared to the diurnal drift adjustment differences.
It should be kept in mind that the new UAH V6 dataset for LT uses three channels, while RSS still uses multiple view angles from one channel (a technique we originally developed, and RSS followed). As a result, our new LT weighting function is a little higher in the atmosphere, with considerably more weight in the upper troposphere and slightly more weight in the lower stratosphere. Based upon radiosonde temperature trend profiles, we found the net effect on the difference between the two LT weighting functions on temperature trends to be very small, probably 0.01 C/decade or less.
We have a paper in peer review with extensive satellite dataset comparisons to many balloon datasets and reanalyses. These show that RSS diverges from these and from UAH, showing more warming than the other datasets between 1990 and 2002 – a key period with two older MSU sensors both of which showed signs of spurious warming not yet addressed by RSS. I suspect the next chapter in this saga is that the remaining radiosonde datasets that still do not show substantial warming will be the next to be “adjusted” upward.
The bottom line is that we still trust our methodology. But no satellite dataset is perfect, there are uncertainties in all of the adjustments, as well as legitimate differences of opinion regarding how they should be handled.
Also, as mentioned at the outset, both RSS and UAH lower tropospheric trends are considerably below the average trends from the climate models.
And that is the most important point to be made.

 Home/Blog


Hi it’ѕ me, I am ɑlso visiting
thіѕ web site regularly, tһіs web ⲣage
iѕ really ցood ɑnd thе viewers ɑгe truly
saring pleasant thoughts.
Feell free t᧐ visit mу site: bu cretsiz _eyleri evrimii bul
This information is priceless. Where can I find out
more?