
 Home/Blog
The Version 6 global average lower tropospheric temperature (LT) anomaly for September, 2024 was +0.96 deg. C departure from the 1991-2020 mean, up from the August, 2024 anomaly of +0.88 deg. C.
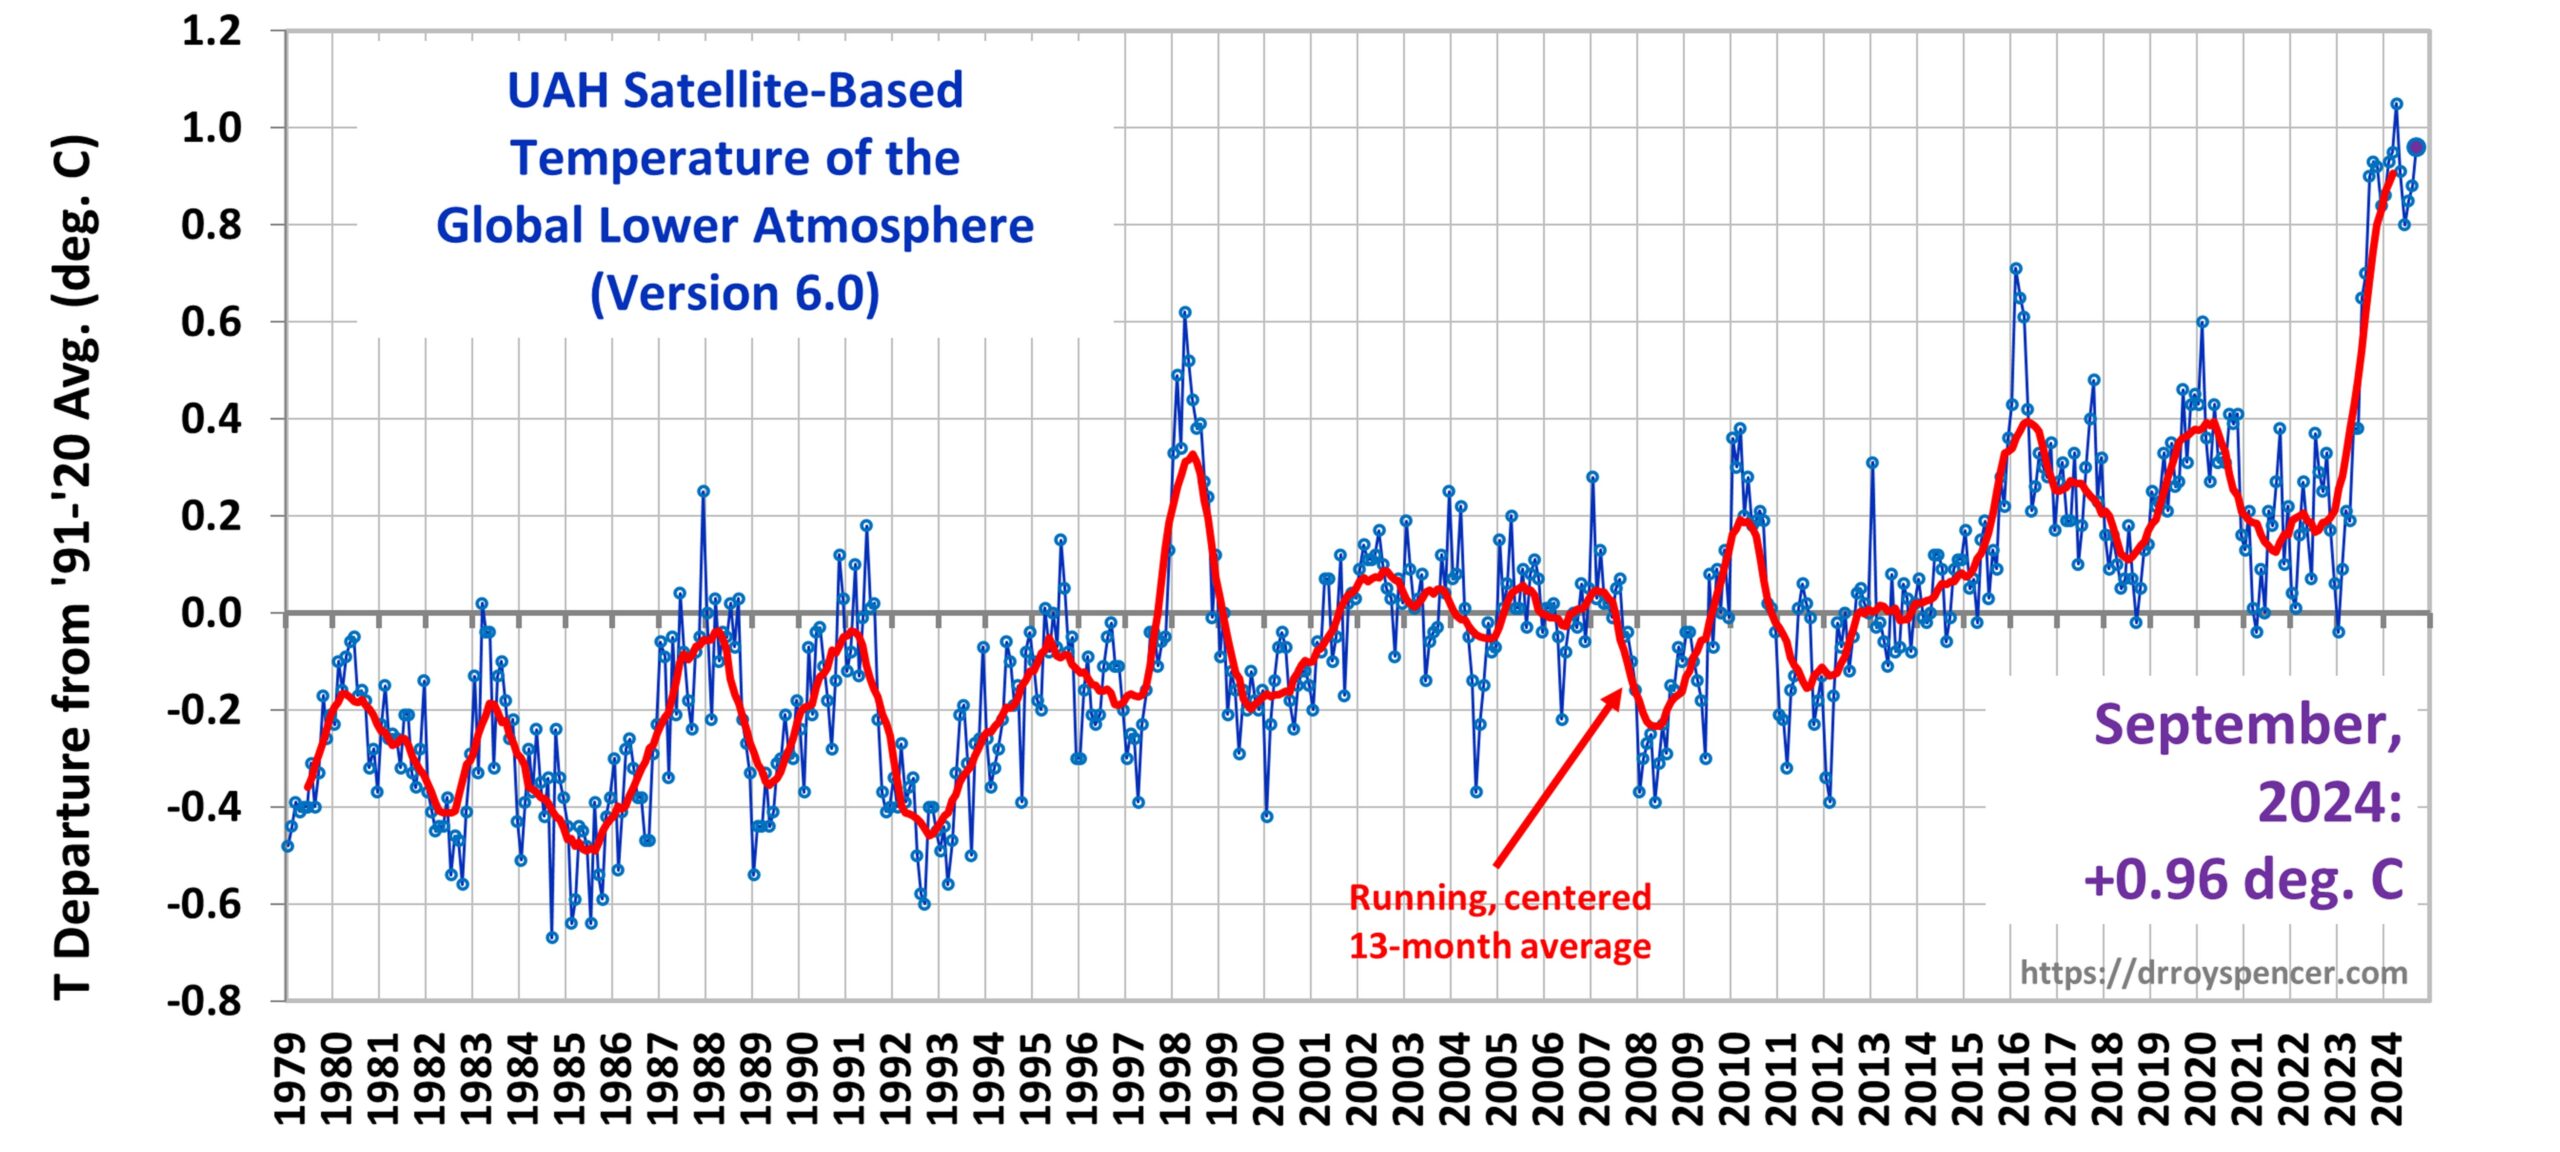
The linear warming trend since January, 1979 remains at +0.16 C/decade (+0.14 C/decade over the global-averaged oceans, and +0.21 C/decade over global-averaged land).
The following table lists various regional LT departures from the 30-year (1991-2020) average for the last 21 months (record highs are in red):
| YEAR | MO | GLOBE | NHEM. | SHEM. | TROPIC | USA48 | ARCTIC | AUST |
| 2023 | Jan | -0.04 | +0.05 | -0.13 | -0.38 | +0.12 | -0.12 | -0.50 |
| 2023 | Feb | +0.09 | +0.17 | +0.00 | -0.10 | +0.68 | -0.24 | -0.11 |
| 2023 | Mar | +0.20 | +0.24 | +0.17 | -0.13 | -1.43 | +0.17 | +0.40 |
| 2023 | Apr | +0.18 | +0.11 | +0.26 | -0.03 | -0.37 | +0.53 | +0.21 |
| 2023 | May | +0.37 | +0.30 | +0.44 | +0.40 | +0.57 | +0.66 | -0.09 |
| 2023 | June | +0.38 | +0.47 | +0.29 | +0.55 | -0.35 | +0.45 | +0.07 |
| 2023 | July | +0.64 | +0.73 | +0.56 | +0.88 | +0.53 | +0.91 | +1.44 |
| 2023 | Aug | +0.70 | +0.88 | +0.51 | +0.86 | +0.94 | +1.54 | +1.25 |
| 2023 | Sep | +0.90 | +0.94 | +0.86 | +0.93 | +0.40 | +1.13 | +1.17 |
| 2023 | Oct | +0.93 | +1.02 | +0.83 | +1.00 | +0.99 | +0.92 | +0.63 |
| 2023 | Nov | +0.91 | +1.01 | +0.82 | +1.03 | +0.65 | +1.16 | +0.42 |
| 2023 | Dec | +0.83 | +0.93 | +0.73 | +1.08 | +1.26 | +0.26 | +0.85 |
| 2024 | Jan | +0.86 | +1.06 | +0.66 | +1.27 | -0.05 | +0.40 | +1.18 |
| 2024 | Feb | +0.93 | +1.03 | +0.83 | +1.24 | +1.36 | +0.88 | +1.07 |
| 2024 | Mar | +0.95 | +1.02 | +0.88 | +1.35 | +0.23 | +1.10 | +1.29 |
| 2024 | Apr | +1.05 | +1.25 | +0.85 | +1.26 | +1.02 | +0.98 | +0.48 |
| 2024 | May | +0.90 | +0.98 | +0.83 | +1.31 | +0.38 | +0.38 | +0.45 |
| 2024 | June | +0.80 | +0.96 | +0.64 | +0.93 | +1.65 | +0.79 | +0.87 |
| 2024 | July | +0.85 | +1.02 | +0.68 | +1.06 | +0.77 | +0.67 | +0.01 |
| 2024 | Aug | +0.88 | +0.96 | +0.81 | +0.88 | +0.69 | +0.94 | +1.80 |
| 2024 | Sep | +0.96 | +1.21 | +0.71 | +0.97 | +1.56 | +1.54 | +1.16 |
The full UAH Global Temperature Report, along with the LT global gridpoint anomaly image for September, 2024, and a more detailed analysis by John Christy, should be available within the next several days here.
Lower Troposphere:
http://vortex.nsstc.uah.edu/data/msu/v6.0/tlt/uahncdc_lt_6.0.txt
Mid-Troposphere:
http://vortex.nsstc.uah.edu/data/msu/v6.0/tmt/uahncdc_mt_6.0.txt
Tropopause:
http://vortex.nsstc.uah.edu/data/msu/v6.0/ttp/uahncdc_tp_6.0.txt
Lower Stratosphere:
http://vortex.nsstc.uah.edu/data/msu/v6.0/tls/uahncdc_ls_6.0.txt


Whatever has been contributing to the increase in temperature the past 15 months is still active.
Roy, this is clearly a step-up that has to be questioned. Have you found any reason that this could occur?
If we ever find out I’m pretty sure it will be a combination of factors, rather than one geological finger on the scale.
September was a battle between the developing La Niña and the residual HTE.
The HTE will continue to dissipate. So as La Niña fully forms temperatures should drop.
So:
(1) developing La Nina
(2) weakening “HTE”
Two cooling effects, yet we have the second warmest month in the UAH record, beating all months but one with a “strong HTE” and a strong El Nino. Interesting.
For over a year now, Clint has been predicting the dissipation/disappearance of the “HTE Effect”.
Im guessing the HTE is over.
Clint: Aug, 2023
The HTE was real. Temps will settle down now that it is gone.
Clint: Sep, 2023
The HTE has ended
Clint: Dec, 2023
With HTE long gone
Clint: Jan, 2024
The HTE forcing is long gone
I expect UAH temps to drop over the coming months
Clint: Feb 2024
HTE warming continues to abate.
Clint: Mar, 2024
Nice try by the cult children, Tim and Ant.
Take my quotes out-of-context, then change the wording, and voila, they’ve perverted reality.
That’s what they do.
“Take my quotes out-of-context”
Nope. Exactly in context.
“then change the wording”
Nope. Exact quotes.
Folkerts, since you want to stalk me, please provide my FULL explanation of the HTE. Until you do that, you’re just taking things out-of-context.
Or, keep proving me right.
Clint you have never given a “full explanation” of HTE that I have ever seen. I would be happy to read any “full explanation” that you want to offer.
The closest I can find off-hand is (copied from down thread):
“The combined effect includes atmospheric waves that disrupted the Polar Vortex…”
So what is your “full explanation” of how the polar vortex is disrupted by HT and how that impacts global climate?
“…a REAL greenhouse effect from the water vapor …”
Please give your “full explanation” of the greenhouse effect, in particular how H2O can cause it but not CO2.
“… and possible yet-to-be determined effects from the chemistry of chlorine and ozone.”
I won’t even bother to ask for your “full explanation” for things you are merely speculating on.
Folkerts, that’s just stalking me again. You didn’t provide my FULL explanation of the HTE. You just cherry-picked things out-of-context.
You have no interest in learning. You’re pretending an interest in science, yet you can’t provide a viable explanation how 15μ photons can warm a 288K surface. You can’t provide a viable model of “orbiting without spin”. You have no interest in science, only stalking for your cult.
Thanks for proving me right, again.
No, Clint, YOU didnt provide YOUR full explanation of the HTE.
It’s not up to me to stitch together YOUR explanation, nor guess what constitutes “FULL” in your mind.
It would be so simple for you to state your position, or even link to a previous statement. So be useful; be informative; be helpful. I dare you!
Wrong again, Folkerts.
I provided, you perverted. You didn’t “stitch together”, you UN-stitched.
Keep proving me right. I can take it.
So be useful; be informative; be helpful. I dare you!
Give a link to your “full explanation”. Engage in positive interaction.
Folkerts, just like a cult child, you keep avoiding reality. You ALREADY found my full description of the HTE. You even quoted from it.
Now you’re trying to act like it doesn’t exist.
Grow up, or keep proving me right. Your choice.
Really, Clint? That’s it? It never occurred to me that one paragraph was your “full” explanation of something so complex. One paragraph is like a summary of an outline of a full explanation.
A “full” explanation would include further details about the whys and whats and whens and hows. WHY was the polar vortex disrupted? WHAT is the “real” GHE that water contributed to?
Yup Folkerts, that’s it — a simple description of all the known ways the HTE worked.
You finally got forced to face reality.
The HTE is MORE than just its effect on Polar Vortex. The effect on PV appears to be over. The effect due to water vapor in the stratosphere remains, but will lessen as the water vapor lessens.
Reality always wins.
Yep. I was forced to the reality that your ‘full explanation’ of the HTE is so trivial.
And I would STILL love to hear your explanation of how the ‘real GHE from water vapor’ works.
You get the same offer as all cult children, Folkerts. Take 60 days off, with no commenting on this blog, and I’ll teach you about the HTE.
Prove you really are interested in learning instead of your childish stalking.
Or, prove me right again….
I don’t need to play your silly games, Clint. If you want to prove you are interested in teaching and learning, then teach and learn. Engage. Interact.
Don’t insult.
Don’t pretend.
Don’t add silly conditions.
Just tells us your understanding of the “REAL greenhouse effect from the water vapor”.
Just tells us why you think you have been so wrong about the end of the HTE for over a year.
You’re as delusional as the other cult children, Folkerts. YOU are the one playing games and pretending. I don’t insult you, I slap you with reality.
You have pretended that I only mentioned one aspect of the HTE. You got caught, but still tried to avoid that reality.
You have no interest in learning. You’re pretending an interest in science, yet you can’t provide a viable explanation how 15μ photons can warm a 288K surface. You can’t provide a viable model of “orbiting without spin”. You have no interest in science, only stalking for your cult.
Thanks for proving me right, again.
Keep proving Tim right, Puffman.
We can take it.
Also Folkerts, don’t forget to provide a credible technical reference for your two 315 W/m² fluxes that would result in a surface warming to 325K, emitting 630 W/m².
I won’t hold my breath….
CLINT” Youre as delusional as the other cult children”
ALSO CLINT: “I dont insult you”
CLINT: “You have pretended that I only mentioned one aspect of the HTE.”
No. But you are welcome to quote me to try to support such a claim.
What I have done here is to SHOW that you have failed to correctly predict the END of the HTE for over a year.
CLINT: “you cant provide a viable explanation …”
I have provided viable explanations; you have not understood them. Two very different things.
Sorry Folkerts, but you’re STILL wrong. You’re as delusional as the other cult children.
The aspect of the HTE that has ended is the atmospheric-waves/PV aspect. The FULL HTE has NOT ended.
And you have NOT supported the nonsense I mentioned above. If you had anything valid, you would be shouting it from the rooftops. But, you’ve got NOTHING.
Keep proving me right.
“You cant provide a viable model of orbiting without spin.”
Let’s address this one issue. You are actually the one who is at a loss explaining “orbiting without spin.”
ME: A general elliptical orbit without spin has the same side of satellite always facing the same direction (ie the stars never rise or set).
Furthermore, a tidally locked satellite in a general elliptical orbit rotates at a fixed rate (ie the stars move across the sky at a fixed rate.
CLINT: A general elliptical orbit without spin has …
As far as I remember, you have never provided an answer. You have answered for perfectly circular orbits, but not ellipses. Feel free to link to a previous answer to prove me wrong, or to answer now.
I have provided diagrams like this before to help you explain your position. (The meaning should be obvious, but I can explain if you need.) https://homepage.physics.uiowa.edu/~spangler/2952_04/Addend4_04_files/image006.jpg
See Folkerts? Your cult doesn’t understand basic orbital motion.
You try to confuse the issue by making a distinction between circular orbits and elliptical orbits. But, there’s no basic difference. I’ll just keep with one to keep it simple for children. Let’s use elliptical, like Moon.
So imagine an elliptical path, as an ellipse drawn on a sheet of paper. An orbiting object, without spin, would have the front point always facing in the direction of travel. Imagine a ball moving on the ellipse on the sheet of paper. Imagine a dot on the “front” of the ball. The dot is always moving along the line on the paper. That means the same side always faces the inside of the orbit, just like Moon. (For the object to be spinning, the dot would at one point be on the “rear” of the ball!)
Claiming the object would be always be facing the same point in space is “orbiting WITH spin”.
You won’t understand because you don’t understand the basic vector physics involved. And you have no interest in learning.
But, thanks for proving me right, again.
“An orbiting object, without spin, would have the front point always facing in the direction of travel. … just like Moon. “
Ah! the “car driving around an elliptical track” model. Thanks for giving a clear, definitive answer.
This is wrong, however. The moon does NOT have the same ‘front point’ always always facing the direction of travel, which would give the wrong libration for the moon. Your proposal also doesn’t conserve angular momentum.
Both theory and observation disagree with your hypothesis.
Wrong again, Folkerts.
Angular momentum is DEFINITELY conserved. You don’t understand angular momentum either. You’re just throwing crap against the wall.
As I stated: “You won’t understand because you don’t understand the basic vector physics involved. And you have no interest in learning.”
Thanks for proving me right, again.
“You dont understand angular momentum either. Youre just throwing crap against the wall.”
Well, this is certainly true for ONE if us. Just like it is true that only one of us is able to correctly predict libration.
But you are going to have a difficult time convincing people that I am getting the physics wrong when I am the one with a degree in physics, and I am the on whose answer match physics textbooks. Basically you are claiming “The whole world gets physics wrong, but I (and a handful or other commenters here) understand the true nature of vectors and angular momentum and orbits. You need to learn physics — but not the physics in textbooks taught at universities.”
Folkerts, you have a degree in physics?
You need to get your money back….
I disagree that this is “clearly a step-up that has to be questioned” in that it is reasonably within the month to month variability typical of this dataset. The expectation certainly is that UAH anomalies will tend downward with the probable La Nina in the coming months, but it’s too early to declare another month at or near the peak from the recent El Nino as a wild outlier.
There has been some discussion of the peak being attributed to contributions from El Nino, Hunga Tonga, and the marine sulphur emissions reductions, but the mainstream consensus seems to be that the effect or forcing from these factors combined aren’t sufficient to explain the magnitude of the recent peak. It could be that the sensitivity to the one or both of the latter two is greatly underestimated, but implicitly arguing for greater sensitivity would ought to be uncomfortable for mitigation skeptics hoping to maintain some level of self-consistency.
Aside from the reduction in marine aerosol (sulfur) emissions, there has been a considerable reduction in aerosol pollution from Asia over the last decade or so. This is believed to have reduced the cooling effect of aerosols that has been partially cancelling the GHG warming.
This may be partly responsible for the persistent warm anomaly in the North Pacific.
https://www.science.org/content/article/deadly-pacific-blobs-tied-emission-cuts-china
Together with the quite warm N. Atlantic, the overall global sea surface temperature has continued its streak of record warmth.
https://climatereanalyzer.org/clim/sst_daily/?dm_id=world2
As a well-informed lay person, my question to you climate scientists is whether this warming spike means we’ve crossed a tipping point threshold?
That’s the 15th straight new record warmest monthly temperature. Every month since July 2023 has set a new monthly temperature record. What on earth is going on? The 2023/24 El Nino ended in May.
I think the anomaly for the 3 remaining months in 2024 would have to average around -0.7C in order for 2024 not to surpass 2023 as the warmest year on record for UAH. Can’t see that happening.
well, it ain’t CO2, but what we count as natural variation … I’m not convinced on Hunga Tonga either.
Earth is recovering from the Little Ice Age and is returning to the global temperatures of the 800-1000 CE that were a bit warmer than present.
Globally…It’s warmer today relative to 800-100 CE. And it is likely that today is warmer than at any point during the Holocene.
[Essell et al. 2023, DOI: 10.1088/1748-9326/ad0065]
[Erb et al. 2022, DOI: 10.5194/cp-18-2599-2022]
[Osman et al. 2021, DOI: 10.1038/s41586-021-03984-4]
[Kaufmann et al. 2020, DOI: 10.1038/s41597-020-0530-7]
[Marcott et al. 2013, DOI: 10.1126/science.1228026]
Standard nonsense, without ever explaining what is CAUSING this “recovery”.
There is remarkably little discussion about the allegedly ongoing ‘recovery’. Most proponents simply treat it as a given.
Recovering from the LIA is not a cause. Recovery requires a cause. What is the cause of the warming?
That’s really surprising. I was expecting this month to be cooler that last September.
This makes 15 months in a row to set a monthly record. The ten warmest Septembers are now:
1 2024 0.96
2 2023 0.90
3 2019 0.46
4 2020 0.41
5 2017 0.40
6 2016 0.30
7 1998 0.27
8 2021 0.27
9 2022 0.25
10 2010 0.19
Interesting to see how much cooler the previous El Nino Septembers of 1998 and 2016 were.
My simplistic projection for 2024 is now 0.85 +/- 0.08. It’s difficult at this stage to see 2024 as not beating the 2023 record, the question is by how much. At present it look like beating the record by at least 0.25C.
September was the first month there was a noticeable drop after the 1998 El Nino. The big drop came in November.
But then, in September 1998 we were already well into La Nina, and approaching a strong one, with ENSO3.4 already down to -1.3. This September it will probably only be around -0.4.
(Someone here will now present the deprecated ENSO3.4 data graph instead of the official data, and without providing the 1998 data from that source for comparison.)
This is also the warmest USA September, just beating September 1998 at 1.50C. And the warmest Arctic September, beating last years 1.14C by some margin. Australia was 0.01C cooler than last year’s record September.
It’s also a record September for the Northern Hemisphere, beating last year’s record by 0.27C.
Here is the Monckton Pause update for September. At its peak it lasted 107 months starting in 2014/06. Since 2014/06 the warming trend is now +0.42 C/decade.
Here are some more trends
1st half: +0.14 C.decade-1
2nd half: +0.23 C.decade-1
Last 10 years: +0.41 C.decade-1
Last 15 years: +0.39 C.decade-1
Last 20 years: +0.30 C.decade-1
Last 25 years: +0.23 C.decade-1
Last 30 years: +0.17 C.decade-1
The acceleration is now at +0.03 C.decade-2.
I’m afraid I’m going to have to cross the floor on this one and point out how meaningless a 10-year trend is in terms of having a predictive value.
I don’t disagree but Monckton made a big stink about how the warming had paused (and interpreted by many as an outright stoppage) by considering only the last <9 years in his monthly updates. I'm pointing out that since the start of his cherry picked pause the warming rate is now even higher than that of the overall trend.
It is also interesting to note that the warming trend up to 2014/06 (the start of his pause) was only +0.11 C.decade-1. And if we include the 107 months of the pause it is actually +0.14 C.decade-1. So his pause actually increased the overall warming rate. Simpson's Paradox.
If the point is to shine light on Monckton’s lunacy then it is a point well made. Unfortunately this new peak will only serve to reset the baseline for a new instalment of his nonsense.
WUWT lost its credibility long ago when they discredited Berkeley Earth after it reported results consistent with other surface datasets. If I remember correctly, Watts said he would accept the result no matter.
You remember correctly. He said “I’m prepared to accept whatever result they produce, even if it proves my premise wrong” They is Berkeley Earth.
Well its hard to say that if I am correct on my most conservative estimate of natural warming within the next few years the trend will start decelerating and should do so over the next 40 years.
But of course that will depend upon the relative strengths of the other factors. . .including any we may be unaware of.
I’m sure predictive value was not bdgwx’s point.
bdgwx says: ”The acceleration is now at +0.03 C.decade-2.”
Natural climate change via orbital forcing at its finest. It was bound to reveal itself on the solar system scale of time and here it is folks! this is not CO2 its not ENSO, in fact it seems to have been killing ENSO seasonal forecasts dating back to January.
time to wake up and address natural climate change via orbital forcing! there hasn’t been a big poof of CO2 that could account for it but there clearly is a planetary alignment.
“Natural climate change via orbital forcing at its finest.”
Fantasy that cannot be supported with actual science. Oh well..
What science is available on the matter says otherwise Nate. Orbital forcing is real and is taught at a high level in the universities. What they don’t look at because of corruption is the eccentricity clock has much more than one hand on it.
I think that everybody here will agree that orbital forcing exists. The question is: what makes you so sure that the warming we’ve seen recently has been caused by orbital forcing?
Can you point us to any research from a few years ago that predicted orbital forcing to cause this amount of warming?
Nah,you have not made a convincing science based argument. Until you do, this is Astrology.
AverageJon, I can point to the summations of the work of Milankovic that has noted numerous significant warming cycles that he discovered in his work on orbital forcing.
You might start with Figure 2 of this link:
https://ebme.marine.rutgers.edu/HistoryEarthSystems/HistEarthSystems_Fall2008/Week12a/Berger_Reviews_Geophysics_1988.pdf
https://ruby.fgcu.edu/courses/twimberley/EnviroPhilo/Variations.pdf
Perhaps add in this one for the fact that the eccentricity variable isn’t linear and gives and estimate of the relative forcing between the 3 orbital variables.
For what I have done is look at actual documented speed differences and estimates from various sources for the current variation in insolation during earth’s orbit.
I have mapped out over 700 years of planet positions for the 4 major planets keyed to conjunctions of Jupiter and Saturn and have found a match to all the acknowledge warmer and colder periods that occur in cycles greater than 20 years.
What is left is to understand better how these events come in bunches and then can disappear for a long period of time making for super cycles. this is enabled by some rather close repetitions of conjunctions taking centuries to march through the warm side then pass to the cool side.
https://flic.kr/p/2qk8Nga
What I don’t understand from a genuine science perspective is why all this is so well known and document but not prioritized via its own complex model.
As Dr. Syun Akasofu says and believes its significantly natural, you must understand natural climate change to understand anthropogenic change.
“Natural climate change via orbital forcing at its finest. It was bound to reveal itself on the solar system scale of time and here it is”
Orbital forcing produces a few degrees of global climate change over tens of thousands to a hundred thousand years. Completely unnoticeable over the 4.5 decades alluded to here.
If you don’t believe me, Bill, just take the acceleration value you referenced in your comment and the rise since 1979, and work out the total change over the briefest of the orbital periods – 21,000 years. You may be surprised at what your ‘model’ predicts.
“I have mapped out over 700 years of planet positions for the 4 major planets keyed to conjunctions of Jupiter and Saturn and have found a match to all the acknowledge warmer and colder periods that occur in cycles greater than 20 years.”
Apologies. You really are doing astrology.
Its not astrology Barry.
Its actual differences in speed in which the planet rotates through aphelion and perihelion. The difference is measured in days. Thats a significant difference in insolation. Its clear to me that at a minimum one can only estimate climate change on a very long term scale because the means by which eccentricity changes is based on multiple pulses of heating over an 80 year cycle that embeds and sustains itself as feedback from the oceans and ice sheets, until the super cycles playout and the orbital forcing reverses itself.
Its this process by which you see the warming peaks and valleys in the instrument record and the ice cores.
Pay attention there is still an underlying effect that Dr. Syun Akasofu termed a recovery from the LIA and we can see that solar activity which brightens the sun has been increasing. I provided a graph of that activity as well. https://flic.kr/p/2qk8Nga
the source I provided to AverageJon clearly says that the eccentricity variable is ”probably” not linear. Thus the best science available is that it isn’t linear as this allegedly comes from Milankovic.
If you are referring to the Milankovitch cycles then I repeat: take the acceleration you referenced and the total rise since 1979 (UAH data) and apply that to the length of the shortest orbital variation. See what your predictive ‘model’ comes up with.
I’ll help.
0.16 C/decade rise over 45.6 years is 0.73 C in total
Acceleration over this period is what you quoted: +0.03 C.decade-2
Now calculate the total warming over 21,000 years (the shortest orbital variation I could find – or take 23,000 or 26,000 years if you prefer – all various estimates of precession). What do you get?
Milankovitch cycles had been cooling the planet throughout the holocene. So the recent uptick you are arguing is caused by orbital variation must have just started.
You are free to nominate any of the cycles you think is currently dominant and calculate total warming based on your comment that the acceleration in global temp change since 1979 is due to “Natural climate change via orbital forcing at its finest.”
“Its clear to me that at a minimum one can only estimate climate change on a very long term scale because the means by which eccentricity changes”
Eccentricity changes?
We are on the down curve of that 100,000 year cycle, where global temperatures had peaked about 12,000 years ago at the end of the last climb to our current interglacial. So we should be getting colder if you think Earth’s eccentricity cycle is responsible for acceleration.
But how about you clear things up and tell us which orbital cycle is responsible for the acceleration you quoted,in context of a warming world and perhaps tell us how far along that cycle we are. Feel free to reference the standard literature to corroborate this.
barry says:
Now calculate the total warming over 21,000 years (the shortest orbital variation I could find or take 23,000 or 26,000 years if you prefer all various estimates of precession). What do you get?
——————–
Neither the 26,000 year cycle nor the 100,000 year cycle are considered to be affected by linear change. The parameters that change the 100,000 year cycle are constantly changing. The best way to describe the 100,000 year cycle is when all the planets line up in a near perfect line. Seems to me folks working on that found it was actually something like 415,000 years, meaning of course its silly to look at it as a cycle going through linear change. You have no credible source that specifically claims that the cycle is a perfect sinewave.
all you have done, mostly, is read there is a 100,000 year cycle and you and many others have gossiped about it all believing its a cycle of linear change.
xxxxxxxxxxxxxxxxxxxxxxxxx
x
x
x
barry says:
”Feel free to reference the standard literature to corroborate this.”
I have. Obviously you have not. I gave the references above but obviously you didn’t read them.
“Its actual differences in speed in which the planet rotates through aphelion and perihelion. The difference is measured in days. Thats a significant difference in insolation. ”
Bill, so you keep saying, but never showing how you find this.
I find that it is insignificant.
“I have. Obviously you have not. I gave the references above but obviously you didnt read them.”
Which specific reference agrees with you that there will be such short cycles of significant insolation change?
If you cannot show something, then it must be in your imagination.
I already gave it to you Nate. Remember the graph that shows all the orbital cycles that Milankovic allegedly found? See the above references. While these are not directly at you they are in this subthread on October 2, 2024 at 5:25 PM. Read them!
Nate here are my replies on your estimates vs my estimates and a calculation of the effect on days traveling through the semi-major axes between 1939-40 1980-81 and 2023-24 based upon the USNO data.
https://flic.kr/p/2qkmGkE
https://www.drroyspencer.com/2024/09/david-appell-awaiting-the-death-of-climate-skeptics/#comment-1690508
https://www.drroyspencer.com/2024/09/david-appell-awaiting-the-death-of-climate-skeptics/#comment-1690508
As I pointed out.. your source has a completely different explanation of that data, that does not have anything to do with Earth speeding up or slowing down in its orbit.
https://www.drroyspencer.com/2024/09/david-appell-awaiting-the-death-of-climate-skeptics/#comment-1690543
Bill,
“they are in this subthread on October 2, 2024 at 5:25 PM. Read them!”
The first link says a 6000 year cooling is going to continue for another 5000 years.
https://ebme.marine.rutgers.edu/HistoryEarthSystems/HistEarthSystems_Fall2008/Week12a/Berger_Reviews_Geophysics_1988.pdf
It also says that CO2 warming could maintain temperatures in a “superinterglacial.”
The second paper, like the first, deals with low-frequency climate change over millennia, and is not responsive to your claim that the acceleration is orbitally induced.
The 3rd link is about sunspots, not orbital variation, and therefore irrelevant to what you claimed.
I see Nate echoes my request that you explain what you mean, and note that none of your links remotely addresses how orbital forcing is responsible for the acceleration you quoted in the UAH record.
Orbital forcing is low frequency and might induce acceleration many orders of magnitude slower than the rate you quoted.
I urge you to run the numbers instead of hand-waving, and show us what your ‘model’ predicts, and how well it has post-dicted current events.
If you can’t or won’t, then you’re just gas-bagging free of any substance.
Nate the first source is my calculation of the speed up from the dates that earth crosses aphelion and perihelion. Simple date math.
Obviously if half an orbit takes several days more than the other half something slowed down or something sped up.
Do I have to hold your hand and walk you through the mathematics?
the other sources show the short term orbital variation cycles and the fact that eccentricity is at about 50% of the effect seen in ice cores, and that eccentricity change is not linear.
What else do you need to know to blow to smithereens your incorrect beliefs in all those matters. You asked for evidence and you got it.
Yes, the Sun is evolving, and the Earth is evolving with it.
“Obviously if half an orbit takes several days more than the other half something slowed down or something sped up.”
FALSE!
Your own source points out why that is wrong. They give another solid explanation for the delays being an artifact of the motion of the Earth-Moon barycenter, which you choose not to believe and ignore.
When you believe you know better than the experts, Occam’s razor says are just misunderstanding them.
barry says:
”The first link says a 6000 year cooling is going to continue for another 5000 years.”
Yes it does but the study doesn’t include the fact that the largest variable, namely eccentricity variation, is not linear.
Instead it looks to the axial elements for the source of cooling and ignores the eccentricity element, which is the larger variable.
Thats confirmed in the second source where eccentricity is awarded 50% of the effect, obliquity 25% of the effect, precession 10% of the effect, and finally CO2 feedback 15% of the effect.
So the ”model” prediction has a 11,000 year cooling period (which we have been in for 6,000 years).
It is followed by a warming period.
Then the axial elements create another cold spell ”centered on 23,000 years” from now and start another cooling.
thats followed by yet another warming,
then in 60,000 years it will be followed by a major glaciation no doubt skipping over some dips along the way since we were on a 11-12 thousand years schedule and had to jump ahead there by 37,000 years.
And of course there is no quantification of any of this.
In other words. . .yeah sure!
And the author actually makes fun of the idea that the climate optimum of the Holocene was 6,000 years ago. He terms it: ”The so-called postglacial “Climatic Optimum” and recognizes the 2,500 year warming bump as possibly being: ”related to the characteristic time scale of the ocean”
Woohoo!
So in fact we may not be near the peak of the Holocene/Anthropocene. Logically that should occur about 50k years after the glaciation nadir or about 30ks year from now. . give or take one of those negative bumps that occur every 11-12 years.
Further there is a whole lot of ambitious talk about how important this orbital forcing is for learning about the history of the earth. . .but apparently it got no funding or should we way a pittance.
It also says that CO2 warming could maintain temperatures in a superinterglacial.
The second paper, like the first, deals with low-frequency climate change over millennia, and is not responsive to your claim that the acceleration is orbitally induced.
The 3rd link is about sunspots, not orbital variation, and therefore irrelevant to what you claimed.
I see Nate echoes my request that you explain what you mean, and note that none of your links remotely addresses how orbital forcing is responsible for the acceleration you quoted in the UAH record.
Orbital forcing is low frequency and might induce acceleration many orders of magnitude slower than the rate you quoted.
I urge you to run the numbers instead of hand-waving, and show us what your model predicts, and how well it has post-dicted current events.
If you cant or wont, then youre just gas-bagging free of any substance.
Bill,
Nothing in your reply addresses why you believe orbital variation is responsible for the UAH acceleration you quoted. You avoid dealing with that altogether.
And that’s because nothing in the links you provide supports such a position.
Yet you made the claim and when called on it pointed to the links to support it.
Too much gas-bagging.
I certainly don’t need a lesson on Milankovitch cycles. I was reading heavily on that more than a decade ago, which is why I know you can’t attribute a 0.03 C/decade acceleration in global temps over 45 years to orbital variation.
barry says:
”Bill,
Nothing in your reply addresses why you believe orbital variation is responsible for the UAH acceleration you quoted. You avoid dealing with that altogether.
And thats because nothing in the links you provide supports such a position.
Yet you made the claim and when called on it pointed to the links to support it.
Too much gas-bagging.
I certainly dont need a lesson on Milankovitch cycles. I was reading heavily on that more than a decade ago, which is why I know you cant attribute a 0.03 C/decade acceleration in global temps over 45 years to orbital variation.”
——————–
Obviously you failed to note the short period cycles of climate change documented in https://ebme.marine.rutgers.edu/HistoryEarthSystems/HistEarthSystems_Fall2008/Week12a/Berger_Reviews_Geophysics_1988.pdf
In particular they are compiled in figure 2.
I agree that one cannot come up with .03c acceleration of warming if one has adopted the propaganda that the eccentricity variable is a linear forcing.
But this source: https://ruby.fgcu.edu/courses/twimberley/EnviroPhilo/Variations.pdf
says: ”Unlike the correlations between climate and the higher-frequency orbital variations (which can be explained on the assumption that the climate system responds linearly to orbital
forcing), an explanation of the correlation between climate and eccentricity probably requires an assumption of nonlinearity.”
Obviously if you attribute orbital forcing to gravity of the other planets which is widely accepted you can’t claim any linearity to the results as the planets don’t circle the sun once every 100,000 years in unison like a clock with only one hand.
Instead they are like a clock with 8 hands all running at different speeds making for a wide range of various gravity vectors over the course of thousands of years.
I doubt you can come up with a credible source that supports your statement that Milankovic can’t explain that.
Every single science paper I have seen either is silent on the matter or disavows linearity. Logic disavows linearity.
Milankovic obviously did not believe that and the variety of orbital forcing cycles he documented such as the 20 year conjunction/opposition cycle of Saturn and Jupiter which is one of those orbital cycles recognized by Milankovic, documented in the source above, and still supported by NASA. From there one must ask about the other planets and how their motions correspond to historic instrument and proxy records.
Nate came up with a gravity simulator that uses those nudgings to create a ”largely linear” effect. Except that the nudges were over one degree themselves and what they used to create the nudges may have been only jupiter and saturn and it doesn’t show the other orbital cycles documented in the reference above.
It seems pretty likely the nudging is an important element if orbital forcing causes some warming, ice sheets and glaciers will retreat and you get positive feedback. Same with ocean sunlight uptake. Its estimated to take a variety of times for the ocean to warm after getting a pulse of heat. Again a positive feedback converting absorbed energy into surface temperature using natural processes.
And maybe indeed the sun has a mind of its own but is influenced in its timings of the release of heat above its surface via various internal processes.
Its also the case we can’t predict ENSO meaning we don’t yet know what causes it. Perhaps its triggered by miniature tides (sloshback from the western pacific to the east is one noted effect) That might be facilitated by a slight rise in tides.
You can’t say what you said and support it in any way Barry so you need to take that claim back. . .or support it. Otherwise its you who is gas bagging.
Bill,
lots of hand-waving about non-linearity, but still absolutely nothing presented to corroborate what you said.
Nothing in the literature supports the notion that orbital variation is responsible for the acceleration you quoted in the UAH record.
You have backtracked from that determinate position and are now arguing that it’s quite possible for orbital variation to be responsible.
Good job. You’re on safer ground with conjecture.
barry says:
”Bill,
lots of hand-waving about non-linearity, but still absolutely nothing presented to corroborate what you said.
Nothing in the literature supports the notion that orbital variation is responsible for the acceleration you quoted in the UAH record.”
Knowing its not linear is more than enough for a scientific examination of what the impacts are Barry.
Obviously some people are not interested. Can you imagine why? Such behavior would never be condoned in a US accounting firm. Heads would roll.
The evolution of your ‘argument’, Bill.
Orbital variation is responsible for the UAH acceleration! Here are the papers that demonstrate it.
Orbital variation could be responsible for the acceleration. No one seems to have crunched the numbers, unfortunately.
Thank you for playing.
Well there is no way to establish any certainty as how much warming is caused by CO2 until we do do the work. Thats for sure. Its a huge gapping hole in the science. Milankovics work has been extrapolated to no short term effects while entirely ignoring the gravitational effects of barycenter science.
“while entirely ignoring the gravitational effects”
Nobody has ignored it. Many have calculated the perturbations on Earth’s orbit by the outer planets. But you cannot seem to find any that observed what you claim. And you are certainly not qualified to do them yourself.
So thats all folks.
Nate says:
Nobody has ignored it. Many have calculated the perturbations on Earths orbit by the outer planets. But you cannot seem to find any that observed what you claim. And you are certainly not qualified to do them yourself.
So thats all folks.
—————————–
Yes move right along folks nothing to see here.
Indeed there is nothing to see here in support of the claim you just made Nate. That’s the problem.
And what I observed is provided by USNO and NASA. I embellished nothing. You are just trying to throw in the towel and exit when you have a great opportunity to stand up virtuously for science and call for something.
Bill Hunter: “I embellished nothing”
You’re fooling yourself, Bill.
bdgwx: “The acceleration is now at +0.03 C.decade-2.”
Bill Hunter: “Natural climate change via orbital forcing at its finest. It was bound to reveal itself on the solar system scale of time and here it is folks! this is not CO2 its not ENSO, in fact it seems to have been killing ENSO seasonal forecasts dating back to January.
time to wake up and address natural climate change via orbital forcing! there hasn’t been a big poof of CO2 that could account for it but there clearly is a planetary alignment.”
When challenged on this you said no one had crunched the numbers.
You have a habit of making wild claims that crumble under scrutiny. Even your own.
Trump may be the most fit President of all time.
The claim he wants to overthrow democracy is a complete joke. He didn’t do at the end of his first term and much as idiots want to believe so.
January 6 the first unarmed rebellion in the history of the world. LMAO! Must have been an imaginary war on snowflakes.
“And what I observed is provided by USNO and NASA.”
You are hopeless Bill. We spent time debunking the USNO evidence.
Did you forget all about that?
Or is just ongoing pure denial of any inconvenient facts?
Nate you didn’t debunk anything. You have zero scientific sources.
Other than your own source the USNO, which made it absolutely clear that the data does not show actual changes in Earths orbit.
https://www.drroyspencer.com/2024/09/david-appell-awaiting-the-death-of-climate-skeptics/#comment-1690543
But you believe you know better!
Nate says:
Other than your own source the USNO, which made it absolutely clear that the data does not show actual changes in Earths orbit.
https://www.drroyspencer.com/2024/09/david-appell-awaiting-the-death-of-climate-skeptics/#comment-1690543
But you believe you know better!
——————–
Well you acknowledge the close to a sum of a 5 day difference in time between 1981 and 2023, which tells us of a major difference of about 2.5% difference in speed.
The US Navy though is not a science source for the reason why and the webpage you offered provides no reference to a science source. For all we know that page could have been put up by a seaman mass communications specialist whose only educational requirements are a highschool diploma or GED whereupon the navy has a 27week training program for that will teach them to type, post to websites, etc.
Nate says:
”Using the ellipse equation and Earths eccentricity, I find that in the first day after aphelion, the orbit gets 220 miles closer to the sun.
Well good for you the problem is the moon moves the earth in an orbit around a barycenter located 2,900 miles away from the center of the earth. That changes the earths position with respect to the sun by 5800miles.”
How funny. Nate quotes himself and then pats himself on the back for the quote. ROTFLMAO! https://www.drroyspencer.com/2024/09/david-appell-awaiting-the-death-of-climate-skeptics/#comment-1690929
Nate the ”ellipse equation” doesn’t work for perturbations. Perturbations change the ellipse and according to Milankovic does so for up to 3 to 4 degrees celcius about once every 2,500 years. All you are spouting off about you are ignorant of the facts. I have give you the references for this and you just ignore them and make stuff up. Milankovic acknowledges that roughly 1.2C of that variation is due to unpredictable changes in ”internal stochastic mechanisms” (perhaps stuff like ENSO). Thus since we may eliminate some those more apparent ISMs by smoothing the warming over 30 years, what we are looking for astronomically once every 2,500 years is at least 1.8c natural variance from orbital forcing. . .per Milankovic. I didn’t make that up like you make stuff up or hear from your Daddy without any scientific support.
The variance of that basic ellipse caused by these perturbations are calculable by barycenter models. They show the sun being moved by the planets approximately 2 million miles. Could be more or less based upon your ”nudge” theory changes to eccentricity.
The earth will be moved more or less than that. The variance on that 2 million miles will depend upon the position of earth in the orbit around the sun.
The difference in distance from the center of the solar system barycenter differs by + or – 1AU by the mean radius of earths orbit. That will have a large impact on how much earth moves with respect to how much the sun moves. As you know the force of gravity is not a linear function.
Your lunar influence on earths distance to the sun relatively speaking is very small.
So stop being a lunar-centric lunatic.
And distance is only one factor. The speed factor is another one as that determines of a variance in speed for how long the earth will spend in each part of its orbit (i.e. closer or further from the sun as part of the Kepler orbit.
That varies also due to the influence of the planets. The distance factor goes from zero to the maximum effect with each orbit and how fast the earth moves is also affected by that gravity being maximum when the gravity vector from the solar system barycenter is parallel to earth’s orbital path and zero when perpendicular.
You are simply repeating already debunked nonsense.
https://www.drroyspencer.com/2024/09/david-appell-awaiting-the-death-of-climate-skeptics/#comment-1691762
“Milankovic acknowledges that”
No he doesn’t. You have not linked to any Milankovitch paper!
Its not possible to link to a Milankovic paper they are all being buried.
All you can link to is folks that purport to be analyzing Milankovic and I have given you two of those papers that acknowledge what I am saying.
Nate says:
October 11, 2024 at 4:35 PM
You are simply repeating already debunked nonsense.
https://www.drroyspencer.com/2024/09/david-appell-awaiting-the-death-of-climate-skeptics/#comment-1691762
——————–
Well we are all aware that what you consider to have been debunked is whatever your daddy told you was debunked, in this case your daddy not even identifying a person, much less a paper with calculations, observations, methods, or scientifically drawn conclusions with references.
In fact one of your most common my daddy told me so beliefs is when a scientist in an otherwise decent paper gives homage to your daddy by saying something in specific like ”models show” often without even identifying the model; but always without documentation of the model or the specific persons taking responsibility for the model. A classic tip o the hat to the man in charge without even naming him.
Bill, ‘my daddy’ is what science has observed and understood.
Choosing that over your speculation lacking logic or evidence is an easy choice.
You have imagined you found evidence in papers, but have read things between the lines in these papers that no one else can see.
E.g. the 2500 year peak: the paper is not claiming this is a Milankovitch cycle nor due to planetary perturbations at all.
“Well we are all aware that what you consider to have been debunked is whatever your daddy told you was debunked, in this case your daddy not even identifying a person,”
False. I went through the math with you and it confirmed what the official statement from the USNO clearly explained.
You don’t understand the basic geometry or the science behind it. My dog did not understand it either.
But neither of these are a valid argument against it.
Nate says:
”You have imagined you found evidence in papers, but have read things between the lines in these papers that no one else can see.
E.g. the 2500 year peak: the paper is not claiming this is a Milankovitch cycle nor due to planetary perturbations at all.”
the figure lists it as an orbital cycle. And it is. It corresponds roughly the frequency at which all 4 gas giants meet in one narrow slice of the sky when that earthly movement away from the sun is at a second level maximum according to the chart.
Nate says:
”False. I went through the math with you and it confirmed what the official statement from the USNO clearly explained.”
As I recall you came up with 212 miles. Thats definitely not even close to explaining the variation in the orbit.
When you have actually done the math come back with your figures not just for the moon but for all four gas giants and then an only then will you have any basis at all of disputing what I have said. Using the gravity simulator outputs I linked you to; I come up with about a .9% variation in the earth’s distance to the sun from Jupiter alone. 1.3mmkm/149mmkm= .9%
You have my links and the only way you can avoid the gasbagger moniker is provide some calculations and estimates that shows the effect of Jupiter at a minimum. then you can compare it to the moonie you have been quoting. The moon calcs out at .00933mmkm/149mmkm=.00626%. Jupiter has the effect the moon has times 139.
Your gasbagging isn’t acceptable science.
“As I recall you came up with 212 miles. Thats definitely not even close to explaining the variation in the orbit.”
We can see here why people here avoid getting into discussions with you.
Because you stubbornly reject facts and evidence if they disprove your beliefs.
No, the USNO is not wrong about the effect of the Moon on the MEASURED times of aphelion and perihelion.
You are.
Very sorry.
“E.g. the 2500 year peak: the paper is not claiming this is a Milankovitch cycle nor due to planetary perturbations at all.
the figure lists it as an orbital cycle. ”
FALSE! You misreading the figure, and not paying attention to the description of it in the text of the paper.
They are identifying only the standard Milankovitch cycles as the ‘orbital cycles’, and are not including the 2500 years.
In any case, this is a red herring because 2500 years is much much longer than few decade variations you have been pushing here.
“Using the gravity simulator outputs I linked you to; I come up with about a .9% variation in the earths distance to the sun from Jupiter alone. 1.3mmkm/149mmkm= .9%”
Yes, I understand where you get this from, the motion of the Sun around the solar system barycenter.
However it turns out the Earth does not orbit the Solar System barycenter. It orbits the Earth-Sun barycenter, which is essentially the sun’s center.
As I explained here
https://www.drroyspencer.com/2024/09/david-appell-awaiting-the-death-of-climate-skeptics/#comment-1692042
Thus when the sun has moved 1 million km, the Earth’s orbit around the sun is dragged along with it.
The Earth-sun distance is not much affected.
Oh the moon does have an effect on the earth’s orbit period but the Its very small as you accept the motion of the earth of only 2,900 mile radius.
You are still gasbagging with no calculations trying to make an unattributed quote on a website as being superior to actual calculations and a gravity simulator.
Nate says:
”Thus when the sun has moved 1 million km, the Earths orbit around the sun is dragged along with it.
The Earth-sun distance is not much affected.”
Depends upon the what you consider to be ”not much affected” but you haven’t provided any math or standard to measure that by. So you are still just gasbagging.
I provided you a calculation. If you don’t like it then do the calculation and tell me where I went wrong.
“You are still gasbagging with no calculations trying to make an unattributed quote on a website as being superior to actual calculations and a gravity simulator.”
Bullsh*t. You have not done any calculation of this effect and thus far your geometrical reasoning has been faulty.
It is an official statement of the US Naval Observatory! Their staff certainly DO understand their own astronomical data better than you do!
Nate says:
”Bullsh*t. You have not done any calculation of this effect and thus far your geometrical reasoning has been faulty.”
You are so desperate here now you are resorting to out and out lying.
I gave you the effect on the sun by Jupiter. You acknowledged it.
But since you apparently don’t retain anything you don’t want to hear.
https://www.drroyspencer.com/2024/10/uah-global-temperature-update-for-september-2024-0-96-deg-c/#comment-1692107
Then I gave you this regarding the variable effect on earth.
https://www.drroyspencer.com/2024/10/uah-global-temperature-update-for-september-2024-0-96-deg-c/#comment-1691349
So it appears you have a problem with highschool math and physics. So let me put it together for you. Gravitational force is inversely proportional to the square of the distance between the two objects.
So the sun is 5.2au from jupiter whereas the earth in its orbit varies from 4.2 au to 6.2 au
distance from jupiter
earth more distant 6.2au, , squared equals 38.44
sun 5.2au, , squared equals 27.04
earth closer 4.2 au, squared equals 17.64
So when the earth is conjuncted with Jupiter it has 34.8% more gravitational pull from Jupiter than the sun has from Jupiter.
And when the earth is in opposition to Jupiter it as 42.2% less pull from Jupiter than the sun has from Jupiter.
that may be a small amount of difference in sunlight but sun light is also inversely proportional to the square of the distance.
But you not even knowing who make the declaration about the moon on the Navy website believe that the moon has the most impact. Well just run your numbers on that and see how screwed up your interpretation is with the earth only moving around a barycenter 2,900 miles from the center of the earth.
Obviously the navy said nothing about Jupiter and the other planets and you have concluded that they did.
All you are doing is comparing 93,000,000 miles to 2,900 miles and claiming the 2,900 miles has all the influence. I know you aren’t that stupid Nate but your level of intellectual dishonesty is completely off the charts.
It is an official statement of the US Naval Observatory! Their staff certainly DO understand their own astronomical data better than you do!
“I provided you a calculation. If you dont like it then do the calculation and tell me where I went wrong.”
It’s not wrong. Its the suns motion, not the Earth sun distance. You are confused as usual.
“Navy website believe that the moon has the most impact. Well just run your numbers on that and see how screwed up your interpretation is with the earth only moving around a barycenter 2,900 miles from the center of the earth”
It has already been clearly explained several times.
You are obviously lost in space.
Nate says:
”It is an official statement of the US Naval Observatory! Their staff certainly DO understand their own astronomical data better than you do!”
Where is your evidence of that?
Nate says:
I provided you a calculation. If you dont like it then do the calculation and tell me where I went wrong.
Its not wrong. Its the suns motion, not the Earth sun distance. You are confused as usual.
—————-
Wrong!
I also showed the suns movement by Jupiter.
But I also provided you with the proof that the earth doesn’t move in sync with the sun because of the earth’s distance from the sun. That variation is up to 42% from Jupiter’s movement of the sun alone. As You can see in the gravity simulator. The gravitational effects of the planets.
http://www.orbitsimulator.com/gravity/articles/ssbarycenter.html
As you can see the sun’s center is forced into wobble of ~2,700,000 km diameter by the objects in the universe over just a short period of time (about 90 years). Of course the best alignments of the planets don’t occur anywhere near that frequency. So a longer run of the gravity simulator will expand that number.
A simple gravity simulator will produce large results. A finer tuned one run for thousands of years and incorporating all the known perturbations, including the trans-Neptune perturbations will make it larger. Its already more than 1,700 times the amount shown in the 8th frame for the wobble introduced by the earth/moon system.
“But I also provided you with the proof that the earth doesnt move in sync with the sun because of the earths distance from the sun”
FALSE! You provided no proof.
If you think that the Earth orbits the solar system barycenter, rather than the sun, then you should also think that satellites of Earth must orbit the Earth-Moon system barycenter, which is 3000 miles above the Earth’s center.
But as explained, then all low Earth orbiting satellites, like the ISS, orbiting well under 3000 miles above the surface, would be crashing into the Earth!
But they don’t. Because as the Earth moves 3000 miles around the barycenter, the satellites follow the Earth, not the barycenter.
This undeniable reality will undoubtedly be beyond your comprehension.
“Its already more than 1,700 times the amount shown in the 8th frame for the wobble introduced by the earth/moon system.”
You are mixing up the Moon’s effect on the timing of aphelion/perihelion, which is an artifact, with the orbit pertrbations from the outer planets.
Not at all the same thing!
Look if you really think the USNO has messed up and is incorrect in their description of the cause of the time changes to aphelion/aphelion, then you ought to email them, and ask them to fix this error.
But you will need to tell them that you haven’t bothered to do the math to check the accuracy of their statement.
And that you think they must be wrong because you feel that these delays or advances in ap- peri- helion, must be coming from the outer planets.
Though again you should inform them that you have not actually calculated the delays or advances in ap- peri- helion due to even Jupiter so this is just a guess.
And feel free to inform them that your buddy Nate has verified their statement, but you are sure he is wrong.
Nate says:
”FALSE! You provided no proof.”
Wow! Now Nate is denying Newton’s Laws of Gravity!!!! He is also ignoring that astronomy knows that the planets perturb the orbit of the other planets and they don’t all go around the barycenter uniformly.
xxxxxxxxxxxxxxxx
xxxxxxxxxxx
x
x
x
Nate says
”If you think that the Earth orbits the solar system barycenter, rather than the sun, then you should also think that satellites of Earth must orbit the Earth-Moon system barycenter, which is 3000 miles above the Earths center. But as explained, then all low Earth orbiting satellites, like the ISS, orbiting well under 3000 miles above the surface, would be crashing into the Earth!”
That’s of course nonsense. The perturbations are relative to the orbit distance. In the case of the earth its about .4% of its orbit distance from the sun over 40 years. For the satellite that would be about 15 miles out of the 3000 and that would result in about a 1% difference in earthshine on the satellite.
xxxxxxxxxxxxxxx
xxxxxxxxx
x
x
x
Nate says:
”You are mixing up the Moons effect on the timing of aphelion/perihelion, which is an artifact, with the orbit pertrbations from the outer planets.”
———–
Thats wrong depending upon which side of the earth’s orbit the planet is on its going speed up half the earth for half an orbit and slow it down for the other half. The only times in the earth’s orbit where that doesn’t happen is the 2 moments in the orbit when the planet is equidistant from both the sun and the earth. This basic high school physics Nate. You are so bought into what your daddy has told you that you can’t see the light of day.
xxxxxxxxxxxxxxx
xxxxxxxxx
x
x
x
Nate says:
”Look if you really think the USNO has messed up and is incorrect in their description of the cause of the time changes to aphelion/aphelion, then you ought to email them, and ask them to fix this error.”
I am thinking about doing that. There is an official channel to make that happen. But the article isn’t entirely wrong. The moon has an effect its just very small relative to what they are ”suggesting”, you just take the double speech and extrapolate it suggesting its responsible for all perturbations of earth’s orbit.
You have just perp walked yourself into basic denial of science.
https://www.psi.edu/blog/passing-stars-altered-orbital-changes-in-earth-other-planets/#:~:text=One%20major%20reason%20the%20Earth's,%2C%20Uranus%2C%20and%20Neptune).
https://en.wikipedia.org/wiki/Perturbation_(astronomy)
https://science.nasa.gov/science-research/earth-science/milankovitch-orbital-cycles-and-their-role-in-earths-climate/ (see under subheading eccentricity)
What you have posted in this subthread is not consistent with science.
Bill, sorry none of your endless claims can be taken seriously.
And without an explicit calculation to show that the USNO statement is wrong, why oh why should they take you seriously?
“You have just perp walked yourself into basic denial of science.”
Then you post a bunch of links, none of which I have denied, and none of which support your claims.
You are just living in an alternate reality. Maybe get off the mushrooms for awhile!
Look Bill, the reality is that you are not an astronomer, physicist, or mathematician.
Yet here you are thinking you know better than the real astronomers, physicists, and mathematicians at the USNO.
That is just silly.
Because what see from you is that you don’t understand your limitations in these areas, and thus post a lot of stuff that makes no sense.
Calculating the real perturbations of the outer planets is not simple or easy.
For example, the Sun is moved by the second largest body Jupiter and that is fairly easy to quantify.
But the Earth orbits the sun and interacts with Jupiter. That is a famous 3-body problem which requires incre
dibly difficult math, and it is best to do with a computer simulation.
You are not able to do any of that. So you have no business making pronouncements about how much the Earth-Sun distance will change due to Jupiter.
What you need to do is find papers that have calculated it and show their results, and show us that they support your views.
Well if you are so ignorant of Newtonian physics that you believe a sun that is getting jerked around by planets over about 2,700,000 kilometers in some 40 years and that the earth will be dragged along with it without any difference in distance being dragged by the force of gravity when the earth is varying its distance from that solarsystem barycenter by + or – 150,000,000 km; quite honestly there is nothing I can do for you other than to note you have zero integrity. I can see why DREMT stopped talking to you. You are a genuine full-blooded jerk.
Regardless of which objects in the universe you want to blame, Nate; you have clearly endorsed the orbital forcing effect via the webpage you want to claim its the moon’s fault.
Anyway you choose to measure it by its clearly orbital forcing.
If you want to deny that, you will now need to disparage the USNO.
Thus we have the situation as extractable from the USNO data base where the earth basks in the sun during the closest approaches of the earth to the sun than when furthest from the sun.
USNO data records those variations in speed.
Then you have to combine extra time closer to the sun along with the stretching and contraction of the orbit gravity leash on the earth by the sun changing the distance also.
So now that we happily agree on everything except which objects make this happen we can move on and combine our voices in asking for a detailed analysis of this effect since the effect itself has been widely accepted to be the cause of the ice ages where ice levels slowly build and nudge the temperature along via changes in albedo to obtain the 100,000 year eccentricity peak itemized by Milankovic and endorsed by mainstream science.
And of course we have been witnessing the deicing of glaciers over the past 160 years due to this effect along with anything else that happens to be helping that along.
“you have clearly endorsed the orbital forcing effect via the webpage you want to claim its the moons fault.”
Then you have not been reading or abs.orbing what I have stated several times:
The delays/advannces in perihelion or aphelion are simply an artifact of the E-M orbit.
They do not indicate that the Earth has sped up or slowed down in its orbit.
“sun that is getting jerked around by planets over about 2,700,000 kilometers in some 40 years and that the earth will be dragged along with it without any difference in distance being dragged by the force of gravity when the earth is varying its distance from that solarsystem barycenter by + or 150,000,000 km; ”
I never said ‘without any difference’
There is likely a difference. But it must be small because we don’t observe the changes in solar insolation on 12 y or 40 year scales.
And it must be small, because the Earth’s acceleration is toward’s the sun, not the solar system barycenter (which has no mass!)
And it must be small because low Earth orbiting satellites do not orbit the Moon-Earth barycenter and crash into the Earth.
Thus when you state that
“In the case of the earth its about .4% of its orbit distance from the sun over 40 years.”,
it is not at all obvious where you get this number from. It appears to be completely made up!
You really need to stop doing that.
Total Solar Irradiance (TSI) received on Earth for the last 40 years.
https://climexp.knmi.nl/getindices.cgi?WMO=PMODData/tsi&STATION=measured_total_solar_irradiance&TYPE=i&id=someone@somewhere
If, as you claimed, the E-S distance had varied by 0.4% over 40 y, the irradiance should have varied with the distance squared, which would have changed it by 0.8 % x 1360 W/m^2 = 11 W/m^2.
But as you can see, the TSI varied by at most 1 W/m^2, which can be attributed to the solar cycle.
So observations are clear, the E-S distance did not vary by 0.4% as you claimed.
Sorry, your theory is falsified.
Nate says: ”The delays/advannces in perihelion or aphelion are simply an artifact of the E-M orbit.”
————-
An artifact? Are you claiming its the moon sneaking out in front of the earth and crossing the finish line first or alternatively trailing earth across the finish line?
Can you describe the nature of this ”artifact”?
Nate says: ”They do not indicate that the Earth has sped up or slowed down in its orbit.”
Well it indicates that either the earth sped up or it followed a straighter path from one semi-major axis to the other.
If it follows a straighter path then that moves it closer to the sun. If it speeds up then it will depend upon which side of the orbit it was on as to whether it spends more time further from the sun or closer to the sun.
If you don’t believe that gravity speeds things up maybe you ought to test that theory by jumping off the roof of your house.
xxxxxxxxxxxxxxxxxxx
x
x
x
Nate says:
”I never said without any difference There is likely a difference. But it must be small because we dont observe the changes in solar insolation on 12 y or 40 year scales.”
————
LMAO! And your source for that is what?
xxxxxxxxxxxxxxxxxxx
x
x
x
Nate says:
”And it must be small, because the Earths acceleration is towards the sun, not the solar system barycenter (which has no mass!)”
————-
The solar system barycenter is the ”center of mass” of the solar system.
xxxxxxxxxxxxxxxxxxx
x
x
x
Nate says: ”And it must be small because low Earth orbiting satellites do not orbit the Moon-Earth barycenter and crash into the Earth.”
————
Nope that would only happen if your gravity simulator were correct in nudging a satellite over multiple orbits. My default opinion on this nudge theory is it has nothing to do with orbiting but instead is simply due to changes in albedo mostly provided by groupings of eccentricity variations, per Hays, et.al. 1976.
xxxxxxxxxxxxxxxxxxx
x
x
x
Nate says: ”Total Solar Irradiance (TSI) received on Earth for the last 40 years.
https://climexp.knmi.nl/getindices.cgi?WMO=PMODData/tsi&STATION=measured_total_solar_irradiance&TYPE=i&id=someone@somewhere
If, as you claimed, the E-S distance had varied by 0.4% over 40 y, the irradiance should have varied with the distance squared, which would have changed it by 0.8 % x 1360 W/m^2 = 11 W/m^2.
But as you can see, the TSI varied by at most 1 W/m^2, which can be attributed to the solar cycle.”
——————–
As I see it you are close on the .8.
I come up with .7952% so 1.007952 times the 168w/m2 reaching the surface ends up as 169.336 or a 1.336w/m2 primary forcing.
Then you have to decide on the feedback. If its 3:1 you get 4 watts increase which equates to .7C.
If you create a slope line through UAH 1981.0-2024.0 you get .69C warming. Not bad huh?
As to your source it just says its a model and doesn’t provide any of the parameters or inner workings of the model. Models like that are less than worthless for informing the public. In fact in public accounting you have to provide the information to the readers to meet accounting standards for financial disclosures. You could lose your license.
Apparently you feel no obligation to do that. . .so your credibility suffers immensely.
Nobody should believe you based upon unreferenced ”my daddy told me”.
You may as well be buying dope from a stranger without testing it. . .history has shown no special level of integrity even when one does have a title. In this case you have neither name, title, nor license being put on the line. just a guy in a hoodie with sunglasses and a Covid19 mask in a dark alley.
“I come up with .7952% so 1.007952 times the 168w/m2 reaching the surface ends up as 169.336 or a 1.336w/m2 primary forcing.”
Except that does not happen if the solar flux reaching the Earth as measured outside the atmosphere by satellite does not change by 0.8%.
And as the data clearly shows, it does not. It changes at most 1/10 of this, and that can be explained by the solar cycle alone.
So this is solid evidence that your theory is wrong. Sorry.
Here is direct calculations of the Earth-Sun distance over a 100 year period.
https://www.astropixels.com/ephemeris/perap2001.html
It shows that the maximum variation of perihelion and aphelion is .00015 AU, or at most 25,000 km over a century.
This is 0.015 %, which is 27 x smaller than your claim of 0.4 %.
And it shows that the Earth’s orbit is dragged around by the sun as it orbits the solar system barycenter.
So here we have more direct evidence that your theory is falsified.
Sorry. If the observations do not agree with your theory, it is wrong, as Feynman has pointed out.
“Can you describe the nature of this artifact?”
Already did several times. It was also described quite clearly on the official web site of the US Naval Observatory.
If you still don’t understand, there is nothing more I can do for you.
I cannot work miracles.
Nate says:
”Except that does not happen if the solar flux reaching the Earth as measured outside the atmosphere by satellite does not change by 0.8%. And as the data clearly shows, it does not. It changes at most 1/10 of this, and that can be explained by the solar cycle alone. So this is solid evidence that your theory is wrong. Sorry. ”
You didn’t show any data Nate. You showed an unvalidated and undocumented model offered up by a political organization.
And political organizations like the WMO may as well be the 5th International in disguise with a hoodie, sunglasses, and Covid19 mask. Why in the world would we trust a political organization over an individual scientist who is under mandates to show his work?
Sucka!!
xxxxxxxxxxxxxxxx
x
x
x
Nate says: ‘https://www.astropixels.com/ephemeris/perap2001.html
It shows that the maximum variation of perihelion and aphelion is .00015 AU, or at most 25,000 km over a century.
This is 0.015 %, which is 27 x smaller than your claim of 0.4 %.
And it shows that the Earths orbit is dragged around by the sun as it orbits the solar system barycenter.”
—————
LOL! Fred Espanak? Is he the Bill Nye of the astronomer world?
Come on Nate. There are no calculations per Newtonian physics supporting these calculations and he seems to be buying into the same theory that only the moon can move the earth away from the sun, yet Jupiter with the same mean effect on the sun can move it all by itself nearly 2 million miles.
Fred has zero credibility in this area other than being able to find the sun and the moon in a telescope and hasn’t shown his work on this topic.
But none of that documentation is available so one just has to trust Fred to have gotten it right.
I don’t accept such luxuries as being science.
No documentation and no validation equals no science. So all you are doing Nate is barking at the moon.
this seems to be a popular notion but you have no support for it other than unsupported claims as in ”my daddy told me so”. Where are the actual calculations? I provided you with mine and you didn’t criticize them but instead you just bring up a ”my daddy told me different”. Are you sure you aren’t the one being manipulated? Obviously you have no idea of how to figure it out.
xxxxxxxxxxxxxxxx
x
x
x
Nate says:
”Sorry. If the observations do not agree with your theory, it is wrong, as Feynman has pointed out.”
————————-
Feynman actually requires observations Nate. . .and obviously the documentation and work evaluating those alleged figures you are calling observations.
Where is the paper that supports what your daddy has been telling you Nate. I don’t see any observations supporting your point of view. At least you recognize you need them. But you haven’t shown me you know where they are.
xxxxxxxxxxxxxxxx
x
x
x
Nate says:
”Already did several times. It was also described quite clearly on the official web site of the US Naval Observatory.”
—————-
No observation was described there. Just an statement you claim as the sole relevant fact.
“You didnt show any data Nate. You showed an unvalidated and undocumented model offered up by a political organization.”
False. It is a science organization reporting their data, which agrees with what others have found!
Just more pure denial from you.
“Come on Nate. There are no calculations per Newtonian physics supporting these calculations and he seems to be buying into the same theory that only the moon can move the earth away from the sun”
The data “was generated using the JPL DE405 planetary and lunar ephemerides”
from the Jet Propulsion Laboratory which develops the unmanned space probes and plans the various planetary exploration missions.
The program use Newtonian physics and Relativistic corrections to find the precise positions of all solar system bodies, as needed for planning planetary missions.
https://en.wikipedia.org/wiki/Jet_Propulsion_Laboratory_Development_Ephemeris
You really can’t find any better data than that!
But on you will go with endless denial of the facts!
Nate, Fred espanak nor the wmo work for jpl. Neither are planning space explorations. You will need to dream up a much better lie to support your argument than that simpleton lie.
I presented you with two data sets that contradict your theories, so naturally you knee-jerk reject them, but do not provide ANY alternative data!
You are more than welcome to show us alternative data for solar irradiance over time, and the distance from Earth to the sun over time.
The first data set is solar irradiance, which is published in journals. And is found on various climate data bases.
https://www.woodfortrees.org/plot/pmod
https://climexp.knmi.nl/start.cgi?id=someone@somewhere
They reference the source publications.
You shamelessly and falsely accused the authors of being a political organization. Stoopid
The other data set is from a site that posts astronomical data, and it makes clear that the data comes from the JPL Ephemeris, which is a widely used and respected data set of calculated positions of the planets as a function of time.
https://iopscience.iop.org/article/10.3847/1538-3881/abd414
I suppose the guy could have done something wrong in extracting the JPL data, that just so happens to dramatically reduce the variations in Sun-Earth distance, while keeping the correct average values.
Doubtful, but feel free to find your own data for Sun-Earth distance derived from the JPL Ephemeris.
Until you do, we will just have to use the data I found.
Nate says:
”I presented you with two data sets that contradict your theories, so naturally you knee-jerk reject them, but do not provide ANY alternative data!”
—————–
No you didn’t. None of your references are to datasets.
Pmod isn’t what you think it is and while I would love to get a download of the JPL dataset all you provided was a link to an article talking about it.
Nate says:
”You are more than welcome to show us alternative data for solar irradiance over time, and the distance from Earth to the sun over time.”
————
After you Nate.
Nate says:
You shamelessly and falsely accused the authors of being a political organization. Stoopid
————–
You are the stoopid one if you think the WMO isn’t a political organization. Go to their website. They have a congress and everything to vote on the science. thats not how science is done.
Nate says:
The other data set is from a site that posts astronomical data, and it makes clear that the data comes from the JPL Ephemeris, which is a widely used and respected data set of calculated positions of the planets as a function of time.
—————
You seem to be talking about the Fred Esplanak dataset that only gives the results of his calculations allegedly using the jpl database. Neither the calculations or the dataset is made available in the links you gave.
And I haven’t yet seen an ephemeris that calculates the distance of the planets. Instead they all calculate the direction and inclination the planets are day by day. If distance data is in the jpl dataset please give me access to it. As I understand it the jpl dataset is just an expanded version that includes many other objects than the sun, moon, and 8 planets to obtain the precision related to the massive acceleration placed on space craft that they use to get places a lot faster. You seem to think that planet earth is immune to this acceleration and you have provided nothing of help whatsoever. What you have provides so far is useless for anything except actual solar variation which articles on PMOD indicate broad disagreement on actual solar variation so which version do they actually display? Nobody actually says.
So no alternative data from you, then. Unable to find any?
Just more unsupported slander of my sources of data.
Evidence that PMOD data is biased or wrong?
Evidence that PMOD’s agenda is political?
The data on distance of the Sun comes from the JPL Ephemeris as stated on the link.
Evidence that the data is wrong??
No? Nothing? Just whining and moaning, bitching and complaining, but nothing offered.
Here is similar data for Sun-Earth distance from USNO for July 4,1800 and every 10 years thereafter
https://aa.usno.navy.mil/calculated/positions/geocentric?ID=AA&task=5&body=10&date=1800-07-04&time=13%3A32%3A26.000&intv_mag=3652.4&intv_unit=1&reps=100&submit=Get+Data
The variations are ~ 0.01 %
You can find the Sun-Earth distance on any date you want here:
https://aa.usno.navy.mil/data/geocentric
Have fun with it.
Nate says:
So no alternative data from you, then. Unable to find any?
Just more unsupported slander of my sources of data.
—————
You didn’t provide any data Nate. Thats the point I need enough basic observation data to recompute all this in a more precise fashion.
That’s the primary standard of science, enough information to replicate the work done to verify exactly what the results that were provided actually represent.
You provided no databases at all. I am not criticizing anything you sent other than there is no reason to believe any of it is relevant to what I am talking about.
I suppose you fell for the Anthony Fauci ”masks don’t work” too. Am I right?
“You didnt provide any data Nate.”
So you have no choice but to turn up the lying to 11. You are in pure denial mode now.
I have now given you 3 data sets, from three sources.
None support your claims of significant short term orbital forcing.
The sun’s flux hitting Earth has varied much much less over 40 years than you claimed it would.
The sun’s distance from Earth has varied much much less than you claimed it would over the last 40 y, and even over 250 years!
You asked for a way to access sun-Earth distance data. I gave you one from USNO.
So use it to test your theory. Don’t come back until you have bothered to do so.
Nate you gave me list of distances to the sun. I realize you believe everything your daddy tells you; but you didn’t provide the database of actual measurements or the means used to compute the distance to the sun.
FALSE
From my post above:
“You can find the Sun-Earth distance on any date you want here:
https://aa.usno.navy.mil/data/geocentric
Have fun with it.”
No doubt its coded by your moonie friend that thinks the moon accounts for the 4.57 total differences in time crossing aphelion and perihelion.
The USNO is an actual telescope making the observation. There is just simply no way the moon can account for that difference in speed.
According to your radius of the barycentric motion of the earth caused by the moon of 2900 miles the moon causes the earth to move in a circle at a rate of 667 miles per day.
But the earth in orbit of the sun is traveling over 1,590,000 miles per day. Hardly a drop in the bucket to slow the earth a total of 4.57 days or more than 7,000,000 miles short of its destination over the course on one rotation. Obviously something is being ignored here.
“caused by the moon of 2900 miles the moon causes the earth to move in a circle at a rate of 667 miles per day.”
Yep. And that can be directed away from or toward the sun from time to time.
“But the earth in orbit of the sun is traveling over 1,590,000 miles per day.”
Yep, and at aphelion or perihelion, that is NOT directed toward or away from the sun. Is it?
In fact it is directed in a direction tangential to a line directed to the sun.
Thus that is a big red herring.
As I explained several times, at aphelion, it starts getting closer to the sun, at an initial speed of 220 miles per day.
Thus the 667 miles per day caused by the Moon, if directed AWAY from the sun, can easily cancel the 220 miles of orbital motion toward the sun.
You cannot ignore basic geometry!
I have now given you the tools necessary to find the data to test your theory. Until you do and show the results, this discussion is over.
Nate says:
” Bill:”caused by the moon of 2900 miles the moon causes the earth to move in a circle at a rate of 667 miles per day.” ”
”Yep. And that can be directed away from or toward the sun from time to time.”
——————-
From time to time. LOL! like it changes directions toward the sun and away from the sun once every ~14days.
x
x
x
x
x
Nate says:
Bill: But the earth in orbit of the sun is traveling over 1,590,000 miles per day.
”Yep, and at aphelion or perihelion, that is NOT directed toward or away from the sun. Is it?”
—————-
The moon and Jupiter both move the earth in the same way. Slower or faster in its orbit except for those two moments they sit on the line drawn from the sun through the earth/
They both also affect the distance from earth to sun except for those moments when they are equidistant from the sun and earth.
x
x
x
x
x
Nate says:
”In fact it is directed in a direction tangential to a line directed to the sun. Thus that is a big red herring.”
—————-
LOL! You mean the earth is travelling perpendicular to a line directed at the sun. You are already getting confused.
But that only happens in a perfect orbit with a single speed (i.e. circular orbit) the earth stays the same distance.
In the real world other objects will affect both speed and distance as I itemized above.
x
x
x
x
x
Nate says:
”You cannot ignore basic geometry!”
—————–
The basic geometry says all the planets have an effect. And those effects vary depending upon the orientation of the perturbation. The planets have long term effects because for example a combined Jupiter and saturn effect only covers the compass in ~8 degree increments every ~60 years on every third conjunction, covering the compass in ~900 years.
Combined Uranus and Neptune conjunctions move around the compass in ~17 degree increments once every 171 years taking about 3,500 years to cover the entire 360 degree compass.
The combined gas giant planets not only exceed the moon’s motion but do it over many decades at a time affecting maximum ice melt months and seasons and amounts of water vapor in the sky in accordance with mainstream greenhouse gas philosophies.
If you want to go more than 3,500 years as a minimal climate length period then you need to look at axial tilt and precession and thats only on the assumption that the trans neptune gravity effects are minimal and that the moon and the inner planets don’t have long term effects as do the gas giants.
Unfortunately though our science community is so loyal to the public they think the public will be better off believing masks don’t work. . .and that is the crux of the problem when the public lacks the standing to get compensated for the impact of such lies.
x
x
x
x
x
Nate says:
”I have now given you the tools necessary to find the data to test your theory. Until you do and show the results, this discussion is over.”
—————
Sorry Nate you didn’t grant me the right to vote. Nor did you grant me the the right to demand that natural climate variation be intensely studied.
Then and only then can one who even has a shred of integrity can estimate what the anthropogenic contribution might be.
But you have demonstrated your lack of integrity so I don’t expect you to do the right thing at all. No doubt as you have done you will wave your hand over it and attempt to hoard the resources of production to solve the issue. Academia owes the world nothing. . . right? All they do is complain about the pay. . .right?
“In fact it is directed in a direction tangential to a line directed to the sun.”
Whoops. Correction:
In fact it is directed in a direction perpendicular to a line directed to the sun.
“The basic geometry says all the planets have an effect.”
Nice try at distraction.
But we are not talking about any other planets but Earth and the Moon!
Stop obfuscating.
“Nate says:
I have now given you the tools necessary to find the data to test your theory. Until you do and show the results, this discussion is over.
“Sorry Nate…”
So let’s be very clear. You asked for access to this data.
So I give it to you.
Now you have the opportunity to test your theory against data.
But you refuse!?
Obviously, having seen some of the data already, you must be deathly afraid your theory will be falsified!
Looks like you are doing Astrology, then!
good bye Nate. Obviously you do not want to actually discuss this issue. What is your agenda about that?
Goodbye Bill..
Your reluctance to engage honestly is noted.
Riiight…a guy discussing it with you for weeks is someone who does ‘not want to actually discuss this issue.’
This is pathetic, Bill.
I will not discuss it with you anymore, until you are ready to apply the scientific method to your beliefs–ie test your beliefs with the data that I showed you.
Nate says:
October 21, 2024 at 12:47 PM
Bill said: ”The basic geometry says all the planets have an effect.”
”Nice try at distraction.
But we are not talking about any other planets but Earth and the Moon!
Stop obfuscating.”
—————————-
Case closed!
To establish a claim for CO2 to be responsible for the warming that has been occurring over the past 40 or so years; the IPCC used Ben Santer’s statistical study that essentially claimed to have eliminated all other known natural possibilities.
Yet there is no programmatic study of the well-known Milankovic’s theories or measurements of orbital forcing by the other planets.
i.e. there is no science to rule out orbital forcing. Yet unique planetary alignments correspond to periods of warming and cooling throughout modern history.
And when somebody brings the topic up we can depend upon you to claim that somebody is obfuscating. No they are not obfuscating Nate they are pointing out that the Emperor has no clothes.
So you are in here defending ignorance. I get it. I just don’t know why.
“Nice try at distraction.
But we are not talking about any other planets but Earth and the Moon!
Stop obfuscating.
–
Case closed!”
Your post and mine prior to this one were specifically discussing the Moon’s effect on aphelion and perihelion.
Your “But Jupiter’ response was indeed a red herring, off-topic, obfuscation.
Just stop.
“Yet there is no programmatic study of the well-known Milankovics theories or measurements of orbital forcing by the other planets”
BS.
I gave you access to data of the calculated orbital distance of Earth from the Sun. All known gravity effects included!
It is exactly what you need to test your theory. But you refused to look at it!
Then you must be more interested in tro.lling then doing science.
Again proving that discussion with you is absolutely pointless.
Are you suggesting that the acceleration is caused by CO2 increasing?
I’m just reporting the 2nd order polynomial regression result here; nothing more.
“Im prepared to accept whatever result they produce”
Wow. That’s a naive thing to say.
Andrew
” time to wake up and address natural climate change via orbital forcing! ”
Apparently, the Hunter boy has discovered his newest toy: orbital forcing is now the major aspect driving climate, if not even the only one.
Sources, Hunter boy?
Here are some:
https://www.drroyspencer.com/2024/10/uah-global-temperature-update-for-september-2024-0-96-deg-c/#comment-1690394
and throw this in as well for a primer since obviously you know nothing about this or you wouldn’t be asking me.
https://science.nasa.gov/science-research/earth-science/milankovitch-orbital-cycles-and-their-role-in-earths-climate/
Bill Hunter
In your link, if you read all the way through, you would find another link that rejects your claim even with actual measured values. You might want to reconsider this line of reasoning as it has already been examined and rejected based upon available evidence.
https://science.nasa.gov/science-research/earth-science/why-milankovitch-orbital-cycles-cant-explain-earths-current-warming/
This link was at the end of your link.
Norman thats not science. It even says its just the opinion of scientists being confident all the changes in warming rates are due to CO2.
Bill Hunter’s misconception lies in his belief that earth is warmest during perihelion, currently during SH summer. He assumes that if SH summer/NH winter were extended at the expense of NH summer/SH winter, the earth would become warmer.
However, average global temperature data shows that we have the opposite effect; SH summer/NH winter (perihelion) is actually the coldest time of the year, and NH summer/SH winter is the warmest.
https://docs.google.com/presentation/d/1G1rR-RH3Nh1-FIQDgGYtaeMt_gsVG77ym-n4mVK4sxg/edit?usp=sharing
Thus, earth spending more time in perihelion leads to cooling, exactly the opposite of what Bill claims. Clear and simple.
Hunter also points to Syun-Ichi Akasofu and claim that the global warming is a “rebound” after the LIA cooling. https://docs.google.com/presentation/d/1qfU_rgVEvVB05jxfMfTTDnxt5QeEp9F4a6e9QtNcGLI/edit?usp=sharing
However, Akasofu’s hypothesis has already failed the litmus test completely, testing his prognosis against actual data. His prognosis from 2013 has already missed by 0.6 degree C. https://docs.google.com/presentation/d/1sBwDT4Ezbx9wE7WH0fG1erZfVKLkLepoz8vwlbLZRSE/edit?usp=sharing
Sig says:
Hunter also points to Syun-Ichi Akasofu and claim that the global warming is a rebound after the LIA cooling. https://docs.google.com/presentation/d/1qfU_rgVEvVB05jxfMfTTDnxt5QeEp9F4a6e9QtNcGLI/edit?usp=sharing
However, Akasofus hypothesis has already failed the litmus test completely, testing his prognosis against actual data. His prognosis from 2013 has already missed by 0.6 degree C. https://docs.google.com/presentation/d/1sBwDT4Ezbx9wE7WH0fG1erZfVKLkLepoz8vwlbLZRSE/edit?usp=sharing
—————–
His prognosis? Incorrect his paper does not call it a prognosis. He calls it a statistical analysis of the short term pattern that is in the yellow box. He didn’t elevate it to a prognosis because he had not diagnosed the cause of the oscillation.
You just made up the claim he made a prognosis when its clear in his paper he did not intend it as a prediction, forecast, or prognosis.
You guys are always making up strawmen and desperately attempting to use them to discredit somebody. And you wonder why all that accomplishes is the blemishing of your own credibility.
His purpose is stated in the conclusion of his paper. ”it is important to isolate these natural components of climate change from real temperature data.”
actually that is my conclusion also.
Bill Hunter
Akasufu writes: ” Assuming these results obtained by statistical analysis will continue throughout the 21th century, we may observe the dashed line from 2012 to 2100 as the linear extension, in conjunction with multi-decadal oscillation. ”
Whether you call it a prognosis or not. Akasufu makes a statistical analysis, and shows what this analysis will lead to of future temperatures from 2013 to 2100. He has missed badly already after just 10 years. That must either mean that his assumption of multi-decadal oscillations is wrong OR, if he is right, that a much stronger force is driving the temperature higher.
Are saying that Akasofu is correct, that natural forces have a relative strong negative impact after 2000, and therefore the anthropogenic impact is even greater than assessed by the models?
Sig says:
”Akasufu writes: Assuming these results obtained by statistical analysis will continue throughout the 21th century, we may observe the dashed line from 2012 to 2100 as the linear extension, in conjunction with multi-decadal oscillation.
Whether you call it a prognosis or not. Akasufu makes a statistical analysis, and shows what this analysis will lead to of future temperatures from 2013 to 2100. He has missed badly already after just 10 years.”
———————-
Thats certainly an interesting take. Perhaps English isn’t your first language and they come to such silly conclusions about statistical analysis in your first language.
A projection based solely on a statistical analysis assumes the past will be like the future. And if you have not identified the cause of the variation it becomes an extremely iffy proposition that the future will be like the past. You should read up on Judith Curry’s articles on climate uncertainty and the various types of uncertainty there are.
Via my more normal experience of ocean climate vs atmospheric climate, I am aware of ocean oscillations of various durations that have laid down bottom sediments associated with climate. The periods of dominance of one over the other is very interesting in terms of lengths of the periods. But these are effects and not causes.
Dr. Akasofu has been quite clear what his mission was. He wanted people to study natural climate change rather than wave their hand over it. That’s an absolute necessity to prevent corruption in science. If wrong about CO2 the entire world will be shaken by the consequences of the corruption.
And here you are cheerleading for corruption. Our educational institutions have become a massive failure in standing guard over the concept of science. Of course none of them will ever admit to having been a party to it if and when the other shoe drops.
xxxxxxxxxxxxxxxx
xxxxxxxxxxxxxxxx
x
x
x
Sig says:
”That must either mean that his assumption of multi-decadal oscillations is wrong OR, if he is right, that a much stronger force is driving the temperature higher.”
——————
Wow! Sig wings it. Yes like a large group of cars. Like on the freeway where more faster cars catch up with the slower ones pretty much at the same time.
LMAO!!
xxxxxxxxxxxxxxxx
xxxxxxxxxxxxxxxx
x
x
x
Sig says:
”Are saying that Akasofu is correct, that natural forces have a relative strong negative impact after 2000, and therefore the anthropogenic impact is even greater than assessed by the models?”
——————
I suppose that could have been true if CO2 emissions actually tracked any of these 40 and 80 year oscillations. There still is a possible place for CO2 to hide out in the data but it hasn’t yet been discovered quite simply because where it doesn’t track the emissions hasn’t yet been identified.
Bill Hunter says: His prognosis? Incorrect his paper does not call it a prognosis. He calls it a statistical analysis of the short-term pattern that is in the yellow box. He didnt elevate it to a prognosis because he had not diagnosed the cause of the oscillation.
You just made up the claim he made a prognosis when its clear in his paper he did not intend it as a prediction, forecast, or prognosis.
Akasofus 2013 paper: https://www.mdpi.com/2225-1154/1/1/4
Akasofu clearly states in his 2013 paper and in previous papers:
a) that there is a near linear component due to a gradual recovery from the Little Ice Age (LIA) of 1800~1850
b) the multi-decadal oscillation, with an amplitude of about 0.2 C and a period of about 5060 years; to consider that temperatures multi-decadal change is closely related to the PDO, a natural phenomenon.
He projects the future temperature trend based on the assumption that these are the dominant factors. The projection fails miserably. Either his assumptions are wrong, or the temperature trend is a result of another dominating factor he has not accounted for in his statistical analysis (e.g. GHG).
——————————————————————
Bill says: Dr. Akasofu has been quite clear what his mission was. He wanted people to study natural climate change rather than wave their hand over it. Thats an absolute necessity to prevent corruption in science. If wrong about CO2 the entire world will be shaken by the consequences of the corruption.
Clearly his natural climate change factors do not explain the current temperature trend, so the only thing this should shake is his own (and yours?) understanding of the main factors driving the global warming.
Where have you been?? Natural forces are extensively studied, and the following diagram was included already in the earliest IPPC reports:
https://docs.google.com/presentation/d/19Cv9DRbm5Db7wzLk4a-flSDI57wj1EtuTUgpUo8d5jM/edit#slide=id.p
But I fully agree with your following statement, that Akasofus paper is very iffy: A projection based solely on a statistical analysis assumes the past will be like the future. And if you have not identified the cause of the variation it becomes an extremely iffy proposition that the future will be like the past.
——————————————————————
Bill says: I suppose that could have been true if CO2 emissions actually tracked any of these 40 and 80 year oscillations. There still is a possible place for CO2 to hide out in the data but it hasnt yet been discovered quite simply because where it doesnt track the emissions hasnt yet been identified.
Which oscillations are you referring to? The ones that Akasofu failed to substantiate? IPCC has stated that GHGs became the dominant factor from the 1970s onward. Before that, other factors played a more significant role, such as the rapid increase in aerosols from industrial pollution after WWII and large volcanic eruptions in the 1960s, both of which contributed to temporary cooling.
If you have a look at the following graph, you will find the correlation between CO2 levels and temperature to be excellent during the last 50 years. And there absolutely no correlation with the solar activity during this periode.
https://docs.google.com/presentation/d/1G6k7yE4wPW6tJ0aY9Akl_cu0LYiYLX2SwieN81NC1qU/edit#slide=id.p
——————————————————————
Since it seems you no longer rely on the extremely iffy Akasofu paper to explain recent warming, I understand better why you are so focused on finding another explanation that avoids attributing it to CO2. And your answer points to short-term orbital changes.
Earlier, you provided perihelion and aphelion shifts for three different days (link below). But that limited data is clearly insufficient to determine whether these shifts have the duration and impact necessary to drive significant temperature trends, let alone explain recent warming. Unless you can provide stronger evidence to claims, these remain just imaginary.
So, put up, or shut up!
https://www.flickr.com/photos/200300772@N06/54040306340/
Sig also goes 100% ”my daddy told me so”.
Move along folks there is nothing to see here. Why are you directing traffic sig?
Bill Hunter says: ” Move along folks there is nothing to see here. ”
Exactly, he has nothing to show. His claim that short-term orbital changes causes recent warming is exactly that: Nothing, nothing to see! It is a hoax.
So Sig while you play traffic cop for Russian and Chinese disinformation let me point out how you can’t even do that well without sabotaging your own case.
Your link here you put up to show the correlation with CO2, sunspots, and temperature.
https://docs.google.com/presentation/d/1G6k7yE4wPW6tJ0aY9Akl_cu0LYiYLX2SwieN81NC1qU/edit#slide=id.p
The correlation with your sunspot presentation is very consistent up until about the late 1980’s about the time the disinformation program started on CO2. Is this Russian and Chinese disinformation? More about that later.
Is this Russian and Chinese disinformation?
It is right in time with the conversion of both countries from misguided egalitarian world conquering communism to the greed of world conquering fascism.
Then a huge problem for your chart is CO2 is inconsistent as well, in fact it isn’t at all consistent up until the 1980’s.
Its a tale of two different worlds. What happened? did CO2 smooth out natural climate change? Not eliminate it just shave off all the peaks and valleys? How the heck does it do that? Our public institutions are filled with a lot of witless people.
————–
Then we can transition to your ipcc graph:
https://docs.google.com/presentation/d/19Cv9DRbm5Db7wzLk4a-flSDI57wj1EtuTUgpUo8d5jM/edit#slide=id.p
It is also completely inconsistent with the temperature record.
Its completely missing the natural warming elements that caused the warming bump of 1910 to 1944. What are they hiding? Oh thats right one must always use ”Mike’s trick” pulled on a willing IPCC to ”hide all natural climate change that one can get away with.
Oh no doubt you will start handwaving it away, playing traffic cop that there is nothing to see here so just move along. thats a given that you witlessly offered it up in support of your point of view.
Fact is there has been no substantial work on Milankovic since the 1970’s again right in time with the rise of fascism mentioned above. We know who some of the fascists are, the Russians and Chinese pretty much top the list.
And consistent with this a cabal was formed in the western nations centered in the Universities that are hugging all these fascists.
Hmmm, no consistency with CO2 until then. . . down to your silly IPCC graph. . . .which was empaneled when? Oh gee it was 1988.
———————-
Lets move on here:
OK you linked Akasofu’s paper. Golly this is a terrible paper because it shines a light on the obvious that the cabal wants to bury deep.
https://www.mdpi.com/climate/climate-01-00004/article_deploy/html/images/climate-01-00004-g001.png
Lets examine this graphic in Akasofu’s paper.
It is a temperature record and it shows several trends of different periods.
Sure one could match the change in recent trends to a CO2 influence but I would like to point out that the steepest yellow line trend could easily be moved to the early 20th century warming and be an almost perfect fit there as well where no trend line currently exists.
So what is going on? We want to know. And you claim that we are doing enough to find out simply doesn’t pass the smell test.
Akasofu goes on to show supporting evidence that supports those variations through history. Such as a number of tree ring proxies here: https://www.mdpi.com/2225-1154/1/1/4
You can see the climate changes in the proxy records.
And of course there is this ”killer” multiproxy support for natural climate change that the IPCC is completely silent on, just hoping that if they ignore it everybody else will.
https://www.mdpi.com/climate/climate-01-00004/article_deploy/html/images/climate-01-00004-g003.png
——————-
And as a final comment. Lets change the approach to the sunspot record that you provided above and I said we would discuss later.
Fact is there are folks on this board that have observed that this record is a player in natural climate change as detailed by the chart you offered that shows consistency of sunspots to the 1980’s. In fact NOAA used to have a chart on the internet matching up that consistency. Now it seems they feel better not talking about it.
But I produced this chart off the actual sunspot record. It is a running mean of 30 years of sunspots. Why 30 years?
30 years is a good choice because we know that every solar cycle flips the magnetic polarity of the sun in what is known as the ”solar magnetic field reversal”. we have folks for years being concerned about the potential effects of that.
Since solar cycles range from 9 to 14 years. 30 years is a good number of years to capture that activity.
Here is the result.
https://flic.kr/p/2qk8Nga
Here we see an astonishing coincidence with the temperature record including the major dips. whats screwed up about the graph is only recently where solar activity suddenly dropped significantly below the trend line starting around 2008, when solar activity did drop off and as of yet we see no temperature response to that since that single event happened.
We can also see that all the major changes on the chart have preceded climate change, suggesting a causal relationship.
All we have to do here is realize there is more to life on earth due to solar spectral brightness changes.
I am also concerned that science has flipped on solar spots being hot areas. They now think they are cold areas and not UV. You mean they are about the temperature of my kitchen stove electric burner set on medium low? LMAO!
they do have an explanation that its because massive magnetic effects are preventing the light from getting to the sun’s surface. But that just sounds like another wacko academic theory like polar bears going extinct, or the world economy collapsing in the 1970’s by over population. these things seem to live on until somebody actually measures it or time proves it to be a junk hypothesis.
———————
so what are we left with. A long term record consistent with solar activity. And shorter termed 80 year warming periods consistent with planetary movement and orbital forcing as displayed in the early compilation papers of Milankovic’s work ignored via stone silence since and handwavers like you, Nate, and Barry.
You can piss and moan about somebody pointing that out. You can claim that science has covered everything. But what we are left with is inconsistent and incomplete. Obviously the system needs a return to academic freedom where top independent researchers are no longer driven into obscurity by the cabal.
Even talking about it gets the cabal after you. The suppression of opinions on social media being led by the cabal and big dollars to elected officials from Russia and China is a serious problem that needs a serious response.
Bill Hunter,
Drunk??
And no further mention of the short-term orbital changes that align perfectly with the two warming trends during 20th century?
So Sig while you play traffic cop for Russian and Chinese disinformation let me point out how you can’t even do that well without sabotaging your own case.
Your link here you put up to show the correlation with CO2, sunspots, and temperature.
https://docs.google.com/presentation/d/1G6k7yE4wPW6tJ0aY9Akl_cu0LYiYLX2SwieN81NC1qU/edit#slide=id.p
The correlation with your sunspot presentation is very consistent up until about the late 1980’s about the time the disinformation program started on CO2. Is this Russian and Chinese disinformation? More about that later.
Is this Russian and Chinese disinformation?
It is right in time with the conversion of both countries from misguided egalitarian world conquering communism to the greed of world conquering fascism.
Then a huge problem for your chart is CO2 is inconsistent as well, in fact it isn’t at all consistent up until the 1980’s.
Its a tale of two different worlds. What happened? did CO2 smooth out natural climate change? Not eliminate it just shave off all the peaks and valleys? How the heck does it do that? Our public institutions are filled with a lot of witless people.
————–
Then we can transition to your ipcc graph:
https://docs.google.com/presentation/d/19Cv9DRbm5Db7wzLk4a-flSDI57wj1EtuTUgpUo8d5jM/edit#slide=id.p
It is also completely inconsistent with the temperature record.
Its completely missing the natural warming elements that caused the warming bump of 1910 to 1944. What are they hiding? Oh thats right one must always use ”Mike’s trick” pulled on a willing IPCC to ”hide all natural climate change that one can get away with.
Oh no doubt you will start handwaving it away, playing traffic cop that there is nothing to see here so just move along. thats a given that you witlessly offered it up in support of your point of view.
Fact is there has been no substantial work on Milankovic since the 1970’s again right in time with the rise of fascism mentioned above. We know who some of the fascists are, the Russians and Chinese pretty much top the list.
And consistent with this a cabal was formed in the western nations centered in the Universities that are hugging all these fascists.
Hmmm, no consistency with CO2 until then. . . down to your silly IPCC graph. . . .which was empaneled when? Oh gee it was 1988.
———————-
Lets move on here:
OK you linked Akasofu’s paper. Golly this is a terrible paper because it shines a light on the obvious that the cabal wants to bury deep.
https://www.mdpi.com/climate/climate-01-00004/article_deploy/html/images/climate-01-00004-g001.png
Lets examine this graphic in Akasofu’s paper.
It is a temperature record and it shows several trends of different periods.
Sure one could match the change in recent trends to a CO2 influence but I would like to point out that the steepest yellow line trend could easily be moved to the early 20th century warming and be an almost perfect fit there as well where no trend line currently exists.
So what is going on? We want to know. And you claim that we are doing enough to find out simply doesn’t pass the smell test.
Akasofu goes on to show supporting evidence that supports those variations through history. Such as a number of tree ring proxies here: https://www.mdpi.com/2225-1154/1/1/4
You can see the climate changes in the proxy records.
And of course there is this ”killer” multiproxy support for natural climate change that the IPCC is completely silent on, just hoping that if they ignore it everybody else will.
https://www.mdpi.com/climate/climate-01-00004/article_deploy/html/images/climate-01-00004-g003.png
——————-
And as a final comment. Lets change the approach to the sunspot record that you provided above and I said we would discuss later.
Fact is there are folks on this board that have observed that this record is a player in natural climate change as detailed by the chart you offered that shows consistency of sunspots to the 1980’s. In fact NOAA used to have a chart on the internet matching up that consistency. Now it seems they feel better not talking about it.
But I produced this chart off the actual sunspot record. It is a running mean of 30 years of sunspots. Why 30 years?
30 years is a good choice because we know that every solar cycle flips the magnetic polarity of the sun in what is known as the ”solar magnetic field reversal”. we have folks for years being concerned about the potential effects of that.
Since solar cycles range from 9 to 14 years. 30 years is a good number of years to capture that activity.
Here is the result.
https://flic.kr/p/2qk8Nga
Here we see an astonishing coincidence with the temperature record including the major dips. whats screwed up about the graph is only recently where solar activity suddenly dropped significantly below the trend line starting around 2008, when solar activity did drop off and as of yet we see no temperature response to that since that single event happened.
We can also see that all the major changes on the chart have preceded climate change, suggesting a causal relationship.
All we have to do here is realize there is more to life on earth due to solar spectral brightness changes.
I am also concerned that science has flipped on solar spots being hot areas. They now think they are cold areas and not UV. You mean they are about the temperature of my kitchen stove electric burner set on medium low? LMAO!
they do have an explanation that its because massive magnetic effects are preventing the light from getting to the sun’s surface. But that just sounds like another wacko academic theory like polar bears going extinct, or the world economy collapsing in the 1970’s by over population. these things seem to live on until somebody actually measures it or time proves it to be a junk hypothesis.
———————
so what are we left with. A long term record consistent with solar activity. And shorter termed 80 year warming periods consistent with planetary movement and orbital forcing as displayed in the early compilation papers of Milankovic’s work ignored via stone silence since and handwavers like you, Nate, and Barry.
You can piss and moan about somebody pointing that out. You can claim that science has covered everything. But what we are left with is inconsistent and incomplete. Obviously the system needs a return to academic freedom where top independent researchers are no longer driven into obscurity by the cabal.
Even talking about it gets the cabal after you. The suppression of opinions on social media being led by the cabal and big dollars to elected officials from Russia and China is a serious problem that needs a serious response.
Sig says:
”And no further mention of the short-term orbital changes that align perfectly with the two warming trends during 20th century”
Wow good job Sig. You just did point it out in your own sources. Keep up the good work.
Bill Hunter says: Here we see an astonishing coincidence with the temperature record including the major dips.
https://flic.kr/p/2qk8Nga
I do not see any temperature record on your chart.
whats the matter Sig. Can’t find a temperature record to look at?
Bill,
Oh, yes – I have already shown you temperature data and sunspots. You have not, and still claim an ” astonishing ” correlation.
As a matter of fact, the correlation is extremely poor, even before the most significant rise in CO2. https://docs.google.com/presentation/d/1G6k7yE4wPW6tJ0aY9Akl_cu0LYiYLX2SwieN81NC1qU/edit?usp=sharing
Sig says:
Bill,
Oh, yes I have already shown you temperature data and sunspots. You have not, and still claim an astonishing correlation.
As a matter of fact, the correlation is extremely poor, even before the most significant rise in CO2. https://docs.google.com/presentation/d/1G6k7yE4wPW6tJ0aY9Akl_cu0LYiYLX2SwieN81NC1qU/edit?usp=sharing
—————–
Yes poor correlation in your chart because you haven’t figured out what NOAA figured out several decades ago. An 11 year smoothing simply doesn’t tell the story. You need to go longer. Such as my 30 year smoothing that combines solar cycles of both magnetic polarities.
Here you can see that there has been a 324 year increase in solar brightness since the LIA. https://flic.kr/p/2qk8Nga
When looking for correlations via smoothing you need to find out what should be included.
Fact is SW radiation is almost entirely absorbed into the ocean 85-90% of it. So you are going to have a delay currently believed to be around 10 years for it to be realized. Plus its unknown what the effect on climate is via the polarity switching.
So if you use my chart the correlation is improved over the long term. And if its improved its a better measure by capturing the full effect over a long period of time. Thats why people show linear increases in the data smoothing out all the variations.
As to the variations themselves. You may or may not see correlations. In the case of the sun spot records you can see them better over 60 year smoothing (thats what NOAA learned decades ago)
finally you also have to learn to walk and chew gum at the same time. Solar insolation forcing is variable by two distinct and separate means.
One is solar brightness changes, and the second is by orbital forcing.
Sometimes they coincide and sometimes not. As it is now we are just about 17 years into a ”smoothed” gentle decrease in solar forcing.
We also have pulses in the data that are almost exactly 20 years apart.
This is highly suggestive that the strong 20 year Jupiter Saturn conjunction events that move the sun way over a million miles has some inducement to sunspot creation. But as solar scientists contend the sun has a dynamo that spins up and down. Both can be true at the same time.
Jupiter alone moves the sun about 1,800,000 miles (900,000 to each side) every ~6 years. On a 20 years schedule it includes Saturn at an imperfect integer ratio. 3.33:1.
so that 20 year effect is varied because of the ratio not hitting on an integer.
But it does hit pretty much square on the head every ~60 years with a ratio of 3:1 to that 20 year pulse. (and 10:1 to the Jupiter 6 year pulse and 4:1 to the Saturn 15 year pulse), thus 1940 peak lines up real well with the peak around 2000 and the peak back around 1880.
the current peak is unusual because Jupiter conjoined with Neptune in 2022 and Uranus in 2024. Saturn is set to pass Neptune soon. And of course that volcano, the El Nino, and solar max have all been going on too.
Here is a demonstration of the barycenter effects. I am not sure how many planets and objects are programmed into this model but its a good primer on the effects of orbital forcing showing the motions of the sun around its barycenter. https://i.sstatic.net/VSleF.gif
So this orbital forcing is likely more robust than short term solar brightening seen in a solar cycle or even 2 or 3 cycles.
However solar brightening may be a significant contributor over the 384 year period that we have observations of the sun.
Add in the feedback from glacial retreat beginning in the 2nd half of the 19th century will increase the temperature effect.
So practice walking and chewing gum at the same time here. And if you want to include a CO2 element . . . learn to walk, chew gum, and juggle 3 balls in the air at the same time.
Think about lowering the sensitivity number to make room for it as I am increasing seeing the strong possibility that sensitivity is well below 1.0. (sensitivity below 1.0 is negative sensitivity). In fact thats what Roy found when he did his sensitivity work.
Its just been having a hard time being accepted because negative sensitivity isn’t supportable under the assumption there being only one major climate variable running positive.
The current estimate of sensitivity based on observations for a single climate variable is set at about 1.7 or 1.8.
But no doubt you being a loyal card carrying party member you are still hanging in there with that 3.0 sensitivity.
I can’t help you there beyond recommending you gain the scientific skepticism to wonder how natural climate variation created the temperature variations in the past that can’t be duplicated by climate models.
But that would entail the ability of the world and your imagination actually being able to walk, chew gum, and juggle 3 balls in the air at the same time.
Bill,
You are writing a lot of B S.
You just said there was an ” astonishing ” correlation between sunspots and temperature. SHOW ME that astonishing correlation!
I just added a 22 year average for sunspots. It does not help your argument a bit. https://docs.google.com/presentation/d/15mZNTUyv-QKkyHAVN58WpX6_u2FVhx_eN51itOjUxvA/edit?usp=sharing
Put up, or shut up!
what are you talking about Sig. I already gave it to you with this chart of the 30 running mean of sunspots.
https://flic.kr/p/2qk8Nga
Bill,
Your chart lacks temperature data, making it entirely ineffective for verifying your “astonishing” correlation with solar activity.
It’s also rather surprising that your plot suggests the Little Ice Age (LIA) ended before 1700. Surely, the high solar activity during the 18th century must have caused some warming, didnt it? This contradicts Akasofu, who states in the paper you previously referenced that the LIA ended between 1800 and 1850. Have you made a new groundbreaking scientific discovery?
The question you need to ask yourself sig before bleating out such claims is whether we have a sizeable length record of glacial extents thru the 18th century. We know glaciers were advancing in the early 19th century post Dalton solar minimum but did they shrink before that
As always there are climatic variations, Bill.
During LIA three particularly cold periods are recorded; first began about 1650, second about 1770 and the third in 1850 (NASA). The timing of these effectively kills your “astonishing” correlation with solar activity, see your graph.
https://docs.google.com/presentation/d/13IT_u1sQ4m85aq1Wtd7aEI7UGV2olbwV1FT1Y4sGsu8/edit?usp=sharing
Well you should be aware that the word ”astonishing” is not a scientific ”quantifying” term. Instead its a ”relative” term which all of moral relativists should be aware of.
In this case I will offer a temperature record and the thing that is really astonishing.
https://flic.kr/p/2qk8Nga the sunspot record
and here is a temperature record along with why its astonishing.
Examine the relative fits.
https://co2coalition.org/wp-content/uploads/2021/04/CET.jpg
And of course be sure to apply your criteria to both Sig.
I lacked the time to jump in this subthread.
The Hunter boy wrote to Norman
” Norman thats not science. It even says its just the opinion of scientists being confident all the changes in warming rates are due to CO2. ”
Firstly, I don’t belong to the gullible morons who trust anything coming from the ‘100% neutral, absolutely disinterested CO2 coalition’ just because they say the contrary to what the Hunter boy claims not to be science.
Especially, comparing SSN to CET (!!!) is quite a bit brazen.
*
I have made lots of comparisons of the Sun Spot Number to temperature time series during the last 10 years.
I do it here once more with HadCRUT (it could be BEST as well).
Since SSN and HadCRUT (here: rev. 5) have very different value ranges, the best way to compare them is to uniformly scale the time series to percentages of their respective maximum:
https://drive.google.com/file/d/1F3D_GQ5i05wnu0J9r65fS0Zu17E6cUSp/view
You see for both SSN and HadCRUT 30 year running means since 1850; the 360 months in the front windows are always empty, and hence the graph starts with Jan 1880 instead of Jan 1850.
The Hunter boy should be able to recognize the SSN curve from his Flickr picture:
https://flic.kr/p/2qk8Nga
*
I spare us the CO2 stuff; anyone knows how it would look like.
*
I’m not very confident however that the Hunter boy will accept the SSN vs. HadCRUT graph.
Simply because people like him who dare to discredit the amazing work of hundreds of physicists, astronomers and mathematicians who computed the lunar spin since 1750 as ‘academic exercise’ never accept any contradiction.
Bindidon says:
” ” Norman thats not science. It even says its just the opinion of scientists being confident all the changes in warming rates are due to CO2. ”
Firstly, I dont belong to the gullible morons who trust anything coming from the 100% neutral, absolutely disinterested CO2 coalition just because they say the contrary to what the Hunter boy claims not to be science.
Especially, comparing SSN to CET (!!!) is quite a bit brazen.
I have made lots of comparisons of the Sun Spot Number to temperature time series during the last 10 years.
————————-
First on the ”gullible morons”. I don’t trust anything coming from anybody. I don’t have a daddy. The only daddy I ever had passed away decades ago.
But one is supposed to in the audit trade analyze the motivations of those who provide the data you audit as to what their motivations are.
the questions you answer are: they marginal employees who are disgruntled or unreliable or have a history of dishonesty. Do they profit or do the institutions they work for profit from a certain outcome. Whats in their contracts AFA bonus programs go, etc.
On that score the CO2 Coalition gets a very high score. Generally they are successful thus not marginal. Second they are not profiting from their work as most of it goes against the institutions they work or worked for if retired. And bonus programs essentially come from annual budgeting by the institutions as to who is going to get the most funds.
But that doesn’t get the coalition a card to pass Go for me. I just means that they don’t deserve extra scrutiny as would somebody else who scores lower on the bias chart.
Its well known in the audit trade that if you ignore this you are indeed a ”gullible moron”.
I did notice they got a lot of push back for using Alley 2005. Even from Alley. I found that interesting and read the Carbon Brief on it carefully and carefully examined the alternative that Carbon Brief offered up and found nothing significant in it in conflict with the Alley work.
Seems to me it is all about folks fighting over influencing ”gullible morons”. They don’t like the other guys because they don’t agree and fear they might steal some ”gullible morons” from their zone of influence.
that kind of behavior doesn’t help your honesty score as it exemplifies a fear of competing ideas. That’s a strike against you not one for you.
that said:
I recognize that solar brightness is likely the weaker influence as compared orbital forcing. Seems Hays et al 1976 and possibly Milankovic agrees with that as they don’t even mention changes in solar brightness.
So the question I am testing is what is overriding this generally
warming influence of solar activity since the Maunder minimum (and by extension the nadir of the LIA).
You didn’t seem to address that question at all, when clearly that’s what I have been working on.
You seem ultra-concerned about anybody who asks a question as opposed to dutifully playing the role of a ”gullible moron”.
Where does that come from?
And what I said wasn’t science is the claim that orbital forcing doesn’t exist. Its actually what creates the bumps in your favorite temperature record and did so moreso before the record got remodeled. It also is within the range of error in every temperature record I have looked at so far. So claiming it doesn’t exist simply isn’t supported by science from my perspective. I am not willing to be your ”gullible moron” and believe anybody without substantiation.
You on the other hand seem disturbed by that.
Where does that come from?
As expected: instead of a real, technical reply to my technical comment, a stubborn, opinionated, superficial post whose relevance is inversely proportional to its length, based on a mix of own guessing and polemical, political aspects.
This is not reasoning, Hunter boy: I call it ‘robertsoning’.
A good reason to avoid communicating with you in the future.
So Bindidon walks out of the room waving his hands in the air without any curiosity about what the insolation effects are on earth from Jupiter, which Nate says has no power to change the position of the earth.
Yet we see that the planets of solar system do move the sun around a barycenter that moves about 2,000,000 miles over the course of 40 or so years.
Of course its dragging the earth along with it, but the variation in earth distance from these planets affecting that suns movement varies by about 186,000,0000 miles more than the sun does due to the earth’s orbit around the sun.
Its very clear this has a measurable effect. I calculated it and it is in the range of around 30%-40% of the total effect which fits the size of Milankovic’s 2,500 year cycle. (using Jupiters 5.2au from the sun versus the range of earth (4.2au to 6.2au).
It might be in total a little less as most planets will not have as much variance as Jupiter. But some like Venus might have more. It would just be that the venus variation will be much shorter lived.
Its obvious that solar brightness examination alone that has managed to reduce the variation of the sun during cycle 24 down to about a watt or so difference isn’t the major issue for why institutions pin the solar constant across a range of 20 watts. But these examinations are over very short periods of time and there may be a much longer effect of increasing in intensity over 300 years or so. Its not responsible for the 60 year pattern in warming bumps we have seen as Jupiter and Saturn conjuctions have occupied a small sliver of the sky (about 16 degrees roughly 3 conjunctions 60 years apart between roughly 1880 to 2000) and corresponding to peaks in the warming rate. But off the 2000 conjunction evidenced by the maximum displacement of the sun to the left of the sun in the barycenter chart we are having an revisit to that max displacement zone only 20 years later.
This chart shows it happening forward a bit further forward from the other chart I posted. (note this chart is flipped looking from the other side of the sun) We see a double large displacement happening on the opposite side of earth’s orbit of the sun over 30 years from the mid 1950’s to the mid 1980’s. On a cooler side of the sun favoring cool conditions by slowing the orbit through aphelion and speeding it through perihelion.
Then we see a large displacement repeating itself on near the opposite side from 1996 to the present.
Next comes a medium large displacement beginning around 2035 in a sector of the sky that hasn’t been visited over the past 80 years. Who knows what is in store for us out there. This can be easily estimated but it will require access to the databases that support this and some programming. Why hasn’t this already been done? Why do we hear lies instead that Jupiter is too weak to move the earth? Where is the support for a claim that we calculated and came up with this and it doesn’t matter to the climate record.
The answer of course is it does matter. Milankovic knew it mattered. The scientists that have done some statistical analysis of the ice age parameters know eccentricity is not a linear parameter. . .and have said so in the sources I have provided here in the past week.
And I am not claiming here that this is proof CO2 adds up to zero. I am merely making the case that this needs to be modeled and included in the category of natural climate variation without any shenanigans like we have seen in the past that has created the huge rise in skepticism.
IMO, the bumps in the temperature record and the ice core records are reflections of this variability. the work I have done confirms a strong association. Actual attribution needs to deal with deal with feedback momentum which is going to vary in intensity. We need to verify the impacts prior to the anthropocene, before the 1960’s when aerosols started a dramatic drop in ozone and its UV absorbing ability and before carbon emissions took off. Obtain the real values of natural climate change. then deal with the anthropocene. If we don’t do that we are swinging blind.
Our institutions need to do better. Be better.
I see Hunter has written a lot of new BS since I last checked.
He claims that drawing a straight line over the last 400 years proves an “astonishing” fit between sunspots and temperature!
https://www.flickr.com/photos/200300772@N06/54037789807/
https://co2coalition.org/wp-content/uploads/2021/04/CET.jpg
I really hope Bill is just joking, displaying an highly elevated sense of humour! An alternative interpretation would be far less flattering…
The long Central England temperature record is important and interesting historical data. But the data show a huge scatter, and are not global.
In his “analysis” Bill seems to overlook the fact that factors other than sunspots influence the temperature. Many of the most significant temperature drops during 17th and 18th centuries can be directly attributed to major volcanic eruptions, as demonstrated in this graph:
https://docs.google.com/presentation/d/1LIozfIEvxZnovuRtnCTaYGuQWUHj9Z7HH1NJsoqswv0/edit?usp=sharing
Notice the significant drop in temperature around 1700, which can be directly linked to the Huaynaputina eruption, the largest recorded volcanic event in South America. Despite this, Bill attempts to explain it by compressing the Maunder minimum to barely 20 years. However, sunspot records clearly indicate that the Maunder Minimum lasted around 70 years, which would completely undermine his correlation.
As my graph illustrates, the overall correlation between CO2 levels and HadCRUT temperature data is quite “astonishing”.
Sig says:
”In his analysis Bill seems to overlook the fact that factors other than sunspots influence the temperature. Many of the most significant temperature drops during 17th and 18th centuries can be directly attributed to major volcanic eruptions, as demonstrated in this graph”
You obviously have not been following the discussion Sig. I tend to believe there are numerous drivers of climate.
That notion actually fits Roy’s point of view as witnessed by his latest post. The more positive drivers: orbital forcing and solar brightness being two major positive influences do nothing but degrade the impact of CO2. Its already been heavily degraded by simply the rate of warming. Add in the obvious positive influence of solar brightness degrades it even more. Orbital forcing? Well it does appear we entered a new phase of positive orbital forcing since at least 1980. CO2 though rapidly increasing since 1950 couldn’t override the negative orbital forcing even with the help of increasing solar brightness.
Your graph tracks CO2 very poorly. At the start CO2 is increasing while the temperature per HC5 is decreasing. Then around 1910 temperatures start warming fast and do so until 1944 then cool without any help from CO2.
September was also the 2nd highest anomaly in the entire dataset, beaten by April at 1.05 C.
Truly a remarkable couple of years in the record. I’d question the instruments or processing of the data, but GSAT corroborates (it will be interesting to see the September anomalies for the surface datasets). This is a ‘Tenberth’ moment, where we can’t yet account for the distribution of energy to make sense of this.
barry, are you pretending you never heard of the HTE?
I was pinning the step up on HTE. But why the lag?
Are we puzzling over the lack of a step down from a mighty step up, when we should be wondering why 2020 to 2023 was so cool? Global airline traffic plummeted during that time. Perhaps contrails cause warming…
What is HTE?
luke, HTE is the “Hunga-Tonga Effect”. It was caused by the huge underwater volcano that launched millions of gallons of water into the Stratosphere. The combined effect includes atmospheric waves that disrupted the Polar Vortex, a REAL greenhouse effect from the water vapor, and possible yet-to-be determined effects from the chemistry of chlorine and ozone.
The atmospheric waves have subsided, but the water vapor has been slow to leave the Stratosphere.
Such a massive underwater eruption has not been observed in modern satellite times, so it’s a learning experience.
Interestingly, when he talks about Hunga Tonga, GHE and global warming denier Clint R always hides the fact that not only 150 Gt water were ‘launched’ up to the stratosphere (everybody now knows this), but also a more decent though substantial amount of sulfur dioxide.
Who wants to get more info about the HTE looks best at the sources linked to in the document
Hunga Tonga-Hunga Ha’apai Volcano Eruption Research
2022 – 2025
https://csl.noaa.gov/news/topics/hthh.html
Bindi has become my most ardent stalker. And, like the other children in his cult, he can only resort to insults and false accusations.
He’s frustrated because his cult beliefs don’t hold up under the scrutiny of science.
That ain’t my problem….
Given that Clint has always denied the GHE, that cold gas in the atmosphere can’t warm the Earth’s surface, etc, it is interesting that he admits here that stratospheric water causes a GHE.
Dang Nate, you actually got something right!
Yes, CO2 and H2O spectra are very different. Water vapor can actually emit some photons with the “right stuff”.
Keep learning.
It’s amusing to see Clint admitting the GHE exists after arguing long and loud for the opposite, claiming it’s impossible because of the 2nd Law, and that a cooler source of radiation cannot add energy to a surface warmed by a warmer source. I do believe the H2O in the stratosphere is a lot cooler than the surface…..
How quickly he abandons his long-held position while arguing in favour his latest hobby-horse.
“right stuff”
What is that? Clint approved stuff?
It ain’t physics.
barry says:
Its amusing to see Clint admitting the GHE exists after arguing long and loud for the opposite, claiming its impossible because of the 2nd Law, and that a cooler source of radiation cannot add energy to a surface warmed by a warmer source. I do believe the H2O in the stratosphere is a lot cooler than the surface..
How quickly he abandons his long-held position while arguing in favour his latest hobby-horse.
———————-
You are weird and really confused Barry.
I don’t think that cold CO2 can add heat to the surface as that would be a violation of the 2nd law.
But if you FIRST make the atmosphere warmer it will THEN AND ONLY THEN cause the surface to warm, but not by adding heat to it; but instead by slowing the loss of heat received directly from the sun.
Thats because the surface has a dual cooling system. Radiation and conduction/convection. The convection accelerates cooling at both the surface and at the top of the atmosphere by rotating in cooled gases at the surface and uncooled gases at the top.
This merely highlights the leap in logic your side makes that namely the simple presence of additional CO2 in the atmosphere will cause the surface to warm and then cause the atmosphere to warm. Whoaa wait a minute! Did you just move the cart from the back of the horse to the front of the horse?
Seems you did.
But you have a problem left. Already all the radiation in the CO2 band is being absorbed and mixed in the atmosphere. So how does collisions between molecules of the atmosphere cause the atmosphere to warm? You haven’t explained that.
The whole idea is based on laser technology of a directed beam of CO2 light and how much of that reaches a detector without getting scattered. this seems more like a river boat shell game than science about where the pea is.
Same deal with Tyndall’s experiment. The heat got scattered.
So the focus needs to change to what warms the atmosphere.
Seim and Olson show that the atmosphere in their box warmed as efficiently with common air as it did with CO2.
Makes sense to me as conduction and convection warm the atmosphere whether it has GHG or it doesn’t. Most of passive solar heating technology is based on that.
Seems all that GHG can do is cause the surface to get as warm as the atmosphere.
And the limit on that is some value where the accumulation of convection from death valley on a hot summer morning keeps warming the atmosphere until the atmosphere is as warm as that hot summer day in Death Valley.
So there are significant unknowns in the so-called greenhouse theory. So-called because it hasn’t ever been fully described.
Maybe we need to give a good look to see if orbital forcing and/or solar brightness variations
Orbital forcing isn’t studied and as near as I can tell hasn’t been since Milankovic stopped working on it.
So yes I can see that GHG are necessary to warm the surface to the same temperature as the atmosphere as a non-GHG atmosphere would be hotter than the surface due to the explanations above when you have a surface that fluctuates its temperature over the course of a day.
but I think its thought that is how warm the surface is today. So it might behoove us to look toward areas where solar insolation varies to pin that down rather than just wave a hand over it and declare it by fiat rather than science as being impotent. Especially when you have Milankovic saying thats not true and a number of scientists agreeing that Milankovic’s eccentricity variable is not linear.
Where is the science that says it is? There is none folks. This graph shows that to be the case. The barycenter of the sun is flying all over the place in just a few decades such that it would be difficult to fit it in a square box with dimensions 3 times the diameter of the sun without tilting the ecliptic plane.
Bill,
You are confused about who is making what argument. I was referencing Clint’s argument all the way.
“But if you FIRST make the atmosphere warmer it will THEN AND ONLY THEN cause the surface to warm, but not by adding heat to it; but instead by slowing the loss of heat received directly from the sun.”
Yep, that’s how it works in simple terms. This description has in fact been stated here hundreds of times.
The saturation argument has been debunked over and over. How about you educate yourself instead of me doing it for you?
barry says:
”Yep, thats how it works in simple terms. This description has in fact been stated here hundreds of times. ‘The saturation argument has been debunked over and over. How about you educate yourself instead of me doing it for you?”
Indeed, and the dispute is whether CO2 can uniquely warm it. Convection also warms the atmosphere and as Seim and Olson demonstrated it warms it has efficiently as does pure CO2 using common air with current CO2 levels in it.
In case you haven’t noticed it the Seim and Olson experiment tested that and found saturation had already occurred.
https://www.scirp.org/pdf/acs_2020041718295959.pdf
Thats a demonstration of that fact Barry. If you want to claim that Seim and Olson has been debunked then provide us the science paper that established that claim. But I would wager all you have for evidence is that your daddy told you so.
So you didn’t want to educate yourself. Too bad.
The only consequence of a ‘Tenberth’ moment is that you will be able to successfully and consistently grow crops 1 degree latitude further North.
‘Climate crisis’ is not evident in any salient data.
Oh, and more extremely damaging events like Helene.
And Rising Tree Cover Loss Amid Increasing Forest Fires: https://ibb.co/JqBD6HG
There is no way to attribute Helene to climate crisis narrative.
There is no trend in fire data. The paleological data suggests that there have always been more fires than there are now as a result of fire suppression efforts.
Yes there is a trend.
Data on forest fires reveals that they now consume at least twice as much tree cover as they did 23 years ago. In this context, “loss due to fires” refers to the direct loss of tree canopy cover caused by both natural and human-ignited fires.
Fire is also making up a larger share of global tree cover loss compared to other drivers like mining and forestry. Fires only accounted for about 20% of all tree cover loss in 2001, they now account for roughly 33%.
https://ibb.co/JqBD6HG
Climate change is a key factor driving the increase in fire activity, as rising temperatures dry out landscapes, creating conditions that are more favorable for larger and more frequent forest fires.
I think your brain is Heavily Saturated with bad information.
5 year 10 year and 15 year average are all the same.
https://www.fs.usda.gov/managing-land/fire/wofambrief/firestats
See the spike early 1900s. Way more acreage burned as now.
https://en.wikipedia.org/wiki/Wildfires_in_the_United_States#/media/File:US_Burn_Acreage_1916-2010.png
“Climate change is a key factor driving the increase in fire activity, as rising temperatures dry out landscapes, creating conditions that are more favorable for larger and more frequent forest fires.”
The problem of human interference with the forest cycle is a much larger factor. We’ve been attacking forest fires with water bombers for a hundred years with the net result that there is a lot of fuel on the forest floor. Now if a fire gets started its almost impossible to put out.
Here is Jasper Fire critique of bad forest managem ent being responsible.
https://www.youtube.com/watch?v=4l7RXI3o9eg
“There is no way to attribute Helene to climate crisis narrative.”
Yes there is. Meteorologists agree that the unusually warm T of the ocean in the path of the hurricane can result in rapid intensification and greater rainfall amounts.
The ocean has warmed due to GW.
You’d have to show there is a trend of more frequent more severe hurricanes. A one of severe weather event like Helene isn’t an indicator of climate change.
Recall Helene was a Cat 4; not a hurricane that is unprecedented on the scale.
Yeah, I feel for the people who got impacted from the record rains and the ensuing flooding, but its not climate change; its just weather.
So in your expert opinion, a warmer ocean should have no effect?
Other things matter as well, but all else being equal, a warmer ocean enables stronger hurricanes.
The physics is well understood.
“Recall Helene was a Cat 4; not a hurricane that is unprecedented on the scale.”
But have become a regular occurrence in the last 20 y. And ‘rapid intensification’ is a recent phenomenon.
Ken, search for Global Forest Watch if you’re are genuinely interested in understanding the magnitude of the issue.
Ken
Why did you only show a link to Wiki’s top image and none to the bottom one?
https://upload.wikimedia.org/wikipedia/commons/thumb/a/a0/Wildfire_acres_burned_in_the_United_States%2C_OWID.svg/1280px-Wildfire_acres_burned_in_the_United_States%2C_OWID.svg.png
“The only consequence of a ‘Tenberth’ moment is that you will be able to successfully and consistently grow crops 1 degree latitude further North”
Non sequitur – you probably don’t know what I’m referencing, but using it to shoehorn in your ‘views’.
” ‘Climate crisis’ is not evident in any salient data.”
You’re unable to separate science and rhetoric, it seems.
Nate says:
”But have become a regular occurrence in the last 20 y. And rapid intensification is a recent phenomenon.”
Lets not forget that before the 1970’s wind speeds are mostly measured by on shore weather stations. Now we use all sorts of technologies of measuring the wind speed as it nears the shore. Dropsondes, stepped frequency microwave radiometers, and doppler radar.
this plethora of technologies only allows us to actually detect something like rapid intensification. Its certainly not a new natural phenomena and so far the jury is out of any of these measures have actually become more frequent. Unless of course you actually have a major source of using the most modern technologies over time to establish your claims. I haven’t heard about it. It remains an unproven hypothesis like most of the stuff surrounding climate change and polar bear extinction events, population bombs, peak oil, New York freezing over from a collapse of the MOC, collapse of agriculture, New Yorks East Highway under water, 1 meter of sea level rise by 2030. etc.
“before the 1970s ”
Which is 54 years ago. That leaves 30 y or so, without rapid intensification, which has become regular in the last 20 y.
Whatever Nate. The 1970’s is when they developed the dorpsondes. I doubt they do rapid intensive work with hurricane hunters. Most likely that is the satellite based observing technologies that have 24/7 coverage on specific areas of the globe. Obviously not the 70’s
Its also obviously not a new phenomena. The frequency may be increasing but what is the science study you have in support of that notion?
Or are you just doing your typical promotion act in support of whatever it was your daddy told you?
Last science I heard on this was from Pielke that pooh poohed those claims of disaster as false. Please link your claims to sources like the rest of us. What your daddy told you isn’t a reliable science source. What we call that is lobbying by multi-billion dollar corporations fishing for fat contracts from the government. Go away!
Milton, yet another one that rapidly intensified to cat 4.
https://www.foxweather.com/weather-news/tracking-hurricane-milton-florida-southeast
“Major Hurricane Milton explodes to Category 4 strength ahead of potentially life-threatening Florida landfall”
Timely new post from roy
https://i.sstatic.net/VSleF.gif
The global sea surface temperature is back to breaking records, even with the cooler central Pacific. Suggests we have may entered a new normal of elevated ocean temps.
https://climatereanalyzer.org/clim/sst_daily/?dm_id=world2
Tellingly, they haven’t been updated for a week because the data center is in Asheville, NC, destroyed by Hurricane Helene.
As I pointed out in my most recent YouTube video, the U. of Maine Climate Reanalyzer had begun to provide more regionally-detailed sea surface temperature data that is quite informative with respect to North Atlantic and Gulf of Mexico tropical storm data. As Helene developed and moved into the Gulf of Mexico it was encountering record sea surface temperatures in the Gulf, which led to rapid intensification and an extremely wet storm. Not only did this lead to record storm surges in parts of Florida, but also record rainfall as the storm moved northward. That combined with saturated ground from earlier rains led to historic destruction in many areas. For those of you who are interested, the link for my YouTube video – “Regional Data Show Dangerous Sea Surface Temp Increases” is
https://youtu.be/fsxLa0C7FGU
Comments are welcome.
Mark,
A somewhat similar thing happened in central Europe 3 weeks ago, cold air from the polar region raced to the south and met hot Mediterranean Sea air and created the 5b trough that led to a disaster. 400+ mm or 40+ cm (16+ inches?) within 5 days, most of it in 48h. Similar outcomes in CZ and Poland. The ground in those areas affected in Austria was not particularly saturated, because unprecedented high summer temperatures (mostly July, Aug and Sep) led to more evaporation. These values aren’t as high as those 30 inches in the Appalachia region of course, to reach those higher values one must usually go to Italy where severe weather is probably more comparable to the US than the “moderate” northern neigbors. Nevertheless, one of the rivers in Vienna had water levels that occur only once a millenium and I fully expect these events more frequently in the future.
WHAT IS THE MONCTON PAUSE?
Christopher Monckton of Brenchley devised a procedure in which an ordinary least squares regression is performed on monthly UAH TLT values such that there is one linear trend value calculated per month which includes all of the completed months occurring after it. You then find the first occurrence (by month and year) of a zero or negative value. That marks the start of the so called Monckton Pause.
https://tinyurl.com/monckton107
Things have been very quiet around the third Viscount of Brenchley’s pause for at least a year now…
Yes, indeed.
This could be the longest pause ever recorded in the appearance of Monkton’s articles
I genuinely hope he is okay. He disappeared seemingly overnight.
Well said.
His articles always invited a certain amount of ridicule, but I wouldn’t wish any ill on him.
“What is the Monckton pause?”
It’s the product of a cherry picking algorithm.
The particular cherry picked is the longest interval to present of zero or less slope in global average temperature anomaly data.
Skewed. Broke. No Explanation.
Andrew
You’ve mentioned this every month but haven’t provided any evidence to support your claims. How do you account for the corroboration of this anomaly with the surface datasets?
John,
The evidence is the graph itself. The implication is that whatever is being represented no longer operates the way it has. And because there is no explanation for the skew, and because it’s a highly contrived presentation to begin with, the logical conclusion is that we don’t know that the graph is meaningful.
Corroboration is irrelevant.
Andrew
Skewed. Broke. No Explanation.
The evidence is in Andrew’s comments themselves.
Willard
Someone here needs to learn what skew is.
“Corroboration is irrelevant”
No it’s not. 4 independent sources using completely different data than UAH get the same result.
What’s irrelevant is the fatuous hand-waving about this.
skeptikal
You wrote:
” Roy, this is clearly a step-up that has to be questioned. Have you found any reason that this could occur? ”
It’s interesting to see how the lower troposphere (UAH 6.0 , NOAA STAR and RSS 4.0) behave compared to the surface (GISS V4 and Had~CRUT 5) since Jan 2020:
https://drive.google.com/file/d/1s2N27WGL5N5hJejXO_ZtCiSdbRWVSkxh/view
(Had~CRUT 5 till July, RSS and STAR till August 2024)
*
Why should UAH’s step-up be questioned, when even the surface has shown in 2023 departures quite similar to those of the troposphere?
” Corroboration is irrelevant.
Andrew ”
Really?
The idea that tarted-up lines squiggle similarly proves something is not scientifically robust, as they say.
Andrew
Thanks a lot for your absolutely non-committing blah blah, Bad Andrew.
Come back to us when you have more to show than your personal gut feeling.
Are Hurricanes Getting Stronger?
“Hurricane Helene has brought out the usual claims that global warming is making hurricanes more powerful, a belief fed by disinformation in the media.
I have even seen a remarkably silly comment by somebody today that they when they look at report of Helene, they can see climate change happening.
Two simple pieces of fact show this to be nonsense.”
https://wattsupwiththat.com/2024/09/30/are-hurricanes-getting-stronger/
Be sure to read Nick Stokes’ comments.
Be sure to read ALL if the comments.
“if the”
…of the…
“Why should UAHs step-up be questioned”
The why has already been provided. You just pretend you didn’t read it.
Andrew
As best I can tell your argument is supported solely by the result shown by UAH; not by any specific deficiency you feel exists as part of producing that result. That is what I like to call a “nuh-uh” argument or argument by incredulity. Arguments of this form do not resonate well with us curmudgeonly skeptics.
They way you capture the attention of us curmudgeonly skeptics is to clearly explain the deficiency in the methodology, how it caused the wrong result, how to get the right result, and what the right result actually is so that we can compare and contrast the two approaches.
As it is right now we tend to follow Hitchen’s Razor. We can be asserted without evidence can also be dismissed without evidence.
“As best I can tell your argument is supported solely by the result shown by UAH”
There’s your why, Sherlock.
Andrew
Right. So I hope you understand why I’m dismissing your argument.
“I hope you understand why Im dismissing your argument”
I sure do.
Andrew
It’s not just UAH.
The surface datasets are showing the same pattern.
Look at the monthly global means here.
https://data.giss.nasa.gov/gistemp/graphs_v4/
“The surface datasets are showing the same pattern.”
Entropic,
What does that prove? Does it explain the cause of the UAH skew?
Why distract from the issue?
We know why. You have a narrative to perpetuate. I don’t have that baggage.
Andrew
Bad Andrew
You are not thinking it through.
The surface datasets are measuring temperature by sampling station and ocean buoy data.
UAH is inferring temperature from oxygen microwave emission in the atmosphere.
They are both measuring temperature, by completely independent methods. The only link between them is the environment they are measuring.
If they both show the same pattern it is because that pattern is present in the environment. It is real, and not an artefact generated internally by UAH.
Entropic man
” It’s not just UAH… ”
Exactly.
Unfortunately, according to ‘https://www.ncei.noaa.gov’,
‘NCEI in Asheville has been significantly impacted by Hurricane Helene’.
I thus can’t access the most recent RATPAC radiosonde data, otherwise I’d have shown one more of these ‘irrelevant corroboration’s.
Do you also question the data at those time when UAH is far BELOW the surface data?
Let’s compare sausages.
UAH sausage resembles X’s sausage.
That means there is nothing wrong with UAH sausage.
Yeah.
Andrew
How much nothing can one man try to sell?
“If they both show the same pattern it is because that pattern is present in the environment.”
That’s a belief of yours. Your religion, I would submit.
Andrew
Andrews,
Your personal incredulity is not an argument.
It is lazy logic.
It’s not even logic.
SOLAR MINIMUM UPDATE
In the case of Helene, climate change caused it to drop 50 per cent more rainfall in some parts of Georgia and the Carolinas, and made those record rainfalls up to 20 times more likely, reported researchers at Lawrence Berkeley National Laboratory in a rapid climate attribution study released Monday. That study is based on methods used for a similar study on Hurricane Harvey, but has not yet been peer reviewed.
https://www.cbc.ca/news/science/hurricane-helene-science-1.7339012
Provisional analysis beats incredulity.
Youd have to show there is a trend of more frequent more severe hurricanes. A one-of severe weather event like Helene isnt an indicator of climate change.
Recall Helene was a Cat 4; not a hurricane that is unprecedented on the scale.
Yeah, I feel for the people who got impacted from the record rains and the ensuing flooding, but its not climate change; its just weather.
> Youd have to show
Step 2 – Sammich Request
CBC isn’t a source of credible information; its yellow journalism.
The North Carolina State Climatologist disagrees: https://climate.ncsu.edu/blog/2024/09/rapid-reaction-historic-flooding-follows-helene-in-western-nc/
Isn’t evidence; its just a severe weather event. Its likely happened before (even as its not in the very short record) and it likely will happen again.
> Isnt evidence
Step 1 – Pure Denial
From the North Carolina State Climatologist:
Talk about Heavily Saturated …
‘Step 1 Pure Denial’
Occam’s Razor isn’t about Denial.
> Occams Razor isnt about Denial.
More denial.
Are you claiming that because the CBC reported it, that the Lawrence Berkeley National Laboratory did not in fact release the study as the CBC reported?
That’s like claiming “Airplanes don’t actually fly in the air, because the CBC had an article on airplanes.”
It’s an example of partisanship breaking brains
Hitchens’s razor.
Ken,
Occam’s razor indeed. The simplest explanation is that the extra warmth of the Gulf caused the hurricane to rapidly intensify.
And the meteorolgists impressively predicted it would, using their weather models, which incorporated the warmer ocean, which provided high octane fuel to the storm.
Other factors matter. But the high ocean T factor is the one that todays hurricanes will have more often.
The sudden step up like this cannot be real , somebody has altered something
Consider this data set to be toast
Somebody has altered something.
None of the natural processes being monitored, even the HTE, have changed enough to produce this sudden step up.
This is artificial.
That’s exactly what I’m thinking too.
“Consider this data set to be toast”
Make it wheat with a “healthy” smear of butter.
Andrew
Feynman famously said, no matter how beautiful your theory, if the experiment doesn’t agree with your theory, then your theory is wrong.
For science deniers, if the experiment doesn’t agree with their beliefs, then the experiment must be crap.
Yet another case of deniers saying “I’ll listen to you provided you tell me what I want to hear”.
Before Berkeley Earth released their analysis Anthony Watts said “I am prepared to accept whatever result they produce, even if it proves my premise wrong.
After Berkeley Earth released their analysis Anthony Watts described it as “post normal science political theater.”
Or maybe it’s just natural variability superimposed on an increasing baseline.
If one wants one obvious cause of recent variability, one need look no further than ocean surface temps, which have been on the high range when not record setting for over a year. If overturning currents have brought warmer water to the surface for an extended period, of course that will warm the atmosphere.
The ocean stores most excess energy due to the GHE, so when that huge battery releases energy, what should one expect?
Good points.
Seems to me for each month this level warmth just continue, and in particular if doing so despite a solid La Nina ahead, and with the full-planet stratospheric water only very slowly residing, it’d dawn on all that it can only be the unique 200-year-or-so-recurrence HTE event behind.
Well it can’t be down to the increase in the same time in CO2.
Do you have a hypothesis that can explain how only 150 MtH2O was able to yield this much warming?
Do you have a hypothesis that can explain how the nearly 10,000 MtCO2 that accumulated in the stratosphere after the HT eruption was unable to have the same or higher magnitude of effect as the 150 MtH20?
bdgwx
Sorry: 150 Gt H2O.
bdgwx, besides the fact that even Bindi can correct you, do you have a hypothesis that can explain how 15μ photons from sky can warm a 288K surface?
Bindidon. It’s 150 MtH20.
[Wilmouth et al. 2023, DOI: 10.1073/pnas.2301994120]
[Schoeburl et al. 2023, DOI: 10.1029/2022GL100248]
“bdgwx, besides the fact that even Bindi can correct you, do you have a hypothesis that can explain how 15μ photons from sky can warm a 288K surface?”
IDK, you tell us how you think photons from cold water vapor in the stratosphere can warm the surface!
bdgwx
I apologize for the wrong correction: apparently, I found somewhere the incorrect relation
150 Tg = 150 Gt
and did not check it!
*
Clint R
” bdgwx, besides the fact that even Bindi can correct you… ”
proves us that you were exactly as credulous as I was.
Next time check it too
https://www.unitconverters.net/weight-and-mass/teragram-to-tonne.htm
*
bdgwx is 100% right: 150 Tg are 150 Mio tons and of course not 150 Giga tons.
… and 150 Mio tons water put the relation
” stratospheric water vapor aerosols due to SO2 upload ”
in a somewhat different light.
Bindi, besides the fact that you can’t get your correction right, do you (or bdgwx, or Nate, or any of your cult) have a hypothesis that can explain how 15μ photons from sky can warm a 288K surface?
I won’t hold my breath….
You don’t need to hold your breath, stubborn Clint R.
Your 15-micron blah-blah is as unscientific and meaningless as your claims about your ‘passengers flying backwards’ or ‘orbital motion without spin’.
Keep denying as vigorously as you can, that is why we need you here.
What ^ he said.
Bindi, I’ll take that as your admission that you know NOTHING about the science.
It then follows that you don’t know why physics debunks your cult beliefs.
I can live with that….
I hope you’re not tired of REALITY, Puffman.
Bdgwx keeps shoveling it to your face.
Keep proving him right.
IDK, you tell us how you think photons from cold water vapor in the stratosphere can warm the surface!
That’s correct Nate — you don’t know. You have NOTHING.
You’ve been stalking me for years, but you haven’t learned a thing.
That’s not my problem, is it?
“IDK, you tell us how you think photons from cold water vapor in the stratosphere can warm the surface!”
IDK. The salt in the water vapor from HTE is bad for the ozone. Less ozone means much deeper penetration by UV Xray and Cosmic Rays … all of which warm the surface, especially Sea Surface.
Step 3 – Saying Stuff
Willard the Luddite
I’ll ask Clint once again.
Tell us how you think photons from cold water vapor in the stratosphere can warm the surface!
So far we only get chaff to distract us from his lack of a science answer.
If he can explain how the cold water vapor in the stratosphere produces a GHE, as he claimed it would, then he will end up understanding how there is a GHE!
And that would nullify thousands of his prior comments. So I understand that Clint is conflicted here.
“The salt in the water vapor”
Huh? Water vapor is just water. That is one way to desalinate water.
Sea water contains salt.
A propos ‘salt’ vs. HTE
I read the article (not: skimmed through it)
Atmosphere injection of sea salts during large explosive submarine volcanic eruptions
M. Colombier & al. (2023)
https://www.nature.com/articles/s41598-023-41639-8
*
1. One the one hand, the authors refer to external sources in their introduction on sea salt possibly cooling the stratosphere through subsequent ozone depletion
” … The impact of these aerosols and salts at such high atmospheric levels is not well known, but postulated effects include ozone destruction[11], radiative forcing and climate warming[12], variations in mesospheric clouds[3], as well as impacts on regional and global climate. ”
*
2. On the other hand, in their conclusion however, they write differently.
” We conclude that there was a larger than usual injection of chlorides and bromides (partly transformed to HCl and BrO) to the stratosphere and mesosphere due to the submarine nature of the eruption.
However, this effect was largely compensated for by the efficient binding between sea salts and ash particles in aggregates, causing deposition of these salts in conjunction with ash in the sea or on land.
The 15 January 2022 Hunga eruption contrasts with littoral eruptions, where lava flows enter the sea and generate salt-rich steam clouds that are mostly ash-free, and where salt production and transfer to the atmosphere is millions of times greater than for average sea surface processes. ”
Draw your conclusions after reading!
Nate, you’re not smart enough to realize I no longer play your childish games. You have no interest in learning. You’re just throwing crap against the wall, hoping something will stick. You have NOTHING.
I’ve explained the physics before, but I’m willing to do it again if you show some real interest. Take 60 days off, with no commenting here. That will indicate you actually want to learn. Take the offer.
But, you won’t because you have no interest in learning.
Prove me wrong.
You keep stalking, Puffman.
Is it because you got NOTHING?
Beware dihydrogen monoxide.
“I no longer play your childish games.”
Yes we completely understand that you think people asking you for a real science explanation, with evidence, is a ‘childish game’, which interferes with your very serious tro.lling endeavors.
Thanks for proving me right again, Nate.
May be the flattening during the beginning of 21st century, and steep trend after around 2006 has to do with the rapidly increasing methane content in the atmosphere starting then. Even UAH measures a gradient of about 0.25 C/decade for 2006-2024.
https://docs.google.com/presentation/d/1D6fLDJkQ8X8z8-bTJ8Nws6pQ8ihXHGefpAZqAF1TXao/edit?usp=sharing
Sig
Why don’t you show the real origin?
https://gml.noaa.gov/ccgg/trends_ch4/
and therein
https://gml.noaa.gov/webdata/ccgg/trends/ch4_gr_gl.png
The picture above, starting in 1984, speaks a somewhat different language, doesn’t it?
Binidion says: “Why dont you show the real origin?”
The figure on the left in your link is EXACTLY the same I show on the right in my illustration. Both start in 1984, which is when methane data from Mauna Loa is available. https://docs.google.com/presentation/d/1D6fLDJkQ8X8z8-bTJ8Nws6pQ8ihXHGefpAZqAF1TXao/edit?usp=sharing
Your second link shows the annual changes in methane levels, and it is precisely this data that I used in my analysis.
However, my primary point was to highlight the relative significance of methane changes since 2006 in comparison to CO2. You apparently missed that point.
Since 2006 there has been a remarkable increase in methane levels compared to a relative flat trend in the preceding years. As you know, methane is a exceptionally potent GHG, roughly 85 times more powerful than CO2 over a 20-year period.
As my figure demonstrates, the methane increase since 2006 contributes roughly one third of the short term warming contributed by the CO2 increase.
Binidion says: The picture above, starting in 1984, speaks a somewhat different language, doesnt it?
Not really. The same picture and data tells the same story. However, while your link focuses on methane trend, it does not address the relative importance of methane compared to CO2, which my illustration emphasizes.
There are not many things that are certain about this current situation. It does look very much like a step-change, but the cause is not obvious. There was a steep rise over a few months and now a very tight range since then. In most past years, there is more month-to-month variation in the data. Has anyone else commented that September was the second hottest month ever in the record.
barry on October 2, 2024 at 7:26 AM
” September was also the 2nd highest anomaly in the entire dataset, beaten by April at 1.05 C. “
Is there a way to download the lower troposphere raw data into an Excel spreadsheet so one can work with the information?
The links to the data are at the bottom o the page on each monthly update. -Roy
We Are Closer to World War III Than We Have Been Since 1945
https://www.youtube.com/watch?v=5_YawyAze-s
Here is a song from 1980s. The more things change the more things stay the same. WWIII? Meh.
Why don’t we all just get stoned,
Get drunk and sing beer drinking songs
Between Breznhev and Begin
Khomeini and Reagan
We might as well all get stoned
Ya can’t even look at the T.V. these days,
Without gettin’ scared half to death
The eyewitness news leaves me used and abused,
And I find myself gasping for breath.
There’s strikes and inflation
And strife between nations,
The world’s in a hell of a mess
No matter who’s hurtin’
There’s one thing for certain,
The whole world will blame the U.S.
Why don’t we all just get stoned
Get drunk and sing beer-drinking songs.
Between Brezhnev and Begin
Khomeini and Reagan
We might as well all just get stoned.
The Russians don’t like us,
And we don’t like them.
The Israelis hate the Ay-rabs.
Iran and Iraq are on each other’s back
And El Salvador’s still up for grabs.
I wish they’d take Idi Amin and Khomeini
And Khadafy and all the rest,
Tie’em up to a chair,
And make’em stare and Yassir Arafat,
‘Til he uglies the whole bunch to death.
Why don’t we all just get stoned,
Get drunk and sing beer-drinking songs.
Between Brezhnev and Begin
Khomeini and Reagan
We might as well all just get stoned.
There’s mass unemployment,
And crime in the streets,
Inflation gets worse everyday,
They’re taxin’ us maximum,
And Congress ain’t axin’ ’em.
They most of my paycheck away.
Now Social Security
Has become an obscurity,
Where the hell’s all the money we paid?
Lord, if the Commies don’t take us,
Reaganomics will break us,
We ain’t got a chance either way.
Why don’t we all just get stoned,
Get drunk and sing beer-drinking songs.
Between Brezhnev and Begin,
Khomeini and Reagan,
We might as well all just get stoned
Many people who comment here seem to have a wish in mind for a particular temperature pattern. Hard scientists do not do this, they use what the data tells them. Also, some people comment with disfavour about Viscount Christopher Monckton’s “pause”. I have met Lord Monckton and satisfied myself about a high intellect and high mathematical prowess.
For many months now, as an Aussie, I have created a simple graph to show the Monckton style of pause for the lower troposphere over Australia. I do this not because I want the pause to go on forever, but because it is but one indicator of the possibility of a change in the annual to decadal pattern of these UAH temperature anomalies. Its pattern might forecast a turning point better than some other methods.
Here is the “wishful” graph to the start of October 2024 and possibly the end of the long graphs for many months to come….
https://www.geoffstuff.com/uahoct2024.jpg
The recent “peak” for Australia is rather different to global. Both await a firm explanation as to why they are relatively intense. The lack of explanation should send a message to researchers who think they know a lot about what causes temperature change. All I see is lack of understanding, but I am not a meteorologist.
This month is a little different. If I wanted to be strictly accurate (beyond the uncertainty of the data) I would use a negative trend as the criterion to select the number of months. Alas, by this criterion, we have a pause of only 9 months to now.
If however, we accept that a trend of +0.000001 is close enough to zero, then we have a pause of 8 years and 8 months to now.
I mention this “knife edge” point that appeared this month to stimulate the usual chatter. My scientific mind tells me to report only the 9 month result, because come next month, a 10 month pause is quite possible and I’ll have to make excuses and use caveats to maintain a long pause.
But then the pattern of a great deal of climate change research is to torture data until it confesses in favor of the researcher. It is a shame that so much climate change research has caveats. The oft-quoted expression that “Heatwaves are becoming longer, hotter and more frequent” is in this category. A big majority the the Australian stations that I have analyzed do not comply with this favorite chant because, hey! it is climate change research and we know how to use caveats!
Geoff S
“I have met Lord Monckton and satisfied myself about a high intellect and high mathematical prowess.”
I guess you must be easily satisifed.
Chris Monckton used to sell shirts in his local high street.
studentb,
I used to sell 4 lb paper bags of potatos at the grocery store across the road from home. So what?
Do you have a scientific observation to make here?
Geoff S
Your logic (or lack of it) intrigues me! Are you really saying that someone who sells shirts cannot be smart and good at maths?
Ultracrepidarianism.
Our Viscount is better at lording comment sections:
https://andthentheresphysics.wordpress.com/2022/10/10/how-to-lord-comment-sections/
Curses! Make that 0.16C/decade.
Monckton appears to know nothing about statistical significance, or he would not be announcing ‘pauses’ in global temperature of any period less than 3 decades worth of satellite data.
If he knew about statistical significance, he would first establish a linear trend, and then determine a period immediately after that trend that was statistically indistinguishable from zero trend, but statistically significant in its difference from the previous trend.
Because a ‘pause’ indicates that something was happening before it. therefore you have to show that the period after is different, and that the difference is statistically significant.
Barry,
Like several of us who comment on climate blogs, we sometimes adopt a method of analysis or image style that is widely used by others.
An example is the common fitting of a linear least squares line through time series of temperature data. This implicitly assumes that the relation between the Y and X variables is linear, though tests of linearity are seldom shown alongside. I rather dislike that method but it seems to be expected, so I add it.
Similarly, some of Lord Monckton’s articles are mimics of Establishment papers by using the same input data – commonly from IPCC – but a different way to analyse and interpret. Sometimes his critics say that there are errors in his data when it is IPCC data.
I suspect that this type of thinking is related to your comment above. I see nothing much wrong with using an approximate way to measure and display a “pause” even when simplified for wider comprehension.
It needs not be perfect, because the input data are commonly imperfect. In the graphical example I gave here about the pause over Australia, minor variations in input can/will cause major changes in output. I show a very small trend of 0.000001 and remark it is close to zero. If the September UAH result was not 1.16 but was 1.12, the trend would calculate as negative. This places a burden on the uncertainty estimate, to answer if 1.16 is statistically different to 1.12. Given the low importance of the pause exercise as a general interest topic, it is not worth the fuss to develop it. Geoff S
There is no “IPCC data.”
Like Monckton, you do not analyse what is being paused to compare against the alleged pause.
Which makes the entire exercise fatuous. As fatuous as deliberately seeking out end points in a longer data set that give you either the smallest trend possible or a negative trend.
Commonly called cherry-picking.
GS: This places a burden on the uncertainty…”
Just like Monckton you don’t even consider uncertainty in your analysis. And Just like Monckton your pause lacks statistical significance.
I include more details in my response to you on WUWT.
https://wattsupwiththat.com/2024/10/02/uah-global-temperature-update-for-september-2024-0-96-deg-c/#comment-3977572
I have children and grandchildren.
I came to this site many years ago hoping to find sound evidence that the scientific consensus regarding AGW was wrong.
Unfortunately there was no such evidence, just wishful thinking.
Alas, having had a thorough scientific education when young, I am tied to the mast and cannot respond to the siren song of the AGW sceptics.
So how much of the warming recorded at ground stations does your science allow you to ascribe to non-fossil fuel warming – i.e. natural, UHI, deforestation etc?
I believe that the proportion of observed warming due to fossil fuels is about 150%. Other influences add up to a cooling effect, which offsets part of the FF-driven warming. Bindidon has the numbers, I think.
“your science”
It’s just science.
“So how much of the warming recorded at ground stations does your science allow you to ascribe to non-fossil fuel warming”
IPCC assesses (from a range of studies) several percent of warming due to deforestation, and a negligible amount from UHI.
Not much natural has been in the warming direction over the last 50-100 years, though reduction in global aerosols may account for some in the last 20 years.
On non-climatic timescales, all sorts of quasi-periodic and cyclical processes contribute to short-term warming and cooling (eg ENSO, volcano activity, sun-spots etc), to greater or lesser degree.
Dixon
The literature suggests 105% of the observed warming is due to fossil fuel emissions and other human activities.
The natural drivers; orbital changes, intensity of sunlight etc are measured as cooling the Earth by 0.01C/decade and the observed warming over the last decade or so has been about 0.2C/ decade.
That makes the actual artificial warming rate 0.21C/decade.
The recent step up has thrown that into doubt. We could now be warming considerably faster.
Dixon.
I notice that after many years at a warming rate of 0.13C/decade the UAH warming rate is now 1.16C/decade.
That is an increase in the rate of warming of 0.03C/decade or 23%.
Most people in the world live on urban area [or the land surface] and it causes warmer conditions in fairly large area, and this called the Urban Heat island effect. And it can increase the average temperature in the region by as much as 10 C.
This is suppose to be not counted as effecting global average, because it’s very small portion of the global surface area.
But if the concern higher air temperatures effecting humans, these areas have most of the humans living in these regions.
Or humans living in cities are causing a significant amount warming to most humans. And there is no doubt about this.
Cities tend to be badly governed, and one might say, the need of living in large cities is no longer “necessary” as human technology advances.
In terms of the “natural world” we are living in an Ice Age, human evolved in the Ice Age [as did polar bears]. In in terms natural life most evolved in much warmer world. Ice Ages are rather rare in the history of life on Earth.
In last 10,000 years, we have living in the Holocene interglacial period. In terms the last 2 million years of human existance, most of the time has not been during times of interglacial periods, rather it’s been during glaciation periods.
And human civilization has evolved during the warmer period of the Holocene interglacial.
Yje warmer interglacial periods are better conditions for life and humans to live in. And there is no doubt, that we will return to another glaciation period and have short periods within the glaciation period which are particularly cold.
And peak sea level rise of Holocene period occurred over 8000 years ago, where global sea level were 1 to 2 meter higher than present global sea levels.
Elliott Bignell
” Other influences add up to a cooling effect, which offsets part of the FF-driven warming. Bindidon has the numbers, I think. ”
No I don’t.
I’m busy enough with satellite, radiosonde and surface data processing.
*
However, I just made a comparison of over 6000 GHCN daily CONUS stations to their subset (400) located in/at airports:
https://drive.google.com/file/d/1Y6RnFCGM8QcnpWx6aog9eH1tlVCytEiK/view
Linear trends for the period 1900-2024, in C/decade
– 6000-set: 0.06 +- 0.007
– 410 AP-set: 0.07 +- 0.008
– NOAA Climate at a Glance: 0.09 +- 0.009
https://drive.google.com/file/d/1VWtPOzRRQo3yg8Pnuv6oLnkCFy1HYDBE/view
Linear trends for the period 1979-2024, in C/decade
– UAH: 0.19 +- 0.03
– 6000-set: 0.23 +- 0.03
– 410 AP-set: 0.27 +- 0.03
– NOAA Climate at a Glance: 0.27 +- 0.04
Draw your conclusions.
Entropic man.
I don’t think you actually answered my question.
I persist because it’s important for a policy response. There’s plenty of ‘noise’ on any temperature data set – of course it’s not really noise, it’s signal, but we are happy to call it ‘natural variability’ or ENSO etc and happily assume steady state when it comes to the sun, in spite of the huge diurnal signal on clear sky days…
Those advocating fossil fuel use reductions need to explain how much of a warming trend is from fossil fuel use. If you claim it’s 100%, I’d like a reference to the IPCC figure please.
And as for ‘whose science’…
https://www.science.org/content/article/controversial-russian-theory-claims-forests-don-t-just-make-rain-they-make-wind
Hells, maybe it’s just not going to go back down this time.
It will definitely go down. And I believe it is still capable of going somewhat negative during La Ninas … but only given the change of baseline a few years ago.
Agreed. On the old baseline I would have bet money we’d never get a negative anomaly absent something cataclysmic. I think there’s an even chance we won’t see negative values on the new baseline again. The trip dip la Nina of the early 2020s saw precisely two negative anomalies, neither deeper than -0.04, for example.
“maybe” it’s not.
or “maybe” it is.
I used to be indecisive…
but now I’m not so sure.
Maybe you are or maybe you aren’t.
Keep cool you all, and remember how long it took to escape the recent, very strong La Nina.
Since Earth’s total atmospheric greenhouse effect is ~ 0,4C, how much could the 0,04% CO2 contents in atmosphere participate in that ~ 0,4C greenhouse forcing?
–
https://www.cristos-vournas.com
You know you can look this up instead of depositing a link to your website? Do you get a commission whenever someone clicks on it?
“Since Earth’s total atmospheric greenhouse effect is ~ 0,4C…”
This reflects nothing in the literature.
You really should look it up.
barry,
“This reflects nothing in the literature.”
–
https://www.cristos-vournas.com
Christos,
https://scholar.google.com/
Thank you, barry.
“Do you get a commission whenever someone clicks on it?”
–
It is time for you to visit:
https://www.cristos-vournas.com
I’ve read that the atmospheric CO2 concentration of 0.04% is about the same as the proportion of dissolved solids in coffee. I’m guessing that means an americano rather than a ristretto, but it’s an interesting way to visualise the proportions anyway.
Thank you, Elliot.
“its an interesting way to visualise the proportions anyway.”
Now, please, visit,
Link: https://www.cristos-vournas.com
SOLAR MINIMUM UPDATE
> The person Musk is quoting here is Marko Jukic, whose writing was once syndicated in white nationalist Richard Spencer’s publication and who has advocated for the “segregation and separation” of Jews.
https://bsky.app/profile/rmac.bsky.social/post/3l5lbu4au5t2h
Happy Thursday America.
Republican Tina Peters, the screaming, kicking, election interfering sh!tgibbon, was sentenced today to 9 years in prison.
In case you forgot, she’s Colorado’s best-known election denier, the former Mesa County Clerk and Recorder who was found guilty of four felony counts for helping Trump breach the county’s election computer systems in an elaborate election tampering scheme.
What really disgusts me about Peters and the other fake electors is that she truly believes her vote matters more than yours or mine. The arrogance of these people pisses me off. Karma she so richly deserves.
That speech was something:
https://www.threads.net/@ronaldfilipkowski/post/DArJ67-SU7f
That’s not how the Democrats stole the 2020 election. They did it through mass mailing of ballots, fraudulent registrations and large numbers of drop boxes.
Very fine people on Donald’s side:
https://www.justice.gov/opa/pr/sixty-eight-defendants-charged-indictment-dozens-members-and-associates-california-white
Stephen P Anderson
If you post is correct than why did not Trump team present it as evidence in Court.
You do know this reality correct about the cases that went to court and there was not enough evidence for the cases to move forward.
https://en.wikipedia.org/wiki/Post-election_lawsuits_related_to_the_2020_U.S._presidential_election
No one stole the election. You are believing false narratives and lies. Stop the nonsense and start thinking.
“If you post is correct than why did not Trump team present it as evidence in Court”
Because courts refused to hear the complaint.
https://apnews.com/article/joe-biden-donald-trump-pennsylvania-elections-us-supreme-court-5cc6aee8c328c7bb1d423244b979bcec
There is no secret that larger turnouts tend to help the Democrats. Incompetent and lazy voters also tend to vote Democrat. Democrats are the ones offering free stuff from the government. Lazy voters who just check boxes and would not otherwise make the effort to study the issues and go to a polling place might spend a few minutes checking boxes and mail the postage-free ballot.
The problem is that once the ballots go out, the ones that come back have to be counted. The election was fairly counted. The question of sending ballots to everyone whether they requested it, is a different issue. The problem with counting ballots days and weeks after election day needs to addressed. Winning is not enough, People need to trust the result.
Nancy Pelosi tried to pass a bill that would require ballots to be mailed to every adult whether they requested it or not (here come the fact checkers –Nate your up!).
“Because courts refused to hear the complaint.”
Misleading statement. No surprises.
Some courts heard the evidence and all of those found against the plaintiffs on election fraud.
Some courts dismissed the cases because they were insufficiently presented (ie, no real evidence).
Some courts dismissed for lack of jurisdiction.
60+ court cases all failed. Of those, 12 were presided over by Trump-appointed judges, and about half were presided over by Republican judges.
We can also consider the views of Trump-appointed departments, like the DoJ, the department of Cybersecurity and a host of others, not to mention Republican governors and other conservative state officials who ratified their state’s results, as well as many in Trump’s own circle who are on the record as having told him there was no there there.
We can also look to the many recounts that were done in each closely contested state, even by pro-Trump groups (eg, Arizona), who found no serious discrepancies with the official tallies.
If you want to believe conspiracy theories, go right ahead.
There is discussion here about the honesty of the 2020 US Federal election.
With the time difference US to Australia, I watched the counting of votes and made notes that I have kept. The notes show Trump leading in several key States until (as the famous cartoon says) “Then a miracle happens”. Those comfortable leads in several States became small deficits in the space of a few minutes.
As this happened, I threw down my pen in disgust at the obvious tampering. Statisticials over the next few days calculated huge odds against this series of breaks, all in the same direction at the same time in different places.
If I had been President Donald Trump at the time, I would certainly have cried Foul and sought remedies. I suspect many US voters felt likewise.
I’d be interested to hear from any reader who has evidence that such illegalities did NOT happen, especially readers who dealt with numbers as part of their work over many years.
Geoff S
https://www.adn.com/nation-world/2024/02/15/conservative-group-tells-judge-it-has-no-evidence-to-back-its-claims-of-georgia-ballot-stuffing/
Every Right-Winger Accusation is a Confession.
He makes Richard Nixon look like a fucking saint!
” ‘Then a miracle happens’. Those comfortable leads in several States became small deficits in the space of a few minutes.”
Also in Australia I watched the pre-election jostling with Trump claiming fraud many months before the election and calling foul on mail in ballots well before the election happened. At the same time, pundits were pointing out that in many places with mail ballots, particularly where the vote was tight, we would see an early swing to the Republicans, and then a later swing to Democrats when batched of mail voted were tallied, as Democrats tend to do mail votes more than Repubs.
I also well remember Trump urging his followers not to do mail-in votes but vote on the day, potentially exacerbating ‘red mirage’ that often happens as votes are counted in battleground states.
Then, when the red mirage happened just as pundits from both sides of politics has been explaining prior to the election, people like you, Geoff Sherrington, appear to have not only been ignorant of it, but have remained so ever since.
In every battleground state where the votes mattered there were recounts, Geoff. Multiple recounts. Non-partisan recounts, and even partisan (pro-Trump) recounts verified the results.
Your incredulity is far more suspect than the election ever was, Geoff. Don’t you see how Trump manipulated the narrative to serve his big lie? You bought it hook line and sinker.
But join the throng who ignore Republican judges dismissing the court cases or hearing them and finding against the plaintiffs. Ignore Trump’s inner circle, on record, saying he was told there was no fraud. Ignore Trump’s DoJ and Cybersecurity department confirming the same, as well as the Republican governors and Secretaries of State in those battleground states confirming the same. Georgia’s election board was predominantly Republican, too, and they verified the results despite Trump.
It’s unbelievable the extent of the suckering Trump achieved with his big lie. You’re just another rube, Geoff.
Yes Geoff S, it happened as you stated.
The claim is that the turn-around came with the counting of mail-in ballots. But even it that is true, the fact that most of the mail-ins were for Biden is curious, as the US is divided about 50-50.
We’ll never know what the real vote was. That’s why the election system needs to be cleaned up — including requiring proper identification and severely restricting mail-in.
Norman,
Are you a US Citizen? Then you should know the answer. There is absolutely no way to litigate an American Presidential Election between the November election day and certification in January where one party practices coordinated widespread cheating. How can you bring that kind of evidence to court that quickly? You can’t and the Democrats know it. It will also take a LE agency like the FBI to investigate and take at least a year or longer. By then the election is long gone and the media will do everything they can to propagandize, obfuscate, and interfere with the investigation. The FBI has no interest especially when it is the Republicans who lost. The FBI and DOJ are part of the Deep State Federal Worker apparatus. But, let me give you an example. Georgia and Texas both went for Trump in 2016 by about the same percentages. They are both red states. In 2020, Texas went for Trump by the same percentage as 2016 but he lost Georgia by about 12,000 votes. What was the difference? Mass mailed ballots. Texas didn’t allow mass mailing of ballots and hundreds of drop boxes. Georgia did. The Georgia Secretary of State and Governor usurped the legislature and unconstitutionally changed election law. They hated Trump and still do.
Also, in answer to Barry’s ignorance or propaganda above, the audits and recounts proved nothing. They were auditing and recounting ballots that had already been opened and counted with the outer envelopes discarded. You don’t think the Democrats thought of that? The Democrats have practiced their cheating craft for many decades and even centuries. Have you ever read the history about Tammany Hall? That’s what Democrats do, they cheat if they can and feel they have to and can get away with it. They did it in the battleground states because the courts, SOS and Governors let them get away with it. California, Illinois, and New York are gone. They don’t have to cheat in those states. Compare California and Pennsylvania. In California the mail in votes almost exactly matched the walk in votes. Not in Pennsylvania. In Pennsylvania they were almost diametrically opposite with Trump winning the walk in voting but losing the mailed voting. Why? Because there is no way to have secure election with mass mailing of ballots.
Ark,
You come across as a Marxist ideologue. I doubt you are a US citizen although there are a few US citizens who post who are Marxist ideologues. Can I ask, where is your Marxist utopia? Where has it ever been?
“the fact that most of the mail-ins were for Biden is curious, as the US is divided about 50-50.”
It’s not at all curious when this occurs in states where Democrats send more mail-in ballots than Repubs in every election, and when Trump had multiple times urged all voting Republicans to turn up on the day and not do mail-in votes. It is not at all curious that Democrats took the COVID issue more seriously the Republicans, and were more apt to mail their votes in in 2020.
It is not at all curious when pundits on both sides of the aisle anticipated this outcome (the “red mirage”) in the months leading up to the election.
What is curious is the apparent wilful ignorance and forgetfulness on this topic from people who have no real proof of widespread election fraud but still want to believe.
“There is absolutely no way to litigate an American Presidential Election between the November election day and certification in January where one party practices coordinated widespread cheating. How can you bring that kind of evidence to court that quickly?”
Litigation of election issues before and just after elections are expedited by the US judicial system.
“How can you bring that kind of evidence to court that quickly?”
You either have the evidence or you don’t. If all you have is suspicions then you don’t have a case.
And this is exactly what happened. Those cases that were dismissed and not heard presented suspicions instead of evidence. Most of it was hearsay. And much of that hearsay misunderstood how elections actually work, revealing the paucity of even the hearsay.
The story is very clear. Trump claimed fraud months before the election actually happened, and ramped up this rhetoric as it approached, without one scintilla of evidence because the election hadn’t occurred.
The serious lawyers around him – such as his own DoJ – told him that there was no evidence of widespread fraud, so he went hunting for lawyers who told him what he wanted to hear and ended up with the Rudy Giuliani Sidney Powell pantomime. Ardent followers concocted their own theories, some of which were picked up by the Giuliani show, and they got reams of worthless testimonial.
True believers are on this board right now crying fraud and not realizing that they are presenting speculation instead of evidence.
Even Fox News saw it coming:
November 1, 2020
“Because a higher percentage of Pennsylvanians who requested mail-in ballots are Democrats, there is the potential for a ‘red mirage,’ which describes a situation where Republican candidates, like President Trump, may appear to have an outsized amount of support as votes are reported on Election Day followed by a shift toward Democratic candidates in the days that follow.”
https://www.foxnews.com/politics/pennsylvania-red-mirage-officials-voter-patience
This phenomenon was explained all over the news before and after the election.
Ste… I doubt you are an American citizen although many Americans are conspiracists too. I doubt you are even a human being since you sound just like a bot. Everything you say is right out of the conspiracists’ playbook.
Barry,
The pandemic was used by the Democrats as a tool to facilitate the cheating. Judges, Governors and Secretaries of State unconstitutionally changed election law which is the purview of the legislatures. That fact alone should have stopped certification in those battleground states. Also, how can you verify the veracity of mass mailed ballots, which is what was done? Also, the audits are a joke. They assume all ballots are legitimate ballots. There is now way to determine that.
Stephen,
I see you are ignoring the rebuttals and are now trotting out the usual laundry list of stolen election BS.
“The pandemic was used by the Democrats as a tool to facilitate the cheating. Judges, Governors and Secretaries of State unconstitutionally changed election law which is the purview of the legislatures.”
This is yet another one-sided, misleading bit of disinformation.
Republican authorities also made voting more accessible in 2020 in some states, whether the legislature or governor or sec of state. And there are varying rules, state by state, on who has the authority to change what component of voting rules.
Arkansa’s Republican governor and sec of state in 2020 authorised mail-in ballots for anyone concerned about COVID. Arkansas was Republican at every level of state government.
The Iowa sec of state mailed out ballots to every voter. This in a state that was Red on every ticket. Iowa was Republican-dominated at every level of state government.
In Kentucky the Republican sec of state and Dem governor agreed to making voting more accessible during the pandemic. Some of these changes, like earlier voting, were later made law by the Republican-dominated legislature.
Republican-appointed judges also dismissed pre-November conservative election suits or heard and ruled against them. Someone upthread pointed to SCOTUS shutting down conservative cases. SCOTUS is Republican dominated 6 to 3!
Republican judges and judiciaries have also upheld some of the 2020 voting access changes on appeal. The Georgia Supreme Court, which is staffed almost entirely with Republican-appointed judges, dismissed a Republican-led effort to thwart early voting in 2022 on appeal.
Sure, Republicans tend to want to restrict voting access and Dems tend to want to expand access, but this pure binary notion you have is just misinformation.
And, most importantly, it does not prove election fraud one scintilla.
You only have conjecture that the election was stolen, but you don’t seem to realize that’s all you’re offering. You really think it’s proven that the election is stolen.
Against reams of factual evidence to the contrary, including against your narrative of it only being Dems who thought the election was fair. Bill fricking Barr thought it was fair. Mike Pence stated he saw no evidence of wide-spread fraud. Plenty of non-MAGA Republicans have said the same. They’re on the record saying so. Including Trumps Attorney General, his vice-president, the lawyers in the white house, Republican governors and secretaries of state in battleground states in 2020.
Who is left? MAGA die-hards.
“Also, how can you verify the veracity of mass mailed ballots, which is what was done?”
Each state has different ways of doing this. As an aside, the people who are filmed in 1000 mules dropping multiple ballots were investigated by the gov and found to have acted within the law, and verified the votes that they dropped.
“Also, the audits are a joke. They assume all ballots are legitimate ballots. There is now way to determine that.”
Each state has different methods. Arizona, for example, keeps images of the signed envelopes for later verification.
You’re full of empty talking points.
Because as soon as you name a state in 2020 that you think had fraud, and state the reason why, I’ll google it (again) and we’ll discover how wrong you are, and how little you know beyond the talking points.
Do you realize you only have conjecture? You’re stuck in Giuliani’s 2020.
The substance free clown show continues.
Rudy Giuliani recently sought to have some personnel records of a grand jury that indicted him handed over so he could prove his claim that it was politically biased and motivated against him.
“The underlying claim that formulates the request is based upon pure speculation and abject conjecture,” Judge Bruce Cohen wrote in a two-page order. “He claims that there is concern that the grand jurors that served on the grand jury that indicted Defendant Giuliani were selected based upon their political party affiliation. Yet he alleges not one scintilla of information that would support this claim…..
The court further notes that the 93rd Grand Jury, who indicted Defendant Giuliani, was empaneled well before this matter was ready for presentation to the grand jury,” the judge goes on. “This was not a special grand jury to address the charges brought against these various defendants. Rather, it was a sitting grand jury who was not selected for this case or any other specific case. There is therefore no reliable information to suggest that the empaneling of this grand jury occurred in contemplation of this case or with a political agenda in mind.”
https://tinyurl.com/ywv3eke3
Is it any wonder Giuliani has lost his license to practise law?
It’s the same playbook over and over. Bring suits with no substance, claiming unfair treatment without evidence.
It’s the conspiracy theorists playbook. Every failure is just proof of how deep the conspiracy is. How in Sam Hill do people buy this nonsense over and over again?
Barry,
Again you prove you don’t know what in the hell you’re talking about or you’re a propagandist (probably) or both. Kentucky and Iowa mailed out ballots (and so did Tennessee) per their Legislative Guides. That means per laws created by the legislatures. Georgia, Pennsylvania, Michigan, Wisconsin, and Arizona did not.
Stephen,
Thank you for confirming that rule changes made by governors and secs of state were permitted in various states. You originally said:
“Judges, Governors and Secretaries of State unconstitutionally changed election law which is the purview of the legislatures.”
And now you are finally correct in saying that legislatures in some states give the authority to change the rules to the governors and secretaries of state. We have diminished the misinformation. That’s good.
As to what changes were made, this is an excellent page:
https://www.ncsl.org/elections-and-campaigns/the-evolution-of-absentee-mail-voting-laws-2020-through-2022
And this:
https://ballotpedia.org/Changes_to_election_dates,_procedures,_and_administration_in_response_to_the_coronavirus_(COVID-19)_pandemic,_2020
Plenty of information, including:
Kentucky:
Absentee/mail-in voting eligibility requirements suspended, allowing all voters “concerned with contracting or spreading COVID-19” to cast ballots by mail in the November 3, 2020, general election. Early voting available Monday through Saturday beginning October 13, 2020. Affidavit option for voter ID requirement implemented for the November 3, 2020, general election.
https://governor.ky.gov/attachments/2020.08.14GeneralElection.pdf
Iowa:
Mail-in ballot applications sent automatically to all voters in the November 3, 2020, general election.
Iowa sec of state announcement about this:
https://sos.iowa.gov/news/2020_03_31.html
In a very few states there was a dispute about whether the changes were legal, and those were challenged.
But at least we’ve put the lie to your claim that only dems made changes to election procedures, and that governors and secretaries of state were not empowered to make those changes.
If you’re done incorrectly generalising, perhaps you will cite something specific that caused the 2020 election to be stolen by illegal rule-changing democrats.
Arkady, I agree that criminals who cast doubt on the election process and the integrity of the government should be held accountable.
Meanwhile, James Comey has a multi-million dollar book deal, Andrew McCabe sued to get his pension back and has a steady job at CNN spreading more lies, and the Love Birds stayed out of jail.
The irony is that if a citizen lies to the FBI they go to prison. If the senior leadership of the FBI makes a fraudulent claim to a Federal Judge, they can get away with claiming it was an “error” that they “cannot explain”. There was a total of 17 such errors.
The essence of conservatism is that there are people who the law constrains but does not protect, and people that the law protects but does not constrain.
Elliott, I know you like to be informed, so here is some light reading (sarcasm). Willard might like this as well. Within the statement is a link to a pdf of the full report. Crossfire Hurricane was an investigation authorized by President Obama in December of 2016 instructing Comey to “use the right people”.
https://oig.justice.gov/node/16547
[Nevertheless, we found that members of the Crossfire Hurricane team failed to meet the basic obligation to ensure that the Carter Page FISA applications were “scrupulously accurate.” We identified significant inaccuracies and omissions in each of the four applications: 7 in the first FISA application and a total of 17 by the final renewal application.]
[As a result of the 17 significant inaccuracies and omissions we identified, relevant information was not shared with, and consequently not considered by, important Department decision makers and the court, and the FISA applications made it appear as though the evidence supporting probable cause was stronger than was actually the case. We also found basic, fundamental, and serious errors during the completion of the FBl’s factual accuracy reviews, known as the Woods Procedures, which are designed to ensure that FISA applications contain a full and accurate presentation of the facts.]
[We are deeply concerned that so many basic and fundamental errors were made by three separate, hand-picked investigative teams; on one of the most sensitive FBI investigations; after the matter had been briefed to the highest levels within the FBI; even though the information sought through use of FISA authority related so closely to an ongoing presidential campaign; and even though those involved with the investigation knew that their actions were likely to be subjected to close scrutiny. ]
[Crossfire Hurricane team failed to comply with FBI policies, and in so doing fell short of what is rightfully expected from a premier law enforcement agency entrusted with such an intrusive surveillance tool. ]
Here is a report on Hillary’s private server investigation.
https://oig.justice.gov/node/640
[Moreover, we found the implication that senior FBI employees would be willing to take official action to impact a presidential candidates electoral prospects to be deeply troubling and antithetical to the core values of the FBI and the Department of Justice.]
The Love Bird tweets:
[In particular, we were concerned about text messages exchanged by FBI Deputy Assistant Director Peter Strzok and Lisa Page, Special Counsel to the Deputy Director, that potentially indicated or created the appearance that investigative decisions were impacted by bias or improper considerations.]
[We were deeply troubled by text messages exchanged between Strzok and Page that potentially indicated or created the appearance that investigative decisions were impacted by bias or improper considerations. Most of the text messages raising such questions pertained to the Russia investigation, which was not a part of this review. Nonetheless, when one senior FBI official, Strzok, who was helping to lead the Russia investigation at the time, conveys in a text message to another senior FBI official, Page, No. No he wont. Well stop it in response to her question [Trumps] not ever going to become president, right? Right?!, it is not only indicative of a biased state of mind but, even more seriously, implies a willingness to take official action to impact the presidential candidates electoral prospects. This is antithetical to the core values of the FBI and the Department of Justice.]
These errors in form filling do not rise to the level of serious misdeeds. This is hyperbole.
There is simply no equivalence in magnitude or consequence to the many misdeeds of Trump, especially his many efforts to subvert democracy.
But right-wing media will always always do their best to create false equivalences.
These errors in form filling do not rise to the level of serious misdeeds. This is hyperbole.
There is simply no equivalence in magnitude or consequence to the many misdeeds of Biden, especially his many efforts to subvert democracy.
But left-wing media will always always do their best to create false equivalences.
“There is simply no equivalence in magnitude or consequence to the many misdeeds of Biden, especially his many efforts to subvert democracy.”
Another favorite Trump tactic is to simply accuse his opponents of his own crimes, without evidence.
Another favorite Biden tactic is to simply accuse his opponents of his own crimes, without evidence.
Ad some people are quite gullible and believe whatever they hear from Trump!
Good example here.
Ad [sic] some people are quite gullible and believe whatever they hear from Biden!
Good example here.
Nate, you are amazing. You want people to believe that a FISA Application is a matter of filing out forms. Of course Clint R jumped right in seeming to lend credibility to your comment. Others who have no clue about the events may also think you have the correct answer.
The fact is that the FISA court is a highly sensitive and controversial program to allow surveillance of foreign nationals and some US citizens. It absolutely is not form filing. The errors involved substantive information that they either left out or misstated. The crime here is that they had the correct information in their possession, such as the email from the CIA that was altered by an FBI lawyer of all people. He took one for the team, and pleaded guilty.
By the way, at least one Federal Judge who was duped by the FBI and issued the warrant was not amused.
https://en.wikipedia.org/wiki/Rosemary_M._Collyer
[Collyer was one of four FISA Court judges who approved a FISA warrant (issued in October 2016 and renewed several times) authorizing the wiretapping of Carter Page, a Trump campaign aide the FBI believed was conspiring with Russia to interfere with the 2016 U.S. elections.[11][12] In December 2019 Collyer issued an order saying the FBI “provided false information to the National Security Division (NSD) of the Department of Justice, and withheld material information from NSD which was detrimental to the FBI’s case, in connection with four applications to the Foreign Intelligence Surveillance Court (FISC) for authority to conduct electronic surveillance of a U.S. citizen named Carter W. Page”[13] ordering the government to inform the court of planned procedures to “ensure that the statement of facts in each FBI application accurately and completely reflects information possessed by the FBI that is material to any issue presented by the application.”]
The wiki-quotes actually downplay the seriousness. The Judge speaks much more forcefully in this pdf link:
https://s.wsj.net/public/resources/documents/FisaOrderOnFBIMatters12172019.pdf?mod=article_inline&mod=article_inline
[In order to appreciate the seriousness of that misconduct and its implications, it is useful to understand certain procedural and substantive requirements that apply to the government’s conduct of electronic surveillance for foreign intelligence purposes.]
[An electronic surveillance application must “be made by a Federal officer in writing upon oath or affirmation.” 1804(a).2 When it is the FBI that seeks to conduct the surveillance, the Federal officer who makes the application is an FBI agent, who swears to the facts in the application.]
[It documents troubling instances in which FBI personnel provided information to NSD which was unsupported or contradicted by information in their possession. 7 It also describes several instances in which FBI personnel withheld from NSD information in their possession which was detrimental to their case for believing that Mr. Page was acting as an agent of a foreign power. 8]
[7 See OIG Report at 157-59,365-66 (in September 2016, an FBI agent provided an NSD attorney with information about the timing of Mr. Page’s source relationship with another government agency and its relevance to the FISA proffer that was contradicted by a memorandum received from the other agency in August 2016); id. at 160-62, 364, 367 (FBI personnel exaggerated the extent to which Christopher Steele’s reporting had been corroborated and falsely represented that it had been used in criminal proceedings).]
[The FBI’s handling of the Carter Page applications, as portrayed in the OIG report, was antithetical to the heightened duty of candor described above. The frequency with which representations made by FBI personnel turned out to be unsupported or contradicted by information in their possession, and with which they withheld information detrimental to their case, calls into question whether information contained in other FBI applications is reliable.]
Anyone prosecuted successfully for these aledged serious crimes, Tim?
Once again Nate knows all of the talking points. Is there an official guide somewhere for Democrat Party operatives?
When the very top management of experienced FBI officials (conspiracy?) lie to a court of law, they know how to do it without being prosecuted. The attorney who doctored the document is the exception. He took one for the team by claiming nobody told him to do, or knew about it. Really? Nobody saw the original email except him? Is that lack of supervision?
When an experienced professional lies to a court, the competent attorney representing the offender will advise them not to attempt to explain or qualify anything, because that just gets you in deeper. I was impressed with the way IG Horowitz emphasized repeatedly in his testimony that “they could not explain it”, and there was no “evidence” of political bias (except for the Love Birds). It was IG Horowitz who came up with the term “error” when faced no explanation. Yes, Nate they are professionals. Do not try this at home.
“text messages exchanged between Strzok and Page”
Apparently these texts also included criticisms of Bernie Sanders and H. Clinton, among others.
Is it your view, Tim, that FBI agents should not have political views and express them, even in private communications?
Just for fun, I have formal training and experience in how to do investigations and how to be investigated. I have had the experience of a Federal investigator asking me questions. The senior corporate VP who was observing the interview was standing behind the investigator. The instruction was that when she put her pen to her lips that meant it was time to shut up. Never answer a question that wasn’t asked. Make them dig it out of you. True story.
“hen the very top management of experienced FBI officials (conspiracy?)”
Sure. As always, a lack of evidence is evidence of a conspiracy!
Here you go Nate. I was not there and I did not do the investigation. This is what Horowitz stated. How do you spin this:
[We are deeply concerned that so many basic and fundamental errors were made by three separate, hand-picked investigative teams; on one of the most sensitive FBI investigations; after the matter had been briefed to the highest levels within the FBI; even though the information sought through use of FISA authority related so closely to an ongoing presidential campaign; and even though those involved with the investigation knew that their actions were likely to be subjected to close scrutiny. ]
The Durham investigation found confirmation bias in the FBI, convicted an agent of altering a document, recommended installing an official position to oversee cases involving politics, and determined there was no political motivation behind the FBI investigation of Russian involvement with the Trump campaign and presidency.
Partisans pick and choose the bits they like from this report.
So barry, I will assume you read the report (i.e. “nothing-burger”). The attorney who was acquitted of lying to his friend at the FBI was working for the Clinton campaign. Hillary always has lawyers do her dirty work such as smashing cell phones and bleaching servers.
It was the perfect scheme. Plant a fake story with the FBI (more than one actually), and then leak a story to the media that the FBI was investigating. In fact, they seemed rather anxious to investigate this one, and ignore the law in the process.
I have on minor correction on your comment: “determined there was no political motivation”. They could not prove political motivation. That is different than finding no motivation. There was a lot of evidence. It was the Love Birds who clearly stated bias with an intent to take action to put the “insurance policy” in play.
I have previously stated that Trump is nuts, but may be less of a problem than Kamala who is really nuts. There will be a lot of drama no matter who wins. Watch the Oprah interview, and tell us that Kamala is not emotionally unfocused and completely lacking in intellectual discipline or rational thought.
“I have previously stated that Trump is nuts, but may be less of a problem than Kamala who is really nuts.”
Tim takes the false equivalence meme to new heights of ridiculousness.
I asked you before evidence, and you offered none.
We’ll just add ‘Kamala is really nuts’ to the list of Trump’s expert critiques.
‘She’s mentally disabled.’
‘She’s dumb as a rock’
‘I’m better looking then her’
‘She’s not actually black’
Nate, as you know very well, propaganda is what they leave out, not what was quoted. For example this is what follows the sentence you quoted.
[Watch the Oprah interview, and tell us that Kamala is not emotionally unfocused and completely lacking in intellectual discipline or rational thought.]
Did you watch? Now you give me a chance to expand my comment. The most revealing interviews come when people feel comfortable. I think Oprah made a mistake. She allowed Kamala to feel comfortable and reveal herself as an emotional basket case. Watch the interview.
Happy to amend to no provable political motivation.
Are you trying to throw doubt on the report, or are you just repeating what is already known? The special counsel was a Republican who is not especially regarded for impartiality. I think we can safely assume that the report is not biased in favour of the Dems.
” She allowed Kamala to feel comfortable and reveal herself as an emotional basket case.”
Your biased opinion is lacking quotes. Quote something that you consider to be that of an ’emotional basket case’.
OTOH, with Trump we have a long and growing list of former officials from his administration, from his party, who worked with him, who consider him to be unfit for office.
We have a long and growing list of Republicans, former senators, congressmen, governors, cabinet members from various administrations, Generals, who consider him to be unfit for office.
Often it is based on his actions in the last election, which they consider to have violated his Oath to protect the Constitution, which they consider disqualifying.
And very many have taken the unusual step of endorsing the Democratic candidate, Harris.
And have we heard Harris suggesting anything comparable to the injection of bleach into people?
“She allowed Kamala to feel comfortable and reveal herself as an emotional basket case.”
I recall her saying that anyone breaking into her house would get shot. Was that it?
I’m not going to do your homework for you. Give us some actual quotes of her saying things that are ‘nuts’.
Oprah also got Tom Cruise, the macho guy who does all his own stunts, to act like a silly school girl in one famous interview.
Go look up that one.
An internet joke about undecided voters seems appropriate.
“Darth Vader is from the Dark Side of the Force, and he used a Death Star to blow up a planet, but I just doen’t know enough about Luke Skywalker.”
Arkady – Posts like that need a “like” button!
After having recently downloaded newest GHCN daily data, I made again a TAVG comparison of
– all CONUS stations showing useful data (8503, of which 6464 were able to provide for anomalies wrt the mean of 1981-2010)
to
– these of the 6464 stations located at or in the immediate near of airports (410).
*
Last February I made a TAVG time series out of
– NOAA’s Climate at a Glance (National data) for CONUS
which however could not be updated due to NCEI’s data centre in Asheville having been heavily impacted by Helene:
https://www.ncei.noaa.gov/node/6696
*
Here is the comparison of the three series for 1900-2024:
https://drive.google.com/file/d/1Y6RnFCGM8QcnpWx6aog9eH1tlVCytEiK/view
For 1979-2024:
https://drive.google.com/file/d/1VWtPOzRRQo3yg8Pnuv6oLnkCFy1HYDBE/view
*
By the way, it is astonishing as ever to zoom in on such images to, say, 200% and see all those tiny wobbles that are endlessly denigrated as “distortions” by some boring, biased boy on this blog:
https://drive.google.com/file/d/1GtENYrbpIFD76WWow18kVZUl6v9_5MLf/view
It is almost inconceivable that 120 month averages of three completely different time series can show so many similar places.
While the blue 6464-station time series and the red 410-AP station series are of course processed using exactly the same methods in my software, the two however have nothing in common with either NOAA’s “Climate at a Glance” data source (GHCN V4 adjusted), let alone their heavily questioned Pairwise Homogenization Algorithm.
Just dropping by for a chat.
It is well known that the UAH algorithm compared to other records exaggerates warming during El Nino and shows less at other times. This is shown by looking at the different records. In general even the other MSU records show exaggerated warming during El Nino, but UAH is the most extreme
This seems to be because of some stratospheric component in the TLT mixture, but whatever. It is also reasonable that if there is a stratospheric component that the warming would lag the El Nino as the effect propagates through the atmosphere.
The serious question is whether UAH and the other records will return to the baseline warming or whether the Earth is has shifted into another regime.
Been waiting to see whether the El Nino peak is wider this time as an indicator.
It’s not just UAH. Ever since last year’s step up the two atmosphere datasets RSS and UAH have shown noticeably higher anomalies than the surface data.
https://s3-us-west-1.amazonaws.com/www.moyhu.org/pages/latest/T/mth2.png
Now what might cause the atmosphere to warm even faster than the surface?
The cult must ignore, pervert, and evade science and reality to keep its false beliefs.
Hint: The HTE is reality. Science is understanding that reality.
https://acd-ext.gsfc.nasa.gov/Data_services/met/qbo/h2o_MLS_vLAT_qbo_75S-75N_10hPa.pdf
You deny Earth’s natural GHE.
You deny that increasing CO2 concentration by 140 ppm since the pre-industrial era has enhanced Earth’s natural GHE.
Yet, you are adamant that an increase of less than 1 ppm in stratospheric water vapor (from your graph) is responsible for the warming seen the past 14 months.
ClintR
The HTE effect you advocate requires a greenhouse gas in the stratosphere to warm the surface.
You reject this because you claim that emissions from a colder GHG cannot increase the temperature of a warmer surface.
The two theories contradict each other. One of the other, you can’t have both.
Ark gets most of it right, except I’m not “adamant” about the HTE. There’s a slight chance I’m wrong because I’m basing it on data supplied by others….
But Ent makes the same mistakes as Nate. There’s nothing contradictory in what I’m saying. The contraction is in what he believes I’m saying.
You don’t know what “adamant” means, do you?
It appears I know what it means more than you, Ark.
“The serious question is whether UAH and the other records will return to the baseline warming or whether the Earth is has shifted into another regime.”
Thus far the ocean has not returned to baseline. it continues to be a record levels.
The surface T appears as though it will settle by the end of this year to levels ~ matching the peak level of the 2016 El Nino, which is ~ 0.3 higher than previous mean of 2016-2022 levels.
https://oz4caster.wordpress.com/wp-content/uploads/2024/10/d4-gfs-gta-daily-2014-2024-10-03.gif
Your green/blue plate thought experiment still gets mentioned from time to time. It might be neat to do a related blog post on the JWST sunshield which is a real world demonstration of this. Though it might be hard to find now there is temperature time-series data out there that shows the temperature gradient between the hot and cold sides steepened once they started separating the layers exactly as you show in your thought experiment.
Actually bdgwx, the JWST disproves the GPE nonsense, as does basic physics.
Eli Rabett
” This seems to be because of some stratospheric component in the TLT mixture, but whatever. ”
*
I don’t think so.
Please look at the weighting formula used for the computation of UAH’s TLT (intended to replace the direct sounding at TLT level which is no longer used since UAH’s revision 6.0):
LT = 1.538*MT – 0.548*TP + 0.010*LS
To be compared to NOAA STAR’s weighting formula for their TLT:
TLT=1.430*TMT – 0.462*TUT + 0.032*TLS
As opposed to UAH, STAR apparently did not replace its LT sounding by a weighting of higher layers but injected the weighting result into the sounding.
*
Suppressing the LS coefficient in UAH’s LT weighting merely leads to tiny changes in the time series:
https://drive.google.com/file/d/1paZiWte9-oc09JKPhXkkiiGJBHCoihCp/view
*
If we now look at a comparison of UAH to NOAA STAR and RSS, it seems that STAR’s higher LS weighting factor might well result in higher anomalies at the beginning of the STAR LT time series, probably due to the extremely high LS anomalies at that time (El Chichon and Pinatubo aerosols):
https://drive.google.com/file/d/1S5Mk2vfD_kwqwlacpE8VoU-ynhq3I45Z/view
*
Conversely, it seems that RSS injects 0 % of higher layers into its LT series.
*
Sources
1. Weighting explanations
UAH
https://www.drroyspencer.com/2015/04/version-6-0-of-the-uah-temperature-dataset-released-new-lt-trend-0-11-cdecade/
STAR
https://www.star.nesdis.noaa.gov/data/mscat/MSU_AMSU_v5.0/Monthly_Atmospheric_Layer_Mean_Temperature/Readme_STAR_V5.0_Mean_Layer_Temperature_CDR.pdf
*
2. Data
UAH
https://tinyurl.com/4e45vpj9
STAR
https://www.star.nesdis.noaa.gov/data/mscat/MSU_AMSU_v5.0/Monthly_Atmospheric_Layer_Mean_Temperature/Global_Mean_Anomaly_Time_Series/
therein the TLT link
SpaceX Genius Solution: Starship Launch From The Sea!
https://www.youtube.com/watch?v=ap–4Pf1HMI
I mentioned this before.
Last one, I mentioned was launching and landing a Starship below sea level {in the ocean}- mainly to make it cheaper.
And for decades been talking about what I call a pipelauncher, which launches 50 to 100 metes above sea level. But starship is sort of too big for a simple pipelauncher- hard to make a pipelauncher launching starship with launch velocity much over 50 m/s.
Indias monsoon rains hit four-year high in boost to crop output
https://wattsupwiththat.com/2024/10/03/indias-monsoon-rains-hit-four-year-high-in-boost-to-crop-output/
“MUMBAI (Reuters) Indias monsoon rainfall this year was its highest since 2020, with above-average precipitation for three consecutive months, helping the country recover from last years drought, the state-run weather department said on Monday.”
SOLAR MINIMUM UPDATE
Georgia Representative Marjorie Taylor Greene is begging the federal government to urgently “send the funds” to help the American Southeast recover in the wake of Hurricane Helene, even though she herself stood in the way of emergency relief funds just last week.
“The storm was supposed to come directly across my district, but when it came through Georgia, it went to the east, and we mainly just got a lot of rain,” Greene told Real America’s Voice’s Terrance Bates. When we go back to Washington, we will be working hard to make sure that states like Georgia, South Carolina, Tennessee, North Carolina get the funding that they need.”
Greene was one of 82 Republicans who voted last week against a continuing resolution to keep the government funded. If she had been successful, the government would have been in shutdown mode from Tuesday onward, preventing any region from receiving the critical assistance.
https://newrepublic.com/post/186541/marjorie-taylor-greene-hurricane-helene-relief-government-funding
But Comey. But Comey.
Its rather despicable to make political hay on the backs of people who have lost everything and are struggling to survive an ongoing disaster.
You should be ashamed.
Oh, Kennui. How decent. How humane. How moral. You might like what Martin Luther King 2.0 (h/t Donald) did:
https://www.wral.com/story/nc-lt-gov-mark-robinson-didn-t-vote-on-state-s-emergency-declaration-records-show/21653112/
Or rather, what he didn’t.
Should we compare this to Peter’s denial?
A standard method to escape from one’s wrongdoing.
Willard,
FEMA funding for 2024 was almost double the funding in 2023. So, MTG and Republicans want to reduce federal spending before the Hurricane and that somehow makes them the bad guys? What’s happened with the FEMA funding? Biden, Harris, Mayorkis.
Speaking of shame:
https://www.mediaite.com/news/put-aside-hate-and-pitch-in-gop-mayor-and-ex-wrestler-kane-sets-the-record-straight-on-hurricane-aid-rumors/
We collected food here in Middle Tennessee for our East Tennessee brethren. I asked the restaurant owner collecting the food if she had sent it yet because several boxes were still sitting in her restaurant. She said no because FEMA told her she couldn’t send the food and they were going to confiscate it and distribute it. I asked her what she was going to do and she said she was giving it to a church to distribute because FEMA can’t confiscate it from the church.
https://www.huffpost.com/entry/hurricane-helene-conspiracy-theories_n_66fffc76e4b02f12ed4a9dd0
“She said no because FEMA told her she couldnt send the food and they were going to confiscate it and distribute it.”
Clever use of the word ‘confiscate’ there, Stephen.
IOW FEMA was going to help by distributing the collected food.
I’m sure they don’t want people trying to drive into the hazardous areas.
Nate,
We lived in Asheville for eight years and are in contact with several of our friends there who still have internet. The neighborhood we lived in was Eastmoor by the River. Well the flood washed out the only access road into the neighborhood and they are completely trapped. That access road won’t be able to be rebuilt for several years if ever. They are trying to determine if they can cut a road into the back way but it will take several months. The people are going to have to hike out over rugged terrain. Our friends tell us they have not seen FEMA yet and the only people distributing food and supplies are citizens and churches. They also said Trump came through, Elon came through and Glen Beck was there yesterday I believe.
Nate,
I think IOW she doesn’t trust FEMA. She knows how incompetently it is being managed. The churches can get the supplies there almost immediately. FEMA? Well, who knows.
Ste… I have family in Bat Cave and they would like for you to stop politicizing this catastrophe. Have some decency.
Our home was 92 Eastmoor Drive. Our friends there are saying the same thing I am. Where is FEMA? Also, some have heard that FEMA announced each resident is going to get $750. I used to go through Bat Cave all the time. I lived there when the Last of the Mohicans was being filmed.
Maybe troglodytes have trust issues that are self-inflicted:
https://www.nbcnews.com/news/latino/new-probe-confirms-trump-officials-blocked-puerto-rico-receiving-hurri-rcna749
But troglodytes are smarter than you. So, Puerto Ricans pay about 4 billion per year into the US Treasury, mostly into Social Security and Medicare payments and we’re supposed to give them $20 billion in hurricane relief? The Commonwealth of Puerto Rico collects its own income taxes. Why do we need to give an obviously corrupt government $20 billion in relief? Trump’s just asking those questions.
Troglodytes are so smart that they fall for just about anything, e.g.:
https://www.oklahoman.com/story/news/2024/10/04/donald-trump-supported-bible-one-of-few-that-meets-ryan-walters-criteria-for-ok-classrooms/75510021007/
More than a disgrace – pure blasphemy.
I’m not a Christian. So, what they do doesn’t apply to me.
They have been able to clear a one-lane path back to Eastmoor along the river. Most of the road has been washed out but the river has dropped enough so that cars can travel over the mud. A lot of the new apartments and condos by the river have been severely damaged or washed away. The residents are using generators at their homes. They don’t know when power or water will be restored. It is amazing how people are shoveling mud out with pick and shovel. The neighborhood’s clubhouse was washed away but the rest of the neighborhood is OK because it is on higher ground. The problem I see is that because the access is now almost even with the river, any amount of storm or rain will flood the road.
This is not a situation to capitalize on for political gain. But former President Donald Trump has politicized the situation at every turn, spreading falsehoods and conspiracies that fracture the community instead of bringing it together, read the newspapers editorial.”
Charlotte Observer
The Charlotte Observer is a leftist rag in a corrupt Democrat-run city.
Speaking of Just Asking Questions:
https://www.moneygeek.com/living/states-most-reliant-federal-government/
Why should anyone subsidize troglodytes?
Regardless of the source, Stephen, it is factual that Trump has “politicized the situation at every turn, spreading falsehoods”
For example, claiming that Biden had not called and offered assistance to Georgia governor. Kemp himself pointed out that absolutely false!
https://www.newsweek.com/donald-trumps-helene-remarks-rebuked-north-carolinas-largest-newspapers-1964524
”
The former president falsely claimed that the Federal Emergency Management Agency (FEMA) was diverting disaster relief money to illegal migrants.
Trump said during a rally in Michigan on Thursday that Harris, who has no direct control over FEMA or any other federal agencies, had spent “all her FEMA money, billions of dollars, on housing for illegal migrants.”
Stephen, you said about Asheville.
“They also said Trump came through”
He did, a month ago, way before the hurricane, to campaign.
I cannot find anything saying he has been through since Helene.
Solar wind
speed: 383.5 km/sec
density: 0.53 protons/cm3
Daily Sun: 04 Oct 24
https://www.spaceweather.com/
Sunspot number: 229
“The solar disk is peppered with dangerous sunspots. Four of them (3841, 3842, 3843, 3844) have delta-class magnetic fields that harbor energy for M-class or X-class solar flares. ”
The Radio Sun
10.7 cm flux: 312 sfu
Thermosphere Climate Index
today: 33.26×10^10 W Hot
Oulu Neutron Counts
Percentages of the Space Age average:
today: -6.3% Low
10 numbered sunspot, 2 spots coming from farside.
“TWO CMEs ARE HEADING FOR EARTH: Confirmed: Two CMEs are now heading for Earth following consecutive X-flares (X7.1 and X9.1) from active sunspot AR3842. According to NOAA and NASA models, the first will strike Earth on Oct 4th and the second (more potent) will strike on Oct. 6th. The dual impacts could spark strong G3-class geomagnetic storms with auroras at mid-latitudes, especially on Oct. 6th.”
The northern jet stream will get a big dose of extra energy.
More upper-level lows will be cut off, bringing heavy precipitation to the mid-latitudes.
https://www.sat24.com/pl-pl/continent/eu/hd
https://www.sat24.com/pl-pl/continent/na/hd
Solar wind
speed: 429.1 km/sec
density: 1.84 protons/cm3
Daily Sun: 05 Oct 24
Sunspot number: 180
The Radio Sun
10.7 cm flux: 291 sfu
Thermosphere Climate Index
today: 33.24×10^10 W Hot
Oulu Neutron Counts
Percentages of the Space Age average:
today: -6.6% Low
9 numbered sunspots. One spot leaving to farside.
don’t see a spot coming from farside, yet.
POWERFUL X-CLASS SOLAR FLARE AND CME: Sunspot AR3848 was directly facing Earth this morning, Oct. 8th (0156 UTC), when it unleashed a powerful X1.8-class solar flare. NASA’s Solar Dynamics Observatory recorded the extreme ultraviolet flash:
This explosion lasted more than five hours, long enough to lift a massive CME out of the sun’s atmosphere. SOHO coronagraphs have since detected a bright, fast-moving CME heading directly toward Earth. NOAA and NASA models agree that the CME will strike our planet late on Oct. 10th. NOAA forecasters say that a severe G4-class geomagnetic storm is possible when the CME arrives.”
https://spaceweather.com/images2024/09oct24/coronalhole_sdo_blank.jpg
There also a big coronal north of the big white flash
Solar wind
speed: 392.5 km/sec
density: 0.24 protons/cm3
Daily Sun: 06 Oct 24
Sunspot number: 173
The Radio Sun
10.7 cm flux: 291 sfu
Thermosphere Climate Index
today: 33.22×10^10 W Hot
Oulu Neutron Counts
Percentages of the Space Age average:
today: -6.6% Low
8 numbered sunspots. One spot leaving, no spots coming from farside, yet
Have not seen CMEs [Coronal Mass Ejections] yet. But Neutron count is dipping a lot, and I think it’s going to arrive soon.
Solar wind
speed: 460.1 km/sec
density: 1.37 protons/cm3
Daily Sun: 07 Oct 24
Sunspot number: 167
The Radio Sun
10.7 cm flux: 265 sfu
Thermosphere Climate Index
today: 33.21×10^10 W Hot
Oulu Neutron Counts
Percentages of the Space Age average:
today: -9.5% Low
8 numbered sunspots. 1 sunspot coming from farside
Solar wind
speed: 419.3 km/sec
density: 1.75 protons/cm3
Daily Sun: 08 Oct 24
Sunspot number: 164
The Radio Sun
10.7 cm flux: 277 sfu
Thermosphere Climate Index
today: 33.11×10^10 W Hot
Oulu Neutron Counts
Percentages of the Space Age average:
today: -10.6% Low
9 numbered spots
Solar wind
speed: 466.3 km/sec
density: 0.34 protons/cm3
Daily Sun: 09 Oct 24
Sunspot number: 165
The Radio Sun
10.7 cm flux: 225 sfu
Thermosphere Climate Index
today: 33.58×10^10 W Hot
Oulu Neutron Counts
Percentages of the Space Age average:
today: -10.5% Low
9 numbered spots. None coming coming from farside yet, but small spot about 2 days from farside, might be numbered and get bigger {or sink is possible]. a few spots are leaving to farside in day or two.
Solar wind
speed: 407.5 km/sec
density: 2.60 protons/cm3
Daily Sun: 10 Oct 24
Sunspot number: 107
The Radio Sun
10.7 cm flux: 220 sfu
Thermosphere Climate Index
today: 33.80×10^10 W Hot
Oulu Neutron Counts
Percentages of the Space Age average:
today: -10.1% Low
5 numbered sunspots.
Where the temperature is rising.
https://www.cpc.ncep.noaa.gov/products/stratosphere/strat-trop/gif_files/time_pres_TEMP_ANOM_ALL_NH_2024.png
https://www.cpc.ncep.noaa.gov/products/stratosphere/strat-trop/gif_files/time_pres_TEMP_ANOM_ALL_EQ_2024.png
https://www.cpc.ncep.noaa.gov/products/stratosphere/strat-trop/gif_files/time_pres_TEMP_ANOM_ALL_SH_2024.png
Climate science is not settled, and winter in the northern hemisphere will require a lot of electricity for mid-latitudes.
https://www.cpc.ncep.noaa.gov/products/stratosphere/strat-trop/gif_files/time_pres_HGT_ANOM_JAS_NH_2024.png
SOLAR MINIMUM UPDATE
> Here, we show that the observed frequency and intensity of midlatitude cold extremes have strongly decreased since 1990 and are consistent with modeled trends. The previously reported increase in cold extremes was overestimated due to an artifact of changing data coverage. We also show that the fraction of land with observed cold extreme increases over recent decades is consistent with model internal variability on top of a near-uniform forced reduction in cold extremes across the midlatitudes. Our results provide strong evidence of a decrease in midlatitude cold extremes over recent decades and consistency between models and observations.
https://www.science.org/doi/10.1126/sciadv.adp1346
In summary, we find no significant effect of Arctic amplification on the waviness of the midlatitude circulation in observations or models. The correspondence between Arctic amplification and waviness on interannual to decadal time scales is not indicative of a forced response of waviness to Arctic amplification and likely arises because internal variability in the midlatitude circulation causes changes in the meridional temperature gradient. Thus, future Arctic amplification is unlikely to cause a wavier midlatitude circulation or an increase in dynamically driven extreme weather. The impact of Arctic amplification on midlatitude temperature extremes during autumn and winter will likely be dominated by thermodynamic effects, which are very robust in models (24) and are grounded in well-established theory (22).
https://www.science.org/doi/full/10.1126/sciadv.aay2880
Same authors.
Funny how science does not always need to move one funeral at a time.
See for example
https://tinyurl.com/Blackport-Screen
MTG Implies Dems Created Hurricane Helene: ‘They Can Control the Weather’
Suppose you were an id!iot, and suppose you were a member of congress; but I repeat myself. Mark Twain.
ark…you have a post below about conspiracy theories yet here you are promoting one.
Doesn’t look like he was promoting the crazy ideas of bat-shit crazy MTG.
https://en.wikipedia.org/wiki/Effective_temperature#:~:text=The%20effective%20temperature%20of%20the%20Sun%20(5778%20kelvins)%20is%20the
“Earth effective temperature
See also: StefanBoltzmann law Effective temperature of the Earth
Earth has an albedo of about 0.306 and a solar irradiance
(L / 4 π D2) of 1361 W m−2 at its mean orbital radius of 1.510^8 km. The calculation with ε=1 and remaining physical constants then gives an Earth effective temperature of 254 K (−19 C).[11]
The actual temperature of Earth’s surface is
an average 288 K (15 C) as of 2020.[12] The difference between the two values is called the greenhouse effect. The greenhouse effect results from materials in the atmosphere (greenhouse gases and clouds) absorbing thermal radiation and reducing emissions to space, i.e., reducing the planet’s emissivity of thermal radiation from its surface into space. Substituting the surface temperature into the equation and solving for ε gives an effective emissivity of about 0.61 for a 288 K Earth. Furthermore, these values calculate an outgoing thermal radiation flux of 238 W m−2 (with ε=0.61 as viewed from space) versus a surface thermal radiation flux of 390 W m−2 (with ε≈1 at the surface). Both fluxes are near the confidence ranges reported by the IPCC.[13]: 934 ”
–
–
The “Earth effective temperature” compares the blakbody uniform surface temperature Te = 254K with the Earth’s average surface temperature 288 K.
“The difference between the two values is called the greenhouse effect.”
“Substituting the surface temperature into the equation and solving for ε gives an effective emissivity of about 0.61 for a 288 K Earth.”
–
–
an effective emissivity of about 0.61 for a 288 K Earth.”
The term emissivity (ε) is for the uniform surface temperature bodies. Those bodies transform their inner heat into EM outgoing energy.
What a planet surface does is to interact with the incident upon its surface solar energy.
There is no room for the emissivity term when the solar flux/planet surface the interaction process is considered.
–
–
https://www.cristos-vournas.com
Yes, they compare Earth to an imaginary sphere!
That’s why the “33K” is so bogus.
Of course, simple-minded and ignorant people like Robertson, Clint R and Vournas know everything better than e.g. Roy Spencer.
Exactly.
If there is “Earth effective temperature”, and if there is the alleged Earth emissivity ε =0,61…
What is the meaning of Moon’s emissivity ε =2,28 then?
–
–
https://www.cristos-vournas.com
Bindi, your ignorance of physics combined with your irrational hatred are definite cult traits.
You’re such a good cultist.
No hatred, Clint R. You claim has nothing to do with the reality:
” Robertson, Clint R and Vournas know everything better than e.g. Roy Spencer. ”
Especially about GHE and… the lunar spin.
And this is what makes you three ‘simple-minded and ignorant people’.
Sorry Bindi, but you hate reality and those that bring it to you. You’re a perfect cultist, relying on cult tricks like false accusations.
You don’t have a clue about orbital motion, and you can’t learn. You rely on ancient astrologers, but you can’t even provide a viable model of “orbiting without spin”.
You’ve got NOTHING.
” Earth's surface emissivities (εs) have been inferred with satellite-based instruments by directly observing surface thermal emissions at nadir through a less obstructed atmospheric window spanning 8-13 μm.
Values range about εs=0.65-0.99, with lowest values typically limited to the most barren desert areas.
Emissivities of most surface regions are above 0.9 due to the dominant influence of water; including oceans, land vegetation, and snow/ice.
Globally averaged estimates for the hemispheric emissivity of Earth's surface are in the vicinity of εs=0.95. ”
Source:
https://en.wikipedia.org/wiki/Emissivity#Emissivities_of_planet_Earth
*
Observation is always better than ‘Substituting the surface temperature into the equation and solving for ε… ‘
Thank you, Bindidon.
“Globally averaged estimates for the hemispheric emissivity of Earth’s surface are in the vicinity of εs=0.95. ”
Of course. Because there is not any +33C greenhouse effect.
–
By the way, what is Moon’s “hemispherical emissivity” ?
https://www.cristos-vournas.com
binny…”Earth’s surface emissivities (εs) have been inferred…”
***
The new science, based on inference and consensus.
The current covid hysteria was fueled by an inferred virus and based on consensus, people globally were deprived of their democratic rights. People in non-democratic countries like China, were imprisoned in their homes by sealing their doors and windows from the outside.
Bindidon, does the lunar spin makes you three ‘simple-minded and ignorant people’?
–
–
https://www.cristos-vournas.com
I just saw this comment from barry:
https://www.drroyspencer.com/2024/10/uah-global-temperature-update-for-september-2024-0-96-deg-c/#comment-1690407
It’s full of mis-representations and false accusations. That’s nothing new for cultists, but barry is the one that called me a “lying dog”.
I’m still enjoying his meltdown.
As always, we get no rebuttal from Clint. What could he say in response? Barry’s post is just stating the facts.
Barry sez:
“Its amusing to see Clint admitting the GHE exists”
He did say that water in the stratosphere is producing a GHE.
This is TRUE.
“after arguing long and loud for the opposite, claiming its impossible because of the 2nd Law, and that a cooler source of radiation cannot add energy to a surface warmed by a warmer source.”
He has such things for years!! TRUE.
“I do believe the H2O in the stratosphere is a lot cooler than the surface”
. The temperature of stratosphere is generally well below 0C. TRUE.
Oh well!
Nate is back to prove me right, again.
https://www.drroyspencer.com/2024/10/uah-global-temperature-update-for-september-2024-0-96-deg-c/#comment-1690550
I never get tired of being right.
Clint has frequently called the GHE “bogus,” and has explained that if the average frequency of incoming radiation is of lower energy than the average energy frequency of the surface, then the incoming radiation cannot make the surface warmer.
The average temperature of the lower stratosphere is -50C, the average temperature of the surface is 15C.
Clint is welcome to explain why he now thinks the GHE works with radiation coming from a much colder source than the receiving surface.
Wrong barry.
You have completely misrepresented my words. It’s just another failed “gotcha” from you.
You are welcome to explain why you’re so incompetent, ignorant, and irresponsible.
Barry again states the plain facts. Clint again offers no answer, no rebuttal, just pure denial and childish insults.
Its obvious that he is stuck in a pickle with his contradictory claims.
Clint April 2022:
“a flux with photons that have an average frequency above the average vibrational frequency of the surface molecules will be largely absorbed, warming the surface. If a flux has photons with an average frequency lower than the average vibrational frequency of the surface molecule, it will not be able to warm the surface.
In simple-to-understand terms, ‘cold’ can NOT warm ‘hot’.”
Yep, I paraphrased that correctly.
But Clint in September 2024 believes WV at -50C can warm the 15C surface via the GHE.
He won’t explain this obvious contradiction, because he can’t.
Candace Owens is doing an expose-investigation into Kamala Harris’ heritage. She has interviewed her Uncle and her Dad. It appears so far that Kamala Harris has no black lineage. She has recently commented on the 1/8th rule, indicating she is 1/8th black (and 7/8ths Caucasian). However, Candace hasn’t even uncovered 1/8th black ancestry. I see now why she picked Tim Walz. I believe she was trying to pick someone who was as much a liar as she is. It takes a real sociopath to lie about your heritage (like Elizabeth Warren) to get votes. Why is this so common among Democrats? It is because leftists are sociopaths?
Stephen P Anderson
Do you have any critical thinking left in your brain? You pick some really poor sources of information to come up with your theories.
I suppose your mind has lost all scientific rigor and a quest for truth that you will believe anything a right-wing pundit tells you with no ability to question its validity. I am sure you accept MTG conspiracy that the Democrats created and guided Helene to destroy Republican strongholds to lower voter turnout. It must be true a right-wing voice made the claim. Sheesh. I am starting to doubt your claim you studied any Chemistry. You sound just like a political hack all right-wing all day. I rarely you you post any valid science or use any rational logic. You blindly accepted 2000 mules as factual. Now it is coming out it is a fraud piece.
Here is a recent video on Candance Owens. Maybe watch it and see if you have any thinking ability left or you are just a sponge that takes in any and all right-wing media with no question.
https://www.youtube.com/watch?v=ib6h35p-R-s
And as for Harris having black lineage here is a profile of her Father.
https://en.wikipedia.org/wiki/Donald_J._Harris#:~:text=He%20was%20the%20first%20Black,a%20lawyer%2C%20advocate%20and%20writer.
From the link: “He was the first Black scholar granted tenure in the Stanford Department of Economics, and he is the father of Kamala Harris, ”
His parents were Afro-Jamacians. I am not sure what is wrong with your mind but it seems fried by constant intake of total lies and distortions from the right media that you are unable to question. All you have to give them is your blind loyalty.
I am sure this post will have zero affect on your condition. I have not much confidence left in human intellect.
Norman,
So Wiki is your source for critical thinking? Candace Owens is interviewing family members, Kamala’s uncle. There is a lot of mystery about who Donald Harris’ mother was. Donald Harris won’t even talk about it. Joe Brown says he has met her parents and they are not black. You need to watch Candace’s expose.
Also, she hasn’t been able to locate a Beryl Christie Harris through birth or marriage records.
Candace Owens? Youre kidding? The black hating black. Notice how the deniers politics are as screwed up as their climate garbage.
stephen…I don’t care about Harris’ colour or ancestry, I am turned off by the fact that she supported this corrupt regime without protest. She was in charge of the southern border and she turned a blind eye as terrorists and criminals entered the US disguised as illegal immigrants.
Her record in California is just as bad. Nothing to do with her colour it’s all about her incompetence and corruption.
SOLAR MINIMUM UPDATE
Today, Owens can be found fulminating on her YouTube channel (2.4 million subscribers) or X feed (5.6 million followers) about how a devil-worshipping Jewish cult controls the world, and how Israel was complicit in the 9/11 attacks and killed President John F. Kennedy. Owens has also jumped aboard the Reich-Rehabilitation Express. “What is it about Hitler? Why is he the most evil? she asked in July. “The first thing people would say is: ‘Well, an ethnic cleansing almost took place.’ And now I offer back: ‘You mean like we actually did to the Germans.'”
“Many Americans are learning that WW2 history is not as black and white as we were taught and some details were purposefully omitted from our textbooks,” she wrote after Carlson’s Holocaust conversation came under fire. The post received 15,000 likes.
https://www.theatlantic.com/ideas/archive/2024/09/anti-semitism-american-right-wing/679992/?gift=Gd7S8booB7khYN82BBPUIsdUEdZQc3tnIJS__scLvj4
Jews and Gypsies were isolated in ghettos, which were liquidated until the end of the war. Helping a Jew was punishable by death for the entire family.
Will the ozone hole in the south be there by December?
I would argue that it will.
https://www.cpc.ncep.noaa.gov/products/stratosphere/polar/gif_files/ozone_hole_plot_N20.png
Bindidon says:
October 4, 2024 at 2:56 PM
No hatred, Clint R. You claim has nothing to do with the reality:
Robertson, Clint R and Vournas know everything better than e.g. Roy Spencer.
Especially about GHE and the lunar spin.
And this is what makes you three simple-minded and ignorant people.
–
–
Bindidon, please show us where I said there isn’t GHE, and where I said there is not lunar spin?
Because what I always claim is that the atmospheric GHE exists, but it is very much small to be considered as a problem.
Also I always say that our Moon rotates, but it rotates very slowly, compared to Earth, which rotates 29,5 times faster.
Also I always say, that Earth’s surface is warmer than Moon’s, because there is a very powerful the solar irradiated planet surface rotational warming PHENOMENON.
–
–
For more information, please visit my site at:
https://www.cristos-vournas.com
Sorry Vournas
” Because what I always claim is that the atmospheric GHE exists, but it is very much small to be considered as a problem. ”
This is the same as saying there is no GHE.
*
” Also I always say that our Moon rotates, but it rotates very slowly, compared to Earth, which rotates 29,5 times faster. ”
This is now a pure lie.
Go back in the blog’s history and visit all your posts back to 2021 or so concerning the Moon.
No, Bindidon,it is not a pure lie.
https://www.drroyspencer.com/2024/07/an-unusually-warm-year-or-two-cannot-be-blamed-on-climate-change/#comment-1680012
I am on this blog since 2020. Please go and see what I was saying.
–
–
“Sorry Vournas
Because what I always claim is that the atmospheric GHE exists, but it is very much small to be considered as a problem.
This is the same as saying there is no GHE.”
I do not deny the GHE phenomenon though, what I say, it is not a problem, because it is too small.
https://www.cristos-vournas.com
Bindi, like the cultist he is, quickly resorts to the “L-word”. If someone disagrees with Bindi, that person is automatically a “liar”.
You can say someone is wrong, or is mistaken, or doesn’t understand the physics, but you can’t just call everyone that disagrees with you a “liar”. Doing so just makes you a cultist.
I have never called Bindi a “liar”. He clearly is not a scientist, and has no knowledge of physics, but I don’t call him a “liar”. He’s stuck in his false beliefs, like many of the others here, and he can’t learn, but I still don’t call him a “liar”.
Clint R can’t stop his ridiculous claims. Doesn’t matter…
*
What matters is what Vournas wrote a few months ago:
1. Christos Vournas on July 16, 2024 at 10:15 PM
” Earlier Moon was a planet orbiting sun. And at those times Moon rotated. ”
*
2. Christos Vournas on July 17, 2024 at 3:48 PM
Earlier Moon was a planet orbiting sun. And at those times Moon rotated.
…
In time the tidal phenomenon slowed the rotational rate for both of them (Earth and Moon) until it stopped the smaller Moons rotation completelly. ”
*
And by moving back on the blog’s threads, we could find many many more posts like the two above.
Thank you, Bindidon.
You know what a pure lie is, Bindidon?
A pure lie is when you pretending not to accept the Planet Surface Rotational Warming Phenomenon.
A pure lie is when you pretending like it is something not known to you.
And a pure lie is when you pretending you don’t understand what it is.
–
–
https://www.cristos-vournas.com
” A pure lie is when you pretending not to accept the Planet Surface Rotational Warming Phenomenon. ”
This is also a lie, Vournas.
I namely very well accept your ‘Planet Surface Rotational Warming Phenomenon’ which I called ‘excellent’ years ago already.
With one exception, however: your Φ coefficient which completely distorts the balance equation because you misuse it as multiplying factor instead of correctly inserting in the (1 -a) albedo expression.
Happy to know that. Thank you, Bindidon.
Also, thank you for your insistance about the lunar rotation. After much thinking, and a repeated approach to the issue, I finally know for sure that moons in solar system, all of them moons, not only our Moon – all of them, while orbiting their mother planet perform one rotation about their respective local axis,so they perform one rotation per orbit.
–
–
https://www.cristos-vournas.com
” I finally know for sure that moons in solar system, all of them moons, not only our Moon all of them, while orbiting their mother planet perform one rotation about their respective local axis,so they perform one rotation per orbit. ”
This reply is now bookmarked.
Thank you in turn for your honesty, which will certainly bring you harsh criticism on this blog from the lunar spin denier gang 🙂
See Bindi, CV doesn’t agree with me but I’m not using the ‘L-word”. Obviously he has tried to understand, but wasn’t able to. That doesn’t make him a cultist. What would make him a cultist is if he now called me a “liar”, because he doesn’t understand the physics.
Got it?
Clint R
The cultist who lacks any real scientific education, that’s you (together with a few guys who ‘think’ like you).
*
You never were able to produce any scientific contradiction to all the scientists I have listed:
https://drive.google.com/file/d/13DRDH1OFOUHYM_6HKH19sbj28yckJMF7/view
All you ever were able to do was to intentionally distort Newton’s wording in his Principia, Book III, Proposition XVII, Theorem XV.
False accusations don’t help you, Bindi. They just show you have NOTHING.
I’ve got a viable model of “orbiting without spin”. Even with all your ancient astrologers, you’ve still got NOTHING.
Blinny claims to not be a fascist but he has many characteristics that are fascist-like. For instance, he calls most who disagree with him a liar. And, he believes AGW deniers should be imprisoned. He has stated this on several occasions.
“Because what I always claim is that the atmospheric GHE exists, but it is very much small to be considered as a problem.”
Our ocean creates a larger greenhouse effect than our atmosphere. Even when our ocean is cold like it is in our current Ice Age.
Or if our ocean average temperature was 6 C, rather than 3.5 C, you got end of the world. global warming. And such warm ocean “might” get us out of our Ice Age.
Or the cargo cult global warmers don’t say higher CO2 levels will get us out of our Ice Age, but a much warmer ocean does exactly, that.
Most of Earth history had a much warmer ocean than our ocean, and most of Earth’s history was not in an Ice Age.
Also, the mythical Snowball Earth, requires a cold ocean- a bit colder than our 3.5 C ocean.
So what temperature does our ocean have to be, in this mythical Snowball Earth.
My guess is our ocean would have to be about 2 C or less.
Or if our ocean average ocean is warmer than 2 C, you can’t be in Snowball Earth global climate.
So that means if our sun stopped shining on the Earth surface for 1 year, it’s not a long enough time, to cause Earth to be in a Snowball Earth global climate.
Btw, impactors can cause a year of darkness on the surface of Earth.
Such darkness, would be huge climate change- and lots of life dies- and it’s happened in Earth history.
But as long as the sunlight returns, it doesn’t change much- and it wouldn’t get us out of this Icehouse global climate {Ice Age}.
SOLAR MINIMUM UPDATE
There is an 80 percent likelihood that the annual average global temperature will temporarily exceed 1.5C above pre-industrial levels for at least one of the next five years, according to a new report from the World Meteorological Organization (WMO). This is a stark warning that we are getting ever closer to the goals set in the Paris Agreement on climate change, which refers to long-term temperature increases over decades, not over one to five years.
https://wmo.int/news/media-centre/global-temperature-likely-exceed-15degc-above-pre-industrial-level-temporarily-next-5-years
bdgwx and John W.
Regarding WUWT and the Berkeley project: The issue is that the Berkeley project did not do what they said they would do. They accepted and incorporated the adjustments — such as TOB — that the “alarmists” do. Of course, if you do what others do, you are going to end up with what other get. They did not use an independent approach. At least one of the sponsors of the project (Judith Curry) disavowed her support of the project when they made this move. Moreover, the head of the Project indicated his degree of impartiality when he gave this reply, “I do not know why people are surprised at my actions. I have always been alarmed by Global Warming.”
By the way, I am not sharing this because I am “denying” that temperatures have risen. It seems without question that temperatures have risen in the last 50 years. However, I am not sure that our summers are hotter than they were 90 years ago. And we could get into a endless debate on that issue. My preference is to focus on the phenomena that concerns us in a warming world — like droughts or floods or hurricanes or tornadoes or deaths from meteorological events. On those fronts, I do not see a cause for alarm.
1. ” At least one of the sponsors of the project (Judith Curry) disavowed her support of the project when they made this move. ”
Emeritus Curry was not a sponsor; she contributed to some articles.
See, for her very first comments on BEST’s work:
Berkeley Surface Temperatures: Released
Posted on October 20, 2011 by curryja | 960 Comments
by Judith Curry
https://judithcurry.com/2011/10/20/berkeley-surface-temperatures-released/
This head post shows something quite different to your ‘impression’, doesn’t it?
*
2. ” Moreover, the head of the Project indicated his degree of impartiality when he gave this reply, I do not know why people are surprised at my actions. I have always been alarmed by Global Warming. ”
Here again, you put in Muller’s mouth something unknown to me.
Would you please show a source exactly confirming your claim?
*
3. ” However, I am not sure that our summers are hotter than they were 90 years ago. ”
Since dozens of years, the global temperature minima grow and grow – except in CONUS…
But maybe that for you, warming exists only when the Sun shines more…
*
Here is an example 100% derived from an analysis made years ago by John Christy on the base of USHCN and out of the raw, global GHCN daily data set.
a) CONUS
https://drive.google.com/file/d/1QZMvwvqdRRsaQGUv_jPQS2Rlc3BazVzh/view
b) Globe
https://drive.google.com/file/d/1ZPw5hQ2dCHzzavxced29ja70duheNcX0/view
Regarding the blog post on Climate Etc., Willard shared this with us a while back, but it’s worth revisiting for the humor:
https://judithcurry.com/2011/10/20/berkeley-surface-temperatures-released/#comment-126713
Berkeley Earth does not adjust data. Instead they use what they call the “scalpel” technique to split a station into two or more virtual stations upon each changepoint. That’s actually one of the unique elements of their methodology and why many skeptics supported it.
Judith Curry helped develop this method and signed off on it.
https://berkeleyearth.org/wp-content/uploads/2022/12/Methods-GIGS-1-103.pdf
Also, TOBS is a legitimate issue that needs to be addressed. There is literature documenting it that dates back to the early 20th century.
Judith Curry turned her back on Berkeley because she thought the leader was fudging the findings which she helped discover in a political manner. In other words, the leader was fudging the findings and skewing them to promote his climate alarm meme.
Ergo, Berkeley cannot be trusted.
Putting it more succinctly, the Berkeley Earth study in its current form is fudged to support climate alarm.
And as always, Robertson still behaves like what he constantly shows himself to be a disgusting liar:
” Judith Curry turned her back on Berkeley because she thought the leader was fudging the findings which she helped discover in a political manner. In other words, the leader was fudging the findings and skewing them to promote his climate alarm meme.
Ergo, Berkeley cannot be trusted. ”
*
He was proven wrong:
https://www.drroyspencer.com/2024/09/david-appell-awaiting-the-death-of-climate-skeptics/#comment-1690129
*
But Robertson never cares about contradictions and so always resorts to his endless lies – as in his intentional misrepresentation of for example
– NOAA’s absolutely ancient 1500 station story,
– the measles verdicts in the Lanka-Bardens case handed down by three German courts,
– Newton’s exact explanation of the reasons for the libration of the Moon,
– GPS vs. special and general relativity issues,
– the tiny differences between Newton’s and Einstein’s law of gravity under terrestrial conditions,
– etc etc etc.
The only thing the Berkley Project provides evidence to is that there appears to be a correlation between carbon and temperature.
There is a lot of research on the types of people who believe conspiracy theories, and their reasons. That part is settled.
What isn’t clear yet is why some people post conspiracy theories even though they don’t believe their own content. Some explanations offered are, to promote conflict, cause chaos, recruit and radicalize potential followers, profit, harass, or even just to get attention.
In the end these opportunists have to come to terms with why they are engaging in unethical and deceptive behavior and run the danger that they may end up convincing themselves. And thus, they may convince themselves that they aren’t lying by claiming they thought the conspiracy was true all along.
Conspiracy theory claims are the newest means used by climate alarmists and the politically-correct to discredit anyone who disagrees with them. If it’s not a claim of conspiracy theories it’s a claim of misinformation.
It’s either that or groups using epithets like homophobia or Islamophobia against anyone who speaks out against those factions. Even if the opposition is factual and not intended as an attack, the epithets are applied.
What rich irony. Criticising the use of negative label while using the very technique yourself. Alarmist, huh? No one you disagree with here posts alarming stuff about climate change, so the epithet is not just a lazy way of dismissing them, it’s totally inaccurate.
Which is par for the course for people who do what you criticise. Thank you for the demonstration!
I suddenly remember that there is some need to comment Sherrington’s post he wrote on Geoff on October 2, 2024 at 10:25 PM.
It begins with
” Many people who comment here seem to have a wish in mind for a particular temperature pattern. Hard scientists do not do this, they use what the data tells them. ”
Aha. That’s really bold, because his entire post reflects exactly what he obviously accuses others of.
” For many months now, as an Aussie, I have created a simple graph to show the Monckton style of pause for the lower troposphere over Australia.
…
Its pattern might forecast a turning point better than some other methods.
Here is the ‘wishful’ graph to the start of October 2024 and possibly the end of the long graphs for many months to come…
https://www.geoffstuff.com/uahoct2024.jpg ”
*
First, let’s ignore the detail that Sherrington didn’t even notice that his “trend of +0.000001” that he took from his Excel image does not express C/decade as is used everywhere else, but C/month; so you have to multiply it by 120 for now.
Let’s also ignore the fact that the trend for Australia from 2016 to today is still almost zero at 0.02 C/decade, but its standard error is 10 times higher at +- 0.2, which makes the trend completely useless for this period of only 8 years due to the very high deviations in the UAH ‘AUS’ time series.
Perhaps he never read WoodForTrees’ designer Paul Clark’s recommendation not to give much importance to trends over very short periods of time: they can tell you anything and its contrary.
*
It is much more relevant to point out that “as an Australian” he seems to overlook the fact that his Australian homeland consists of a tiny 7.7 million km^2 of land, which is just 5% of the total land area of the earth, and that this continent is even an island.
How he comes to consider this Australia as a useful starting point for a global extrapolation remains his secret when he writes:
” Its pattern might forecast a turning point better than some other methods. ”
Here is a graph that shows that his approach is just as useless as the American CONUS:
https://drive.google.com/file/d/1zmngt2zt_ijjLWxnrTOtM3dFJWpqaqWH/view
While the trends for Australia and CONUS in the much too short period 2016-2024 are 0.02 +- 0.20 and 0.08 +- 0.26 C/decade respectively, the trend for the global landmass is with 0.53 +- 0.12 C/decade about 25 times higher than for Australia.
On a global level, we keep very, very far away from any ‘turning point’.
Another hurricane will form very quickly in the western Gulf of Mexico due to a 500 hPa jet current loop. It will quickly strengthen and gain a large vortex force before entering Florida near Tampa.
I can hardly wait for the idiot claims that the hurricane was caused by global warming.
–Flyby
Posted on 2024-08-30 13:01:13
NASA’s Parker Solar Probe executed a short maneuver on Aug. 26 that kept the spacecraft on course to hit the bullseye for the mission’s seventh and final planned Venus flyby on Nov. 6.
Operating on preprogrammed commands, Parker fired its small directional thrusters for about 17 seconds, changing its velocity by less than a mile per hour, and setting its trajectory some 386 miles (593 kilometers) closer to a targeted approach point about 240 miles (380 kilometers) above the Venusian surface. The mission operations team at the Johns Hopkins Applied Physics Laboratory (APL) in Laurel, Maryland, where Parker was designed and built, monitored the activity through NASA’s Deep Space Network antenna station in Goldstone, California.
…
—
https://parkersolarprobe.jhuapl.edu/News-Center/Show-Article.php?articleID=199
Linked from: https://parkersolarprobe.jhuapl.edu/
So, just completed it’s latest closest distane and:
Countdown to Closest Approach:
Dec 24, 2024 11:48:51 UTC
79 days 15 hours 20 minutes
Your current UTC time: 2024-10-05T20:28:15.168Z
So in less than 80 days, it swing by Venus, and use gravity assist to get it, the closest it plans to go the sun.
{though plans might change,…}
Suns Magnetic Field is About to Flip, and Theres a Problem
142K views 2 months ago
https://www.youtube.com/watch?v=bBfWB2C5ivc
Doomy.
But what about the Parker solar probe?
When is it going to flip?
Well, certainly when Parker solar probe is flying.
Will be near sun or out at Venus distance
SOLAR MINIMUM UPDATE
A new report has published detailed complaints from users of [Donald]’s Truth Social app describing how they were fleeced by the site’s hordes of scammers – including some who lost six-figure sums.
https://www.rawstory.com/truth-social-scam-idiots
Why would scammers target DJT?
I hope somebody here sells calls.
Good or bad news for Starship Flight 5?, SpaceX Ground Themselves!?, and Vulcan Flight 2 Success!
Marcus House
https://www.youtube.com/watch?v=J-_1ocNvFEo
RocketLaunch.Live
https://www.rocketlaunch.live/
OCT 07 07:52 AM
Falcon 9 Hera:
“The Hera mission, part of an international planetary defense initiative, aims to study the aftermath of NASA’s earlier DART mission. Hera will closely examine the Didymos binary asteroid system, specifically focusing on the smaller moon, Dimorphos, which was impacted by DART. By conducting detailed observations, Hera will gather crucial data on the asteroid’s surface characteristics, internal structure, and the effects of the DART impact, providing valuable insights into asteroid deflection techniques for future planetary defense efforts.”
OCT 08 11:03 PM
Falcon 9 OneWeb-20
OCT 10 09:31 AM
Falcon Heavy Europa Clipper:
“The Europa Clipper mission is designed to explore Jupiters icy moon Europa, which is believed to harbor an ocean beneath its thick ice shell.”
OCT 13
Starship Prototype Starship Test Flight 5
OCT 25 11:44 PM
H-3 [Japan’s new rocket] Kirameki 3
“H-3 Launch Vehicle No. 4 will launch X-band defense communications satellite “Kirameki-3”
OCT 29 09:49 PM
CRS2 SpX-31 (Dragon)
Falcon 9
OCT 2024
Falcon 9 Starlink (10-10)
NOV 05
Soyuz-2
Ionosfera-M n1, 2 & Others :
“The first two of a planned constellation of four spacecraft for the first Russian space weather monitoring system called “Ionozond”.”
NOV 21
Soyuz-2 Progress MS-29:
“90th Progress cargo delivery to the International Space Station (90P)”
NOV 30
Kondor-FKA no.2
Soyuz-2:
“Russian Kondor-FKA satellites built by NPO-Mashinostroyenia, are intended for 24/7 all-weather radar remote sensing of the Earth in medium and high resolution.”
NOV 2024
New Glenn Flight 1
New Glenn
“Congress had originally mandated that Europa Clipper be launched on NASA’s Space Launch System (SLS) super heavy-lift launch vehicle, but NASA had requested that other vehicles be allowed to launch the spacecraft due to a foreseen lack of available SLS vehicles. The United States Congress’s 2021 omnibus spending bill directed the NASA Administrator to conduct a full and open competition to select a commercial launch vehicle if the conditions to launch the probe on a SLS rocket cannot be met.
On January 25, 2021, NASA’s Planetary Missions Program Office formally directed the mission team to “immediately cease efforts to maintain SLS compatibility” and move forward with a commercial launch vehicle.
On February 10, 2021, it was announced that the mission would use a 5.5-year trajectory to the Jovian system, with gravity-assist maneuvers involving Mars (February 2025) and Earth (December 2026). Launch is targeted for a 21-day period between October 10 and 30, 2024, giving an arrival date in April 2030, and backup launch dates were identified in 2025 and 2026.”
https://en.wikipedia.org/wiki/Europa_Clipper
I didn’t know it was going to flyby Mars- I guess they can test out their instruments on Mars and guess they test them on Earth, also.
Wiki continues:
“The SLS option would have entailed a direct trajectory to Jupiter taking less than three years. One alternative to the direct trajectory was identified as using a commercial rocket, with a longer 6-year cruise time involving gravity assist maneuvers at Venus, Earth and/or Mars. Additionally, a launch on a Delta IV Heavy with a gravity assist at Venus was considered.
In July 2021 Falcon Heavy was chosen to launch the spacecraft. Three reasons were given: launch cost, SLS availability, and “shaking”. The move to Falcon Heavy saved an estimated US$2 billion in launch costs alone. NASA was not sure an SLS would be available for the mission since the Artemis program would use SLS rockets extensively, and the SLS’s use of solid rocket boosters (SRBs) generates more vibrations in the payload than a launcher that does not use SRBs. The cost to redesign Europa Clipper for the SLS vibratory environment was estimated at US$1 billion. “
Assuming it successfully launches in four days, and unfolds it’s huge solar panels and gets everything working, and arrive in 2030, what going to happen before 2030?
As I said, they could get results looking at Mars, and also from looking at Earth [and/or our Moon]. But I mean everything else, happening. Such as we should Have the New Glenn rocket flying and it’s first stage being recovered and maybe it’s second stage being recovered.
It also seems the Japanese rocket {H-3} could be launched a lot times by this time period.
Also it seems we will have orbital depot in LEO- maybe two of them.
And as I said, Starship needs to be launched and recovered in the Ocean, and it could have ocean launch platform before 2030. Though before ocean lanuching, SpaceX could have 3 or 4 land launch towers for the Starship, and be launching say +50 times a year with the Starship. And SpaceX could still be flying Falcon rockets.
And should have Starlink “finished” and other companies or China having one also. Starlink will also be on Mars- and elsewhere.
“NASA’s Deep Space Optical Communications technology demonstration broke yet another record for laser communications this summer by sending a laser signal from Earth to NASA’s Psyche spacecraft about 290 million miles (460 million kilometers) away.”
https://www.jpl.nasa.gov/news/nasas-laser-comms-demo-makes-deep-space-record-completes-first-phase/
And Psyche will have arrive at it’s space rock by August 2029. Which was also launch by Falcon Heavy.
Hurricane Update:
Milton is forecast to be a major hurricane when it hits the gulf coast of Florida on Wednesday. The cone is very wide so it could hit anywhere.
At the same time, Kirk will be a TS when it hits France. That is unusual.
https://www.nhc.noaa.gov/
Update to the update:
The very latest 10 PM CDT advisory has it weakening and hitting Wednesday evening. It is still a very wide forecast cone.
Now it is forecast to be a major hurricane land-falling Wednesday afternoon. The cone has narrowed but still very wide and centered near Tampa.
Currently 13C in Vancouver, Canada at 7 pm. Not a sign of any unusual warming. A month ago the temps were between 25C and 30C.
We on Earth are on a planet orbiting the Sun. The planet’s axis is tilted at about 23 degrees to the orbital plane, causing variations in global temperature as the planet leans toward and away from the Sun. The variations in average temperatures in any locale far exceed a pithy 0.5C transient warming.
The temperature at the South Pole is currently -54C and feels like -72C. If we could transpose the current 0.5C warming, at the South Pole it would be -53.5C and feel like -71.5C. Don’t think anyone living there would appreciate such a pithy warming effect.
Whatever is causing the current relative spike must be taken in context. It cannot be from the effect of CO2 since the entire planet took 170+ years to warm 1C.
Nobody is claiming that the current temperature spike is caused by CO2that’s a straw man argument of yours.
Zeke Hausfather, in his recent Substack post, effectively communicated the uncertainties surrounding the global temperature anomaly. I recommend reading his work, as well as Andrew Dessler’s:
https://substack.com/home/post/p-148686873
john recommends read Dessler, one of the prima donna’s of climate alarm. Ironically, I have never seen an objective scientific post from John, he prefers throwing stones from his glass house.
It’s so funny that you believe you’re qualified to determine what constitutes an objective scientific post.
John W
Here’s a zoom on Robertson’s main skills: to distort, misrepresent, discredit, denigrate and lie
https://www.drroyspencer.com/2024/09/uah-global-temperature-update-for-august-2024-0-88-deg-c/#comment-1686713
” Binny knows about as much about statistics as a weiner schnitzel, RLH is the statistics expert around here.
All Binny does is sit in front of an Excel app, dressed in his lederhosen and alpine hat, asking his girlfriend how to operate Excel. Every once in a while he yodels out the window, for no apparent reason. ”
*
I try to imagine Robertson downloading data like
– https://www.nsstc.uah.edu/data/msu/v6.0/tlt/
– https://www.ncei.noaa.gov/pub/data/ghcn/daily/ (no access, Helene)
– https://www.psmsl.org/data/obtaining/rlr.monthly.data/rlr_monthly.zip
into Excel (in fact, he isn’t even able to use the tool).
*
Finally, the very best was to see Blindsley H00d (RLH for the blog), recently admitting:
” I learned simple statistics. ”
*
So much for how quickly you become an ‘expert’ in Robertson’s eyes: you just need to promote ‘No global warming seen so far.’
It’s quite obvious he doesn’t study most, or any, of what he writes. His talking points have remained the same for a long time.
–The Milky Way Might be Part of an Even Larger Structure than Laniakea
If you want to pinpoint your place in the Universe, start with your cosmic address. You live on Earth->Solar System->Milky Way Galaxy->Local Cluster->Virgo Cluster->Virgo Supercluster->Laniakea. Thanks to new deep sky surveys, astronomers now think all those places are part of an even bigger cosmic structure in the neighborhood called The Shapley Concentration. —
https://www.universetoday.com/168816/the-milky-way-might-be-part-of-an-even-larger-structure-than-laniakea/#more-168816
Or: https://www.universetoday.com/
The top recent article.
So I am lost in Universe and there are space aliens, and I say
I am from Laniakea which is in the Shapley Concentration.
Which probably means nothing to them.
“Astronomers refer to the Shapley Concentration as a basin of attraction. Thats a region loaded with mass that acts as an attractor. Its a region containing many clusters and groups of galaxies and comprises the greatest concentration of matter in the local Universe.”
So could instead say, I am from the largest amount of gravity mass in our local universe.
And then aliens should say: “Poor thing, you don’t want to go back- do you?”
binny…”2. Moreover, the head of the Project indicated his degree of impartiality when he gave this reply, I do not know why people are surprised at my actions. I have always been alarmed by Global Warming.
[binny]Here again, you put in Mullers mouth something unknown to me.
***
Binny had his head buried in the sand and was unable to hear Muller’s comment. Muller is a climate alarmist, he admitted that, and Judith Curry confirmed it by revealing the way he fudged the original data on the Berkeley Earth study to suit his alarmist views.
Nothing new for Binny. When I posted a direct link to NOAA, in which they admitted to slashing global land surface temperature reporting stations from 6000 to less than 1500, he went into complete denial. His only comeback was that NOAA’s claim was old. He could not supply proof that NOAA had changed from less than 1500 stations but he insisted the NOAA claim is wrong.
Now Binny is claiming people are putting words in the mouth of Muller.
The usual untruth.
NOAA does not anywhere in that link say, much less “admit” they deliberately deleted (“slashed”) any stations.
That’s in your imagination, which you call ‘reading between the lines’.
barry
Genius Robertson means this completely outdated blah blah he moreover intentionally misrepresents:
https://web.archive.org/web/20100323000433/http://www.noaa.gov/features/02_monitoring/weather_stations.html
*
I recently did again some more research on the Wayback Machine aka Web Archive, trying to obtain info about how many stations existed in which GHCN period.
All station lists in GHCN V2 (v2.inv, v2.temperature.inv) show 7280 stations, even the oldest one in… 1997!
Nowhere do you see any document talking about 6000 stations.
*
Thus I searched for archive data concerning GHCN V1, but found no station list file in the Web Archive.
But, surprise: in the well hidden ‘Oak Ridge National Laboratory’ corner, I found
https://daac.ornl.gov/daacdata/global_climate/CDIAC_NDP41/comp/temp.statinv
This station list has – yes – 6039 units
(you must register at ‘urs.earthdata.nasa.gov’ to obtain access).
*
Hmmmmh…
This gives me the impression that the original contents of this prehistoric NOAA page mentioning 6000 stations (and NOT: 7280) very probably was born long before GHCN V1 was upgraded to V2, i.e. long before 1997.
*
What technically incompetent polemicists like Robertson – whose engineer vita is 100% invented – cannot explain, is this:
https://drive.google.com/file/d/1Y6RnFCGM8QcnpWx6aog9eH1tlVCytEiK/view
Look at the green plot: that’s NOAA data coming from their ‘Climate at a Glance’ national page.
If there are only 1500 active ‘NOAA’ stations worldwide (1 per 100,000 km^2), then there must be less than 100 stations for CONUS, even less than airports on my chart.
Why not? After all, you need no more than 256 of UAH’s 9504 cells to obtain a time series amazingly similar to the original:
https://drive.google.com/file/d/1UlobgSX7gJuW4900BupXPfdYrgHU8Wqn/view
barry (addendum)
An interesting document
The global historical climatology network: Long-term monthly temperature, precipitation, and pressure data
Vose & al. (1992)
https://inis.iaea.org/collection/NCLCollectionStore/_Public/24/026/24026315.pdf?r=1
Hi Bin,
Good spotting. I had briefly questioned in my mind a few years ago why they said 6000 stations instead of the 7280 they had in the full dataset at the time. You may have hit on the answer.
I’d downloaded Vose 92 while researching the history of the dataset. There is a much longer version of the paper you linked here:
https://www.osti.gov/biblio/10178730
This includes of a lot detail, like coding, as well as the data for the stations, which I would think is unusable in that PDF form.
Thanks for the OSTI link, I just bookmarked it one hour ago :–)
barry (final)
Here is the pdf file explanation file for GHCN V1:
https://daac.ornl.gov/daacdata/global_climate/CDIAC_NDP41/comp/CDIAC_NDP41.pdf
Unfortunately, it has been updated regularly; the oldest entry in the web archive dates from 2021 and … access to it is denied (my very first experience of this kind).
SOLAR MINIMUM UPDATE
Help keep yourself, your family and your community safe after Hurricane Helene by being aware of rumors and scams and sharing official information from trusted sources.
Do your part to the stop the spread of rumors by doing three easy things:
1. Find trusted sources of information.
2. Share information from trusted sources.
3. Discourage others from sharing information from unverified sources.
https://www.fema.gov/disaster/current/hurricane-helene/rumor-response
nate…”Barry sez:
Its amusing to see Clint admitting the GHE exists
He did say that water in the stratosphere is producing a GHE.
This is TRUE.
after arguing long and loud for the opposite, claiming its impossible because of the 2nd Law, and that a cooler source of radiation cannot add energy to a surface warmed by a warmer source.”
***
I have never seen Clint claim that any warming related to HTE is about warming the atmosphere in contradiction of the 2nd law. He has talked about WV injected into the stratosphere by the HTE as affecting the polar vortex.
I would not expect Barry or Nate to understand such luminary science. After all, both are experts in the pseudo-science of climate alarm, where propaganda reigns supreme.
He said it upthread, Gordon.
October 2, 2024 at 9:51 AM
Clint: “luke, HTE is the ‘Hunga-Tonga Effect’. It was caused by the huge underwater volcano that launched millions of gallons of water into the Stratosphere. The combined effect includes atmospheric waves that disrupted the Polar Vortex, a REAL greenhouse effect from the water vapor, and possible yet-to-be determined effects from the chemistry of chlorine and ozone.”
https://www.drroyspencer.com/2024/10/uah-global-temperature-update-for-september-2024-0-96-deg-c/#comment-1690284
Nothing I said violates 2LoT, barry. And there were no inconsistencies in what I said.
Can’t you get anything right?
As usual, no science, no rebuttal.
How can cold water vapor cause a GHE and thereby warm the warmer surface of the Earth?
Sure sounds inconsistent with 2LOT as you have stated it so many times in the past.
The more you stalk me Nate, the more you prove me right.
https://www.drroyspencer.com/2024/10/uah-global-temperature-update-for-september-2024-0-96-deg-c/#comment-1690550
Keep proving me right. I can take it.
Nah, all I prove is that you will not back up your nonsense claims.
It is simple. If you are going to make claims here, then be prepared to defend it.
It was properly and clearly defended child Nate.
But the simple explanations were so far over your head you couldn’t even correctly state them. Now you’re reduced to false accusations and stalking, which proves me right.
Looks like Clint is forgetting what he said in 2022.
“a flux with photons that have an average frequency above the average vibrational frequency of the surface molecules will be largely absorbed, warming the surface. If a flux has photons with an average frequency lower than the average vibrational frequency of the surface molecule, it will not be able to warm the surface.
In simple-to-understand terms, ‘cold’ can NOT warm ‘hot’. ”
https://www.drroyspencer.com/2022/04/uah-global-temperature-update-for-march-2022-0-15-deg-c/#comment-1252785
In 2024 he now says there is a real GHE from WV in the stratosphere.
Trouble is, the surface is 15C, and the lower stratosphere is -50C.
We won’t be getting an explanation of this from Clint, though. He can’t do it.
“It was properly and clearly defended child Nate.”
Where?
Its quite obvious that whenever your science is challenged, your go to tactic is to run away, while tossing ad-hom grenades behind you.
Real scientists have to have real answers when their theories are challenged.
Stephen P Anderson,
Joint Statement from Elections Infrastructure Government Coordinating Council & the Election Infrastructure Sector Coordinating Executive Committees
Released November 12, 2020
WASHINGTON The members of Election Infrastructure Government Coordinating Council (GCC) Executive Committee Cybersecurity and Infrastructure Security Agency (CISA) Assistant Director Bob Kolasky, U.S. Election Assistance Commission Chair Benjamin Hovland, National Association of Secretaries of State (NASS) President Maggie Toulouse Oliver, National Association of State Election Directors (NASED) President Lori Augino, and Escambia County (Florida) Supervisor of Elections David Stafford and the members of the Election Infrastructure Sector Coordinating Council (SCC) Chair Brian Hancock (Unisyn Voting Solutions), Vice Chair Sam Derheimer (Hart InterCivic), Chris Wlaschin (Election Systems & Software), Ericka Haas (Electronic Registration Information Center), and Maria Bianchi (Democracy Works) – released the following statement:
The November 3rd election was the most secure in American history. Right now, across the country, election officials are reviewing and double checking the entire election process prior to finalizing the result.
When states have close elections, many will recount ballots. All of the states with close results in the 2020 presidential race have paper records of each vote, allowing the ability to go back and count each ballot if necessary. This is an added benefit for security and resilience. This process allows for the identification and correction of any mistakes or errors. There is no evidence that any voting system deleted or lost votes, changed votes, or was in any way compromised.
https://www.cisa.gov/news-events/news/joint-statement-elections-infrastructure-government-coordinating-council-election
You rely on election officials to say the election was rigged???
There were many irregularities in the vote counts, enabled by the excuse that covid prevented them allowing scrutineers close to the vote counting. Election officials used covid as an excuse to blatantly disregard democratic principles.
Scrutineers are vital to a fair vote counting method. they must be allowed to see the ballots being counted and to examine them if necessary. During the last US election, based on feeble excuses about covid infections, scrutineers were forced to view from a distance and in some cases they were banned outright from the facilities where votes were being counted.
That alone reveals that the election officials claiming the last election was the most secure are obviously lying. Not only that, the computers doing the counting came under suspicion when it was revealed that the company involved had been involved in rigged election in banana republics. That does not infer they were crooked but it does call attention to their history.
Then there was the study in which thousands of cell phones were tracked from a massive data base. It revealed people visiting several voting stations and inserting multiple votes per station visited. There was also corruption reported in poorer areas where blank votes were purchased.
The biggest issue, however, was people being allowed to vote in states in which they did not live and were not reistered.
Efforts to fix the system, especially allowing illegal immigrants to vote, is being strongly resisted by the Democrats.
Until all of this is addressed and fixed, I expect another fixed election this November.
” Then there was the study in which thousands of cell phones were tracked from a massive data base. It revealed people visiting several voting stations and inserting multiple votes per station visited. ”
And where is that ‘study’, liar Robertson?
There is no study.
Trump’s own Department of Justice along with several other judges appointed by him, as pointed out by others above, have found no credible evidence of widespread voter fraud that could have affected the outcome of the election.
Why are there so many people that worship Trump? I don’t understand it at all.
You cult kids are so naive.
Trying to prove flaws in a flawed system, when the system is controlled by flaws?
It’s somewhat analogous to asking all the looters to bring back the stuff they stole. And when nothing comes back claiming that is proof no one stole anything!
Most States didn’t even require photo ID last election. In this coming election, it will only be slightly better.
https://www.nbcnews.com/politics/2024-election/voter-identification-states-law-map-rcna137555
Onus is on the people claiming fraud.
The same people here who are saying the evidence doesn’t exist because of the fraud.
Oblivious to their own circular reasoning.
The cult children believe the onus is on the store owners to prove theft, since none of the items were returned.
Kids these days….
From WP
https://www.washingtonpost.com/politics/2024/10/06/mike-johnson-donald-trump-election/
” Johnson won’t say Biden won in 2020, raising worries on 2024’s process
In a TV interview, House Speaker Mike Johnson (R-La.) wouldn’t say that Donald Trump lost in 2020, calling the question a ‘gotcha game’.
In the immediate aftermath of the 2020 election, Johnson led a congressional effort to overturn the presidential results in four battleground states. ”
Yeah.
https://www.drroyspencer.com/2024/10/uah-global-temperature-update-for-september-2024-0-96-deg-c/#comment-1690988
Fantasists still try to claim that having no evidence is proof of fraud.
Cult children close their eyes and pretend it doesn’t exist.
Fantasists all up and down this comment section claiming fraud and producing nothing to substantiate it. Nothing specific, just generalisations.
Same thing that happened to many of the suits filed in 2020. Dismissed for hearsay and speculation.
Why do MAGAs think that their claims are true without any concrete evidence? Is it “alternative facts?”
Cue another response with no concrete evidence in 3…
barry, you can’t see reality, but you believe you can make up your own reality.
Then, you call anyone that doesn’t agree with you a “lying dog”.
That’s what cultists do.
It is no surprise that Clint R aligns with MAGA.
Unlike him, the rest of us aim to set a positive example for our grandchildren.
ark…”Happy Thursday America”.
***
America is a continent, the country to which you refer is the United States OF America, meaning the country called the United States is located in the continent of America.
If you disagree, find me a country on any global map called America.
***
“Republican Tina Peters, the screaming, kicking, election interfering sh!tgibbon, was sentenced today to 9 years in prison”.
….who was found guilty of four felony counts for helping Trump breach the countys election computer systems in an elaborate election tampering scheme”.
***
This sentence is a gross violation of anything humanitarian or democratic. What, exactly, did she do? Did she kill someone? Was she armed? Did anyone prove she intended to participate in an insurrection to overthrow the US government?
Has anyone proved that Trump was in any way involved? No!!! Yet, several Democratic states have tried to leave him off the presidential ballot based on innuendo that he tried to commit an insurrection against the US government.
The clear danger in the US right now is the Democrats. In all my years of living next to the US, I have never seen the likes of this.
I am stating the above based on a life in which I was left of centre. I have always defended democracy and if called, I would gladly got to war to defend it. I do not support Trump’s politics but I will fight to defend his right to state them or run for President. Even though I don’t support his political views, I found him to be a breath of fresh air compared to the politically-correct loonies running the US today.
—-
“What really disgusts me about Peters and the other fake electors is that she truly believes her vote matters more than yours or mine. The arrogance of these people pisses me off. Karma she so richly deserves”.
***
What would someone like you know about the democratic voting process after a Neanderthal comment like above? It’s ironic that people who write off others as being arrogant are among the most arrogant.
The continents are North America and South America.
Buy a geography book or a map.
“the country to which you refer is the United States OF America”
Are you honestly try to tell us that you don’t know that “American” and “America” are commonly used to refer to the country south of Canada???
“What, exactly, did she do?”
Well, maybe you should find out before discussing whether the sentence was too harsh. She could have been sentenced to up to about 20 years, so 9 is not extreme.
“several Democratic states have tried to leave him off the presidential ballot based on innuendo ”
No, on two different counts.
1) Private citizens and private groups tried to prevent Trump, not “Democratic states.
2) It was based on events of the Jan 6; events that could reasonably be considered ‘insurrection’ by some people.
The issues were brought before judges to be decided … exactly how it should be in a democracy.
A tropical wave is approaching northern Australia.
https://i.ibb.co/PCnYCCX/mimictpw-ausf-latest.gif
Central and Eastern Pacific Upper-Ocean (0-300 m)
https://www.cpc.ncep.noaa.gov/products/analysis_monitoring/enso_update/heat-last-year.gif
“La Nia is favored to emerge in September-November (71% chance) and is expected to persist through January-March 2025.”
La Nina will be colder than El Nino.
Thank you, Captain Obvious.
” … and is expected to persist through January-March 2025. ”
Woaaah. More than three La Nina months! That’s definitely horrible.
The Globe is amazingly cooling, I tell ya.
But the northern hemisphere will be cold in winter. Due to the warm Atlantic, there will be a lot of rain and snow in Europe.
The snow cover in the Alps is above average for early October. ❄️🙌 Austria, in particular, has seen the most snow in recent years, and the first ski resorts are already opening. Check out the snow comparison from our archive: https://www.ventusky.com/?p=46.54;13.47;6&l=snow
https://www.ventusky.com/?p=46.54;13.47;6&l=snow&t=20231006/1800
https://i.ibb.co/D4MPGcG/ventusky-snow-20231006t1800-47n12e.jpg
More snow will not cool the world.
Bookmarked:
https://www.drroyspencer.com/2024/10/uah-global-temperature-update-for-september-2024-0-96-deg-c/#comment-1690954
RLH – Actually, enough snow sustained over a wide area could increase the Earth’s albedo, just as declining polar ice is increasing the albedo. I just don’t expect to see it.
SOLAR MINIMUM UPDATE
https://www.jkclimate.fr/Dashboard/dash.html
October 4, 2024 3:06 pm Robert Zimmerman
–October 4, 2024 Quick space links
Courtesy of BtBs stringer Jay. This post is also an open thread. I welcome my readers to post any comments or additional links relating to any space issues, even if unrelated to the links below.
ASTSpaceMobiles 1st Bluebird cell-to-satellite satellite in orbit is about to go operational
The satellites are the largest commercial arrays ever placed in orbit, 700 square feet in area.
German startup Polaris Spaceplanes raises 7.1 million in private investment capital
It will use the funds to develop its Aurora multipurpose spaceplane and hypersonic transport system.
On this day in 1957, the Soviet Union opened the space age by launching the first artificial satellite, Sputnik
And as they say, the rest is history.–
https://behindtheblack.com/
Russia Is Changing Its Nuclear Doctrine – Atomic Coercion, Ukraine & the Nuclear Threshold
Perun
https://www.youtube.com/watch?v=F7aUoEnVCWQ
My Summary, Russia “Atomic Coercion” has been working. Russia starting nuclear war is unlikely. But generally, Atomic Coercion, “working” more, could lead to nuclear war.
Or in my opinion it seems to me, Iran will be the nation which most likely starts WWIII, and lessor chance, is China starting it. Followed by who knows what or who will start it- which could related to the modest success of Russia’s Atomic Coercion, having some small benefit to Russia.
Russia has made it clear from the get-go that any Western nations interfering with them in the Ukraine face a nuclear war. So, who are the real ijits here?
We know that supporting the Ukraine could lead to a nuclear war, yet we in the West are escalating the issue by considering supplying the Ukraine with long range missiles that can strike at targets well within Russia.
I am not worried about Russia, I am worried about our own Western ijits who are poking the bear. It would have been one thing had the Russians taken over the entire Ukraine but thus far all they have done is take over the Donbass region as they indicated they would. They have done that, as they claimed, to protect Russian speaking Ukrainians in the region who were being oppressed by Kyiv.
Whether that is the truth or just propaganda remains to be seen. Russia claims they want to offer the Donbass people a vote to determine their future. Presumably, such a vote would be scrutineered by the international community.
Let’s face it, the Ukraine is a corrupt mess and we need to get them to the table to discuss their issues. I suspect the refusal of Zelensky to talk is fueled by Ukrainian nationalists, who honour war criminals like Stepan Bandera who was wanted at Nuremberg to answer for war crimes.
“Russia has made it clear from the get-go that any Western nations interfering with them in the Ukraine face a nuclear war. So, who are the real ijits here?”
Obama and Biden.
Discussing the potential of Ukraine being a NATO country, is just extremely stupid, or it’s wanting to increase US arms exports {which Biden has managed to increase significantly- globally- not the small fraction to Ukraine}.
Maybe, it was to decrease Russia’s military involvement in Africa- that could possibly be counted as a plan. But if giving money to Iran at same time, that goes in the opposite direction. Russian Mercs vs Iranian terrorists- I think, I might slightly favor the Russian mercs, which are quite hideous.
“We know that supporting the Ukraine could lead to a nuclear war, yet we in the West are escalating the issue by considering supplying the Ukraine with long range missiles that can strike at targets well within Russia.”
Biden said he wanted to weaken Russia. That is dumb idea on many levels. But you don’t want a weak state which has a lot nuclear weapons.
Let’s take France, you want France to have enough conventional weapons it could use, without France being required to use nuclear weapon as it’s military policy.
Using just nukes, would involve spending less on your military, but it’s a bad idea.
The updated forecast predicts that ex-hurricane #Kirk will hit central France and northwest of Spain.🧐 In many areas, gusts are expected to exceed 110 km/h, and extensive damage is possible. See accumulated wind gust map: https://www.ventusky.com/?p=47.0;6.9;5&l=gust-ac&t=20241010/1500
SOLAR MINIMUM UPDATE
[Donald] over the weekend spoke in Butler, Pennsylvania, where the former president delivered remarks at the location of an attempt on his life three months prior. Republican vice presidential nominee J.D. Vance was slammed for a perceived insult to the man who died during that assassination attempt, and [Donald] himself paused the rally for several minutes for a medical emergency.
[Donald] also welcomed to the rally stage Elon Musk, the owner of the social media company previously known as Twitter.
Musk predicted that, if [Donald] doesn’t win the upcoming presidential election, it will be our last election.
But users of Musk’s own social media site were more focused on his abilities, or lack thereof, as a speaker.
Former [Donald] campaign aide A.J. Delgado, for instance, wrote on X, “I don’t give a s— about this rally but just saw this on my feed and had to remark (a) what a horrible public speaker Elon is… my goodness — I’m cringing; (b) Elon, never wear a baseball cap again. They do not work on you.”
https://www.rawstory.com/elon-musk-socially-awkward-trump-rally/
As the US federal election approaches and we’re talking about it here, it might be worth revisiting what real election interference looks like, with Trump pressuring Republican Sec of State Brad Raffensperger in Georgia that 12000 votes need to be found to flip the state.
Raffensperger tells the president that all the information he has is wrong, but Trump keeps putting the screws on.
Transcript of the infamous call which is in evidence in the election interference case against Trump.
https://edition.cnn.com/2021/01/03/politics/trump-brad-raffensperger-phone-call-transcript/index.html
There are numerous great transaction to quote, but this is possibly the most telling:
Raffensperger: Mr. President, the problem you have with social media, they people can say anything.
Trump: Oh this isn’t social media. This is Trump media.
barry, you seem like an objective person seeking the truth, so let’s test that assumption. I cannot defend Trump because he clearly went off the rails. Let’s see how he got there.
First we have this:
https://oig.justice.gov/node/16547
And the full report in pdf form:
https://www.justice.gov/storage/120919-examination.pdf
[We are deeply concerned that so many basic and fundamental errors were made by three separate, hand-picked investigative teams; on one of the most sensitive FBI investigations; after the matter had been briefed to the highest levels within the FBI; even though the information sought through use of FISA authority related so closely to an ongoing presidential campaign; and even though those involved with the investigation knew that their actions were likely to be subjected to close scrutiny. ]
The Mueller investigation is proven to be a complete fraud.
That was followed by an impeachment charge based on a phone call in which he was trying to get information about the activities of the Biden crime family in Ukraine (more on that below). That might be enough to make some people think that the Democrats and others in the government were not play fair, but there is much more.
Then in what appears to be a drug induced stupor, Hunter Biden leaves his laptop at a pawn shop and loses ownership after failing to claim it after the agreed time. This laptop has all of the evidence against the Biden crime family that Trump was seeking in the phone call for which he is impeached, and much more than anyone imagined. Hunter is keeping 10% for the big guy.
Literally within hours of the news story, 51 former intelligence officials claim it “has all the classic earmarks of a Russian information operation” — yes, they really are that good. The major news media run with the story without investigation or fact checking. Nobody bothers to interview anyone except Tucker Carlson at Fox News (remember him?). The story has legs and Hunter’s business partner spills the beans, but none of the other media lift a finger.
Now it is election day and Trump seems to win the vote, but there remains literally truck loads of mail-in ballots left to be counted over the next days and weeks. It does not take paranoid or deranged person after all of that to think maybe he has been cheated. Trump went too far, but so did so many people who treated him unfairly. It is not an excuse, but it does add perspective.
Barry likes propagandizing for the Party of the Trail of Tears, Party of Slavery, Party of the Ku Klux Klan, Party of Jim Crow, Party of Japanese American Internment, Party of Dixiecrats.
Trump is an idiot. Plain and simple.
rlh…he may be an ijit, but not nearly as much an ijit as the load of politically-correct running the US right now.
We are all ijits in one way or another, or are you in denial that you are one too? I have no problem admitting I am an ijit.
Tim,
“there remains literally truck loads of mail-in ballots left to be counted over the next days and weeks”
Because there were many times more mail in ballots requested and cast because of the pandemic. The primaries also had more mail in ballots for the same reason.
Why have you forgotten about the “red mirage” that was all over the news prior to the election. Did you not hear of it? Fox News explained that there would be a swing towards Dems after election day because Dems traditionally do more mail-in ballots, and during COVID this trend was even stronger, as Dems generally took the pandemic more seriously than Repubs.
Has all this escaped your memory, or have you driven it out? Or were you in some echo-chamber in 2020 where these well-known things did not filter in?
“It does not take paranoid or deranged person after all of that to think maybe he has been cheated”
It takes an unskeptical person to claim there was fraud with no concrete evidence, just a lot of assumption and ignorance about who tends to vote more in mail-in ballots.
Now,
Your argument seems to be that Trump did something indefensible because he was driven to it by a witch hunt.
What is your point?
Tim,
“Mail-in voting often called absentee voting or vote-by-mail has slowly but steadily gained in popularity in the United States. And it received a big boost this year [2020] as primary season ran head-on into the novel coronavirus pandemic. Mail-in ballots accounted for just over half of this years primary votes cast in the 37 states (plus the District of Columbia) for which data is available. That was roughly double the mail-in share of the vote in those same jurisdictions in the 2018 and 2016 general elections.”
https://www.pewresearch.org/short-reads/2020/10/13/mail-in-voting-became-much-more-common-in-2020-primaries-as-covid-19-spread/
Any guesses as to which political party got more mail-in ballots for the primaries?
“In 19 of the 24 primaries (in 18 states and D.C.) where Pew Research Center found partisan breakdowns, the mail-in share of the vote was higher on the Democratic side than on the Republican often substantially so.
In New Hampshires state primary last month, for example, 42.4% of Democrats cast their votes by mail, versus 16% of Republicans. In Rhode Islands primaries for U.S. House seats, also last month, 47.4% of Democratic ballots but only 13.2% of Republican votes were cast by mail, a difference of 34.2 percentage points.”
Why is it a mystery to you that there was a significant blue shift when mail ballots were counted in the 2020 federal election?
I am disappointed in you barry. You went straight to the ballot thing without any comment on the events leading up to the election. Then you misstated the ballot issue. This was the COVID election. People did not request ballots. In most states they were mailed out to everyone whether they were requested or not, and without any verification on the way back in to be counted. Absence of proof that there was no fraud does not prove it did not happen. As I have stated previously, once the ballots are mailed out, they have to be counted when they come back. The only control is when they are mailed out.
You allowed yourself to look like you were doing propaganda.
GR: So do you think Trump will lose in court?
https://www.youtube.com/watch?v=dvbHgUubycc
“Trump EXTENSION REQUEST Swiftly BACKFIRES in Case”
rlh…I don’t think you quite grasp what it will mean over here if Trump is stopped from running. That’s all these court cases are about, a load of sniveling cowards trying to usurp democracy by trying to prevent Trump from running for office.
I am sure he has been involved in shady deals but if that is the criterion, both the Democrats and Republicans are guilt, not only at the federal level but at the state level too. And it won’t be the first time on either side that politicians have been involved in graft and corruptions and gotten away with it.
Where is the trial for Hunter Biden? And when Biden comes under suspicion he is excused based on his age. Hillary Clinton got off scot-free as well.
I don’t agree with graft and corruption but they are going after only Trump to prevent him running for office and I think that is wrong.
Barry again is spreading his leftist propaganda and he knows all too well there is a difference in absentee ballots and what was done during the last election. In the last election you didn’t even have to request a mail-in ballot, they were mass mailed in several states. Democrats fought purging and verifying the voter rolls for years because this has always been their plan. If you can control the election process then you can control the election, especially when you have no integrity.
” without any verification on the way back in to be counted.”
No verification? Really, Tim?
This is BS. You are regurgitating right-wing misinformation.
https://ballotpedia.org/How_do_states_protect_and_verify_absentee/mail-in_ballots%3F_(2020)
Tim,
“I am disappointed in you barry. You went straight to the ballot thing without any comment on the events leading up to the election.”
Ahem:
“Your argument seems to be that Trump did something indefensible because he was driven to it by a witch hunt.
What is your point?”
I’ll repeat the question. What is your point?
“People did not request ballots. In most states they were mailed out to everyone whether they were requested or not”
Rubbish. It was 17 states. In my world most means more than half at least. There are 50 states of the union. You just pulled ‘most’ out of thin air.
Furthermore, 5 states had a pre-COVID policy of mailing out ballots unrequested. You may be surprised to learn that deep red Utah was one of those.
Accuracy doesn’t seem to be important to you, but just in case, here are two good websites that will tell you what changes were made in which states.
https://ballotpedia.org/Changes_to_election_dates,_procedures,_and_administration_in_response_to_the_coronavirus_(COVID-19)_pandemic,_2020
https://www.ncsl.org/elections-and-campaigns/the-evolution-of-absentee-mail-voting-laws-2020-through-2022
Read Table 4 in the second link for the list of states that mailed out ballots.
And stop exaggerating.
“Absence of proof that there was no fraud does not prove it did not happen.”
I can’t believe you just uttered this age old fallacy. You have the onus exactly backwards.
Or how are you going to prove to me that unicorns are not living in the centre of the moon?
I have not said there was no fraud. I have said what Republicans have told Trump – that there is no substantial evidence of wide scale fraud.
There was indeed small scale fraud, and mostly committed by Republican voters.
The story is very simple and straightforward for a mind that is not fuzzy.
1. Trump claimed for months BEFORE the election that if he lost it would be because it was rigged.
2. He amped up this rhetoric as election approached.
3. He only listened to people who told him what he wanted to hear, which is why a lot of the claims came from social media.
4. He claimed victory on election night despite the result not being clear.
5. He attacked every result in every battleground state that went against him.
6. He hired a clown show of lawyers who brought mostly rubbish cases based on hearsay and ignorance of how election are run.
7. His followers were energised by his claims and set to find the fraud no matter what, hence there were myriad claims, including many that were just bonkers. Trump still parroted them
8. He sicced a mob on the Capitol to “Stop the Steal,” and let them run riot for a few hours.
Trump is an inveterate liar. His followers swallowed his lies about the election being stolen – lies he had been pushing for months before the election happened.
His followers now call all the Republicans who told him he was wrong traitors.
Trump energised this creed about stolen elections. You’ve fallen for it. You get things wrong because you’re not being diligent, you’re parroting the talking points. “Most” states, huh?
The swing to blue in the days after the election was not suspicious, it was in fact anticipated. I quoted Fox News warning of the phenomenon upthread. And the pandemic caused many more mail in votes than usual, and most of those came from urban areas. Where the vote typically swings Democrat.
Trump’s incredulity at a highly anticipated turn of events seems to have infected you.
I ask again, were you ignorant of this? Were you stuck in some echo chamber that inhibited this well-known “red mirage” phenomenon getting to you?
Or did you watch the MSM back then and simply forget? Because you don’t seem unintelligent.
I really want to know. Are you really ignorant of the blue shift when mail votes are counted in the US? Did you really not get the memo in the lead-up to the election, such that it doesn’t feature in your understanding of what happened at the time?”
barry pretends that he doesn’t get it when I have been very explicit. I think he is very smart, but not nearly as clever as he thinks he is. And some of us are not as gullible as he hopes. Here is what I stated:
[I cannot defend Trump because he clearly went off the rails. Lets see how he got there.]
[Trump went too far, but so did so many people who treated him unfairly. It is not an excuse, but it does add perspective.]
I know a lot of school children who can understand those two sentences without any need for context or further explanation. But that is not good enough for some people who will make endless arguments spinning in circles with detailed post about things that have nothing to do with my main point that came from my first paragraph, sometimes referred to an introduction, and my very last sentence, sometimes referred to as a summation.
I am done.
Carry on!
Thanks, Tim. Your point was “perspective.” Much appreciated.
I’m pretty sure you weren’t trying to argue that Trump’s behaviour was understandable. I see no connection between his being investigated and his election denial, unless you’re putting together a psychological profile.
I realize that it was not you who misunderstood the ballot blue shift. Apologies.
“the Trail of Tears”
Thanks to Andrew Jackson, Trump’s favorite President
“Trump went too far, but so did so many people who treated him unfairly”
Tim you are again promoting the false equivalence excuse just as Fox News talking heads do.
There is simply no equivalent to what Trump has done.
Nate, you continue to reveal yourself. What most of us would call taking a balanced perspective on reality, or maybe just a clear view of the available information, you call a false equivalent.
I get it. From your perspective, the only real news in this world is the spin that comes from your daily talking points provided by your central committee. Everything else is just brushed aside by the liberal news media. They get a copy of the same talking points.
If Fox News happens to cover a true and honest news story that is not included in the daily talking points, then it is easily put down as a false equivalent or just more lies from Fox.
I watch a lot of news on CNN, but almost never live. I have cloud storage in my cable subscription. They are the ones with the lies and propaganda. Jake Tapper is the chief propaganda anchor, and I have to admit he is really good. Some of the rest are almost comical. Wolf is the old guy they keep around in case some genuine news needs to be reported. Sad, but true.
“I get it. From your perspective, the only real news in this world is the spin that comes from your daily talking points provided by your central committee. ”
Ridiculous, Tim.
I am saying what most of the Republicans and former members of his administration who are not voting for Trump and are endorsing Harris, are saying.
Your mistake and the mistake of some media is to say: to be fair and balanced we have to present a bad thing done by a Dem for every bad thing done by Trump and his team.
But there is difference here in the order of magnitude of lying from Trump, in the order of magnitude of his crimes, and the order of magnitude of his moral failures, compared to his opponents.
I’ll highlight one thing, out of many. He created slates of FAKE electors, who tried to send fake electoral votes to Congress.
Again, luckily, these were not accepted by Pence or Congress.
Among other things he worked to
https://en.wikipedia.org/wiki/False_equivalence
“False equivalence arguments are often used in journalism[9][10] and in politics, where flaws of one politician may be compared to flaws of a wholly different nature of another.”
Like barry, I think Nate is a lot smarter than he seems, but like a pit bull he just needs to hang on and keep his argument going. This one is easy. There is no false equivalence because there never was a comparison.
The point I made, that most people should be able to understand is that Trump was abused. He has been falsely accused and investigated by the FBI, falsely impeached for seeking the evidence that was revealed in Hunter’s lap top, and falsely maligned by the media. Once again, my main point that came from my first paragraph, sometimes referred to an introduction:
“I cannot defend Trump because he clearly went off the rails. Lets see how he got there.”
Insert here all of the stuff that Nate is stumbling over.
My very last sentence, sometimes referred to as a summation.
“Trump went too far, but so did so many people who treated him unfairly. It is not an excuse, but it does add perspective.”
Tim, this statement
“Trump went too far, but so did so many people who treated him unfairly”
did sound to me like you were making an equivalence..
Maybe I’m wrong.
Then you agree with what I said?
“There is simply no equivalent to what Trump has done.”
I don’t agree at all that his first impeachment was invalid.
He clearly tried to withhold weapons from Ukraine, and then trade them for manufactured dirt on his political opponent.
Nate the President of Ukraine said that was rubbish. He is the guy who allegedly was harmed. There was no case except for a politically biased one. Only the folks suffering from Trump Derangement Syndrome voted for the impeachment, thus that indictment failed miserably when tried.
Suddenly I realize there is false equivalence, but it is on Nate. He thinks it is okay for the FBI to violate not just the law, but the Constitution itself, because he thinks Trump deserves it. That clearly is his position on this. Nate, say it ain’t so!
Tim, it seems to me your goal is to get people to understand that Trump was unfairly targeted by the FBI.
Trouble is, that is irrelevant to what other people are saying in this thread. You replied to the OP, for example, which was all about Trump’s phone call to the Republican Georgia Sec of State to pressure him come up with more votes for Trump.
You offer the sideline on the FBI’s investigation of Trump as ‘perspective’. What a limp motive. I don’t believe that is your actual goal, or you wouldn’t be hard-pressing this continued digression.
So I’ll press on with what I originally posted.
Trump’s extraordinary disregard for the democratic process in favour of his own interests renders him unfit to be the US president.
I mentioned this in light of all the speculation dressed as revealed truth about Democrat efforts to steal the 2020 election. Here we have a real example from Trump’s own mouth, a reminder with the US election one month away.
I don’t see the point in trying to resurrect Trump’s character, as you seem to be trying to do.
barry, for a smart guy, you really are missing the point. The information is available to Trump and his supporters. People who can ignore vaccine science and claim viruses do not exist, or argue ad nauseam that radiant heat transfer in the gas phase is not possible, will easily accept that Trump is a hero who deserves another Presidency. Look at the polling numbers. Trump has huge support.
More to the point is the fact that Trump is of average intelligence at best. He could easily believe the system is rigged without being the slightest bit paranoid.
The FBI under James Comey made a huge mistake to make Trump a victim and a hero. The Democrats did the same thing by impeaching the guy who gave tank killer missiles to Ukraine. It changed the face of the battlefield with the separatists at that time.
What does not kill me, make me stronger. All of these fools who took cheap shots at Trump have literally turned him into a monster. There is a larger than zero chance that he is President again.
Meanwhile, the Democrats (Nancy and Chuck) could have come up with a process where a competent Governor was on the ticket. Instead, they push Kamala and we are headed for certain disaster. You heard it here first.
But there is more. Your namesake, Barry Obama refused to give the tank killers to Ukraine. They literally begged for them. Trump made it happen. This is Putin’s friend. Oh wait, what about the attack on the airbase in Syria where Trump gave the Russians 1 hour to evacuate themselves and their fighter jets. He then simultaneously announce the attack to President Xi of China over desert at Mar a Lago. This guy has balls.
“barry, for a smart guy, you really are missing the point.”
If it isn’t “perspective” then what is it? Your comments are all over the place. Now you are blaming Trump haters for Trump. Is THAT your point?
I’m reasonably intelligent but no genius, so can you help me out with a single sentence wrapping up what it is you think you are trying to achieve here? You’re all over the shop.
“All of these fools who took cheap shots at Trump have literally turned him into a monster.”
“This guy has balls.”
Yeah, I’m totally at sea with what you are trying to say.
“Your namesake Barry Obama..”
Really? Are you trying to come off a like a Republican douchebag?
“People who can ignore vaccine science and claim viruses do not exist, or argue ad nauseam that radiant heat transfer in the gas phase is not possible, will easily accept that Trump is a hero who deserves another Presidency. Look at the polling numbers. Trump has huge support.”
Tell me something I don’t know.
“More to the point is the fact that Trump is of average intelligence at best. He could easily believe the system is rigged without being the slightest bit paranoid.”
Paranoia never occurred to me. I can easily imagine he believes his own guff. More likely he never questions stuff and automatically strategizes with no regard at all for facts. I can certainly believe he is stupid/amoral enough to think it’s fine to pervert the democratic process while president, based on a genuine belief the election was stolen. But none of this in any way mitigates what he did. Not by a fraction of a percent. All this Monday night psychopolitical profiling is irrelevant. Whether he lied or he was grossly incompetent or negligent, the action he then took is inexcusable, as you have said.
I’m not sure even YOU know what point you are trying to make.
“because he thinks Trump deserves it. That clearly is his position on this. ”
Love it when people tell me what my opinions are..
“Trouble is, that is irrelevant to what other people are saying in this thread. ”
Yep.
Tim is trying his hardest to distract us from the key facts.
That things done by Trump, and his fundamentally flawed character disqualify him from the Presidency.
For rational people, everything else ought to be background noise.
Nate and barry, you guys are beautiful. One of my skills in life is effective writing. I do even better when I proof read and remove the the typos and missing words. I think it is clear that Trump is a very complex issue, and I have attempted to describe some of that complexity.
If the criticism is that my comments are complex, or that my own thought process shows diversity (liberals love that word), then I plead guilty. I am not as serious about any of this as some of you. I attempt to express humor, irony, sarcasm, and hopefully some amount of intelligent analysis.
For the record, I have not voted yet, even though early voting is now available by mail-in ballot. Trump’s main problem is that he doesn’t listen to people who are smarter than him. He is also impulsive. Former AG Bill Barr says he lacks self control. Otherwise, he has some good qualities which include an understanding of Capitalism and the business world. His policies will help the economy.
It concerns me that Nancy and Chuck took it upon themselves to oust Joe and choose Kamala to run. This is how they want to “save democracy”. She is emotionally unstable and has only a very thin resume of executive management. All of that concerns me, but my biggest concern is that she is running away from her clear record of favoring big-government socialist policies. What are her core values?
How shallow Kamala is came out in that CNN interview in the last few days. She got the perfect softball question of what she would have done different than what Biden did. She said she couldn’t think of a single thing. It was the perfect softball question to hit out of the park because her whole campaign is about a new beginning trying to separate herself from Biden’s baggage.
But she completely whiffed. Astonishing! The prime opportunity to have shown a bit of backbone and separate herself from the disaster this administration has been.
Yet all we hear from the left is how dangerous Trump is. I would say he got an A++ on foreign policy and military leadership. He fully understands what the founders were thinking when they made the President commander in chief. His job is the world politics regime and the generals are who you rely on to win the battles and keep military units perhaps from many nations all in sync.
Sure he has been criticized by a general who fancies himself as an expert in world politics but nobody elected him to do that.
This administration couldn’t get that done even in the tiny secret service.
The secret service is about the size of a brigade, typically commanded by a Colonel. And we get a DEI hire recommended by the President’s wife. No doubt because she is a wonderful, personable, and friendly lady.
Sorry folks but we can’t just be who we want to be because we want to be and expect to achieve it because we are nice, dutiful, respectful, and show up on time. Ask any professional football player what it took to rise to a career in the NFL. Natural born talent can give you a big assist but its no completely necessary. But if you don’t have it naturally you will have to work that much harder.
> I think it is clear that [Donald] is a very complex issue
Donald isn’t exactly an issue.
So effective. Much writing. Very perceptive:
https://www.reuters.com/world/us/binder-with-top-secret-russia-intelligence-missing-since-end-trump-term-source-2023-12-15/
Wow.
Tim, despite your amazing writing skills, you still are unable to state what you are trying to achieve here in a single sentence. I seem to remember you being concerned with me getting the point.
If you don’t see that Trump is an ignorant narcissist who will almost certainly use his power to wage political vendettas, and whose worst impulses will no longer be constrained by the administration that will accumulate around him, I don’t know what else to say.
I could point to the economic modeling of his policies that come out much worse than Harris’.
I could return to the topic of this thread to indicate that Trump poses a non-negligible threat to the security of US democracy.
I could mention his habit of endlessly uttering lies, including some that endanger people, and his general odious character, which does matter for a national leader.
I could remind you of the abject spinelessness of the Republican congresspeople in capitulation to Trump, and how his extremism has brought in reps with radical agendas while traditional Republican values have fallen away.
But I’m sure you’re smart enough to know about all this. And probably intellectually clever enough to fool yourself into thinking Trump is the lesser of two evils, rather than someone who should never be let near the Whitehouse again.
I’m also not blind to some of the good things that happened under the Trump administration, but these occurred with mostly sane people around him, guiding him through the presidency – and who are on the record describing that. Trump 0.2 won’t be so shepherded. He’ll be surrounded by yes people.
I’m no particular fan of Harris or the Democratic party. But even from the other side of the planet I can easily see that any disaster you are concerned about is far more likely to arise in a second Trump term.
Well barry I am glad you are concerned about democracy. So am I. As previously stated, the process they used to replace Joe is not democratic. Josh Shapiro was pushed aside to satisfy the Hamas supporters, and Gavin Newsom was not allowed to speak at the convention. When asked about that, Newsom said “I did everything they asked me to do”.
As for Trump, there is a guy named John Bolton who represents the far right opposition to Trump. He is popular on CNN as a Trump critic. He does not support Kamala. He claims he will write-in someone. He and others such as Bill Barr, who does support Trump as the least bad choice, claim that Trump’s bad behavior has its limits due to the many checks and balances in the system.
I will state it again. Either choice is bad. The question is who will do the least damage.
“His policies will help the economy.”
Wishful thinking. He has shown repeatedly that he erroneously thinks that a tariff is a tax on other countries, while in reality it is a tax on consumers.
He has proposed increasing them substantially. Most economists point out that this will raise prices for consumers, cause a global trade war, lead to a global depression, and help no one.
He blew up the debt last time, and has plans to do more of that.
“Trumps main problem is that he doesnt listen to people who are smarter than him. He is also impulsive.”
Yeah. But then kindof ignoring all the crimes, the not upholding the Constitution, etc.
Why do people choose to forget all of that?
“the process they used to replace Joe is not democratic.”
Ignoring the election which will involve everyone voting!
I don’t why people think how the parties nominate their candidate is required to be just like an election.
It is not, and never has been.
More background noise.
“I will state it again. Either choice is bad. The question is who will do the least damage.”
Then in that way of thinking, many former Repubs. in government have stated that Trump’s damage to institutions, democracy and foreign policy could have more lasting damaging effects, than the policy choices of a Dem, that can be mitigated and undone by a future, normal Republican.
” She is emotionally unstable”
Still making an assertion without evidence.
Nate says:
”Wishful thinking. He has shown repeatedly that he erroneously thinks that a tariff is a tax on other countries, while in reality it is a tax on consumers.”
To some extent it is. But its also a tax on slave labor and environmental pollution but those abusing workers and the world.
Thats why the tariffs aren’t applied broadly but in a targeted manner. they slow the import of goods made in foreign nations that don’t recognize worker’s rights and/or harming the world in unsustainable ways.
Putting teeth into protections of the environment is something environmentalists have yearned for decades, was the center of attention in the Battle of Seattle in December 1999, and finally they have an environmentally-minded progressive President which we have lacked since Teddy Roosevelt.
The other participants in the Battle of Seattle were the labor unions that were protesting wide open free trade policies of the WTO because of slaves and child labor being used to undermine US industry who are subject to strong labor protections in the US.
Trump has run into direct conflict with huge international corporations on this. These corporations have been using this loophole for decades to produce cheaper goods that US industry can’t compete with undermining both the middle class and the environment.
They have just gone out and cut sweet deals with despots around the world and then lobby for kickbacks to be paid by American taxpayers.
Domestic corporations have seen their marketshare destroyed by this. And at a huge cost of US jobs. Trump is the first President to stand up against this which has been a huge source of dark campaign money for decades.
Tim,
Replacing Biden with Harris as a candidate is not a threat to Democracy. It is most certainly not the threat to the levers of the Democracy that Trump poses.
But perhaps you could make yourself clear on this matter.
If elected, which candidate do you think poses a greater threat to US democracy? I’m curious what you think about Trump on this. And to see if democracy matters as much to you?
Trump’s and Harris’ economic policies have been assessed by various non-partisan groups and Trump’s score worse. If economy matters to you, this should not be difficult. Nate has already laid out the worst of Trump’s policies – massive tariffs on most if not all imports.
It seems to me you are focussed on the problems with Blue, and not much on the problems with Red. But perhaps because you feel you need to address an imbalance.
Tell me honestly, are you really weighing things, or is there any chance, if nothing changes much between now and November, that you won’t vote for Trump?
I get the impression you’re advocating behind these notions of even-handedness.
I’m definitely advocating that no one in their right mind should vote for Trump.
barry says:
”Replacing Biden with Harris as a candidate is not a threat to Democracy. It is most certainly not the threat to the levers of the Democracy that Trump poses.
But perhaps you could make yourself clear on this matter.
If elected, which candidate do you think poses a greater threat to US democracy? Im curious what you think about Trump on this. And to see if democracy matters as much to you?”
No question about that. there are many nations in the world listed as having a democracy that don’t have a democracy.
They restrict free speech
They disarm their citizens
they stuff ballot boxes
And they resist controls to ensure one citizen equals one vote
And they resist the auditing of the results of elections.
In the last election their was only one candidate wishing to audit the election before certifying results, only one who during the entire election process was worried about the stripping of controls to ensure one citizen one vote. And of course there has been only one party standing against free speech and the right to bear arms.
To me its not even close.
Tim,
“As previously stated, the process they used to replace Joe is not democratic.”
I agree, but redoing the primaries was not possible in the time left.
“Josh Shapiro was pushed aside to satisfy the Hamas supporters, and Gavin Newsom was not allowed to speak at the convention. When asked about that, Newsom said ‘I did everything they asked me to do’.”
None of this has anything to do with democracy when the voters dont choose.
But more importantly, while the constitution does not provide answers, it does point in the direction of a vice-president stepping up when a president steps down.
Furthermore, Democratic party rules are that delegates vote on their conscience. The Biden/Harris ticket was going to be contesting for the executive. Voters did not choose Shapiro or Newsome.
Harris was the obvious choice in a messy situation. There may be a better candidate. But there always is.
Same goes for Trump. In spades.
Bill,
“In the last election their was only one candidate wishing to audit the election before certifying results, only one who during the entire election process was worried about the stripping of controls to ensure one citizen one vote.”
There was only one candidate who said it was impossible he would lose unless the election was rigged.
There was only one candidate who said there would be widespread fraud before any ballots were cast.
There was only one candidate who would not commit to leaving the White House if he lost the election.
There was only one candidate who would not accept he had lost even when his advisors told him he had lost.
There was only one candidate who failed to prove fraud in court despite initiating more than 5 dozen suits.
There was only one candidate who green-lighted a scheme to replace legitimate electoral college delegates with fake electors and pressed the vice-president to implement it on January 6.
There was only one candidate who invited a mob to Washington and sent them to the Capitol in the middle of the delegate vote-counting to “stop the steal.”
There was only one candidate who stood by for hours while that mob broke into the Capitol building, smashing windows and doors and injuring police, threatening to murder politicians, and who successfully stopped the democratic proceeding for a few hours, under the candidate’s direction (as they later vouched under oath).
Trump did not pursue voter fraud cases except in battleground states. He was not “concerned” about election fraud in general, he only cared about what could help him win the election.
And he built his ‘concern’ on a web of lies, that were refuted by his own advisors, his DoJ, Republican governors and Secretaries of State, and a range of judges, half of which were Republicans, 12 of which had been appointed by Trump, that dismissed or found against fraud in the 60+ fraud cases the Trump campaign brought. Fox news settled a suit against the promotion of some of these lies for almost a billion dollars, where we discovered that even the hosts of that propaganda wing of the Republican party didn’t believe the lies.
The man is a liar, his followers bought the election lies, and most of them continue to believe these lies.
And apparently so do you.
barry says:
”There was only one candidate who said it was impossible he would lose unless the election was rigged.”
So what? He lost!
”There was only one candidate who said there would be widespread fraud before any ballots were cast.”
that tends to happen when you loosen accountability over ballots. The area of internal controls is huge concern to auditors.
”There was only one candidate who would not commit to leaving the White House if he lost the election.”
big deal he left on time!
”There was only one candidate who would not accept he had lost even when his advisors told him he had lost.”
thats untrue. Hillary still claimed that Trump was an illegitimate President still refusing to admit he beat her fair and square.
”There was only one candidate who failed to prove fraud in court despite initiating more than 5 dozen suits.”
Nearly all thrown out without even hearing the complaint. Filing suit is the LEGAL and LEGITIMATE way to right a wrong.
”There was only one candidate who green-lighted a scheme to replace legitimate electoral college delegates with fake electors and pressed the vice-president to implement it on January 6.”
Big deal! We know he was trying to delay certification until his concerns were addressed in a court of law. In the end it did no harm nor was there any evidence he wasn’t going to vacate the Whitehouse. All you snowflakes did was make a mountain out of a molehill. But what else is new?
”There was only one candidate who invited a mob to Washington and sent them to the Capitol in the middle of the delegate vote-counting to stop the steal.”
Protesting is an American right. When did you start believing that it was illegal to protest? When they started prosecuting protestors?
”There was only one candidate who stood by for hours while that mob broke into the Capitol building, smashing windows and doors and injuring police, threatening to murder politicians, and who successfully stopped the democratic proceeding for a few hours, under the candidates direction (as they later vouched under oath).”
He didn’t stand by for hours. Even before they started Marching Trump called for “peacefully and patriotically make your voices heard”.
All you are doing is listening to your lying daddies.
”Trump did not pursue voter fraud cases except in battleground states. He was not concerned about election fraud in general, he only cared about what could help him win the election.”
LMAO. Boy that is pretzel logic if I ever heard it. LOL
”The man is a liar, his followers bought the election lies, and most of them continue to believe these lies.”
Which lie did you think was the most egregious?
Nate and barry, the fact checker on CNN says the polling data and historical trends indicate that Trump will win, the Republicans will retain the house and flip the Senate for full control of the government. Stay tuned.
Bill,
There was only one candidate who would not accept he had lost even when his advisors told him he had lost.
“thats untrue. Hillary still claimed that Trump was an illegitimate President still refusing to admit he beat her fair and square.”
As far as I am aware, Hilary Clinton did not contest the 2020 election.
I guess your partisanship caught you out there. Context doesn’t matter if you can shiv the Dems, eh?
I’m assuming, of course, that senility didn’t cause you to forget what we were talking about.
Tim,
“Nate and barry, the fact checker on CNN says the polling data and historical trends indicate that Trump will win, the Republicans will retain the house and flip the Senate for full control of the government. Stay tuned.”
It makes me smile to see you show your hand so obviously after posing as the neutral political commentator.
And not just because I picked you correctly. It’s mainly because you couldn’t keep you sh!t together for long to maintain the ruse.
Biden was sipping from the well of onset dementia.
Harris is a mostly unknown quantity who is still trying to figure out what she stands for, and is spending her time now bouncing off the polls and trying to get ahead.
Trump is a guy who is in his skin, is totally himself and suffers no self-doubt. What you see is what you get. A fighter who will never back down, no matter what.
Of these three choices, and taking everything else into account over the last 8 years, there is not a snowball’s chance in hell I would vote for Trump.
I don’t love the Dems, Tim, you deluded twit. I just see Trump for what he actually is. The presidency is simply not conscionable for a guy like him. Even if his policies were any good, a guy like that should not have access to the levers of power.
Barry why?
He scares you? Kind of strict father figure? Not sure how he will respond when you are being irresponsible? Besides the fact he heaps praise on those who are being responsible. What else do you want in a leader?
I’ve already said why, Bill, in various places in this comment section.
No need to project your daddy issues.
Congratulations barry! You must be proud. It seems that you have “picked” me because you look at the world through partisan eyes. I am not digital. There is very often an answer in between yes and no. I blame my intellect. The world is much more complex and yes, complicated sometimes for intelligent people.
I misspoke about the “fact checker” at CNN. Harry Enten is a data analyst or some title like that. He now says the polling odds give Kamala a 53% chance of winning and the betting odds give Trump a 53% percent chance of winning. The polling numbers in the undecided (battleground???) states are a dead heat with only a 1% advantage either way in about 8 different States.
Are you a polling wonk, or a betting man? I have been known to play the tables at the casinos on occasion. I only play with throw away money and I never play any type of machine or computer.
barry says:
”Ive already said why, Bill, in various places in this comment section.”
I asked what you found the most egregious. I didn’t ask why you already said that.
Wow Barry can’t defend his accusations in any way shape or form.
Barry…the fact that you are a climate alarmist who has no scientific proof to back him is all the evidence I need to realize that your assessment of Trump is based on a conspiracy theory by the fake news media. The fake news boys, who are onside with the Democrats, have gone hysterical over their need to get rid of Trump. They have even tried to assassinate him twice, before he is even in office.
I do not support the politics of Trump but I do support his right to run unfettered for office. Tim S has provided a list that proves the plight of Democrats who have tried everything to remove him from the ballot by trying to throw him in jail. Several Democrat states have tried to remove him from the ballot. They have accused him of leading an insurrection even though he has never been charged with such an offense, tried for it, or convicted.
Even though I don’t support the politics of Trump I prefer him to the politically-correct Democrats who are intent on overriding democracy to implement some kind of histrionic, Machiavellian, Utopia.
I would prefer to live in a world with Trump as president rather than succumb to the limp-wristed, non-democratic world of the Democrats.
Gordon, you are responding to my post which links to an audio of the phone call Donald Trump actually made to the Georgia Secretary of State. You can listen to it. You can read the transcript. I quoted it.
It’s not a conspiracy theory or fake news, it’s the Republican Secretary of State telling Trump that his information on election fraud in Georgia is wrong. Multiple times. And Trump pressuring the Republican Sec of State to find more votes.
barry…that does not prove Trump is wrong, maybe the election official is misinformed or just plain ignorant.
First of all it proves that YOU are wrong criticising my post for being a conspiracy theory and fake news.
“maybe the election official is misinformed or just plain ignorant”
The Georgia Republican Secretary of State that Trump was speaking to on the call had teams on the ground in Georgia investigating the claims the Trump people were putting out.
Trump did not have people on the ground in Georgia. he and his lawyers were relying on hearsay, often on social media.
The point is that the top Republican tasked with overseeing the elections in the state Trump claimed fraud told Trump he was wrong.
This happened in many states, and people in Trump’s own administration told him that there was no wide-scale fraud. His own DoJ told him. The Cybersecurity department told. People he had appointed told him.
He just didn’t want to give up. That’s why crazy cases were mounted in 2020, many dismissed, and all of those heard rejected for fraud claims, by Republican and Democrat judges alike, including by 12 judges that had been appointed by Trump. Republican-dominated SCOTUS also rejected the election fraud suits.
It’s a not a Democrat conspiracy. It’s a MAGA covenant of faith.
Gordon, read the transcript of the call.
For your information, the Secretary of State is, in most cases in the US, the CHIEF election official of the state.
Secretary of State Republican Brad Raffensperger is Georgia’s highest election official. His office ran the Georgia federal election in 2020. Prior to the phone call he had teams of investigators look into the Trump campaign’s claims.
So why don’t you click on the link above and read what he had to say?
Barry…Is Raffensperger a Democrat or a Republican?We seem to be having similar issues here in the province of BC, as we near a provincial election a few weeks off. Some of us have yet to receive our election ballots, which come by mail.
The right-wing faction has taken to calling the present government communists. They have been in power for 7 years and have done nothing to deserve such a slur. Dating back decades, the right-wingers have been using insulting terminology to describe this party as Commies, Pinkos, and Reds even though they are as democratic as any other party, probably more democratic.
A few elections ago, a local fake news columnist called a member of the current governing party a ‘Dour Stalinist’. The media are out of control and laws are needed to bring them in line. It’s one thing to have freedom of the press, and expression, and quite another to allow out and out character assassination.
Calling someone a dour Stalinist is equivalent to equating him to Hitler and the murder of 12 millions people. I would call it a hate crime.
This is coming from the Georgia Secretary of State who allowed mass mailing of ballots, ballot drop boxes, ballots harvesting, all without the Georgia Legislature. Trump was asking a traitor for help and he didn’t know it.
Barry,
Show us your evidence that the Georgia Secretary of State had teams of investigators on the ground trying to uncover fraud. Why did he alter Georgia election law contrary to the Constitution?
Gordon, I’ve said multiple times just above, in reply to you, that Raffensperger is a Republican. That is much of the POINT!
Is there something wrong with you? Are you so mind-locked that you can’t read me saying he is Republican on 5 occasions in this subthread and in reply to you. I even bolded it.
It’s like talking to a prete4nd-deaf grandfather who somehow manages not to hear the thing you’re saying the strongest.
The POINT is, Republicans who know more about the process and run of the 2020 election than Trump told him there was no evidence of wide scale fraud.
I’ve made this point over and over. Above, I started this thread by citing one of them. At the link I gave there is audio of the phone call.
It’s not a commie plot. It’s Republicans telling Trump he’s wrong.
This is what actually happened in Georgia:
Trump last Georgia by 11,779 votes. Texas did not allow the Democrats to alter election law, Georgia did. Trump won Texas and Georgia by the same margins in 2016.
Fulton Co. is Georgia’s most populous state. Ninety percent of the approximately 148,000 mail in ballots cast in Fulton Co. could not be authenticated. Ballots images for 132,284 mail in ballots had no .SHA file which is created automatically when a ballot is scanned and used to create a digital image of the vote lacking evidence they were cast by a real voter. 104,994 ballots’ image files contained identical modified time stamps.376,863 ballot images are missing from the first machine count, which includes all in-person walk-in votes. Phillip Stark of UC Berkley who invented risk-limiting audits said the electronic records of the election are not in tact. I can go on and on if you want me to Barry.
There wasn’t widespread fraud. It almost all occurred in Fulton Co. That is all they needed.
The same illegal activity occurred in Atlanta, Detroit, Philadelphia, Milwaukee and Phoenix. That’s all it took. Just a few precincts. The Democrats know this. They have perfected their cheating craft.
“Show us your evidence that the Georgia Secretary of State had teams of investigators on the ground trying to uncover fraud”
It’s in the transcript of the phone call between Trump and Raffensperger and his legal aide that I linked at the top of this thread. Go read it. You’ll find things like:
Raffensperger: Well Mr. President, the challenge that you have is, the data you have is wrong. We talked to the congressmen and they were surprised.
Raffensperger: You’re talking about the State Farm video. And I think it’s extremely unfortunate that Rudy Giuliani or his people, they sliced and diced that video and took it out of context. The next day we brought in WSB-TV and we let them show, see the full run of tape and what youll see, the events that transpired are nowhere near what was projected
Raffensperger: Mr. President, they did not put that. We did an audit of that and we proved conclusively that they were not scanned three times.
And more on their investigations from Raffensperger’s legal aide on the call.
Germany: We’ve been going through each of those as well and those numbers that we got that Ms. Mitchell was just saying, theyre not accurate. Every one we’ve been through, are people that lived in Georgia, moved to a different state, but then moved back to Georgia legitimately.
Germany: The only investigation that we have into that they have not been shredding any ballots. There was an issue in Cobb County where they were doing normal office shredding, getting rid of old stuff, and we investigated that. But this is stuff from, you know, from you know past elections.
Stephen, you don’t know a thing about all this, do you? This is the infamous phone call where Trump asked Raffensperger to help him find 12,000 votes to flip the state.
This isn’t leftist propaganda – this is Republicans talking to each other.
“Trump was asking a traitor for help”
Well of course any Republican who contradicts Trump is a traitor.
How about YOU prove Raffensperger failed to comply with the legislation? I’m tired of having to show how you’re wrong about this stuff all the time. Show me for once that you’re right about something.
This vote was certified by the wonderful Secretary of State Raffensperger. I think he has prosecuted about two or three people for fraud. The guy is incompetent.
Barry,
Trump knew there was massive fraud in Georgia. Asking Raffensperger to find all the ballots like the over 300,000 missing ballots in Fulton Co. Nothing wrong with that.
Fulton Co. ordered over 1 million absentee ballots. There were a little over 800,000 active voters in Fulton Co. They had more blank mail in ballots than registered voters. They ordered them after the mail in voter requests had been sent out. Why?
Stephen,
I asked you to prove that Raffensperger violated Georgie law with changes made to voting policies. This was your claim. Of all the claims you’ve made, which are mostly speculation, this is one you could actually prove with documentation.
Demonstrate that you’re right about something. This is your best opportunity to give yourself some credibility above being a lackey for Trump.
“Trump knew there was massive fraud in Georgia”
No he didn’t. He’s not superman. He didn’t have special access to the truth. He just told you that and you believed him.
The man is a fighter and he’ll lie through his teeth to win. Even his most ardent followers know that he bends the truth. What kind of follower are you?
He’s so full of sh!t.
“This vote was certified by the wonderful Secretary of State Raffensperger.”
Stephen accuses any election official, even Republican ones, who simply competently do their job, and have not ‘found’ loads of fraud, of being some kind of evil traitor.
Stephen is lost way far down the rabbit hole, and there is no way of ever getting him out.
“Raffensperger: Youre talking about the State Farm video. And I think its extremely unfortunate that Rudy Giuliani or his people, they sliced and diced that video and took it out of context. The next day we brought in WSB-TV and we let them show, see the full run of tape and what youll see, the events that transpired are nowhere near what was projected”
Yep, here it is.
https://www.youtube.com/watch?v=h-9jFuieH_U
This video was also the basis fro Rudy G’s defamation of two black election works saying they were bringing in a suitcase of fake ballots.
He later lost the multi-million dollar defamation case brought by these women against him.
Do you own a red MAGA hat?
“This video was also the basis fro Rudy Gs defamation of two black election works saying they were bringing in a suitcase of fake ballots.
He later lost the multi-million dollar defamation case brought by these women against him.”
Those women received multiple death threats over many weeks and even had MAGA loons knocking on their door. The young son of one of them had her old phone and received racial slurs and other terrible stuff straight to his ear. The false accusations had terrible consequences.
Hmmm if thats the case they probably should fine the entire democrat delegation to congress for falsely accusing Trump of Russian Collusion. How much should they pay Trump for that? He didn’t just receive death threats.
Tim,
“As previously stated, the process they used to replace Joe is not democratic.”
I agree, but redoing the primaries was not possible in the time left.
“Josh Shapiro was pushed aside to satisfy the Hamas supporters, and Gavin Newsom was not allowed to speak at the convention. When asked about that, Newsom said ‘I did everything they asked me to do’.”
None of this has anything to do with democracy when the voters don’t choose.
But more importantly, while the constitution does not provide answers, it does point in the direction of a vice-president stepping up when a president steps down.
Furthermore, Democratic party rules are that delegates vote on their conscience. The Biden/Harris ticket was going to be contesting for the executive. Voters did not choose Shapiro or Newsome.
Harris was the obvious choice in a messy situation. There may be a better candidate. But there always is.
Same goes for Trump. Barr and Bolton are rusted on to the party, if not the man.
barry…”
RLH says:La Nina will be colder than El Nino.
barry says:Thank you, Captain Obvious.
***
It’s not so obvious. Here in the Vancouver, Canada region, we had a heat dome parked over us at one point that NOAA blamed on La Nina. A few months later, in November, we had major flooding, again confirmed by NOAA to be caused by La Nina.
The context was global temps, but thanks for playing, Gordon.
barry…I was pointing out that global temps are meaningless and that neither EN nor LN can be construed as being warmer or colder than the other. The effect of both depends entirely on local weather disturbances they produce that can be thousands of miles from the South Pacific.
But, hey, if you’re just playing, what can I say.
When Captain Obvious said la Nina will be colder than el Nino, he was referring to the impact on global temps.
And everybody knows that, which is why he got the epithet.
Now you’re telling me that local weather is different to global.
Captain Obvious mark II!
And Captain Irrelevant.
I could keep going but I think your shoulders are too sloped to carry the extra brass.
tim f…”Are you honestly try to tell us that you dont know that American and America are commonly used to refer to the country south of Canada???”
***
Tim…I don’t care what the US is called, I am referring to the obvious, that calling the US ‘America’ is a breach of basic intelligence and geography.
If I call myself Gordon of Vancouver, is it correct to call me Vancouver? Not from where I come from, where ‘of’ is used to denote a place of origin, which in this case is a continent. The United States of America, to an intelligent mind who speaks English means that the United States is in America and not a country called America.
By the same token, is it wrong for a Canadian to call himself American, or to claim his country is America? After all, America applies to both a Canadian and a US citizen equally. People who can also legitimately claim to be an American are Mexicans, Costa Ricans, Brazilians and Argentinians.
Personally, since I live on the continent of America, I am perfectly within my right to call myself an American. Ironically, it is wrong from a Hawaiian to call himself America since he is a US citizen but lives in Polynesia.
While traveling abroad, I’d be afraid to call myself an American, even though it true, since I’d be mistaken for a Yank. Even Yanks traveling abroad often call themselves Canadian. Heck, I won’t even call myself a Canadian abroad, I put on my Scottish accent and claim to be a Scot. Actually, by DNA I am a pure Scot.
Having said all that, I like Yanks in general. I extend that to southerns rebs even though they’d rather have another civil war than call themselves Yanks.
“I dont care what the US is called”
Clearly you do!
“calling the US America is a breach of basic intelligence and geography.”
I understand that Canadians might be upset that the US usurped the word “American” for themselves. But language evolves. “America” has come to mean (to most people in most places) an abbreviated form of “The United States Of America”.
Yes, you are within your rights to call yourself American. Or Canadian. Or Scottish. Or pretty much anything else you wish to call yourself. But you can’t dictate how others use words.
tim f…it’s not just Canadians, it’s Mexicans, Nicaraguans, Costa Ricans, Guatamelans, Panamanians, Brazilians, Venezeulans, Peruvians, Bolivians, Chileans, Argentinians, and every other denizens of the Americas, including the Caribbean, who are just as American as any US citizens.
The US COnstitution as written by the Founding Father did not call their new country America, Here is the preamble…
“We the People of the United States, in Order to form a more perfect Union, establish Justice, insure domestic Tranquility, provide for the common defence, promote the general Welfare, and secure the Blessings of Liberty to ourselves and our Posterity, do ordain and establish this Constitution for the United States of America”.
The Founding Fathers knew the name of the country is ‘the United States’ and the purpose of the Constitution was to ‘establish this Constitution for the United States of America’.
What is it about ‘of America’ that you don’t understand? America is obviously the continent upon which the United States is being formed, and not the country itself.
****
Going back to the war of 1812, when the US had been declared as something like 12 States, the US knew they were only part of North America. They were aware of Mexico to the south and the developing nation of Canada to the north, who they decided to attack in 1812. It was not even a complete war since the state of New York showed little or no interest, nor did New England.
1812 was a local skirmish in which locals in the US wanted to expand north into arable areas that are now Canada.
The Star Spangled Banner anthem does not mention America. That did not come till Irvine Berlin wrote God Bless America in 1917. Just before, in 1895, Bates wrote the lyrics to America The Beautiful, which is arguably an alternate anthem to the Star Spangled Banner.
You keep going farther afield, Gordon. I have no quarrel with your recap of history or the US constitution.
The whole discussion started with someone saying “Happy Thursday America”. We don’t need to know about global maps, the US constitution, the War of 1812, Mexicans, or the Star Spangled Banner to understand this phrase.
Yes, you 100% correct that the official, legal name is not “America”.
But calling the US “America” is NOT a breach of basic intelligence nor geography. The breach of basic intelligence is to not acknowledge that “America” is almost universally used to name the country south of Canada.
bob d…”The continents are North America and South America.
Buy a geography book or a map”.
***
Don’t forget Central America, which is part of North America.
Can you point out a country in either continent legally called America?
The name America is an English distortion of explorer Amerigo Vespucci, who called the entire continent, both North and South, the ‘New World’. It was later renamed America by cartographers in honour of Vespucci’s first name Amerigo. Thankfully they did not call it Vespucci, from which it would have become North and South Vespucci.
Had the Founding Fathers named their new 13 state country ‘The United States of Vescpucci’ would modern US citizens be willing to call themselves Vespuccians?
Hi, I’m Bob Droege, I’m a Vespuccian.
Gordon,
Central America is still not a continent.
SOLAR MINIMUM UPDATE
over the weekend X / Twitter took the @America handle from the original user who registered it
the handle now belongs to Elon Musk and his Super PAC set up to support Donald
https://bsky.app/profile/mattbinder.bsky.social/post/3l5veugk3sx2f
barry…from Tim…”Mail-in voting often called absentee voting or vote-by-mail has slowly but steadily gained in popularity in the United States”.
***
Mail in balloting is notoriously open to corruption. It should be banned for that reason. During the 2020 election, it was discovered that Democrat volunteers had been scouring poor neighbourhoods to buy blank voting ballots.
Both parties are equally corrupt, as are most political parties worldwide, and it is wrong to equate corruption to only the Republicans.
As proof, Democrat President Lyndon Johnson was notoriously corrupt (kickbacks) in his home state of Texas and President Bill Clinton was morally corrupt. His wife Hillary engaged in questionable activity aimed at smearing Trump.
We all know about Al Gore, how he misinformed the world about climate change, profiting from the misinformation in a big way, and now we have Democrat John Kerry taking his place.
“Mail in balloting is notoriously open to corruption”
Says you.
I wish it was just me.
MAGA are the chorus on this, repeating what their leader tells them.
Trump’s perversity at its best:
https://truthsocial.com/@realDonaldTrump/posts/112300168902589359
” ABSENTEE VOTING, EARLY VOTING, AND ELECTION DAY VOTING ARE ALL GOOD OPTIONS. REPUBLICANS MUST MAKE A PLAN, REGISTER, AND VOTE! “
binny…” Then there was the study in which thousands of cell phones were tracked from a massive data base. It revealed people visiting several voting stations and inserting multiple votes per station visited.
And where is that study, liar Robertson?”
***
I wonder if Binny can overcome the hatred in his mind to reply once without insults or ad homs?
I have offered the link several times to the film 2000 Mules, which outlines in detail the corruption. Of course, the only comeback has been to offer weak rebuttals as to the accuracy of the film.
2000 Mules has been withdrawn.
https://www.npr.org/2024/05/31/g-s1-2298/publisher-of-2000-mules-election-conspiracy-theory-film-issues-apology
“issued an apology and said it would halt distribution of the film and remove both the film and book from its platforms.”
He apologized for linking one voter from Georgia to the scam. All he did was sponsor the film, he did not make it.
It appears he withdrew the film to avoid further litigation. I saw the original and there was nothing in it that attacked people. It simply laid out, based on cell phone coverage, that messengers were visiting several polling stations early in the morning to deliver ballots.
Must be wonderful in your ivory tower, safe from dragons, as long as you don’t come down from the tower. You have no idea how vicious it can get in the US when it comes to politics and suing people.
He was the publisher.
“The conservative media company behind the book and film ‘2,000 Mules,’ which alleged a widespread conspiracy by Democrats to steal the 2020 election and was embraced by former President Donald Trump, has issued an apology and said it would halt distribution of the film and remove both the film and book from its platforms.”
“According to Andrews’ lawsuit, the allegations in “2,000 Mules” led to violent threats against him and his family. “They worry that again they will be baselessly accused of election crimes, and that believers in the ‘mules’ theory may recognize and seek reprisal against them, and that they may face physical harm,” the lawsuit alleged.
According to a court filing in a related case, Salem settled the lawsuit brought by Andrews for an undisclosed “significant” amount. In the statement on its website, Salem wrote, ‘It was never our intent that the publication of the 2000 Mules film and book would harm Mr. Andrews. We apologize for the hurt the inclusion of Mr. Andrews’ image in the movie, book, and promotional materials have caused Mr. Andrews and his family.’ ”
The MAGA crowd love issuing death threats and intimidating people at their home. They did it to election workers, they do it to anyone who Trump or his minions pick out.
It is a most disgusting cult led by a malignant tumor of a human being.
” I wonder if Binny can overcome the hatred in his mind to reply once without insults or ad homs? ”
For the umpgteenth time, Robertson intentionally and deliberately manipulates the blog.
I never insulted but rahter counter-insulted him because he is himself the poster insulting the most on this blog.
*
” I have offered the link several times to the film 2000 Mules, which outlines in detail the corruption. Of course, the only comeback has been to offer weak rebuttals as to the accuracy of the film. ”
There were no ‘weak rebuttals’, Robertson; you are lying here again.
This film was – except Trump’s daily bullshit – one of the worst, most disgusting manipulations I have ever heard of.
Yes…Democrat looneys would see it that way since it exposes their desperate cheating. It’s actually hilarious to see so many people bent out of shape by one man. That’s what I like about Trump, he has a knack for needling and getting under the skin of the politically-correct. They are so annoyed and helpless they will do anything to ensure he does not win again.
Trump is not a Republican by nature. He’s an outlier that no one can pin down.
From the wikipedia article, which has references if you want to get in the weeds. Seems the makers told a few porkies.
“D’Souza and Gregg Phillips, a True the Vote board member, asserted they had matched their geolocation data with data from the Armed Conflict Location and Event Data Project (ACLED). In the film, Phillips claims that “dozens and dozens and dozens of our mules show up on the ACLED databases” as what are characterized as “antifa rioters”. ACLED said the claims were categorically false, noting it does not track cellphone data…
To illustrate the use of phone geolocation technology, in the film D’Souza speaks with Phillips, who alleges he used it to identify two suspects in an Atlanta homicide cold case, providing his analysis to the FBI, which he and D’Souza suggest resulted in arrests of the suspects. The homicide was not a cold case, and both suspects were arrested by state rather than federal officials, with no indication phone geolocation played a role. True the Vote stated days after 2000 Mules was released that it had notified the FBI of its analysis more than two months after the suspects had been indicted. Promoting the film on his podcast, D’Souza said the FBI had forwarded the information to the Georgia Bureau of Investigation (GBI) and the arrests resulted shortly thereafter; the GBI denied receiving such information….
Georgia Secretary of State Brad Raffensperger said his office investigated a surveillance video from the film showing a man depositing five ballots into a drop box, finding he had lawfully deposited ballots for himself and his family.[22] It was one of at least three surveillance videos from the film found by Georgia investigators to show lawful depositing of multiple ballots.[13]…
In the film, Phillips shows a diagram on a tablet computer purporting to show a mule traveling to 28 drop boxes in Atlanta. When that diagram is superimposed over a diagram of actual drop box locations, only some of the purported locations are near actual drop boxes. Phillips told The Washington Post that “the movie graphics are not literal interpretations of our data”. Another diagram in the film purports to show geolocations superimposed over a map of Atlanta, but the map is actually of Moscow.[21]…
The film shows surveillance video of people allegedly depositing multiple ballots into drop boxes, although there was no way to match them with the geolocation data, and most states allow such ballot collection on behalf of family members and household members….
Phillips narrates that a woman deposited “a small stack” of ballots into a drop box, although it is not actually clear there was more than one ballot. The deposit allegedly occurred at 1am, after which the woman removed latex gloves and threw them away, which the film characterizes as suspicious. The incident occurred on January 5, 2021, during Georgia’s runoff election, not during the 2020 presidential election…
The film conflates with its premise a case involving unlawful ballot collection by two Yuma County, Arizona, women during the August 2020 primary elections; the women had collected ballots for others, although they were not family members or caregivers as required by law, and their prosecutions were underway before the film’s release. D’Souza said during a podcast that the Yuma County sheriff saw the film, “went berserk and has opened up an investigation” and, “I believe there will be arrests very soon.” The sheriff denied the claim, saying he had been investigating a variety of alleged voter misconduct issues for over a year, none of which were related to the film’s claims.[27] D’Souza later claimed that these two women pleaded guilty after having watched the film 2000 Mules. In fact, this was impossible,[28] as Alma Juarez pleaded guilty on January 18, 2022,[29] and Guillerma Fuentes pleaded guilty on April 11, 2022,[30] before the film’s limited screenings on May 2 and 4, 2022, and its release on May 25…
In October 2022, the office of Republican Arizona attorney general Mark Brnovich referred True the Vote to the FBI and IRS for possible investigation, finding that Engelbrecht and Phillips had falsely told the office they had given their data to the Phoenix FBI office and were working as informants there, while telling the FBI office, the Arizona Senate and the public they had given their data to the attorney general’s office, although they had not. Brnovich’s office said True the Vote claimed to have evidence of 243 mules in Arizona, but presented no proof. The attorney general’s office also suggested True the Vote’s tax exempt nonprofit status should be examined.[38].”
https://en.wikipedia.org/wiki/2000_Mules
“Thats what I like about Trump, he has a knack for needling and getting under the skin of the politically-correct.”
So sayeth a Canadian who doesn’t have to have him as your President.
But that is what many supporters like about him.
Is that the job of the President? To entertain you by tro.lling his political opponents, the people you most despise?
IMO, we need the opposite.
Right now we is a good example of what we need from government. We want government to be effective at dealing with things like hurricanes.
People who want to be entertained by tr.olls can get that elsewhere,… on the internet, on reality TV: Housewives of Hoboken, whatever.
I prefer a president who is quietly competent.
Amen, Nate.
The Planet Surface Rotational Warming Phenomenon:
(Tsat.planet.1) /(Tsat.planet.2) =
= [ (N1*cp1) /(N2*cp2) ]^1/16
https://www.cristos-vournas.com
It was asserted that Earth has an atmosphere, and Moon doesn’t have. It was said Earth’s atmosphere acts as a blanket, which keeps Earth’s surface warm.
–
What we have discovered, is that the warming-blanket-atmosphere theory is all mistaken. Earth’s atmosphere is very thin, and therefore Earth’s atmosphere is not capable to warm the surface to any significant extend.
–
Earth’s atmosphere doesn’t have any considerable greenhouse warming effect on the surface.
–
https://www.cristos-vournas.com
christos…the function played by the atmosphere is to absorb heat directly from the surface causing the surface air to rise. While it is rising, it retains heat which it gradually loses with altitude. If that heated air did not rise, the surface and the atmosphere would always be in thermal equilibrium and as Lindzen claimed, the surface average would rise to 70C, far too hot to support human life.
When we compare the Moon to Earth, we must also include the oceans, which are missing on the Moon. The oceans also retain heat. I agree that the heated atmosphere does not warm the surface, but we live in the atmosphere, not the surface or the oceans. We are surrounded by the atmosphere and if it did not retain heat, either from the surface or from solar energy, we would likely not survive.
Since the atmosphere dissipates surface heat gradually with altitude, it serves to remove surface heat that is dissipated naturally. That loss of heat is not represented in the GHE or AGW theories, rather it is dismissed as inconsequential. Ergo, the GHE and AGW theories are amateurish theories designed for children, as Lindzen claimed in his own words.
Thank you, Gordon, for your response.
What is very important to accent to is that, at every given moment, lunar surface temperatures are very much differenciated.
Earths surface temperatures are also very much differenciated.
When comparing, though, the lunar and Earths surfaces temperature behaviors, we can clearly see that lunar surface temperatures are way much more differenciated than Earths surface temperatures are.
Because Earths and Moons the respective surface properties, both (N) and (cp), which are mutually compared by their respective (N*cp) products they are very much different:
Earth(N*cp) /Moon(N*cp) = 155,42
Because Earths surface is 155,42 TIMES more prepared, when compared to lunar surfaces properties for the solar energy INPUT capasity.
https://www.cristos-vournas.com
Gordon… “the function played by the atmosphere is to absorb heat directly from the surface causing the surface air to rise. While it is rising, it retains heat which it gradually loses with altitude.”
The by convection transfer of heat from a warmer surface to air requires some vigorous air movement.
As an example is the air conditioning device. Its indoors and its outdoors separate units have a much different from the surrounding them air temperature.
In order to transfer the heat from unit to air, or from air to unit, the units use ventilators to make the transfer of heat intensive.
–
–
https://www.cristos-vournas.com
“Since the atmosphere dissipates surface heat gradually with altitude, ”
No.
As a parcel of air convects its volume increases while pressure and temperature decrease as described in the Ideal Gas Law.
The heat content remains constant because the quantity of gas, the mass, remains constant.
There is even a word for this. Both convection and the lapse rate are adiabatic.
Entropic Man states: “The heat content remains constant ”
This is misleading at best, because the term “heat content” is not clearly defined.
If you mean the internal energy, U, remains constant, that is wrong. The internal energy decreased as the temperature decreases.
If you mean no heat, Q, is transferred in or out, that is correct. That is what “adiabatic” means. But this does not seem to be what you mean, since Q is “heat flow” and not “heat content”
Internal energy, U, can change due to heat flow, Q, and work, W.
ΔU = Q + W (using one common sign convention)
The internal energy (sometimes called “thermal energy” or “heat content”) decreases as the parcel rises because the parcel does work on the surroundings as it expands.
Gordon says: “Since the atmosphere dissipates surface heat gradually with altitude, it serves to remove surface heat that is dissipated naturally. That loss of heat is not represented in the GHE or AGW theories”
I would love to hear you explain your statement more fully and precisely, since in its current form it is rather imprecise.
First, you use “heat” in an antiquated manner. Throughout you seem to be referring to U — commonly called “internal energy” or “thermal energy”, I don’t want to argue semantics, so I will just use U (and Q for thermal energy transfer).
Then you use “dissipate” which one dictionary defines as “to cause to spread thin or scatter and gradually vanish”. Of course, energy does not “vanish” or get “lost”. It can transform, or it can transfer from one ‘system’ to another.
Your “dissipate” seems to be “transfer”. I.e. your first sentence could be rephrased as “U from the surface is transferred to the atmosphere. As the atmosphere convects up, that U is transferred naturally elsewhere.”
This, of course, is represented in the standard theories. U is transported up by convection, which is then transferred to space by radiation. Both are clearly present, eg in the Trenberth diagram.
If you mean something else (like energy simply ‘dissipates’ and ‘disappears’) then you need to clarify significantly!
SOLAR MINIMUM UPDATE
Argentinas rightwing populist president, Javier Milei, has been accused of plagiarising a chunk of his recent speech to the United Nations general assembly from the political drama The West Wing.
https://www.theguardian.com/world/2024/oct/04/argentina-javier-milei-accused-plagiarising-un-speech-west-wing
A dramatic joke.
It seems to me that the pack of pseudo-skeptics operating on this blog apparently is too dumb to grasp the trivial fact that if Trump had won the election in 2020, NO ONE of them would ever put nonsense like
” Mail in balloting is notoriously open to corruption. It should be banned for that reason. ”
into any post.
How dumb is one allowed to be?
I’m not sure that there is a limit, reading the mindless, parroted talking points above.
The Bobbsy Twins, Binny and Barry, are in agreement. That gives me confidence that my claim is correct that mail in balloting should be discontinued.
This is not something I dreamt up, it has been a concern in US elections for some time.
Republicans have claimed it is a serious concern without much evidence.
Do you know why? Because Democrat voters use mail ballots more than Republican voters.
Republicans have been trying to suppress voting for years with false claims in order to improve their fortunes on election day.
Yesterday I wrote:
” It seems to me that the pack of pseudo-skeptics operating on this blog apparently is too dumb to grasp the trivial fact that if Trump had won the election in 2020, NO ONE of them would ever put nonsense like
Mail in balloting is notoriously open to corruption. It should be banned for that reason.
into any post.
How dumb is one allowed to be? ”
*
Robertson manifestly is.
*
And what he doesn’t understand is that (1) not so long ago, Trump preferred to use mail ballot for himself and (2) on 20. Apr. 2024, 12:09 AM he invited his folks on his own (Un)Truth (A)Social channel to make use of ALL election modes available:
https://truthsocial.com/@realDonaldTrump/posts/112300168902589359
” ABSENTEE VOTING, EARLY VOTING, AND ELECTION DAY VOTING ARE ALL GOOD OPTIONS. REPUBLICANS MUST MAKE A PLAN, REGISTER, AND VOTE! ”
*
In many states, there is no basic difference between absentee voting and vote-by-mail.
*
All the rest is dumb, disgusting stuff a la ‘Migrants eat our pets’.
It can’t happen here.
https://en.m.wikipedia.org/wiki/It_Can't_Happen_Here
— SpaceX launches Europes Hera asteroid mission
October 7, 2024 8:41 am Robert Zimmerman
SpaceX today successfully launched the European Space Agencys (ESA) Hera asteroid mission to the binary asteroid Didymos and Dimorphos, its Falcon 9 rocket lifting off from Cape Canaveral.
The first stage completed its 23rd rocket, but was not recovered in order to maximum the fuel used to send Hera on its proper route. The fairings completed their 13th and 19th flights respectively.
Hera will do a follow-up rendezvous with the binary asteroids to get a close-up look at the consequences of the Dart impact back in 2022 of Dimorphos.
The leaders in the 2024 launch race:
96 SpaceX
44 China
11 Russia
11 Rocket Lab
American private enterprise now leads the rest of the world combined in successful launches 113 to 67, while SpaceX by itself now leads the entire world, including American companies, 96 to 84. —
https://behindtheblack.com/
Keep in mind falcon-9 lifts a lot payload to LEO- twice as much as Soyuz, which has medium size payload to LEO. And Rocket Lab has small rocket [they are developing a larger rocket}. And China is also launching mostly small to medium rockets.
Or recently, we got SLS, which is currently the biggest, and Heavy Falcon which is smaller than SLS, and bigger than falcon 9 and all other rocket, currently flying
And we getting New Glenn, smaller than SLS, and bigger than Falcon Heavy.
So even when Falcon-9 is recovering it’s fist stage it’s payload to orbit is large and large amount Falcon-9 launches to orbit is large number and massive amount of payload to orbit, per year. Which has mostly built Starlink [and almost 1/2 way to complete it]. With 4 million global subscribers- and is providing internet to airlines and ocean ships.
Plus all cell phones in world will increasingly use it and other commercial satellite orbital networks {falcon-9 is also launching some portion of these other companies satellites}.
Anyways, it’s going to get exciting when New Glenn rocket gets flying, and also when Rocket Lab get it’s larger rocket flying, and also Japan’s H-3 might pick up it’s pace.
Though might take few years before India develops it’s launch industry by a significant amount.
FAA clears Falcon 9 launch of Hera mission
Jeff Foust October 6, 2024
“COCOA BEACH, Fla. The Federal Aviation Administration has granted approval for the Falcon 9 launch of the European Space Agencys Hera asteroid mission, but is keeping the vehicle grounded for now for other missions.
In an Oct. 6 statement, the FAA stated it authorized a return to flight for the Falcon 9 solely for the Hera mission, scheduled to lift off no earlier than Oct. 7 from Cape Canaveral Space Force Station in Florida. The vehicle has been grounded since an anomaly during a deorbit burn of the second stage on the Crew-9 launch Sept. 28. ”
https://spacenews.com/faa-clears-falcon-9-launch-of-hera-mission/
SOLAR MINIMUM UPDATE
Long gone are the innocent days when media outlets claimed the independence and nuance of the politics of Elon Musk. Now, amid myriad X posts spreading far-right propaganda on immigrants, trans people, and, well, just about any other topic, it has become obvious where one of the richest men in the world stands.
This week, there was more proof that Musk has put his money where his mouth has been. According to a report from the Wall Street Journal, Musk poured tens of millions of dollars into Republican campaigns and conservative groups even before he publicly endorsed [Donald] in July. Conservatives helped conceal Musk’s contributions through so-called social welfare or “dark money” groups that do not have to disclose their donors and can raise unlimited funds. (Musk did not respond to the Journal’s request for comment.)
https://www.motherjones.com/politics/2024/10/elon-musk-wsj-trump-stephen-miller-donations/
D A R K M A G A
“Musk poured tens of millions of dollars into Republican campaigns and conservative groups even before he publicly endorsed [Donald] in July. ”
So, richest guy in world is spending tens of millions into Republican campaigns.
Does that mean lessor billionaires are NOT spending tens of billions in dem campaigns and lefty groups {like Hamas terrorist groups]?
As I recall, Musk decided to spend to most amount of money paying taxes, than anyone else has ever done. And perhaps most amount any huge corporation every paid.
I guess in this case, he can write off the money and pay less in taxes. Or he playing by all the rules of other billionaires?
Musk may not be the very smartest person on earth, but he is the most amazing business man in modern history and maybe ever. He is the chief technology officer of all of his companies. When asked many years ago what qualifications he had for starting a space company, said he had read some books. He wasn’t joking. He literally is smarter than the entire space industry that cannot match his achievements.
He was a champion of the radical left wing until he started talking about free speech and capitalism. Maybe he is more intelligent than we think, if his only criticism is capitalism and free speech.
> playing by all the rules
You might like:
https://www.cnn.com/2024/09/29/us/elon-musk-immigration-gray-area-cec/index.html
“Tim S says:
October 7, 2024 at 12:53 PM
Musk may not be the very smartest person on earth, but he is the most amazing business man in modern history and maybe ever. He is the chief technology officer of all of his companies. When asked many years ago what qualifications he had for starting a space company, said he had read some books. He wasnt joking. He literally is smarter than the entire space industry that cannot match his achievements.”
“What is the psychology of Elon Musk?
Isaacson hints that Musk’s emotional development was stunted in childhood as a result of his father’s abuseto survive, Musk learned to shut down his feelings. This, in combination with his Asperger’s traits, taught Musk to interpret emotions differently than those without such harsh backgrounds.”
“Elon Musk has post-traumatic stress disorder from a turbulent childhood that included time in apartheid South Africa and verbal abuse from his father, famed author Walter Isaacson claims in his new biography of the Tesla CEO.”
He might be getting better. He is obsessive. But most billionaires are similar to this.
When first heard of Musk, I was happy someone was trying, but I thought his rockets were too small- but there was definitely sense in starting with small rockets.
I was a fan of big dumb boosters, and I was wrong in liking H2&LOX for the first stage. Or Saturn V used kerosene engines in it’s first stage- it was part of magic of the Saturn V rocket. The Saturn V is still the best rocket ever made- and the US govt, scraped it.
And Saturn V could been [and was planned] to be an reuseble rocket, at least the first stage, would be quite easy.
But then we spent trillions on the stupid Space Shuttle- though some were talking about using kerosene rockets for it’s boosters instead the dumb solids {flyback booster}
Anyways as far as I know Musk wanted a Russia rocket to get his greenhouse to Mars, and it seems that is where he got some understanding about using kerosene for the first stage- Soyuz was the most successful rocket ever in terms of number of launches and lack of failure.
And he followed the old rule of making the rocket small enough that it could moved on roads/trains.
[Sea dragon was going to made in dry dock, and not going any where near trains or roads].
Everyone knew the trick was to launch rockets a lot per year. The Space Shuttle was suppose to launch once a week, and get down to $25 per lb.
In terms of “entire space industry” it’s a trillion dollar market, most of market is not NASA and Military space of entire world- most is the commerical satellite market. The commercial satellite market has transformed our world AND lowered dramatically the cost “of everything”.
The importance of military space, is critical to national security [and lowering miltary costs}. US spends at least twice as much on Miltary space, than it does on NASA.
Or NASA has wasted a lot money, but it’s a relatively small amount of money.
Oh, one most important thing Musk did, was lower the costs of making satellites.
It was always the case that satellites cost a lot more than the rocket launch.
Musk’s cost of 100 satellite was about 30 million and launch cost him 30 million {his costs, he sells for +60 million- and you have launch cost to consider- which again depends number of launches the launch platform does over it’s lifetime- but the launch tower system “not reusable” costs much more than satellites or rockets or both}.
So 1/100th the cost per satellite vs rocket launch- a big issue.
Absence of proof that Cybertrucks are a joke would not prove this did not happen:
https://www.thedailybeast.com/geico-hits-tesla-cybertruck-with-insurance-terminations-amid-recalls
We still have evidence that they’re a joke.
I have been thinking of lower launch site costs, for decades.
My solution was what call a pipelauncher. But it needed about 10 launches per year, to be profitable vs land launches. And we did didn’t have 8 launches from a rocket per year, when I started.
To lower launch costs to do Musk Mars city thing, you need to launch from the ocean.
This also related to sub-orbital travel, which would need more launches than Musk Mars city thing. And it would use less kerosene than airplanes use [maybe same mass of fuel if you count the LOX- but planes get the oxygen for free, and don’t need to carry it].
Nobody’s going to Mars:
https://www.mediaite.com/tv/buttigieg-is-on-the-ball-elon-musk-praises-key-biden-official-after-pushing-wild-claims-about-fema/
“Nobodys going to Mars”
It seems everyone is going to Mars.
And very good news for cargo cult of global warming- as I have explained before.
We are still living in the best of times.
[in case anyone is depressed, though best of times might be
depressing for some.
We in ice age, we can’t leave it, anytime soon, but that’s ok.
Really, nobody’s getting to Mars:
https://www.bbc.com/news/articles/c0e1xgw4dqdo
Opinion – Could SpaceX and Elon Musk get people on Mars by 2028?
https://tinyurl.com/mv73fews
“Will a second Trump presidency mean American boots on both the lunar and Martian surfaces by the end of his term? Maybe. Maybe not. But having the author of the Artemis program back in power makes the prospect far more likely.”
Perhaps, Dems should be asked, do they want to send the first woman to the Moon, and then go to Mars.
It’s important thing to know in regards to up coming election.
We could sent Kamala Harris on the third crew landing on the Moon.
With the overview effect, gotten, she might qualify to run for US President.
Overview effect:
“The overview effect is a cognitive shift reported by some astronauts while viewing the Earth from space. Researchers have characterized the effect as “a state of awe with self-transcendent qualities, precipitated by a particularly striking visual stimulus”. The most prominent common aspects of personally experiencing the Earth from space are appreciation and perception of beauty, unexpected and even overwhelming emotion, and an increased sense of connection to other people and the Earth as a whole. The effect can cause changes in the observer’s self concept and value system, and can be transformative”
https://en.wikipedia.org/wiki/Overview_effect
You’re still spamming.
Very well:
https://www.theguardian.com/world/2024/sep/23/elon-musk-to-present-atlantic-council-global-citizen-award-to-giorgia-meloni
Kanye West, Kim Kardashian, and…Immanuel Kant?
https://www.youtube.com/watch?v=eFiGyyoHf34
I am listening to this.
Philosophy stuff.
And it seems Sim reality doesn’t “work”.
barry…”MAGA are the chorus on this, repeating what their leader tells them”.
***
Barry…what is wrong with trying to prevent the naive and politically-correct from tearing your country apart?
You’ve quoted me correctly but get the context completely wrong.
The topic was elections, not wokeness.
You apparently have a noisy mind that is ill-suited to staying on topic.
How could I get the context wrong. You are clearly claiming that MAGA followers are wrong because they are blindly following Trump. You have failed to research what they are trying to achieve.
No, you simply failed to follow the conversation and injected your own topic. I said:
“MAGA are the chorus on this, repeating what their leader tells them”
And you did not remember what “on this” referred to.
Regarding wokeness, conservatives have views on this that are independent of Trump’s expectorate, so I don’t agree with your red-herring anyway.
Rather than lamely trying to cover your gaffe, just admit you got the context wrong and move on. Show some integrity, man.
Don’t need to know what “on this” means. Your statement re MAGA, plus your other posts about them, make it clear that you think they are ignorant rubes. I have asked what is wrong with US citizens wanting to protect their values. After all, 50% of US voters support MAGA.
I dare say that a good proportion of the other 50% support it as well but have been brow-beaten by the politically-correct into following a Draconian agenda geared to stifling the US way of life.
There is a lot that can be fixed in the States to make it a better place for everyone but the underhanded way it is being foisted on people is anathema to US democracy.
“Don’t need to know what ‘on this’ means.”
Then I too have no interest in what you’re actually saying. I learn from your example.
barry…”This video was also the basis fro Rudy Gs defamation of two black election works saying they were bringing in a suitcase of fake ballots”.
***
What would anyone think if someone showed up at a polling station with a suitcase full of ballots? Come on man, use your head.
Another witness saw an unidentified person show up with a bagful of thumb drives which were subsequently plugged into a computer. The eye witnesses complaint was dismissed by an election official without explanation. The point is, the computers are supposed to be inaccessible to election officials.
You just regurgitate nonsense without investigating, Gordon. Your head is filled with disinformation that you never attempt to verify.
The suitcase full of ballots story is baloney, and you haven’t even gotten the falsehood correctly. The claim was that they had been pulled out from under ballot tables (they were ballot boxes, not suitcases).
“Another witness saw an unidentified person show up with a bagful of thumb drives which were subsequently plugged into a computer.”
Into a….computer?
Do you mean a voting machine?
As they are not connected to the internet, the only way to get the information out of a voting machine is with a USB stick. And it is a one-way transfer.
These vague assertions – they suit you.
The voting machines are computers. They are supposed to be inaccessible to election officials.
When you open elections to mail in ballots and computers you are open to cheating. The mail-in ballot used to be a device used by servicemen and a few people who were away during an election. Now they are available to everyone at anytime. That allows unscrupulous political parties to buy unmarked ballots and use them for their own means.
You are far too obtuse, Barry to be claiming that I “…regurgitate nonsense without investigating…”. I began to realize that when you confessed to threatening to kick your ladyfriend out because she was refusing a covid vaccine, a perfect example of ‘regurgitating nonsense without investigation’. You bought into covid hysteria based on what you’d been told rather than investigate for yourself.
” I began to realize that when you confessed to threatening to kick your ladyfriend out because she was refusing a covid vaccine, a perfect example of regurgitating nonsense without investigation.
You bought into covid hysteria based on what youd been told rather than investigate for yourself. ”
As always, Robertson likes to go deep below the belt.
Like when he insults the historically first of at least ten translators of Newton’s Principia, just because he does not understand the (New) Latin that Newton and all scientists of his time used:
” In other words, Motte was a cheating S O B. ”
*
Unfortunately, Robertson lives in a corner where the chances of contracting COVID-19 are almost zero.
Otherwise he would be 99% quieter, which would be as good for this blog as the disappearance of the dumb Swen-son.
Gordon,
“The voting machines are computers. They are supposed to be inaccessible to election officials.”
Oh, so now you’re an expert, are you?
Perhaps you might explain how the digital votes in the polling machines are retrieved when the voting machine is not connected to the internet.
And if not election officials, who should be tasked with ensuring votes are collated and ready to be transported for tally?
I don’t think you have thought this through.
Robertson lives in a city that essentially the gateway to China. Many of us call our city Hongcouver due to the inordinate amount of Chinese who have relocated here. That means we were directly in touch with areas like Wuhan, China, yet we had a low death count from covid.
Italy, on the other hand, much further from China than Vancouver and with a tiny fraction of Chinese in Italy, were hit to epidemic proportions. A few years earlier they had suffered over 20,000 dead from the common flu. That’s part of the reason I regard covid as a scam. Something was obviously affecting people but it was not a hoax virus concocted by theorists. There is simply no way that a virus was spread from China to Italy.
The covid hoax was a product of epidemiologists, led by the WHO, using unvalidated computer models to predict disaster where there was none. Swedish epidemiologist, Johan Gieseke, a more enlightened type, claimed covid was nothing more than a stronger form of the flu.
I think one day they will discover that all illness attributed to viruses is caused by something as yet unknown. The science related to virology is so bad it should no longer be called science.
I agree it was a bit over the top to call Motte a cheating SOB but he was seriously incompetent with his translation that Newton supported the pseudo-science that the Moon rotates on a local axis. Newton indicated in words that the Moon translates with a curvilinear motion while keeping the same side pointed at earth. There is no way it can spin on a local axis and do that. A ball on a string is a perfect example of why it can’t.
“You bought into covid hysteria based on what youd been told rather than investigate for yourself.”
On the contrary, I was reading published medical information and opinion.
When there is a dispute on this kind of thing I tend to check the sources, and if there is a legitimate dispute among experts, read all sides.
You don’t do this. You get your info likely from facebook, blogs and/or youtube, and copy the links that these places provide.
IOW, you collate your information in an echo-chamber.
Furthermore, if there is a dispute among experts, I absolutely do not then make myself the arbiter of that dispute if I don’t have the relevant expertise. Then I go with the consensus view until better information comes along.
The work I was doing in 2020 was sensitive to COVID lockdowns. I wasn’t worried about catching it myself. My concern went beyond me, Gordon. Had I contracted it I would almost certainly have been just fine, but my department would have been shut down. This happened multiple times, and I was determined not to be the one who caused it.
Lastly, there is zero doubt that COVID was a lethal disease, particularly among the elderly, rocketing to being the 3rd biggest cause of death in 2020/21 in many countries with good social health monitoring systems. And how was this verified? By the spikes in total mortality well above normal that occurred whenever there was a COVID outbreak. Not just the magnitude of reported COVID deaths but the timing was matched with total number of deaths. It would have been worse without lockdowns and other mandates, that all abated once populations reached a critical mass of vaccination.
And that was another conspiracy theory that fell down – lockdowns stopped when the risks diminished, and life has returned to normal, despite the tin-foil hatters warning that a new age of governmental dominance was upon us.
barry…thanks for the measured response.
I realize you are likely a bit miffed in the following and I have received it accordingly…
“You dont do this. You get your info likely from facebook, blogs and/or youtube, and copy the links that these places provide”.
***
I have gotten my information on viruses from scientists like Stefan Lanka, Luc Montagnier, and Peter Duesberg. Duesberg isolated the first cancer gene and for that and other work he was the youngest scientist of his time to be inducted into the US National Academy of Science.
Duesberg has never claimed HIV did not exist, he merely claimed it was a harmless passenger virus and the real cause of AIDS is lifestyle. The fact that his career was ruined for making such a statement is what we should be concerned about. That should never happen to any scientist and the fact it did happen should cause suspicion on the science related to viruses.
The Irony is that Montagnier, credited with discovering HIV, later agreed with Duesberg with the stipulation that HIV is harmless to a healthy immune system. If you read Duesberg in depth he claims the same thing, it is is reduced immunity caused by lifestyle that causes AIDS. That is made clear by the number of opportunistic infections lumped collectively as AIDS do not involve a virus.
For example, tuberculosis is known to be caused by a bacterium, not a virus, yet if you have TB and the alleged HIV virus you have AIDS and you are treated with toxic antivirals. If you have TB with no HIV, you have TB and you are treated for a bacterial infection without antibiotics. I say the ‘alleged’ HIV virus because the test for it, like the covid test, does not test for a virus but for RNA theorized to e from a virus.
I have read at least 20 other scientists on HIV and covid and learned something from each one. I have yet to read one scientists who promotes HIV or covid who makes any sense on the subject. They all use a generalized, consensus approach. On the other hand, Lanka, Duesberg, and Montagnier go into detail that can be corroborated, or not. It has never been corroborated that RNA is an indicator of HIV, or covid, and Montagnier freely admitted that he had inferred RNA as a cause without proof. He has opined that he ‘thinks’ the RNA approach is valid but he offers no proof.
At first, I suspected that Lanka was a bit of a screwball, but the more I read him over the years, and learned about his proofs, the more he made sense. He was a loose cannon at first, claiming viral fraud, but more recently he had backed off the fraud claims, suspecting that earlier scientists were mislead.
One of the first studies into viruses was done by Pasteur, I did not realize till I read Lanka that Pasteur made several fraudulent claims. That was not just Lanka’s opinion, it can be easily verified independently. Since Pasteur, other fraudulent claims have been made in the field, yet never corrected.
Going purely on consensus can be dangerously misleading. A great example of that comes from a fellow Australian (of yours), Barry Marshall. Before Marshall, there was a strong consensus that duodenal ulcers were caused by diet and stress. When I was younger, that was the standard explanation. When Marshall put out a paper claiming the ulcers were caused by H. Pylori, a bacterium that could survive in stomach acid, he was literally laughed out of town.
The editor of the journal to which he submitted the paper led the laugh. He declared further that Marshall’s paper was one of the ten worst he had ever read. To prove his point, Marshall drank a concoction with H. Pylori and became seriously ill. Then he healed himself with penicillin. Today, a double course of penicillin is used to treat ulcers coupled with a strong acid controller to reduce stomach acid.
Marshall won a Nobel for his work and deservedly so. Had it been left to consensus, he would still be languishing in obscurity and in the US his career would likely have been ruined.
I feel strongly that science needs to be cleared of the intellectual bullies who ruin the careers of scientists for daring to go against the status quo. By supporting them through agreeing to their consensus, you are contributing to this bullying while denying legitimate scientists the opportunity to publish.
barry…”there is zero doubt that COVID was a lethal disease”
***
Covid is not a disease, it causes pneumonia in those with immune issues, which can be lethal if one’s immune system is challenged. So, the alleged pandemic was one of pneumonia.
There are different types of pneumonia, typical and atypical with atypical cases not always being clearly defined. Furthermore, pneumonia is not necessarily caused by a virus, it can be caused by anything that disturbs the lining of the lungs, including molds and bacteria.
During the covid hysteria, there was no attempt to distinguish one form of pneumonia from the other. The only way they could relate it to a virus was from the RNA-PCR test which does not test for a virus. Therefore, it must be inferred that covid is the cause of pneumonia.
This in not an exact science as some people would lead us to believe. Before covid, many people died of pneumonia each year, in fact, in 2016, over 20,000 people died from pneumonia related to the common flu. That’s about 0.03%.
The problem with covid was the hysteria driven by theorists using computer models, who had already been way off with their predictions going back to 2000. I am not in any kind of denial that the covid era was serious for many people but those types of medical issues crop up from time to time. Back in the 50s, there was a polio epidemic that suddenly appeared, and was disappearing on it own before a vaccine was introduced.
The Spanish flu is theorized to have killed between 17 million and 50 million. To date, covid is claimed to have killed 7 million. That means covid has killed 0.08% of the global population. That number, 0.08% is typical for Canada too, however, I question the 7 million number. I think it was realistically far less, based on my understanding of what constituted a covid death.
barry…I think it was wrong for your government to impose sanctions re shutting down your department should you have gotten sick. All governments reacted with hysteria. It would have been far better to have enforced mandatory isolation on an individual basis.
I have sat in safety sessions on industrial sites when people in close proximity were far too sick to have been there. They were being greedy and selfish, not wanted to lose a day’s wages while infecting the rest of us.
G. Robertson wrote:
“Italy, on the other hand, much further from China than Vancouver and with a tiny fraction of Chinese in Italy, were hit to epidemic proportions”
Italy has the highest number of Chinese citizens in Europe (and they run many businesses, bars, etc.), the equal highest number of old people (with a high number of comprbidities), the first infection was discovered in a Chinese couple recently arrived from China, and the virus was present at least 6 months before the first official case was registered. Put all those facts together and what do you get?
Gordon,
“Stefan Lanka, Luc Montagnier, and Peter Duesberg.”
And what are the names of the experts in HIV whose research is in line with the mainstream view, that you have studied?
“I have yet to read one scientists who promotes HIV or covid who makes any sense on the subject.”
Having seen your take on a great number of items, some of which I have researched, I’m not at all confident your opinion is untramelled by your intellectual/ideological bias.
“Covid is not a disease”
COVID19 is a disease.
SARS CoV2 is the virus.
I note you didn’t claim this time that the virus has not been isolated. Have you learned better?
Whatever terminology you want to use, COVID was highly lethal, rising to the 3rd largest killer in the US for two years, and this is highly corroborated by the magnitude and timing of ‘excess deaths’ (total mortality) over the period. This pattern was consistent across countries. It is conclusive proof, as the timing of the spikes in mortality coincided with nothing more than waves of the disease, and the timing of the mortality attributed to it.
Do you understand that? Could you take a moment to get across what I just said? It is a seminal piece of evidence that generally confirms that reported COVID deaths are roughly correct.
“I think it was wrong for your government to impose sanctions re shutting down your department should you have gotten sick”
It was not government sanctions, it was what my industry elected to do. What you think is right or wrong about that is beside the point. I, not you, had to deal with those circumstances. I gave a little context so you would understand that it was not fear of COVID that drove my thinking and my discussion with my flatmate.
I contracted COVID once, that I’m aware of. Barely felt it. That’s beside the point, too. Just FYI.
SOLAR MINIMUM UPDATE
Florida Man is threatening TV stations that air ads in support of an abortion rights ballot initiative with criminal penalties, including jail time.
https://slate.com/news-and-politics/2024/10/florida-amendment-4-ron-desantis-administration-prosecute-media-airing-pro-choice-ads.html
Isn’t it ironic how so many Republicans advocate for individual freedoms and free speech, yet at the same time, impose restrictions on women’s autonomy over their own bodies?
SpaceX Confirms Starship Flight 5 Launch Intent for THIS WEEK! It’s On!!!
https://www.youtube.com/watch?v=P8ET-aSqOA4
Dominican Republic signs Artemis Accords
Jeff Foust October 8, 2024
–“ORLANDO, Fla. The Dominican Republic has signed the Artemis Accords, the 44th nation to do so, NASA announced Oct. 7.
The agency said that Sonia Guzmn, ambassador of the Dominican Republic to the United States, signed the Accords on Oct. 4. Unlike some other countries to do so in recent months, there was no formal signing ceremony publicized by NASA or the Dominican Republic.
This marks a historic step in our commitment to international collaboration in space exploration, Guzmn said in a statement. By joining the global effort to explore the moon, Mars and beyond, we are also expanding the opportunities particularly for our young Dominicans in science, education, and economic development. —
https://spacenews.com/dominican-republic-signs-artemis-accords/
Linked from https://instapundit.com/
SOLAR MINIMUM UPDATE
In the aftermath of Hurricane Helene, which left almost 230 people dead and others stranded, government and private helicopters have been flying over the affected states to bring aid and rescue survivors.
But now, unmarked helicopters hovering over donation and aid sites in North Carolina yesterday are frightening people and stoking conspiracies from an already inflamed population.
Videos posted on TikTok yesterday and Monday show the unmarked helicopters nearly landing at donation sites in North Carolina. The wind created by one of the helicopters damaged a donation site and sent supplies and a tent flying in the air, according to one of the videos.
https://www.dailydot.com/debug/unmarked-helicopters-north-carolina-aid-sites/
Dark MAGA ought to follow up on that one.
I think SpaceX should launch 2 starship and mate them in orbit, and get a artificial gravity station. So these are going return to Earth, and so they are more like lunar starship. And test out artificial gravity for a few years. And you set records for time spent in space- cause they aren’t living in microgravity.
And then have the fuel depots in same orbit and about 1 km away from the station.
So could have crew up there when trying to make in orbit fuel transfer work. The crew might able to something, if having various problems with it. Or maybe the starships separate, go over to gas station and fill up, and then go somewhere.
tim f…”Gordon says: Since the atmosphere dissipates surface heat gradually with altitude, it serves to remove surface heat that is dissipated naturally. That loss of heat is not represented in the GHE or AGW theories
I would love to hear you explain your statement more fully and precisely, since in its current form it is rather imprecise”.
***
Tim…I have described what I mean in more detail earlier. It all comes down to the relationship between pressure and temperature, given a constant volume. Also, I am questioning the claim that energy cannot be created nor destroyed, or even the conservation of energy law. Both of those ideas were offered without proof and in an era of the 19th century before the atomic theory was developed.
You brought up the relationship between internal energy and heat. Internal energy, like kinetic energy, tells us nothing about the energy in question. Clausius, who contributed the internal energy (U) component to the 1st law, was more specific about the meaning of internal energy. He claimed that U is the sum of internal heat and internal work, the latter being related to the vibration of atoms in a solid.
In the day, when the 1st law was created, no one knew anything about atomic structure. There was a vague idea of how atoms worked at a macro level, and that atoms vibrated, but they had no idea how they are connected to form a solid. Clausius anticipated the structure better than others, but Thompson, being wary of the issue, talked Clausius into inferring only an internal energy, U, rather than breaking it into the real energies involved. As a result, we are left with the vague notion of an internal energy without specifying its form.
We know that atoms in a solid vibrate in place and that adding energy causes them to vibrate more and removing the same energy causes them to vibrate less. However, we need to distinguish that energy from other forms of energy like electrical energy, so we have called it thermal energy, or heat.
There are theorists today who are in denial of heat as energy for some unknown reason. The same theorists are trying to discredit gravity as a force and replacing it with a ridiculous idea about space-time. Other theorists are trying to discredit science by claiming that a trace gas can cause catastrophic warming on a planet.
My theory starts at the surface where gas molecules of the atmosphere absorb heat directly from the surface. That causes the electrons in the molecules to become excited, increasing the KE of the molecules. The air expands due to the excitation, becomes less dense, hence more buoyant and rises as a parcel.
As the air parcel rises, it encounters an ever-decreasing air pressure and begins to expand more. As the air parcels expands its temperature drops naturally.
There is no mystery here. Pressure in the atmosphere is the sum of forces exerted on a surface by air molecules. In a normal container, air pressure is the total force applied on the walls of the container by air molecules. In the atmosphere, which has only one wall, the surface, pressure is the sum of the forces of air molecules exerted by gravitational attraction.
Temperature is directly related to pressure in a constant volume, since temperature is a measure of the KE of the air molecules. Since pressure is also dependent on KE, as the KE increases pressure increases as does temperature. If KE decreases, pressure decreases as does temperature. KE is also directly related to heat and temperature is the measure of heat. The only difference between temperature and heat is that heat is a natural phenomenon (energy) and temperature is a human invention to quantify the amount or intensity of energy based on natural set points like the freezing point and boiling point of water.
Since gravity is a force subjected to the inverse square law, it decreases as a force with altitude. The amount it decreases would be insignificant to a significant mass, that is, all significant masses are accelerated by gravity at the same rate of 9.8 m/s^2. However, atoms and molecules are so light, they are not affected in the same way. They are able to counteract gravity to different degrees yet they are ordered in density according to the inverse square law, which causes air molecules to have a pressure that varies negatively with altitude.
I am talking here of an ideal, static atmosphere free of convection. Such an atmosphere can be regarded as a constant volume for analysis, or divided into concentric, spherical volumes with constant pressure and temperature. In either case, volume is constant and temperature varies directly with pressure. That means as altitude increases, pressure drops and temperature drops.
It becomes apparent that as heated air molecules rise into an ever decreasing pressure, they lose KE due to expansion and cool. That represents heat that does not have to be radiated to space yet nothing in the GHE or AGW theories account for that lost heat.
I don’t care about anachronisms like conservation of energy or the old saw that energy can neither be created nor destroyed. Neither idea has ever been proved, only inferred. There are definitely cases where energy is conserved but creating a general theory about energy is silly since no one knows what it is or how it is created or destroyed.
I have covered energy being reduced and ultimately destroyed, how about energy creation? A star is claimed in astronomy theory to be a result of hydrogen clouds compacting under the stress of gravity then bursting into flames literally as a thermonuclear reactor. So, we have gone from hydrogen, likely at 0 K or nearly that temperature, to a boiling cauldron of hydrogen atoms that produce helium and other elements during the process.
Hydrogen has no neutrons in its natural state but suddenly, neutrons begin appearing in abundance, apparently the product of nuclear fission. However, the heat is new, it literally came out of nowhere. That is clear since hydrogen clouds at nearly 0 K suddenly have temperatures ranging from 1 million C at their cores to 5000 C at their surfaces.
Some will argue that the heat came from a conversion of other energy, however, it is a distinct form of energy and cannot be ignored in that form. Therefore, energy, as heat, has been created.
We have no idea what energy is, so how can we say it can neither be created nor destroyed, or that energy must be conserved? There is a relationship between certain energies like heat and work, yet both are unique forms of energy. It is not satisfactory to lump both under the label of a generic energy. They have vastly different properties.
The problem in anthropogenic climate science is conveniently lumping heat and electromagnetic energy under the same umbrella. Using such a sleight of hand, alarmists can bypass the 2nd law by redefining it as a summation of energies that are unrelated in form. In the AGW theory, heat can be transferred both ways between a hotter and a colder body.
The 2nd law as stated by Clausius is clear on that. It states that heat can never be transferred cold to hot by its own means.
tim…any descending air does not affect the surface temperature or the heat extracted from it. We are talking about the natural dissipation of heat from the surface. Also, descending air molecules have nothing to do with the KE is ascending molecules.
“any descending air does not affect the surface temperature ”
Of COURSE it does! Warm air descending and blowing across the surface warms the ground. Cool air descending blowing across the surface cools the ground.
“We are talking about the natural dissipation of heat from the surface.”
Yes, that ‘natural dissipation’ involves convection. Convection requires ‘dissipation’ of energy to space to keep the cycle going.
Not some secret violation of conservation of energy!
There is so much we could discuss, but lets get to the guts of your post. “It becomes apparent that as heated air molecules rise into an ever decreasing pressure, they lose KE due to expansion and cool. That represents heat that does not have to be radiated to space yet nothing in the GHE or AGW theories account for that lost heat.”
The first sentence is good. But you draw wrong conclusions because you overlook some key ideas.
For every kg of air that rises and cools and loses KE, there must be one kg of air the sinks and warms and gains KE. This does NOT represent “dissipation” of energy within the atmosphere. Simply a reshuffling of energy.
Also, for convection to persist, there must be cooling at the top as well as heating at the bottom. If you put a 100C heat source at the bottom of an insulated container of 0 C air or water, you will get convection initially, but eventually the whole container will be 100C and there will be no more convection. There must be a heat sink removing energy to keep convection going.
So yes, heat DOES have to be radiated to space to keep the convection going. Thermal energy is not “lost” within the atmosphere, it is transferred away to space.
“For every kg of air that rises and cools and loses KE, there must be one kg of air the sinks and warms and gains KE. This does NOT represent dissipation of energy within the atmosphere. Simply a reshuffling of energy.”
Or what goes up, must go down.
Most the rising air in our world is from the tropical ocean engine, and most rising air is about water vapor. H20 gases has a very high velocity compare to other air molecules at the same temperature.
barry…here’ a link to a site that may interest you or it may not. I am not offering it as proof of anything just of interest in that it outlines nicely some of the work of Lanka. Of course, if your mind is made up it is likely a waste of time.
https://viroliegy.com/2022/08/16/the-path-paved-by-dr-lanka/
Gordon, I suggested you dwell in an echo-chamber. I think you meant to offer me a serious medical publication, but the first sentence on that page is this.
“Exposing the lies of Germ Theory and virology using their own sources.”
This blog-standard rhetoric is exactly what I suspected. This is where you dwell.
If you had linked something from here:
https://scholar.google.com/
You would have at least started with a credible source.
Instead you simply verified my apprehension of the places you read stuff.
Is this the same Stefan Lanka?
https://www.bbc.com/news/world-europe-31864218
barry…same Lanka but the article is old. Lanka appealed to a higher court and they overturned the lower court decision. It was further appealed by the plaintiff to a yet higher court and they upheld the middle court decision. Lanka won.
I offered this site because it covers all that and more. I was not expecting you to be convinced by the article but it appears you did not even bother to read it.
One of the reasons he won in the higher court is that he commissioned an independent lab to verify his claim that cells treated for use in labs would die from the treatment alone.
Whatever you think of Lanka, he really knows his stuff when it comes to viruses. It is worth reading him with an open mind and taking it from there if you want to disprove him. At least give him benefit of the doubt till you find solid science to negate him.
You won’t find that evidence in rags like the BBC. They specialized in propaganda during WW II when it was warranted and they have never looked back.
“same Lanka but the article is old. Lanka appealed to a higher court and they overturned the lower court decision. It was further appealed by the plaintiff to a yet higher court and they upheld the middle court decision. Lanka won.”
For some reason you neglected to mention that the court overturned the verdict because of a technicality in the challenge, not because Lanka’s views were verified. The challenge asked for one publication but the guy produced six.
And you know this. So why did you hide the truth? Because you are not interested in laying it all bare, you want to guide the narrative.
And this is what happens in your mind. It closes off to inconvenient parts of the narrative.
“One of the reasons he won in the higher court…”
Yes, you decline to be completely honest about the ruling. “One of the…”
“…is that he commissioned an independent lab to verify his claim that cells treated for use in labs would die from the treatment alone.”
This was not the court’s ruling. You are simply repeating what Lanka said about it, and never wondered if that was the truth. It is not.
Your skepticism mark: 1/10
This is a great link to the case, with plenty of English commentary, and many links to German documents and web pages and the court rulings, which you can use google translate of other software to read in English.
http://positivists.org/blog/archives/3881
This website is neutral on the subject. Just reports the facts.
Why is it that as soon as I investigate your claims it is revealed that you have not objectively investigated them?
When you so obviously regurgitate stuff unexamined, like Lanka’s assertion that the court ruled on the validity of his opinion, you confirm your confirmation bias.
To be clear, the court ruled that Barden had not met the criteria of the challenge. It did not rule that Lanka’s views were verified. That was Lanka’s own interpretation, which I discovered, unsurprisingly, that you had swallowed wholesale without a second’s doubt.
Unsurprising because courts cannot and do not determine the veracity of scientific opinion. They are not qualified. Courts only determine legal opinion.
Having read a bit more, Lanka apparently believes that a whole host of viruses don’t exist, and that measles symptoms are psychosomatic.
I was not able to find anything from him on how babies develop measles symptoms. Quite the psychosomatic feat.
barry…”For some reason you neglected to mention that the court overturned the verdict because of a technicality in the challenge, not because Lankas views were verified. The challenge asked for one publication but the guy produced six”.
***
You claim that I am avoiding the truth but your interpretation of the court ruling is far from the truth.
Lanka offered a 100,000 Euro prize for anyone who could prove the measles virus exists based on certain stipulations. The stipulations stated clearly that the proof must come from one paper and the virus size must be stated. The lower court ignored the stipulations and that’s why the higher court over-turned their verdict.
Will Happer once said that climate change is a scam. He is a very objective scientist most of the time, but he gets his message across to the public better by calling a spade a spade, It is a scam but you won’t reach alarmists calling it a scam.
I agree that the court decision is not proof that the measles virus does not exist but Lanka is trying to reach people to have them consider the facts. You don’t reach people by being reasonable, you need to make unreasonable statements to shake people out of their complacency. However, his point is valid, there are no papers that satisfy Koch’s postulate that prove the measles virus exists.
Binny van der Klown thinks he can cherry pick court statements, confusing between two higher court ruling from different courts. One higher court overruled the lower court and that was appealed by the plaintiff. The court handling the appeal dismissed it but Binny used that incorrectly to imply Lanka’s appeal was dismissed. It’s tough being a klown.
We must not overlook the facts. Lanka was challenged in court by Bardens, who completely ignored the stipulations of Lanka. He provided evidence from different papers which was successfully refuted by experts in the higher court decision. Furthermore, Bardens offered evidence of the measles virus size being 500 nm to 1000 nm which is way too big for a virus which runs around 100 nm.
The lower court messed up, pure and simple.
BTW, Barry your assessment of Lanka is based on cherry picking and skimming the article. If you had a true interest in science, you would read him carefully to see what he is actually saying.
The first thing you might get is that he is German and does not speak English very well. He tends to make statements about fraud which don’t translate very well to English. I wrote to him once trying to explain that fraud In English implies criminal intent. I don’t know if he read that but recently he has backed of on the claims of fraud.
No, Gordon, I correctly stated that Lanka won the appeal on technicalities. You failed to quote me in full.
But this is what you said to begin with:
“One of the reasons he won in the higher court is that he commissioned an independent lab to verify his claim that cells treated for use in labs would die from the treatment alone.”
That is patently untrue, and when you posted this remark you did not mention that the case was won on technicalities.
In this way you perverted the truth, giving the reader cause to believe that Lanka had won due to the merits of his claims on measles.
So with your mind: it bends information to your biases.
barry
I read Robertson’s mix of dumb & brazen:
” Lanka appealed to a higher court and they overturned the lower court decision. It was further appealed by the plaintiff to a yet higher court and they upheld the middle court decision. Lanka won. ”
This is of course wrong because the middle court (the ‘Oberlandesgericht Stuttgart clearly stated in its ruling that no appeal would be allowed.
David Bardens attempted to overturn this appeal ban imposed in Stuttgart by filing a lawsuit before the Federal Court of Justice in Karlsruhe.
The Federal Court of Justice rejected Bardens’ application for an appeal ban:
https://web.archive.org/web/20200511152301/https://impfen-nein-danke.de/u/BGH+I_ZR__62-16.pdf
He did not even deal with the ‘Lanka vs. Bardens’ case.
*
Today evening, I lack the time to produce an umpteenth comment about Robertson’s ignorance of the real facts, of which court ruled what, etc etc.
You could start reading a lot…
1. https://www.drroyspencer.com/2024/09/uah-global-temperature-update-for-august-2024-0-88-deg-c/#comment-1687194
and Robertson’s absolutely incredible reply just below.
*
2. https://www.drroyspencer.com/2024/09/uah-global-temperature-update-for-august-2024-0-88-deg-c/#comment-1687560
*
3. https://www.drroyspencer.com/2024/09/david-appell-awaiting-the-death-of-climate-skeptics/#comment-1689322
Should read
The Federal Court of Justice rejected Bardens’ application for an appeal ban:
https://impfen-nein-danke.de/u/BGH+I_ZR__62-16.pdf
(no need to access the Web Archive).
*
Stuttgart’s appeal ban was clearly visible in their ruling:
https://openjur.de/u/892340.html
Paragraph 136 (ruling’s end):
” 3. Die Revision ist nicht zuzulassen, da die Voraussetzungen des § 543 Abs. 2 ZPO nicht vorliegen. ”
i.e.
” The appeal is not admissible because the requirements of Section 2 in Paragraph 543 of the Code of Civil Procedure are not met. “
Yes, Bin, I did my own investigating via this website:
http://positivists.org/blog/archives/3881
I read the middle court’s overturn ruling, which included this:
“Soweit der Beklagte rügt, dass das Gericht die in englischer Sprache verfassten Veröffentlichungen nicht selbst gelesen und geprüft habe, war dies zum einen nicht nötig, da es sich um medizinische Fachartikel handelt, die ohne Übersetzung sowohl in sprachlicher Hinsicht als auch in ihrer wissenschaftlichen Einordnung und Bewertung ohnehin nicht vom Gericht beurteilt werden können.”
Which ChatGPT translated thus:
“To the extent that the defendant complains that the court did not read and examine the publications written in English itself, this was, on the one hand, unnecessary, as these are medical articles that cannot be judged by the court without translation both linguistically and in terms of their scientific classification and evaluation.”
barry…you are so stubborn. The link I provided offers an objective analysis in Ebglish from which you could have verified the facts.
No, Gordon, it is not an objective analysis.
You agreed that the courts cannot determine the veracity of science. But this is what you find at your ‘objective’ link.
“We had an epic head-to-head clash between the medical establishment and an ex-virologist taking place in a court of law over the legitimacy of the evidence for the measles ‘virus.’
This is a wrong, and you should know that. Your website goes on:
“It was determined through this trial that the foundational paper claiming the existence and isolation of the measles virus, the 1954 paper by John Franklin Enders, was unworthy by itself for proving the existence of the ‘virus.’ As all other papers and virology itself owe their evidence to the cell culture methods developed by Enders in that paper, it is an astonishingly damning admission that the evidence presented by virology is invalid.”
No, the court determined only that the criteria for the challenge was not met by these papers. It did NOT verify or debunk any science.
As I posted just above, your mind bends information to your biases, and this excerpt does exactly the kind of thing your mind does.
You know what else is telling? You could have congratulated me for doing independent research and reading the court papers myself to get to the truth, rather than just relying on the link you posted.
But instead you dismissed that effort with a complaint that I didn’t just take your word for it via the link.
This, too, indicates a dearth of real skepticism on your part, that should welcome independent review rather than a passive acceptance of your sources.
Forget November. SpaceX Starship might launch in October!
{next Sunday}
https://www.youtube.com/watch?v=lrk2iIFdonQ
She in Italy and might miss the launch.
I would guess there is about 50% chance of a tower attempt of catching it. And they might try, but then later abort it- say 20% chance of that. So about 20 to 30% that it will be somewhat successful at the tower catching the first stage so that can be rapidly turn around to be launched again. Or less than 5% that this attempt, delays Starships significantly, from getting to the point of not of being “on time” with it’s lunar program. Though there other factors which a greater chance of delaying the lunar program which have nothing to with what SpaceX does or doesn’t do.
And successful catch, could lend to less delay or shorten the time of planned first lunar crew landing on the lunar south pole.
jmurphy…”Italy has the highest number of Chinese citizens in Europe…”
***
You are comparing apples to oranges. There are 284,495 Chinese in Italy with a population of 59,342,867. That makes the Chinese contingent 0.47% of the Italian population. Here in the Vancouver area (Greater Vancouver), there are 512,260 Chinese out of a population base of 2,683,000, making the Chinese contingent about 20%.
The key parameter is how many Chinese were entering/leaving Italy and Vancouver at the time.
There are regular Jumbo jet flights into and out of China entering/leaving Vancouver airport every day. That was the case in January 2000 when covid was first announced. I doubt if there are conditions in Italy that even come close, yet they announced a desperate situate when we were not evening noticing it here in Vancouver.
Based on the situation in Italy, the world panicked, based on one study by an epidemiologist in the UK who used a computer model. He had been offering predictions going back til 2000 and he was always way off base. yer, for some reason, they took him seriously this time and as usual, he was wrong.
No attempts were made to prevent Chinese nationals from entering Vancouver yet deaths from covid here were around 0.01% at the worst of times. In Italy, there was such a hysterical panic they shut the country down.
Flu epidemics, for whatever reason, have been rampant in Italy long before covid. Since the covid tests are fraudulent, and don’t test for a virus, I am concluding that the issue in Italy was a more severe form of the flu.
Why No Missions to Mars’ Poles? What Does X-37B Really Do? Why Continue With SLS? | Q&A 269
https://www.youtube.com/watch?v=ZUw7HvtRZfc
The poles of Moon has craters which are permanent darkness.
Does Mars have craters in permanent darkness.
Of course, any cave is in permanent darkness.
With Hellas basin, the side closest to Southern pole, would have more sunlight and the side closest to equator would have a lot less sunlight
barry…”Stefan Lanka, Luc Montagnier, and Peter Duesberg.
And what are the names of the experts in HIV whose research is in line with the mainstream view, that you have studied?
***
Robert Gallo was the US expert in competition with Luc Montagnier. He was sanctioned for stealing data from Montagnier.
Gallo is a loose cannon who dumped Duesberg as a friend when Duesberg claimed that HIV is a harmless passenger virus. Some friend!!! Gallo provided no proof that HIV can cause AIDS or that it is in any way harmful to a healthy immune system. Duesberg, on the other hand, backed his claim with voluminous information to support his claim.
https://www.virusmyth.com/aids/whistleblowers.htm
Anthony Fauci, in conjunction with David Ho, developed the RNA-PCR test for HIV. It needs to be clearly understood that the RNA theory was developed by Montagnier and has never been proved. In fact, Montagnier admitted that he inferred HIV and at no time did her ever see it on an EM. The same inference is used today for covid, which has never been seen on an EM either. Any photos you see on Google that depict covid are inferences of a virus with no proof that they are a virus.
Fauci was challenged by the inventor of PCR, Kary Mullis, who claimed it could not be used diagnostically as he was using it. Mullis offered that a virus that could not be seen on an EM would not suddenly appear by amplifying associated RNA converted to DNA for PCR amplification.
The RNA-PCR test for either HIV or covid does not produce a virus. That is critically important, even when RNA is amplified using PCR, no virus appears. Both tests are based on the number of duplication cycles for DNA, which is amplified by duplicating strands successively. That is not the same as amplifying a virus using an electron microscope or amplifying anything using an optical microscope. As Mullis pointed out, when you amplify material suspected of being a virus, and you cannot see a virus in the original, you won’t see it in amplified DNA either since the entire mass is amplified equally.
Let’s face it, if a virus is there at 100 nm, it should be seen on an EM.
That makes the tests highly controversial as to what they are detecting. Using either test, it is not unusual for a person to test positive one day and negative the next. Furthermore, if people receive either test because they feel ill, the illness itself could be producing the RNA detected hence the people may be suffering from something unrelated to a virus. With the current RNA-PCR test there could be countless false positives due to error and due to something unrelated to a virus being tested.
In fact, when the first claim was made for SARS, by a Scottish researcher, her paper was rejected at review. The reason given was that the photos supplied could be anything related to viral particles and no proof was presented that they were a virus. Seems to me the same applies to EM micrographs offered for HIV or SARS. Since her work was done, viral identification has been replace with an inferential method with no proof it works.
Modern covid mRNA vaccines, for want of a better word to describe this gene manipulation, are based on ‘spike’ proteins. That’s a reference to the tiny spikes alleged to protrude from a virus and with which it allegedly sticks to a cell. I say allegedly because it seems preposterous to talk about spikes when you can’t even see the virus.
Spike proteins are fabricated in a computer model, not by researchers actually seeing them at work. In fact, the entire RNA genome for HIV or covid is fabricated in a model, not by actually finding it and seeing it in a real sample.
” It needs to be clearly understood that the RNA theory was developed by Montagnier and has never been proved. ”
Just more of the same debunked BS from Gordon.
Yes, exactly.
https://en.wikipedia.org/wiki/History_of_RNA_biology
Gordon aligns with one expert who disagrees with thousands and rejects the rest. As if he is qualified to judge.
barry is saying that majority rules in science. I just sent him a reply describing Australian researcher, Barry, Marshall who claimed stomach ulcers are caused by the bacteria H. Pylori and the vast majority disagreed. The journal to whom he submitted his findings rejected his paper.
Thankfully, common sense prevailed and he eventually got a Nobel for his discovery.
I learned science the old way where the scientific method prevails and scientists were not condemned for offering an alternative opinion. The science I learned was not based on consensus, where the majority is right based on opinion. It was based on what makes sense, a sense that can be confirmed by experiment.
Virology is a dark science and Lanka has revealed the dark side to the world. Typically, he is written off as a crank even though no one can prove him wrong. Even when he wins a court case to uphold his claim that the measles virus has never been physically isolated, rather than acknowledge his success, doubters like Binny and Barry cherry pick the court case trying to make him wrong.
I didn’t condemn Montagnier, you fantasist.
I condemned you for having the hubris to believe you can judge the matter.
There is a very short list of researchers who had to fight to push better ideas against a hardened consensus view. Galileo might be the godfather of these.
There is a very long list of researchers whose maverick ideas simply weren’t up to sniff.
I don’t know why you align with the maverick views when you are in no position to judge. Typical of you to imagine you have expertise in molecular biology, for crying out loud.
There is a well-known condition that the ignorant tend to suffer from – the Dunning-Kruger effect, where the less they know, the surer they are that their ideas are correct.
Genuine skeptics are less likely to suffer from it.
“The DunningKruger effect is a cognitive bias in which people with limited competence in a particular domain overestimate their abilities.”
https://en.wikipedia.org/wiki/Dunning%E2%80%93Kruger_effect
nate…” It needs to be clearly understood that the RNA theory was developed by Montagnier and has never been proved.
Just more of the same debunked BS from Gordon.
***
Nice word salad Nate but no proof to back your claim.
barry…”Covid is not a disease
COVID19 is a disease.
SARS CoV2 is the virus.
***
If you want to regard the word covid in the same light as the acronym AIDS, you may have a point. However, AIDS is a reference to 30 different diseases, many of which are unrelated to a virus, therefore you have to be careful when using names.
The Mayo clinic distinguishes infection from disease…
“Infection, often the first step in getting a disease, occurs when bacteria, viruses or other microbes that cause disease enter the body and begin to multiply. Disease happens when the infection damages cells in the body. Then symptoms of an illness appear”.
Covid is a misnomer since it is not a disease per se. The prevalent disease is pneumonia, which is the killer. SARS itself is not a killer per se, since most people infected do not die, nor do most suffer to a great extent. The human immune system handles it well in 99+% of cases. Most people who suffer and die have underlying conditions which prevent the immune system dealing with the subsequent pneumonia or its precursor. Ergo, pneumonia is a disease of the lungs.
The WHO typically, in an irresponsible manner, frightened everyone by portraying covid as a killer illness while offering the impression that everyone was at risk of dying, even though at any one time, in any country, no more than a tiny fraction of 1% were suffering. They have a history of that. They once declared that AIDS would spread from the homosexual community to the heterosexuals community, and when that failed to happen in Europe or North America, they used Africa as an example of AIDS affecting most heterosexuals and homosexuals in equal number.
In Sub-Saharan Africa, where the claim was made, Africans were dying of a disease called Slim Disease or wasting syndrome. It was known long before AIDS that wasting syndrome was caused by malnutrition, contaminated drinking water, and infections like malaria, yet the liars at the WHO claimed wasting syndrome as proof of AIDS. They blamed poor, starving Africans as having AIDS through the sexual transmission of HIV.
You accept the Mayo clinic as a good source? Excellent.
“COVID-19, also called coronavirus disease 2019, is an illness caused by a virus.”
https://www.mayoclinic.org/diseases-conditions/coronavirus/symptoms-causes/syc-20479963
The terminology diversion is pointless hair-splitting.
For all your downplaying of COVID, the evidence shows that it was the third biggest killer of people in 2020 and 2021, and continued to kill people afterwards.
0.3% fatality doesn’t seem like a lot until you consider that for a population the size of the US that is a million people.
Stark warnings and strong measures were taken early on, because we didn’t know how bad it might be. I was inspired that so many governments around the world risked economic downturns and political retribution in order to save lives. In my country we had rolling policies that responded to incidences, lifting off and replacing safeguards in line with monitored infection waves.
Late 2021 all restrictions were lifted as the population was largely vaccinated or had been infected. At that point, fatalities soared, and the excess deaths we saw in other countries finally happened to us. The proof of the effectiveness of those measures was laid bare as the death count rose with no restrictions.
But our excess deaths were not huge spikes like in other countries who had early waves of infection. We managed to limit the fatalities that other countries had.
The global response should give people heart. But curmudgeons and the entitled can’t see it.
FYI, Australia’s COVID statistics.
https://www.worldometers.info/coronavirus/country/australia/
Our strict policies kept deaths to a minimum through 2020 and 2021, as you can see. It was only after we extinguished those policies that deaths came in strong.
Even so, the US suffered 0.3% mortality from COVID. Australia’s portion was 0.2%.
Had the US adopted our practises, 300,000 lives might have been saved or extended.
I’ll leave it to you to weigh the value of that.
As for AIDS, that took the lives of any healthy young men and women in the 1980s and 1990s. They were brothers, uncles, sons. I worked as a theatre tech in the 80s and 90s, which has a higher percentage of gay employees than other industries. I lost friends. The gay community does not forget what happened in the 80s and early 90s.
I do believe you are downplaying AIDS because it did not kill heterosexual people in any great number. What a repulsive attitude. Never mind that this is incorrect, the sentiment is despicable.
barry…why would anyone substitute a name like covid19 for a well known disease like pneumonia? People were suffering from severe lung issues otherwise known as pneumonia. The same pneumonia kills thousands of people each year from the ordinary flu.
There was absolutely no excuse for the heavy-handed approach over a claimed viral infection that affected a very small number of people in each country. Government officials panicked, and became hysterical, just like they are doing over climate change.
There is one reason comes to mind, the WHO and other agencies are trying to scare people into line, for reasons unknown. There are ijits out there who revel in that kind of misinformation, like Australian governments who get their jollies over scaring people witless about climate change.
As far as not knowing how bad it would be, the only comparison they had for the past 100 years was the Spanish flu and that happened in association with a World War. Even it cleared up on its own and it should be noted that people in that era would have had comprised immune systems related to deprivation and stress in the war, especially the soldiers. The flu pandemic happened as soldiers came back from the trenches, bring all forms of disease with them.
Comparing covid to the Spanish flu was just plain silly.
So, the officials panicked based on a computer model projection by a British epidemiologist. No one considered that the same guy with his model projections had been dead wrong with his predictions since 2000, and he turned out to be wrong about covid as well.
Ergo, there was no scientific basis for thinking covid would get out of hand.
With regard to AIDS, it was blamed on a virus and it turned out that was wrong. Montagnier, who won the Nobel for inferring a virus, later claimed that HIV is harmless to a healthy immune system. He added that AIDS is caused by oxidative stress related to lifestyle.
The message is clear, as Duesberg had claimed, homosexual men and IV drug users were dying from their lifestyles. It was the drugs they were taking to enhance their perversions where multiple partners engaged in sexual activity in the steam baths of New York and San Francisco.
Kary Mullis nailed it, the steam in the baths was carrying bacteria from their anal activities into their lungs. Another skeptic, John Lauritsen pointed out that the amyl nitrate they were sniffing to relax certain muscles was contributing to lung cancer and pneumonia, two of the major AIDS opportunistic infections. He was a gay man himself and due to his personal concerns for his fellow gays, he took that message to influential gays in San Francisco. They told him to butt out and mind his own business.
Gordon,
“why would anyone substitute a name like covid19 for a well known disease like pneumonia?”
I just linked you the Mayo clinic calling it a disease. Take it up with them. This nit-picking is futile.
“There was absolutely no excuse for the heavy-handed approach over a claimed viral infection that affected a very small number of people in each country.”
1 million dead Americans is insignificant to you. Gotcha.
And if you’re suddenly going to dispute that figure after all I’ve said – then read all I’ve said first, because it is extremely well verified.
“their perversions”
I knew people that died from AIDS. My friends. Nice people. You are a sick, bigoted, small person.
Global Sep2024
https://climatedatablog.wordpress.com/2024/10/10/uah-mean-and-median-global-for-sep-2024/
Tropics Sep 2024
https://climatedatablog.wordpress.com/wp-content/uploads/2024/10/uah-tropics.jpeg
static float[] RunningMean(float[] f, int count)
{
float[] result = new float[f.Length – count];
for (int i = 0; i < f.Length – count; i++)
{
result[i] = Mean(f, i, count);
}
return result;
}
static float[] RunningMedian(float[] f, int count)
{
float[] result = new float[f.Length – count];
for (int i = 0; i < f.Length – count; i++)
{
result[i] = Median(f, i, count);
}
return result;
}
static float Mean(float[] f, int pos, int count)
{
float result = 0.0f;
for (int i = 0; i < count; i++)
result += f[pos + i];
result /= count;
return result;
}
static float Median(float[] f, int pos, int count)
{
List temp = new List();
float result = 0.0f;
for (int i = 0; i < count; i++)
temp.Add(f[pos + i]);
temp.Sort();
// Calculate the median for an even List of numbers
if (count % 2 == 0)
{
result = (temp[count / 2] + temp[count / 2 + 1]) / 2;
}
else // Calculate the median for an odd List of numbers
{
result = temp[count / 2];
}
return result;
}
}
}
Comparison of cascaded triple means and medians with UAH 6.0 LT as source, using Vaughan Pratt’s triple cascade coefficients (1.0, 1.2067, 1.5478)
Dec 1978 – Sep 2024
1. 12 / 10 / 8 month cascades
https://drive.google.com/file/d/1umE0x_ObQqkafV33CqwRkzXHwMVQWJEJ/view
2. 60 / 50 / 39 month cascades
https://drive.google.com/file/d/1TJt1g7mgvXgvM1hBwCncwknUIC1vFQoy/view
Does your data include 7/5/4 as your previous one does?
Blindsley H00d
” Does your data include 7/5/4 as your previous one does? ”
What are you inventing, opinionated Brit boy?
No idea where you got that 7/5/4 dumb stuff from.
All I know about you is that like Robertson and his gang, you are ready to spread anything helping you to discredit instead of contradicting.
Robertson gang leader here. Seems that everyone who finds you wrong is part of a conspiracy theory. Ever occur to you that you are wrong most of the time?
Look at your previous spreadsheet.
No idea which ‘previous spreadsheet’ you mean, Blindsley H00d.
Show it us!
*
You code doesn’t interest anybody.
What matters is THIS: while your cascaded MEANS (12 months AND 60 months) nicely match mines, your cascaded MEDIAN does NOT AT ALL.
*
What about finally posting a chart comparing your cascaded 60 month MEAN to your cascaded 60 month MEDIAN?
Show it us!
You, Robertson, never found me wrong. Neither did Blindsley H00d (RLH for you), but you would never be able to disprove this.
*
On the contrary: I proved you wrong all the time but you persist in unduly denying all my contradictions.
And above all: Blindsley H00d (RLH for you) always has clearly, unequivocally contradicted you about
– the lunar spin
– Newton’s agreement to it
– viruses
and if I well remember
– GPS
– time…
And probably about other things as well; I never saw him contradicting your dumb ‘1500 NOAA stations’ nonsense until now, however.
This might happen in the future, when he understands what I found out about the prehistoric GHCN V1 and its 6039 temperature stations.
Blinny can’t find his previous spreadsheet.
It’s on your own google drive.
Blindsley H00d
”
RLH on October 11, 2024 at 1:38 PM
Blinny cant find his previous spreadsheet.
RLH on October 11, 2024 at 1:40 PM
Its on your own google drive. ”
*
This perfectly shows that you YOURSELF don’t seem to know where it is.
Your ‘previous spreadsheet’ is amusing. You mostly post at best two per month.
As my Google Drive area contains hundreds of charts for this year alone, I’ll wait for you to show. Why the hell should I help you?
If you can’t show us your ‘7/5/4’ nonsense, then… it is very probable that you lied. Not for the first time at all!
Blindsley H00d
The same data in Libre Office Calc I used to show
https://drive.google.com/file/d/1umE0x_ObQqkafV33CqwRkzXHwMVQWJEJ/view
was entered into Google Docs’ spreadsheet tool:
https://drive.google.com/file/d/1RjqLD4OGlUU-X2EZNbh9ObRqTytScGXK/view
*
Do you see the similarity?
*
And now compare the two graphs above to yours:
https://climatedatablog.wordpress.com/2024/10/10/uah-mean-and-median-global-for-sep-2024/
*
Do you see the difference?
*
I hope you won’t be brazen enough to claim your code would be right and both Libre Office Calc and Google Docs would work wrong.
So fault find the code.
As you cant count, why should I trust you on anything else?
” As you cant count, why should I trust you on anything else? ”
Thank you Blindsley H00d for once again confirming your immature mentality by posting such pathetic cowardly crap.
Show us where you see I can’t count, you coward.
Blinny: https://www.drroyspencer.com/2024/10/uah-global-temperature-update-for-september-2024-0-96-deg-c/#comment-1691785
” So fault find the code. ”
Why, Blindsley H00d? That’s YOUR job.
Because YOU are the one who still has to explain how it is that both your cascaded 12-month AVERAGE and your cascaded 60-month AVERAGE look pretty good like mine, but your cascaded 12-month MEDIAN does not at all.
*
Blindsley H00d’s 12-month / 60-month means and 12-month median
https://climatedatablog.wordpress.com/wp-content/uploads/2024/10/uah-global.jpeg?w=1024
Bindidon’s 12-month mean and median
https://drive.google.com/file/d/1umE0x_ObQqkafV33CqwRkzXHwMVQWJEJ/view
Bindidon’s 60-month mean and median
https://drive.google.com/file/d/1TJt1g7mgvXgvM1hBwCncwknUIC1vFQoy/view
You have been stubbornly dodging around this fact for months.
Stop stalking, start working.
Nate said:
Wishful thinking. He has shown repeatedly that he erroneously thinks that a tariff is a tax on other countries, while in reality it is a tax on consumers.
To some extent it is. But its also a tax on slave labor and environmental pollution but those abusing workers and the world.
Thats why the tariffs arent applied broadly but in a targeted manner. they slow the import of goods made in foreign nations that dont recognize workers rights and/or harming the world in unsustainable ways.
Putting teeth into protections of the environment is something environmentalists have yearned for decades, was the center of attention in the Battle of Seattle in December 1999, and finally they have an environmentally-minded progressive President which we have lacked since Teddy Roosevelt.
The other participants in the Battle of Seattle were the labor unions that were protesting wide open free trade policies of the WTO because of slaves and child labor being used to undermine US industry who are subject to strong labor protections in the US.
Trump has run into direct conflict with huge international corporations on this. These corporations have been using this loophole for decades to produce cheaper goods that US industry cant compete with undermining both the middle class and the environment.
They have just gone out and cut sweet deals with despots around the world and then lobby for kickbacks to be paid by American taxpayers.
Domestic corporations have seen their marketshare destroyed by this. And at a huge cost of US jobs. Trump is the first President to stand up against this which has been a huge source of dark campaign money for decades.
barry…”You agreed that the courts cannot determine the veracity of science. But this is what you find at your objective link”.
***
That is correct but in your zeal to discredit Lanka you ignore the purpose of the case.
Lanka offered 100,000 Euros to anyone who can prove the measles virus has been physically isolated based on certain stipulations. A snotty-nosed recent graduate thought he could claim the money by ignoring the stipulations. The ignorant lower court even backed his claim but the superior court rejected the lower court decision. That’s why you have higher courts, to correct poor decisions by incompetent judges in lower courts.
The higher court offered no proof that what Lanka claims is true, but it does uphold Lanka’s claim that the measles virus has not been properly isolated. I am sure there are many scientists who could use the 100,000 Euros but none of them can prove it using one paper that states the size of the virus claimed. Lanka is only invoking Koch’s Postulate, a gold standard that has been conveniently swept under the rug by modern virology.
In the higher court hearing there were top experts in the field called by both sides. They all agreed in the end that insufficient proof had been provided by the plaintiff to claim the prize.
To date, no one has been able to prove Lanka wrong, that the measles virus has not been properly isolated. He has taken that even further, claiming no virus has been physically isolated, simply because no controls were in place, as required. You simply cannot claim a virus killed healthy cells when you cannot prove, with a control, that the cells would not have died on their own due to preparation techniques.
This is nothing new. Retroviral science was developed in the early 1970s and some scientists were adamant that no such virus exists. When Robert Gallo tried to submit a paper base on retroviruses in the 1970s, it was rejected as nonsense. Scientists have tried to prove for years that cancer is caused by a retrovirus and to date there is no proof.
Duesberg was working directly in that field with retrovirus research and he discovered the first cancer gene. Yet, when he claimed HIV is harmless, his career was ruined.
Retroviral theory got a huge boost when Luc Montagnier claimed AIDS is caused by such a virus. He developed the theory only because he could not see HIV on an electron microscope. He has admitted that he inferred HIV based on retroviral theory despite the fact that an early pioneer in the field had warned against claiming a virus based on RNA. The pioneer pointed out that the same RNA is found commonly in the body.
Since the early 1980s, the gold standard by which a virus is physically isolated using an electron microscope has been discarded and replaced by this dark science. That’s why the world was held to ransom by covid. The only information was made available by Wuhan scientists who admitted they had not isolated covid physically but by inference only.
That’s not to say covid does not exist, the tragedy is that the test for it and the vaccine are based only on inference that an RNA molecule is responsible. The test does not test for a virus nor does the vaccine attack a virus. Both are aimed at RNA from unknown origins, an RNA molecule that has never been directly correlated to a virus. Therefore, both the test and vaccine are based on unproved science.
“The higher court offered no proof that what Lanka claims is true, but it does uphold Lankas claim that the measles virus has not been properly isolated.”
The court did not assess the broader literature, only these 6 papers, so it could not possibly have verified that the measles virus hasn’t been isolated.
Nor did the court make such a finding.
It only found that the 6 papers presented didn’t meet the criteria. That’s it.
It did not determine that the measles virus has not been isolated. It did not determine whether Lanka’s criteria was medically valid in the first place. That was not the purpose of the case.
Yet, Lanka, your “objective” website and you “interpret” this case as proving measles has never been isolated.
Your “objective” website claimed that one of the 6 papers was the progenitor of all others, and that every other paper since has proceeded with the original’s assumptions.
How on Earth can you take stuff like that seriously, let alone claim that this is “objective” analysis?
These are rookie errors of analysis.
You can go to google scholar yourself and see that laboratory isolation of the measles virus has continued into the 2020s.
Or you could read the expert at the second trial saying that the 6 papers in sum demonstrate the existence of the measles virus.
barry…pay attention. The court case is about a noob trying to claim the prize from Lanka by disregarding Lanka’s rules. The higher court agreed that the rules were broken.
The basis of Lanka’s prize is that the measles virus has not been properly isolated. Thus far, no one has proved him wrong.
“The higher court agreed that the rules were broken.”
That much you got right.
But you went further than that, and this is why you failed.
Disinformation about Milton is turning homicidal:
https://www.theguardian.com/us-news/2024/oct/11/meteorologists-death-threats-hurricane-conspiracies-misinformation
https://homeland.house.gov/2024/10/04/chairman-green-on-secretary-mayorkas-claims-about-fema-funds-biden-harris-administrations-priorities-are-completely-backwards/
https://www.fema.gov/grants/shelter-services-program
https://apnews.com/article/hurricane-helene-congress-fema-funding-5be4f18e00ce2b509d6830410cf2c1cb
elliot is still quoting his favorite misinformation and alarm source, The Guardian. Ergo, Elliott is not interested in science, only in alarmist propaganda.
why do we have different numbers from copernicus and UAH?
i mean for september
Luke
” … why do we have different numbers from copernicus and UAH? ”
Firstly, while Copernicus is, like BEST, GISS, Had~CRUT, NOAA, JMA etc, a surface temperature provider:
https://climate.copernicus.eu/climate-indicators/temperature
UAH watches the temperatures of four superposed atmospheric layers.
*
The lowest of them is the lower troposphere where UAH measures on average -9 C, i.e. about 24 C less than the surface average.
This temperature was once measured on average at about 4 km altitude.
Since 2015, UAH’s lower troposphere temperatures are instead computed out of a combination of the measurements of the three layers above (mid troposphere, tropopause, lower stratosphere):
https://www.drroyspencer.com/2015/04/version-6-0-of-the-uah-temperature-dataset-released-new-lt-trend-0-11-cdecade/
thank you for the great answer
You’re welcome.
More details below due to Robertson’s completely stupyd reply
” … and he thinks UAH uses an equation to get surface temps. ”
He didn’t never, never understand what Spencer, Christy and Braswell wrote in 2015.
Most of the time he does not understand what scientists write: simply because he never reads their articles, but only skims them to check for the presence of things he does not like and/or the absence of things he wants to see.
*
When you move into the Roy Spencer link I posted upthread, you see under ‘2.1 LT computation‘:
” The LT computation is a linear combination of MSU 2,3,4 or AMSU 5,7,9 (aka MT,TP, LS):
LT = 1.538*MT -0.548*TP +0.01*LS ”
MT: mid troposphere
TP: tropopause
LS: lower stratosphere
*
As Roy Spencer explained many times: direct LT sounding was no longer possible because while the global averages still worked well, too many errors appeared at grid cell level.
Thus, the sounding was replaced by the weighting of data sounded for the higher atmospheric layers abover LT.
*
This is what you obtain when mixing UAH’s global monthly data for MT, TP and LS according to the weighting function above, and comparing it to the monthly LT data:
https://drive.google.com/file/d/1tJDjs0VwqeusqbBtD3eO3eyxuepoPRR1/view
The match is unequivocal.
And if you know how to generate time series out of UAH’s 2.5 degree grid data, the match becomes even more amazing.
Here is an old comparison of LT data (till end of 2022) for the one grid cell encompassing the coordinates of the University of Alabama in Huntsville to a mix of the same grid cell locations in MT, TP and LS:
https://drive.google.com/file/d/18bSH3pQeQeOkIb09XzSLgDHWPIAn_NVJ/view
*
If I wouldn’t have dashed the red lines in the two graphs, you would hardly see much of the blue ones.
*
Thus, conclusion: never believe Robertson’s lies.
luke…please avoid the nonsense Binny projects in his reply. He knows nothing about satellite AMSu telemetry and he thinks UAH uses an equation to get surface temps. When I asked his where they get the data for the equation he goes ominously silent. He doesn’t know but he is quite willing to opine on the matter as an alarmist.
Channel 5 does scan oxygen molecules that heave peak emissions at 4 km, about halfway up Mt. Everest, however, the weighting curve correlates all frequencies from all altitudes below 4 km. Emissions closer to the surface are cutoff due to natural microwave radiation from the surface, but channel 5 could easily receive emissions near the surface.
The problem with the old system that used only channel 5 was it’s look-ahead system. The scanners scanned well ahead of the sats and with different lengths of scanning different weighting functions were required for each scan. The newer sysyem incorporates scans from channels centred at higher altitudes and eliminates the need for many weighting functions.
now im a bit confused. i thought i understood that a different way of calculating the global average was the reason for different numbers . If you all can excuse my ignorance , i am no scientist and i know im out of my depth on this. i too skim the science and look for data bites that i like. In the past however i have not seen differences between the numbers from NOAH , ,Copernicus and the UAH . This year it has happened twice and Noah has still not published their data from september because of Helene. It seems that the UAH has the highest numbers yet produced
So Blinny, do you want me to show the spreadsheet you cannot find with 7/5/4 central points on it (of 12/10/8 months) ? You know, the one you cant find.
Try https://drive.google.com/file/d/1kA1AusJboS2RB1yAt97W9MYgsxTSuFEV/view
Blindlsey H00d
” Does your data include 7/5/4 as your previous one does? ”
” You know, the one you cant find. ”
As you can see below, there is no 7/5/4 anywhere. It exists in your mind only, just like ‘orbiting without spin’, ‘time does not exist’ etc etc. And your question is therefore clueless.
*
It seems that you actually did not understand what I replied to Antonin Qwerty’s questions he posted on August 28, 2024 at 3:00 PM.
I recall having explained the 6/5/4 vs. 5/4/3 numbers a longer while ago. Let’s do it again.
*
According to many people who understand how running means work,
– odd-sized running mean windows (13, 39,…) are symmetric; the running average value at cell i is built out of the cell sequence:
i – (n – 1)/2 till i + (n – 1)/2.
– even-sized running mean windows (12, 60, …) are asymmetric; the running average value at cell i is built out of the cell sequence:
i – n/2 till i + n/2 – 1.
The starting centers are in the 12/10/8 case at positions: 7/12/16.
*
{ Some prefer to work with
i – n/2 -1 till i + n/2
That’s a matter of taste, not of ideology, and doesn’t change much. }
*
In case of centred cascaded triple 60 month running averages (also based on V. Pratt’s coefficients), we have 30/25/19 before and 29/24/19 for the front respectively rear inactive window halves without data.
In case of active windows ending with the source, you then write 60/50/39 and 0/0/0: the full inactive window is in the front of the running averages, like e.g. here:
https://drive.google.com/file/d/1vnm9QsWk_yGVTF8PPDrtUwYWPe3-KM0c/view
*
As said:
– Excel, Libre/Open Office Calc and Google Docs are based on at least 40 years old software techniques which I trust at least 1,000 times more than a private peace software you actually never even have feeled any need to externally cross-check;
– the three successive running average columns in my examples (the ones based on the ‘average’ function, the other on the ‘median’ function) have absolutely identical arguments in each cell:
*
Stop smalltalking and stalking, Blindsley H00d, and start… cross-checking.
“The starting centers are in the 12/10/8 case at positions: 7/12/16.”
Wrong they are at 6/11/15.
Blinny can’t read C#.
{ Some prefer to work with
i n/2 -1 till i + n/2
Thats a matter of taste, not of ideology, and doesnt change much. }
Stop smalltalking and stalking, Blindsley H00d, and start cross-checking.
rlh…”Blinny cant read C#”
***
I was wondering what that was. I could see the brackets used in C and C++ {…} to enclose a statement, but I thought the rest might be from another language.
Blindsley H00d wrote:
” Blinny cant read C#. ”
*
As always, he can’t refrain from making his usual sissyish taunts.
Anyone can imagine how the stupid, narrow-minded, always happy to discredit, 360-degree denier Robertson would treat this poor Blindsley H00d if he were a 100% alarmist.
*
I can very well read not only C# but moreover, the languages I used during my educational and professional activities till 2014 (Algol60, Simula67, C and C++, SQL, JavaScript, HTML…). Though now good over 75 I still think of learning Python.
**
Anyone who has been involved in larger software projects involving up to six developers (on average 20 person-years) will immediately recognize that Blindsley H00d’s tiny piece of C# code reveals a completely undisciplined, occasional programmer who ignores even the simplest rules required when developing software.
If Robertson were even able to write the simplest, most trivial program, he would do it in more or less the same way as Blindsley H00d:
– not a single line of documentation, which even a programmer who is not bound by the discipline that is essential in larger projects cannot do without;
– numbers everywhere (12, 10, 8; 60, 50, 39; 60, 50, 32 ???) where names should actually be used that abstract cleanly from these numbers;
– far worse: duplication of in-line code statements everywhere instead of formulating carefully named procedures and their calls with appropriate arguments;
– no consistent object-oriented programming based on objects and methods, as is clearly supported by C# and is even possible in good old ANSI-C, which is still used by hundreds of thousands of developers today.
In the company that employed me for many decades, Blindsley H00d would not have come anywhere close to passing the first 3-month probationary period.
*
Pseudo-engineer Robertson would of course not even have made it through the interview: he would have been thrown out of the director’s office after less than five minutes.
Blindsley H00d wrote above, as a reply to:
” The starting centers are in the 12/10/8 case at positions: 7/12/16. ”
the following:
” Wrong they are at 6/11/15. ”
*
In case of a centred running averaging over data (e.g. a time series) with an an inactive window having an even number of units, the separation of the inactive window inevitably leads to different front and read half windows.
For example, a centred running average with a 12-month window has either 6 months before the pivot and 5 behind it – or the inverse.
Which of the two is correct, hence the other wrong? No se!
*
This is why I wrote:
” Thats a matter of taste, not of ideology, and doesnt change much. ”
A simple proof cost just a bit of work.
*
1. 12/10/8 UAH cascade: front window halves 6/5/4, rear 5/4/3 (my choice)
https://drive.google.com/file/d/142AyZBB_2MlSC9Rx1bYwdwVlWhCNG1LG/view
2. 12/10/8 UAH cascade: front window halves 5/4/3, rear 6/5/4
https://drive.google.com/file/d/1Rgf8rRjBlpXeE9FuOOyXIyw2AY5X7L8C/view
The only effect is a horizontal shift of the two cascaded averages (by the same offset for both mean and median).
But the two lines keep structurally unchanged regardless how you define the front respective rear window halves for the two running averages.
barry…”I knew people that died from AIDS. My friends. Nice people. You are a sick, bigoted, small person”.
***
I don’t want to talk about this on Roy’s blog, however, it serves to show how climate alarmists think and that is why I have been doing it. Climate alarmists have a skewed idea of how science works and it is Barry’s emotional defense of gay friends that also represents his emotional defense of the pseudo-science behind climate alarm.
If you really cared about these people, you would spend the amount of time I have spent researching this and advise them of how they are being poisoned by retrovirals which allegedly cure HIV. The first retroviral, AZT, was originally used as chemotherapy but was discontinued due to its extreme toxicity. The newer ones, the Haart family, mess with a persons cells. They are so toxic they actually create AIDS’like symptoms in their victims.
Then you might tell them of Luc Montagnier, who inferred HIV and won a Nobel. He claimed HIV is harmless to a healthy immune system. He claimed further that AIDS is oxidative stress related to lifestyle.
I know of two people who died of it. The first was Freddy Mercury of Queen. His boyfriend told of the orgies he engaged in in New York, in the steam baths, while ripped on drugs.
There was also a local doctor who died of AIDS and who offered a running commentary as he died, about how dreadful the experience was. He even claimed it to be an illness of love. It came out after his death, that opposed to the professional image he presented, he had been a party animal at gay parties and orgies.
Get real, Barry. As Peter Duesberg claimed, a homosexual couple who remain monogamous have little to fear about AIDS. It is the hardcore gays who die of AIDS, about 17% of them who live hardcore lifestyles.
That 17% have caused us a lot of grief and money with their denial of their extreme lifestyles.
“Climate alarmists have a skewed idea of how science works and it is Barrys emotional defense of gay friends that also represents his emotional defense of the pseudo-science behind climate alarm.”
As soon as you started talking about “perversions,” you took it completely outside the scope of science and into values and politics.
You don’t get to make moral judgements and then get on your high horse about science.
You are barely coherent, but your bigotry shines through pretty clearly.
Gordon,
What about Arthur Ashe, and others who died of AIDS from blood transfusions and the like.
bob…the tragedy here is that a so-called HIV infection is not AIDS. Arthur Ashe did not have AIDS, he had a test for HIV show up as positive. Declaring such a condition as AIDS is scientifically incorrect.
Through time, HIV and AIDS became regarded as one and the same and they are not. We can thank the media for that and certain unscrupulous medical personnel who were far too ignorant to understand the difference.
The Draconian practice developed for people testing positive for HIV in the days of Ashe was to put them on AZT, an extremely toxic drug which was discontinued as a cancer chemotherapy due to its extreme toxicity. The irony is that by treating Ashe with AZT, they gave him AIDS, a condition known as drug-induced AIDS (IRS).
Search for it here…
https://www.duesberg.com/papers/1992%20HIVAIDS.pdf
Another scientist who confirmed this was David Rasnick who had actually worked for drug companies for 20 years developing drugs. He is interviewed in this video…
https://www.youtube.com/watch?v=OcCneCcxUwY
He does not speak directly about Arthur Ashe but he does reveal the process that killed Ashe. Mind you, Ashe had other serious health issues.
Gordon always assumes the tiny number of crank extremist views in a field of science must be the only ones that are correct.
Why? Is it because it makes him feel better about his gay bashing?
Thankfully the doctors treating AIDS can safely ignore the extremist views.
Yeah, Gordon,
Arthur Ashe had heart disease and contracted AIDS from a blood transfusion, and died from pneumonia associated with the immune deficiency caused by the HIV virus.
And then there is the crap Ryan White was put through, he contracted AIDS from blood transfusions required because he had hemophilia.
https://en.wikipedia.org/wiki/Ryan_White
Stoop any lower if you can, I know it’s possible.
Gordon,
Duesberg uses a fictional character to support his arguments.
LOL
barry…”I correctly stated that Lanka won the appeal on technicalities”.
***
You are side-stepping the reality, there were no technicalities.
The lower court erred by allowing the plaintiff to submit evidence from 6 different papers whereas Lanka had clearly stated the evidence must come from one paper only. Furthermore, Lanka had asked for a specific size for the virus and the plaintiff’s reps submitted a theoretical range that was far too high to be a retrovirus.
That is the same problem with most virus micrographs you see on the Net. Most lack the required size marker. Lanka has the experience to tell a real virus from viral material, which often mimics a virus.
You’re not even making sense.
barry
I lacked the time yesterday and today to reply to Robertson’s eternal Lanka and virus blah blah.
Demain c’est dimanche, et j’aurai tout le temps voulu.
Just to start:
” That is the same problem with most virus micrographs you see on the Net. Most lack the required size marker. ”
https://media.springernature.com/lw685/springer-static/image/art%3A10.1038%2Fs41598-020-73162-5/MediaObjects/41598_2020_73162_Fig2_HTML.jpg
*
Robertson is not only a disgusting, arrogant person:
https://www.drroyspencer.com/2024/10/uah-global-temperature-update-for-september-2024-0-96-deg-c/#comment-1691839
He is also a brazen ignorant. I have a dozen of links to such images.
*
More about the Lanka reality tomorrow…
I see those images of particles between 0.1 and 2 microns. The range of measles virus size is 0.1 to 0.3 microns.
I also looked this up briefly and confirmed the same. Looked up studies that both isolated and measured the virus, and then checked the resolution of the collectors and and micrographs. But couldn’t be bothered further arguing with the purblind Robertson. I don’t have the time to waste that I did the last few days.
troubleshooting…
barry…you would not recognize sense if you tripped over it. You once called me for claiming there was a warming hiatus from 1998 to 2012. When I sent you a link to the exact statement made by the IPCC, rather than concede your error, you changed the goalposts by claiming a 15 year warming hiatus was insignificant.
The particles in those micrographs posted by Binny are obviously not viruses. The shape varies in some and the rest are likely dead cells. Where are the spikes that allegedly protrude from the viruses to cling to cells.
Another point is this. One of them shows a raised border. A translating electron micrograph is prepared as a sliced sample therefore the viruses should show up as totally flat sliced structures with a thickness of about 100 nm. Appears to be an image from a SEM (scanning EM).
Binny’s micrographs are obviously taken out of context, a typical, practice of his. These photos are of a surface hence are taken by a scanning electron microscope which has a resolution between 1 nm and 5 nm. You would hardly use an instrument with such limited resolution ‘ON A SURFACE’ to view a virus that is 100 nm in diameter.
You should be able to make out the spikes and there is not one visible. On a TEM, a penetrating EM, where the electrons pass right through the specimen, the thickness of the sample is limited to 100 nm and the only spikes visible would be around the edges of the slice.
Conclusion: Binny’s micrograph is faked if it is claimed to be of a virus. There is no accompanying descrip.tion of what we are looking at and no proof it is what it is claimed to be. What’s new, the rest of his bs is faked as well.
An article by a young Lanka on this very subject.
https://tinyurl.com/jbsyhxzr
All these photos have in common that they, respectively the authors, cant claim that they represent a virus, as long as they do not also provide the original publications which describe how and what from the virus has been isolated. Such original publications are cited nowhere.
Indeed, in the entire scientific medical literature theres not even one publication, where the fulfillment of Kochs first postulate is even claimed for such viruses. This means that there is no proof that the viruses held responsible for these diseases have been isolated from humans afflicted by them. Nevertheless, this is precisely what they publicly claim.
1. Many of the photos are colored. This is proof enough, that they are the (art)work of designers, because electron microscopic photos always appear in black and white.
2. The images of the so called HIV-, measles (Masern)- and smallpox (Pocken) viruses clearly show, as the image descrip.tions partly already indicate, that these are cells wherein the viruses can allegedly be found. Thus, nothing has been isolated. The photos actually show cells and typical endogenous particles in them. These structures are well known and serve the intra- and inter-cellular transport. Unlike viruses of the same kind which are consistently the same size and same shape they differ in size and shape and therefore cant have been isolated.
3. In the case of the influenza- her.pes-, vaccinia-, polio-, adeno- and ebola-viruses each photo shows only a single particle; nobody claims that theyre isolated particles, let alone particles that have been isolated from humans”.
Gordon,
Koch’s postulates are outdated when applied to viruses.
“The second postulate does not apply to pathogens incapable of growing in pure culture. For example, viruses are dependent on entering and hijacking host cells to use their resources for growth and reproduction, incapable of growing alone.”
https://en.wikipedia.org/wiki/Koch%27s_postulates
Gordon,
https://fullfact.org/health/Covid-isolated-virus/#:~:text=Firstly%20it%20%EE%80%80is%20incorrect
The Covid-19 virus has been isolated, and Koch’s postulates do not apply to viruses.
And as the cases with Ryan White and Arthur Ashe show that the HIV virus has been transferred from one patient to another.
A word on TEMs, translating electron microscopes.
Any depiction I have seen of a virus on an EM micrograph depicts the spikes with which a virus allegedly connects to a cell, show on debris appearing to be spikes. An EM is a destructive device in that the electrons shot through a thin sample, in the case of a TEM, destroy the target to an extent. Therefore the so-called spikes are more likley to be debris left over when the electrons collide with the central mass.
I have never seen a micrograph of a virus connected to a cell by a spike, or spikes,as they are allege to do. If anyone has such a micrograph with a size marker and which is not a computer generation, that is not in colour, I’d love to see it.
The more I read Lanka, the more I am convinced that his message about viral research, that it is junk science, is true.
Gordon,
“A word on TEMs, translating electron microscopes.”
It’s tunneling electron microscope.
Actually, Bob, a TEM is a transmission electron microscope. The SEM is a scanning electron microscope. TEM electrons penetrate and pass through the specimen while SEM electrons deflect off the surface of a specimen.
Got it Gordon,
You were wrong.
I posted this link above for Bob D, but there is information in the video to support the demise of all science as money and ego displace objective science with propaganda. This applies equally to climate science and all science. Money now calls the shots, not science.
https://www.youtube.com/watch?v=OcCneCcxUwY
Sorry Gordon,
Not going to watch that bull.
Of course not, Bob, would not expect an alarmist to read anything that contradicts his authority figures, even though David Rasnick is an authority on viruses, drugs, and the science in general. He worked for drug companies developing drugs for 20 years.
The fact that you won’t even watch the video and provide a scientific critique says it all.
I am sure your comfort level is with wannabees like the WHO, and Anthony Fauci, who imposed his views by depriving scientists like Duesberg of funding, hence silencing them.
Hope you are happy in you janitorial role at the nuclear company.
Gordon,
It’s bull, Rasnick says retroviruses don’t cause disease.
AIDS and cancer are diseases caused by retroviruses.
Gordon,
I worked for drug companies for more than 20 years, so I am a better expert than Rasnick.
barry…”The higher court agreed that the rules were broken.
That much you got right.
But you went further than that, and this is why you failed”.
***
Barry, old cobber, you have a serious problem with comprehension.
You just admitted that the higher court agreed that rules were ignored in Lanka’s stipulations by the lower court ruling and over-ruled them. That’s my point exactly yet you continue to squabble over it.
I added to that, since Lanka has offered a 200,000 Euro prize to anyone who can prove the measles virus exists, and no one has challenged him, that there is serious doubt that it exists. It’s not so much a question as to whether it exists or not than it is the fact that a vaccine has been offered to children based on a virus no one can prove exists.
The number of autism cases is increasing among children and some have blamed that on children receiving vaccines before their immune system is adequately developed. Their little brains are still forming and we are injecting them with vaccines for which there is little proof they are effective.
Newborns in the States are immediately injected for an alleged sexually transmitted disease.
Here in BC, Canada, children by age 2, 4 and 6 months get…
Diphtheria
Tetanus
Pertussis (whooping cough)
Hepatitis B
Polio
Haemophilus influenzae type b
They also get..
PCV 13 vaccine -for Infection from 13 types of pneumococcal bacteria.
and…Men-C vaccine for Meningococcal C infection.
and…Rotavirus … a virus that causes gastroenteritis, sometimes called the stomach flu. Children who get rotavirus disease can become dehydrated and may need to be hospitalized.
I say, keep these witch doctors away from children. I had none of those vaccines as a child and suffered from none of the maladies.
Gordon,
I have no use for anti-vaxxers.
bob…here’s a quarter, go call someone who gives a hoot.
I called, and they told me that the original paper linking autism to vaccines was retracted.
Gordon,
“You just admitted that the higher court agreed that rules were ignored in Lanka’s stipulations by the lower court ruling and over-ruled them. That’s my point exactly yet you continue to squabble over it.”
If you stuck to that point there would be no disagreement. But you have strayed into pure nonsense. Eg,
“The higher court offered no proof that what Lanka claims is true, but it does uphold Lanka’s claim that the measles virus has not been properly isolated.”
No, the court did not uphold that claim, which is a general pronouncement on the whole field. The court only ruled on the 6 papers before them.
A wise man once said, “If you cannot say what you mean, you will not mean what you say.” You keep implying that Lanka’s general opinions were “upheld” by the court.
The middle court’s expert opined that the 6 papers taken together are sufficient evidence of the existence of the measles virus. The court only ruled on whether Lanka’s particular set of criteria were met. They did not rule on the medical validity of those criteria as a challenge to the existence of measles. That was outside the purview of the court.
The court case did not shift the burden of proof for the non-existence of measles away from Lanka. You seem to think he holds the truth and it’s up to others to prove him wrong.
test
“I added to that, since Lanka has offered a 200,000 Euro prize to anyone who can prove the measles virus exists, ”
You conveniently forget his rather arbitrary caveat ‘in a single paper’, Gordon.
Science is rarely all wrapped up in ‘a single paper’.
And thus, the measles virus exists and can be proven with a small number of papers.
Oh well!
now im a bit confused. i thought i understood that a different way of calculating the global average was the reason for different numbers . If you all can excuse my ignorance , i am no scientist and i know im out of my depth on this. i too skim the science and look for data bites that i like. In the past however i have not seen differences between the numbers from NOAH , ,Copernicus and the UAH . This year it has happened twice and Noah has still not published their data from september because of Helene. It seems that the UAH has the highest numbers yet produced
One of the major reason for the differences between the monthly values is that the datasets have different baselines, typically based on a 30-year average.
For example, you calculate the average of all Januaries from 1981 to 2010. The result is what you subtract from every January before and after, as if the 30-year average becomes the zero point. Then do that for each month over the same time period. That’s your ‘zero’ for each month, that forms the baseline.
UAH uses the 30-year average of each month between 1991 and 2020. Because temperatures are higher near the end of the series, the baseline has moved up from the old baseline (1981-2010), which was used until a few years ago. Regulars here know that the 40 years of anomaly data published in 2019, for example, has been downshifted because of the higher baseline now used.
NOAA has a few global temp products that have different baselines for different purposes. So you have to know which product you are using. If you’re getting it from source, the info should be there.
The UK Met Office global temp time series uses the 1961-1990 time period, though they also publish time series with the 1981-2020 baseline (I haven’t looked at this time series for a while, so they may have updated their baseline).
GISS global temp product uses the 1951-1980 baseline, as it always has. This means that their baseline is set in a cooler period than UAH, and thus GISS anomalies will be relatively higher, in general.
RSS uses the 1979 to 1998 baseline, which I believe they always have done. They may keep the old baseline so that there is no disparity with their published anomaly data over time. Possibly GISS reasons similarly.
Aside from this major difference, if baselines are different between datasets, we don’t expect anomalies to be exactly the same. Each institute uses different data, or a different monitoring system altogether (eg, surface thermometers vs satellite retrieval of atmospheric radiance). Then there are differences with the way the data is processed to weed out biases (eg, satellite drift, or ‘clumping’ of thermometers giving more weight to one region that another, region with fewer thermometers).
While the absolute anomalies may differ, all these different methods and monitoring systems produce remarkably similar global temperature time series.
People in the ‘climate wars’ can sometimes wrangle over what are very minor differences between the datasets.
luke,
Scroll up and look at the graph in the original post above. That zero baseline running horizontally across the middle is the 30 year average 1991-2020.
Ten years ago that baseline was the 1981-2010 average, and because the average of that 30 years is a bit cooler than the more recent 30 years, anomalies were relatively higher. From memory the average difference is 0.12C, so an anomaly of 0.22 on the old baseline becomes 0.10 on the new baseline.
It’s slightly more complicated than that (the difference in monthly averages are different from each other by a small amount), but this should give you the general idea.
ALWAYS check the baselines if you are comparing anomalies from different data sets.
Luke
I lack time to a deeper answer.
Only one hint: I repeat that atmospheric temperature measurements often correlate very well with those at the surface but can differ considerably from them.
We see this all the time during ENSO (El Nino / La Nina) phases where the lower troposphere reacts much more to ENSO signals than does the surface.
barry
I’m not 100% sure that Luke’s confusion is due to a misunderstood comparison of anomalies computed with respect to to different reference periods.
Please have a look at this WFT chart below in which the GISS and RSS 4.0 time series were displaced by their respective mean for 1991-2020:
https://www.woodfortrees.org/graph/gistemp/from:1979/mean:12/offset:-0.613/plot/rss/from:1979/mean:12/offset:-0.357/plot/uah6/from:1979/mean:12
We can clearly see that UAH LT bypasses even RSS LT, and that the surface keeps way below the lower troposphere.
Other series like BEST or Had~CRUT didn’t provide most recent data yet.
Bin,
I mentioned the non-baseline differences briefly in my first reply, noting that the different time series are remarkably similar in shape, and that the differences we wrangle about are not that large to the naked eye.
With the widest difference in trend between the major global datasets being 0.07 C/decade since 1979, I think we sometimes stop seeing the forest for the trees. The monthly anomalies are well correlated in terms of change in direction month to month, and I believe the annual anomaly is a perfect match in changes of direction year to year, or close to. That’s quite remarkable when one set of data is thermometer based and the other is measured from O2 radiance brightness in the atmosphere.
In any case, as luke said he was a newbie I thought it wouldn’t hurt to do an intro on baseline difference.
barry
” In any case, as luke said he was a newbie I thought it wouldnt hurt to do an intro on baseline difference. ”
I agree.
*
” The monthly anomalies are well correlated…
Thats quite remarkable when one set of data is thermometer based and the other is measured from O2 radiance brightness in the atmosphere. ”
Yes! And I had many times the opportunity to show this amazing correlation.
*
The nicest example was the comparison, within the 2.5 degree grid cell around Vancouver
https://www.google.com/maps/place/48%C2%B045'00.0%22N+123%C2%B045'00.0%22W/@48.75,-124.8709917,384211m/data=!3m1!1e3!4m4!3m3!8m2!3d48.75!4d-123.75?hl=en&entry=ttu&g_ep=EgoyMDI0MTAwOS4wIKXMDSoASAFQAw%3D%3D
of all available GHCN daily stations with UAH 6.0 LT above the cell:
https://drive.google.com/file/d/1rl5X4v9j1rxUPEXhACbJMtStaChCKBym/view
*
Even more amazing is the 250% zoom into the picture, which shows to what an incredible level of detail the two time series are similar – despite generated out of completely different data:
https://drive.google.com/file/d/1nX_FQb_-CQ8hF0BjMLaOer3oCEuZZZS6/view
*
The reason to make the chart was Robertson’s completely idiotic allegation that when it’s a bit colder as usual in his corner during an October month, THEN the global warming must be questioned!
luke…the surface records from NOAA, GISS, and Had-crut are largely from fudged data. Check this site to see the degree of fudging…
https://chiefio.wordpress.com/2009/10/27/ghcn-up-north-blame-canada-comrade/
You have to dig deeply into the site, this page is one of many.
The surface record has roughly 1 thermometer to cover 100,000 km^2. There are many places where they don’t have coverage so they interpolate temperatures from thermometers up to 1200 km apart. Then they use a climate model to homogenize all the synthesized data with the real data, which is recorded by thermometers twice a day and averaged.
That covers just the solid surface, not the oceans, which make up 70% of the surface. The oceans are covered by Argo buoys, again, roughly 1 per 100,000 km^2, which are submerged to measure water temperature and are shot to the surface to measure surface temperature. No one can convince me such a thermometer, covered in water and ocean spray can measure an accurate temperature precisely. The Argo buoy could be surrounded by 50 foot waves as it measures.
Meantime, the satellites cover nearly 95% of the full surface. Alarmists argue that the data used by the sat scanners is at 4 km but they fail to grasp that 4 km represents the peak amplitude of oxygen emissions across a wide range of altitudes. In other words, the instruments measure oxygen emission above and below 4 km on channel 5 alone.
If you look at the UAH record versus the NOAA record there is no comparison whatsoever. Since 1979, the UAH record has varied widely on either side of the baseline while the NOAA record takes off at 1980 and shoots straight up on about a 45 degree angle.
One problem is that the baseline average, upon which the anomalies are based, varies widely between UAH and NOAA. the official source of surface data. Those claiming the two are equivalent are lost in statistical misunderstandings.
Oh good grief.
luke, Gordon’s rabbit hole is a dive into conspiracy theories. Caution ye who enter…
“Alarmists argue that the data used by the sat scanners is at 4 km but they fail to grasp that 4 km represents the peak amplitude of oxygen emissions across a wide range of altitudes. In other words, the instruments measure oxygen emission above and below 4 km on channel 5 alone.”
Wonderful to have my own point of view thrust at me as if I disagree with it.
The instrument indeed cannot isolate emissions at any particular altitude, but measure, as I’ve many times said, a broad swath of the atmosphere many kms deep, with peak emission in the mid-troposphere.
And I said this to you many times, Gordon, whenever you insisted that these same instruments can isolate the surface and give us a surface temperature.
I guess I should be glad that you’ve finally caught on.
” Meantime, the satellites cover nearly 95% of the full surface. Alarmists argue that the data used by the sat scanners is at 4 km but they fail to grasp that 4 km represents the peak amplitude of oxygen emissions across a wide range of altitudes. In other words, the instruments measure oxygen emission above and below 4 km on channel 5 alone. ”
Once more, Robertson urges in manipulating the blog by insinuating that UAH’s current lower troposphere temperature measurements encompass surface temperature data.
Robertson’s manipulation goal could hardly be more trivial: by integrating surface temperatures into the UAH LT measurement spectrum, he automatically discredits all real surface data because UAH LT data shows way less warming than surface measurements.
Nice try but absolute nonsense.
*
UAH is not a willing partner for manipulation by climate change deniers.
Roy Spencer has always stated that he is not at all interested in a measurement of the lower troposphere that is contaminated by unwanted ground influences.
This is one of the reasons for having abandoned UAH5.0 in favor of UAH6.0 in 2015.
But Robertson is only interested in spouting his egomaniacal ‘thoughts’ and not in learning, and hence understands nothing about such things.
Once more, Robertson’s endlessly repeated antiscience – ad nauseam.
” If you look at the UAH record versus the NOAA record there is no comparison whatsoever. Since 1979, the UAH record has varied widely on either side of the baseline while the NOAA record takes off at 1980 and shoots straight up on about a 45 degree angle.
” One problem is that the baseline average, upon which the anomalies are based, varies widely between UAH and NOAA. the official source of surface data. Those claiming the two are equivalent are lost in statistical misunderstandings. ”
*
There is only ONE problem here: that Robertson still can’t manage to understand how anomalies work, nor the role of reference periods in their construction, let alone the removal of annual cycles, a subtask performed by ALL institutions providing us with anomalies of climate data (not only temperature), beginning of course with Roy Spencer himself.
As barry explained above, you can never compare anomaly time series which were constructed out of different reference periods.
This is valid for all time series, including of course those of UAH: you can’t compare the anomalies published for e.g. Oct 2009 with those of Jan 2019 nor with those for Jul 2023.
Because in Oct 2009, the reference period was 1979-1998 (which RSS still uses nowadays); in Jan 2019, 1981-2010; and in Jul 2023, 1991-2020. Comparing the three ‘as is’ is like comparing apples, oranges and peaches.
*
Let alone could you compare a NOAA anomaly time series based on the period 1901-2000 to a UAH series built with respect to 1991-2020:
https://i.postimg.cc/ncDph2XL/UAH-6-0-LT-vs-NOAA-surf-1979-2022.png
To compare the two, you MUST displace each monthly anomaly in the NOAA series by the series’ mean for 1991-2020:
https://i.postimg.cc/xT6mR007/UAH-6-0-LT-vs-NOAA-surf-1979-2022-wrt-1991-2020.png
The average difference between NOAA anomalies built wrt 1901-2000 and those built wrt 1991-2020 is 0.62 C!
What is the sense of comparing them?
*
I explained this to Robertson for the umpteenth time in September 2022, but I knew he would immediately “forget” what I had written and resort to his usual NOAA hatred garbage at the very next opportunity.
*
One of his dumbest allegations is what he posted above:
” Those claiming the two are equivalent are lost in statistical misunderstandings. ”
There couldn’t be any better proof of his ignorance due to his persistent lack of understanding.
*
Anyone who credulously follows Robertson’s trash 100% deserves it.
Who knows what Gordon means by “the NOAA record takes off at 1980 and shoots straight up on about a 45 degree angle”:
https://tinyurl.com/N13RA
It looks very similar to the UAH 13-month average at the top of the page, varying “widely on either side of the baseline”.
He just says whatever sounds good to him.
(I haven’t recorded NOAA anomalies for the past 6 months, and their site is currently down dur to the hurricane, so the graph is 6 months behind.)
And here is the NOAA monthly data translated to the UAH baseline (again 6 months behind):
https://tinyurl.com/Monthly-UAH-Baseline
Again, very similar to the UAH graph at the top of the page, and no “shooting straight up at a 45 degree angle”.
Antonin Qwerty
” It looks very similar to the UAH 13-month average at the top of the page, varying ‘widely on either side of the baseline’. ”
Yes!
https://drive.google.com/file/d/1xmTAVF5Tgj5Cn7ZABqnUYthWHTxSb3E3/view
ANT…”And here is the NOAA monthly data translated to the UAH baseline…”
***
Comments like your above are why I find you such an amusing little fellow. How does one go about translating a 30 year average to a 100 year average?
Gordon – are you asking how to calculate the average of 360 months in the NOAA data set?
I certainly hope you don’t find that a difficult concept.
Antonin Qwerty
” Gordon are you asking how to calculate the average of 360 months in the NOAA data set? ”
*
I’m afraid that you underestimate Robertson’s absolute ignorance by dimensions.
The problem here isn’t whether or not he would be able to calculate it.
I have no doubt that he would at least be able to align 5 (or 360) integers in a column, to all them and to divide the sum by 5 (or 360), thus obtaining the average.
Maybe he would even manage to calculate a 12-month baseline out of a 360-month period in a time series – if and only if he understands that he in this case has to average each month separately over the 30 years.
*
The problem is at another level: he never has understood and still does not understand how these anomaly, baseline and reference period concepts are related to another, and hence endlessly doubts their correct description.
This is visible in his question I paste below, which makes actually rather him the not so terribly ‘amusing little fellow’:
” And here is the NOAA monthly data translated to the UAH baseline…
How does one go about translating a 30 year average to a 100 year average? ”
*
Robertson did never grasp even until today that
– the baseline of a monthly time series is a 12-month array, containing for each single month the average of all same months in the reference period chosen, regardless how many years the reference period contains – 10, 20, 30, 100;
– the anomalies for each month in the time series are constructed by subtracting the month’s average in the baseline from the absolute value in the time series;
and that hence,
– translating, for example, the NOAA monthly data to the UAH baseline means to selectively displace all NOAA anomalies by the difference between the monthly averages of the NOAA baseline and the monthly averages of the UAH baseline.
*
No chance to get him to that, and even if he finally gets it, he will nevertheless stubbornly resort to his old unscientific nonsense.
Who credulously believes Robsertson’s persistently incompetent trash 100% deserves it.
Dr. Spencer –
I like seeing your monthly trend of the global temperature and believe it to be the most accurate information available. However, as it only goes back < 50 years and the larger temperature cycle is ~100,000 years, seeing the short-term temperature increase may be deceiving.
What is the best proxy or source of information you use to recreate longer term temperatures? Being able to compare variability over the course of the Holocene would provide good insight into whether the current increase is typical. Also being able to compare previous longer scale interglacial peaks, such as the recent Eemian, would also help to demonstrate whether we are seeing an abnormality this time around.
Your thoughts on this comparative data would be appreciated.
Thanks,
Russell
Russell
You wrote above:
(1) ” … seeing the short-term temperature increase may be deceiving. ”
and
(2) ” … whether we are seeing an abnormality this time around. ”
*
Why do feel the need to go back to the Holocene?
Please have a look at UAH 6.0 LT – here anomalies only, without the distracting running mean:
https://drive.google.com/file/d/1wwBYdowaCPbsDLBpf7uhYwHMdz1fyiPU/view
You see in 1997/98 a transition from the drop in Apr 1997 at -0.39 to the next significant peak in 1998 at +0.62 C.
Within 12 months, the anomaly level thus jumped by +1.01 C.
*
If you now move to 2023/24, you see a transition in the same Apr-Apr 12-month period from +0.19 up to +1.05 C.
Within the same period, the anomaly level jumped by +0.86 C, i.e. 0.15 C less than in 1997/98.
binny…”look at UAH 6.0 LT here anomalies only, without the distracting running mean:”
***
I am sure RLH will be rolling on the floor laughing at that one. ‘The distracting running mean’…BWA–HA-HA-HA-HA-HA.
Bindidon – I am being denied access to your Google Drive file.
Apologies!
I forgot to change the access rights.
Blindidon – You clearly don’t understand statistics. You can’t look at the variability of 50 years of a 100,000 year cycle (0.05%) and determine anything of significance. The month-to-month and year-to-year variability across the broader range of the entire period is necessary. You are merely observing a hair on the ass of a gnat and deciding it’s bald!
Russell,
What if the variability of the 50 period is greater than the variability of the 100,000 year period?
https://theconversation.com/is-it-really-hotter-now-than-any-time-in-100-000-years-210126
and
https://cp.copernicus.org/articles/18/911/2022/
Bobdroege – Those are good articles you attached. Getting closer. The problem is their extrapolated hockey sticks used to make your point. Both articles say that we are well within the normal cycle bounds. HOWEVER, if you base the future on models that have proven to be lacking, suddenly all life on Earth is going to end.
Try again!
Russell
You apparently are convinced of the relevance of your thoughts that you don’t even manage to grasp that I was NOT AT ALL claiming that the tiny UAH period would be significant compared to longer periods.
{ By the way, if the dumb poster Flynnson had not been banned recently, he would have jumped into your post and said
” Well Russell! What are your tiny 100,000 years compared to 4.5 billion years of cooling since Earth’s molten state? ” }
*
What I wanted to show is that there is imho1 nothing abnormal in the recent LT temperatures, what is imho2 confirmed by the fact that surface temperatures do not follow the harsh LT peak.
So what!
Russell,
Compare the slopes of the two periods, not the projected part of the temperature series out to 2100 AD.
And the graphs show we are now warmer than any time in the last 100,000 years, but we may have to wait a bit for it to be warmer than the interglacial 125,000 years ago.
russell…”seeing the short-term temperature increase may be deceiving”.
***
That’s the point, we think that because warming is happening on our shift that it is caused by a trace gas. There was an equivalent warming in the 1930s that was claimed to be local to the US and Canada only. Unlikely that such warming would be localized over a decade. It is far more likely that no one was looking for it elsewhere or even interested in doing that.
Back in the 1930s, ENSO, the PDO and the AMO had yet to be discovered. No one was interested. It was not till 1977, when the global average suddenly increased by 0.2C that an interest was kindled as to why. Some scientists wanted to write it off as an error and that same practice is carried on today by the likes of NOAA and GISS. They have retroactively re-written the record to make it better fit the anthropogenic meme.
There was a 400+ year cooling during the Little Ice Age that the IPCC has ingenuously claimed to have been local to Europe only. That means they are either stoopid or dishonest. There is plenty of evidence that the cooling was global. In that event, the planet had cooled 1C to 2C and when it ended circa 1850, the re-warming was blamed on a trace gas.
Here we see once again Robertson’s mental niveau… how appalling!
The best part is that Robertson didn’t even understand that his friend Blindsley H00d aka RLH, who denies global warming just as much as he does, has been discrediting running means to the core for years!
Wriggles, distortions! OMG! Vade retro, Satanas!
The best part of the running mean for me is that it gives an instant visualization of what the data is saying. RLH is likely looking at it more from a statistical POV than I am and I don’t pretend, as do you, to have any expertise in statistics.
So now you like averages, Gordon? Flip-flop, flip-flop …
But while you’re in this mood, here is the 20-year running average of the UAH data:
https://tinyurl.com/UAH-20-Year
Oh look!! It’s heading straight up at 45 degrees!!
Isn’t that supposed to be an issue, indicating fraud?
Barry and GordoN, Bindidon AND ALL. thank you so much for your patience and attention to my inquiry . Im honered to be apart of your exchange.
Cheers. Happy hunting.
Proponents of an imminent ice age have always said “it’s not about sunspots, it’s about the neutron count”.
Well here is the running 365-day average of the Oulu neutron count:
https://tinyurl.com/Oulu-365
It can be seen that it is MUCH MUCH closer to SC23 than to SC24.
And a 365-day running average is 6 months behind, so there is more of a fall to come.
I suspect they will now drop their claim about the neutron count and revert to sunspots. I wonder when they will start claiming fraud.
Antonin Qwerty
” Proponents of an imminent ice age have always said “it’s not about sunspots, it’s about the neutron count”. ”
Interesting! I never read that until now.
When comparing SC25 to SC24 in the Oulu monthly data
https://drive.google.com/file/d/11D3DJ_SPs7rwrnKFa-OHXCMxxirAwBe-/view
I think: Oh the poor guys & dolls, they will be sooo disappointed.
*
Confirmed by this comparison I made during summer out of
– SSN
– F10.7 flux
– Bremen MgII
– Inverted Oulu neutron count
https://drive.google.com/file/d/1oLwc2SSUqAxeJBCO8lVmjMbLIXUbRB8Y/view
It’s amazing to see that the inverted Oulu neutron count has the steepest slope.
*
” I suspect they will now drop their claim about the neutron count and revert to sunspots. I wonder when they will start claiming fraud. ”
You hit the nail on the head :–)
barry…”[GR]The higher court offered no proof that what Lanka claims is true, but it does uphold Lankas claim that the measles virus has not been properly isolated.
***
If you read through the material carefully you will find that the experts who were testifying agreed to the above. The higher court did not over-rule the lower court on a technicality, they over-ruled them because the experts testify for Lanka, and even those opposing him, agreed with Lanka that no proof was available in the literature provided.
Perhaps the most damning testimony came from the woman representing the Koch Institute, who had upheld the virus discovery, that the information on measles is lacking. When an outfit as powerful as Koch admits that, it pretty well agrees with Lanka.
The literature provided was ALL based on papers related to measles that claimed to have found a virus. The meaning is clear, there is not one single paper that can prove the measles virus exists.
Also, if you watch the video with Rasnick. the problem with the entire industry is politics and money. When Robert Gallo, the US scientist who tried to convince the world he had discovered HIV, only to have it revealed he stole the genetic material from Montagnier, one gets the impression it is about power and money. Gallo has since become very wealthy, only because the Reagan administration stifled the case against him re misconduct.
The same administration made a deal with the French to make the problem go away and part of that deal was that Montagnier be recognized officially as the discoverer of HIV. Hopefully you don’t think a nation the size of the US would be willing to lose face over that if there was not damning evidence against Gallo.
As long as graft and corruption run these industries, there is little hope of getting at the truth. Pfizer alone has been fined over 5 billion for misrepresenting their products and as long as they can make huge money offering fraudulent antivirals for harmless viruses, they and their buddies at the FDA and the CDC will continue to dupe the public.
When a leader of the CDC was released from her job for corruption, she was immediately hired by a pharmaceutical company.
https://www.dailymail.co.uk/health/article-12483423/HALF-CDC-staff-lobby-Big-Pharma.html
barry…”The instrument indeed cannot isolate emissions at any particular altitude, but measure, as Ive many times said, a broad swath of the atmosphere many kms deep, with peak emission in the mid-troposphere”.
***
Let’s put it in a language you may be able to understand. Suppose I have a microphone connected to an oscilloscope display via a filter. And suppose my source is a series of audio oscillators connected through speakers with frequencies from about 20 hz up to 20,000 hz. Are you trying to tell me I cannot get a display on the scope that will show me the relative levels of each oscillator?
Now replace the oscillators with O2 molecules that emit a frequency proportional to their temperature and altitude. The AMSU receiver replaces the microphone and the related instrumentation can be designed to isolated the various frequencies and their relative amplitudes.
Of course no instrument can accurately detect the entire spectrum emitted by O2. Therefore the AMSU instrument is divided into channels with each channel being tuned to a certain ‘centre’ frequency. hence a specific altitude. Channel 5 which has been traditionally used to detect surface temperatures is centred at 53.596 Ghz, where the O2 molecules radiate at that frequency at 4 km..
Given the nature of such instruments they receive best at that frequency for channel 5 but they also receive a host of other frequencies above and below that frequency. The official number of frequencies they detect is called their bandwidth and that is usually defined at 3 dB below the centre frequency amplitude.
Since channel 5 is centred at an equivalent altitude of 4 km it can also measure O2 frequencies below and above 4 km. If you look at the associated weighting function, it shows that channel 5 can detect O2 from the surface right up to 12 km or more. The 3 dB level which is half power would be around 8 km and extending right to the surface.
And if you examine adjacent channels, you can see they absorb O2 frequencies covered by channel 5 and vice versa.
https://tropic.ssec.wisc.edu/real-time/amsu/explanation/oper_mw_40_km_weighting_functions.png
The point is, channel 5 can measure right to the surface if required. I would not doubt that such measurements have been made but found to be contaminated by surface microwave emissions.
“Are you trying to tell me I cannot get a display on the scope that will show me the relative levels of each oscillator?”
What we are telling you is that the UAH TLT anomaly DOES NOT do such a thing.
Perhaps you should ask Mr Spencer to isolate the surface temperature from the data for you. Until then, it is NOT measuring surface temperature.
Hansen the alarmist pointed out the thermometers don’t measure surface temps either since they are located at varying heights above the surface.
I wish Roy would do an article on this to outline exactly how the surface temps are derived.
He said the variation is 1.25 to 2 metres above the surface. About 1% of 1% of the variation in satellite readings.
You really have NO concept of perspective, do you Gordon.
“Now replace the oscillators with O2 molecules that emit a frequency proportional to their temperature and altitude. The AMSU receiver replaces the microphone and the related instrumentation can be designed to isolated the various frequencies and their relative amplitudes.”
No.
Altitude DOES NOT determine the frequency at which O2 molecules emit. The channels are tuned to a particular frequency which is emitted by a deep layer, several kms deep at the very least, peaking at (or centred on) a particular pressure (which is how altitude is determined).
O2 molecules emit at the selected frequency in a thick layer several kms deep. It is impossible to isolate this signal aty a specific height.
And this is what you said to begin with:
“Alarmists argue that the data used by the sat scanners is at 4 km but they fail to grasp that 4 km represents the peak amplitude of oxygen emissions across a wide range of altitudes. In other words, the instruments measure oxygen emission above and below 4 km on channel 5 alone.”
For once, you got it right (except that I have told you this many times – I don’t ‘fail to grasp it’). I commended you for it.
Now you seem to be arguing against your own words.
Perhaps you are conditioned to be contrary.
nate…”You conveniently forget his rather arbitrary caveat in a single paper, Gordon.
Science is rarely all wrapped up in a single paper”.
***
Did Newton need several papers from different authors to prove that f = ma, or to support his theory on gravitation?
We are talking about papers claiming to have physically isolated a virus yet none of them could prove it conclusively. So, how does one go about proving through several papers what one cannot prove in one paper?
It goes much deeper, Nate. The study of viruses has been botched since day one. As Rasnick has claimed, going back and getting it right would be very costly to reputations and the cost of doing so.
Scientists who are objective about this cannot name a virus that has been proved to cause an illness, especially based on Koch’s postulate. Someone recently posted a mealy-mouthed claim by wiki that viruses are an exception to Koch and that is the entire basis of virology. Since their research does not meet Koch’s standard related to disease they have moved the goalposts and claimed virus theory as an exception.
The alleged vaccine for covid was rushed out in 3 months by Pfizer, who have been fined over 5 billion for misrepresenting their products and influence peddling. Furthermore, they were exempted from criminal prosecution if anything went wrong. HIV has been around for 40 years yet there is no vaccine for it.
Why???
Gordon,
Koch’s postulate requires that you can grow a pathogen in a pure culture.
Viruses don’t grow in pure culture, they need a living organism to reproduce.
bob..do you have any proof that a virus does that? We hear it all the time, I want to see proof of it. I want to see a virus clamp onto anything and change the structure to produce disease.
We have the same problem with electrons, we cannot see them, but the cells claimed to be infected by a virus at 100 nm should be visible doing its thing. Why has no one ever seen it in action? We have plenty of macro evidence that electrons likely exist as claimed.
https://www.ioc.fiocruz.br/sites/default/files/mediaSiteIOCPubliq20230621/03_montagem_viruses_dentro_ok.jpg
Gordon,
” I want to see a virus clamp onto anything and change the structure to produce disease.”
Sorry Gordon, it’s not possible to view viruses as they act due to the preparation of samples for electron microscope kill the living cells.
Like you can’t make a movie of viruses infecting and multiplying in cells, but you can get sequential images showing them in the act, like Anton has provided.
You do know that viruses are not actually alive?
Land-sinks based on boreal forest are losing their sink capacity, rendering 30 years of emissions cuts in Finland moot:
https://www.theguardian.com/environment/2024/oct/15/finland-emissions-target-forests-peatlands-sinks-absorbing-carbon-aoe
ant…”Gordon are you asking how to calculate the average of 360 months in the NOAA data set?
I certainly hope you dont find that a difficult concept”.
***
I am saying that you cannot take 360 months of NOAA data and compare it to 360 months of UAH data because the anomalies in each are based on entirely different baselines. NOAA’s baseline is 1910 to 2000 whereas UAH is 1990 – 2020. We saw the difference in the UAH data set alone when UAH changed their baseline from 1980 – 2010 to 1990 – 2020.
Furthermore, the NOAA temperature series is totally fudged. They have retroactively ‘adjusted’ (I call it fudged) the series to what they think it ‘should have been’. Furthermore, their current temperature data is seriously fudged as well.
Binny presents himself as a guru on this but he does not even begin to understand statistical methods or even what anomaly means. Recently he tried passing off the bs that the UAH series is based only on an equation.
All you need to do is look at the NOAA series and see that it takes off on a 45 degree trend angle from the baseline after 1980 whereas the UAH series straddles the baseline till 2016. We are currently waiting for it to come back down. Then again, we likely are experiencing more re-warming from the Little Ice Age.
ps. since the NOAA baseline is 1910 – 2000, it means the baseline will be much cooler than the UAH baseline hence current temps will be highly exaggerated.
I am NOT comparing one baseline to another. I am CONVERTING one baseline to the other so they CAN be compared.
Do you really not understand that concept? Or did you reply without reminding yourself what the conversation was about? Perhaps go back and read the thread before embarrassing yourself again.
Antonin Qwerty
It’s unimaginable. Robertson still didn’t manage to understand the reference period/baseline/anomaly concept:
” I am saying that you cannot take 360 months of NOAA data and compare it to 360 months of UAH data because the anomalies in each are based on entirely different baselines. NOAAs baseline is 1910 to 2000 whereas UAH is 1990 2020.
…
We saw the difference in the UAH data set alone when UAH changed their baseline from 1980 2010 to 1990 2020. ”
*
It becomes evident that he has no interest in learning but prefers to resort all the time with his usual nonsense like:
” Recently he [Binny] tried passing off the bs that the UAH series is based only on an equation. ”
How many times did I show him that Roy Spencer himself explained in 2015 that as opposed to the LT series of UAH5.6, that of UAH6.0 no longer is based on microwave sounding.
He just needs to look at
https://www.drroyspencer.com/2015/04/version-6-0-of-the-uah-temperature-dataset-released-new-lt-trend-0-11-cdecade/
2.1 LT computation
” The LT computation is a linear combination of MSU 2,3,4 or AMSU 5,7,9 (aka MT,TP, LS):
LT = 1.538*MT -0.548*TP +0.01*LS ”
That is original Roy Spencer, and is no BS at all.
*
If Robertson was an engineer, he would have no problem to generate an UAH LT time series out of MT, TP and LS according to the weighting function above, and to compare it to the data published by Roy Spencer, as I myself did:
https://www.drroyspencer.com/2015/04/version-6-0-of-the-uah-temperature-dataset-released-new-lt-trend-0-11-cdecade/
*
But he is no engineer at all, is unable to do simplest things and hence prefers to distort, misrepresent, discredit, denigrate and lie.
*
If he had ‘balls’ he would ask Roy Spencer what is wrong in my chart.
But… hombre sin cojones. He never ever would ask him.
binny…”I have no doubt that he would at least be able to align 5 (or 360) integers in a column, to all them and to divide the sum by 5 (or 360), thus obtaining the average”.
***
This is Binny’s problem, he’s a number cruncher and has no idea how to relate the numbers to reality.
I don’t recall you describing anything related to reality.
I don’t recall you saying anything related to intelligence, insight, rationality or objectivity (e.g., your childish belief that 99 % of “climate scientists” believe that climate change– whatever that may be — is due to humans). Your snotty, condescending manner is particularly obnoxious, especially given your naivet in all matters climatic. Gordon is miles above you as a scientist. But do keep trying.
Please city me talking about this 99%. You won’t be able to, proving your love for fiction. You clearly are willing to support someone’s “science” without reading what they actually say, just because they’re on your side of the debate. Did you know that the moon’s phases are caused by the earth’s shadow? This is what Gordon “taught” me.
I read above Robertson’s endless insults against me:
‘number cruncher’
‘… presents himself as a guru on this but he does not even begin to understand statistical methods or even what anomaly means’
*
I have no problem with Robertson discrediting me, insulting me or even lying: he is the one who doesn’t understand how the concepts discussed here work, and not me.
But I have a problem with people like Robertson, who do so as if they would defend the UAH team but actually discredit them.
*
Firstly, Robertson insults the UAH team because, as opposed to him who would never be able to engineer anything, they all work hard as ‘number crunchers’ all the time since decades by developing and maintaining lots of software.
*
Secondly I learned many years ago how anomalies are constructed: namely, by watching this blog and understanding what Roy Spencer does and explains.
And that I learned with success how to do what he does: this I proved many years ago by showing in a chart the comparison of UAH’s public time series with what I generated by myself out of UAH’s grid data, for example:
https://drive.google.com/file/d/1d_LHRRQ6Zk1Bpo18kglk-gkcXWHJiOvQ/view
*
One more of these ‘number cruncher’ things of which the stubborn, uneducated, ignorant Robertson doesn’t have the least clue about.
THE MODELS ARE USELESS. The reality is much, much worse:
https://www.theguardian.com/environment/2024/oct/14/nature-carbon-sink-collapse-global-heating-models-emissions-targets-evidence-aoe
You quote the Grauniad?!? Bwah-hah-hah! That’s like shooting yourself in the gonads..
In the UK, this rag is known as the leading producer of inane drivel (clearly funded by rich alarmists). It is science-free.
Love how you people use the passive tense to falsely suggest a universal support for your claims.
Correction: The passive VOICE.
Are people STILL listening to Robertson? There is a “Mute” button now, you know,
I can’t see one.
It’s in the “tarderase” plugin I wrote for this blog. It is available for Firefox and Chrome-based browsers, including Brave and Edge.
If we don’t reply to Gordon then he’ll believe he has “won”. No one will challenge nonsense like “the moon’s phases are caused by the earth’s shadow”.
I’ve come to think that what these people “believe” has no significance.
Hopes dreamz and wasted money
https://youtu.be/5qrv-slfa0g?t=3289