
 Home/Blog
The Version 6.1 global average lower tropospheric temperature (LT) anomaly for February, 2025 was +0.50 deg. C departure from the 1991-2020 mean, up a little from the January, 2025 anomaly of +0.45 deg. C.
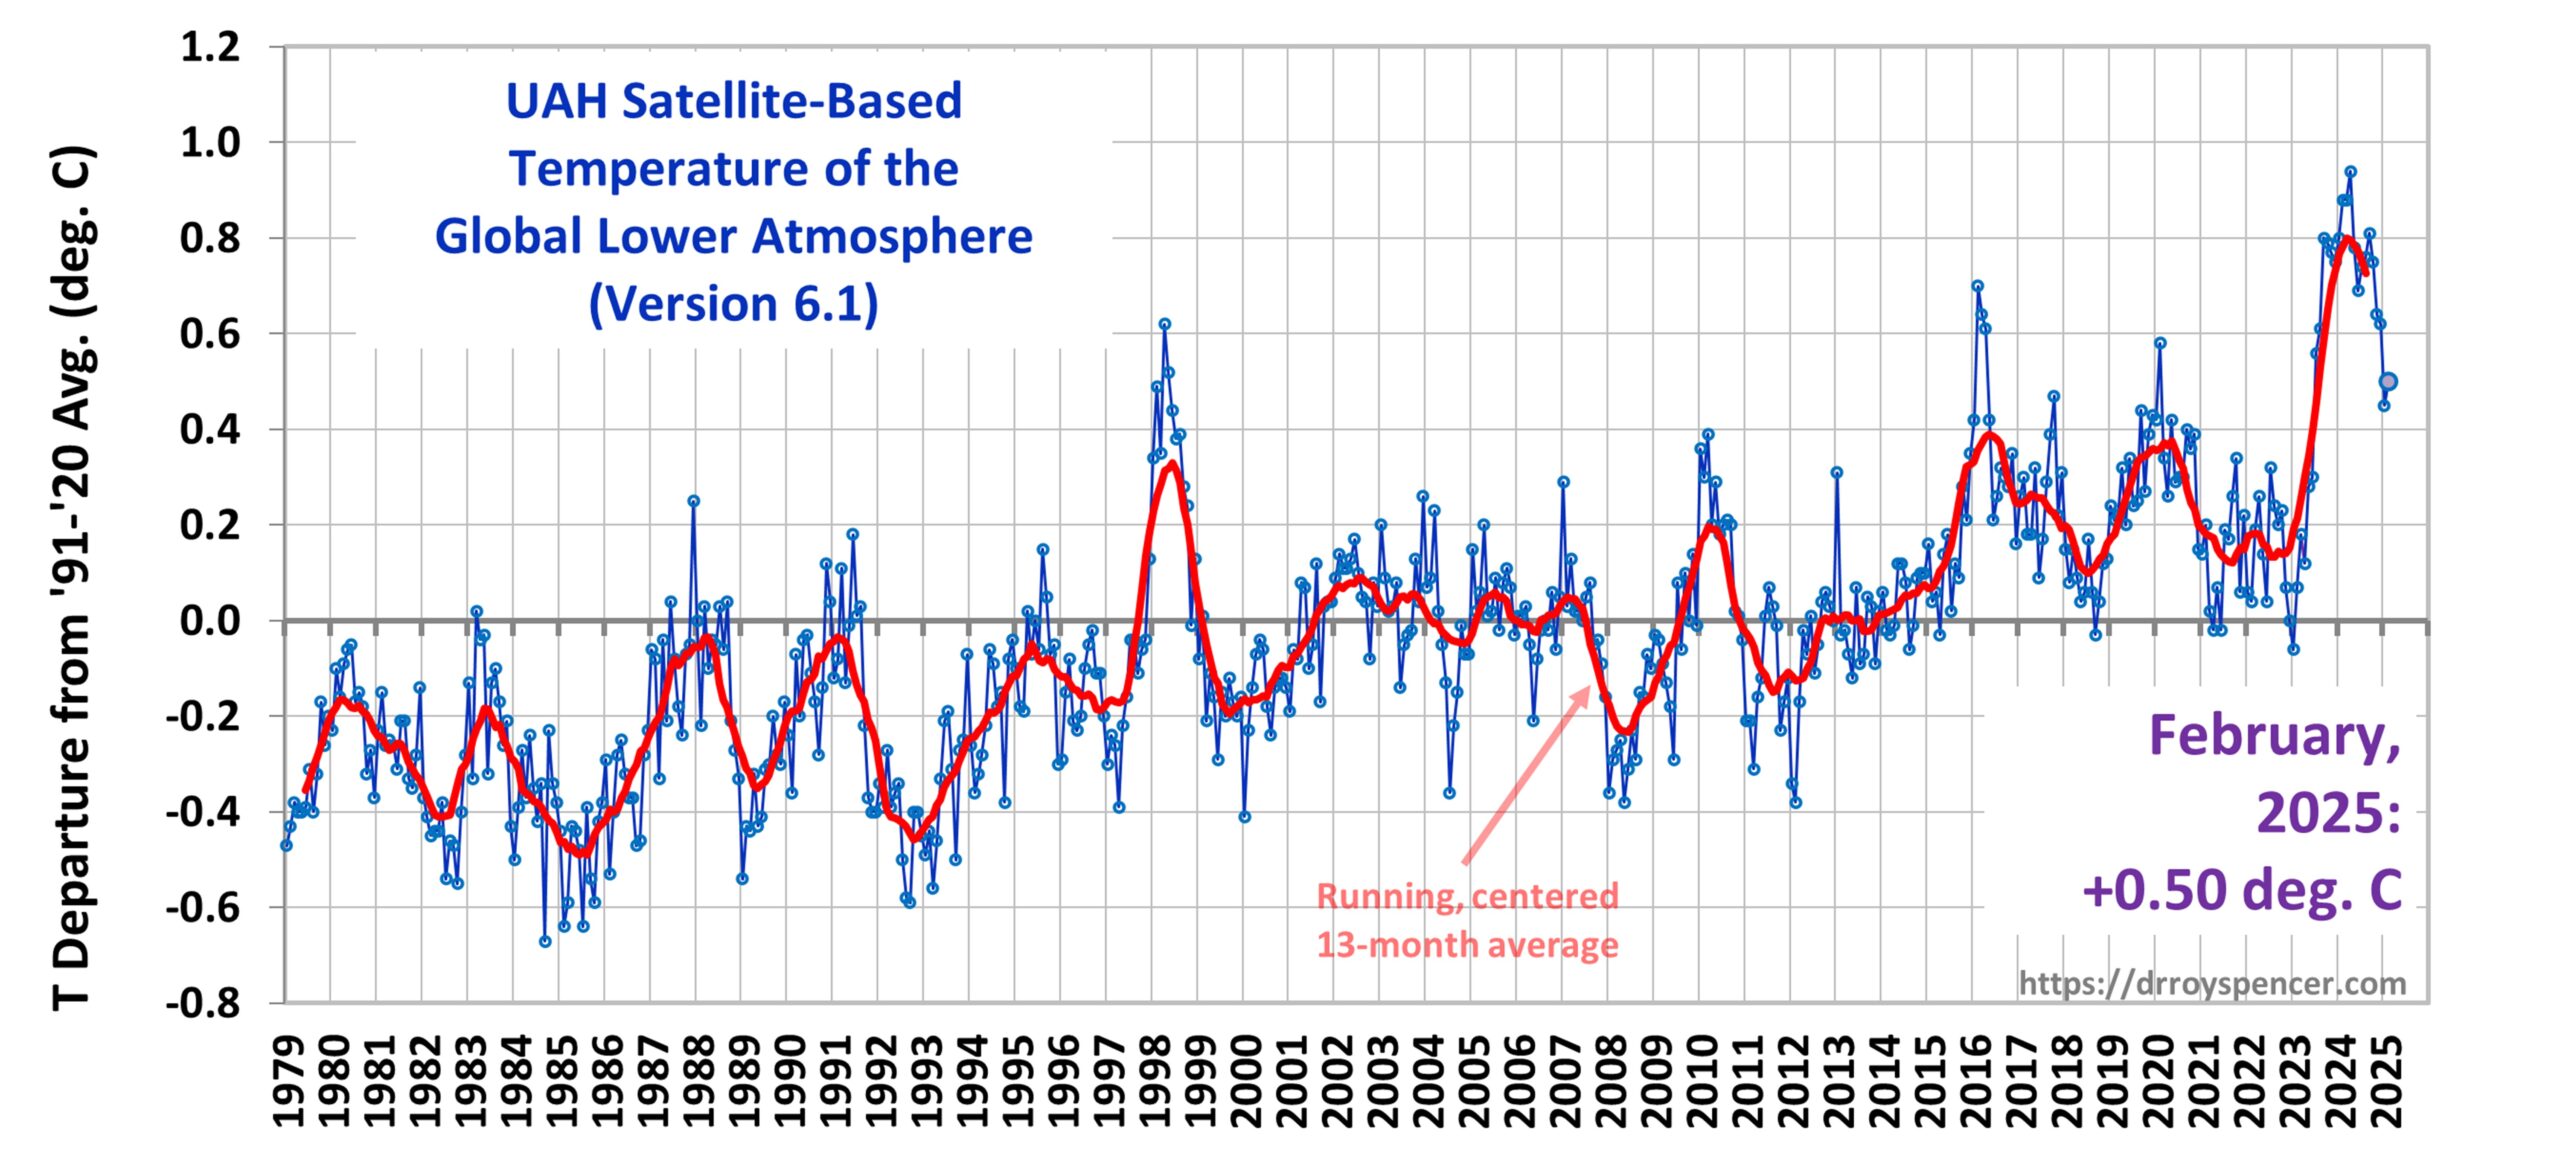
The Version 6.1 global area-averaged linear temperature trend (January 1979 through February 2025) remains at +0.15 deg/ C/decade (+0.22 C/decade over land, +0.13 C/decade over oceans).
The following table lists various regional Version 6.1 LT departures from the 30-year (1991-2020) average for the last 14 months (record highs are in red).
| YEAR | MO | GLOBE | NHEM. | SHEM. | TROPIC | USA48 | ARCTIC | AUST |
| 2024 | Jan | +0.80 | +1.02 | +0.58 | +1.20 | -0.19 | +0.40 | +1.12 |
| 2024 | Feb | +0.88 | +0.95 | +0.81 | +1.17 | +1.31 | +0.86 | +1.16 |
| 2024 | Mar | +0.88 | +0.96 | +0.80 | +1.26 | +0.22 | +1.05 | +1.34 |
| 2024 | Apr | +0.94 | +1.12 | +0.77 | +1.15 | +0.86 | +0.88 | +0.54 |
| 2024 | May | +0.78 | +0.77 | +0.78 | +1.20 | +0.05 | +0.20 | +0.53 |
| 2024 | June | +0.69 | +0.78 | +0.60 | +0.85 | +1.37 | +0.64 | +0.91 |
| 2024 | July | +0.74 | +0.86 | +0.61 | +0.97 | +0.44 | +0.56 | -0.07 |
| 2024 | Aug | +0.76 | +0.82 | +0.70 | +0.75 | +0.41 | +0.88 | +1.75 |
| 2024 | Sep | +0.81 | +1.04 | +0.58 | +0.82 | +1.31 | +1.48 | +0.98 |
| 2024 | Oct | +0.75 | +0.89 | +0.61 | +0.64 | +1.90 | +0.81 | +1.09 |
| 2024 | Nov | +0.64 | +0.88 | +0.41 | +0.53 | +1.12 | +0.79 | +1.00 |
| 2024 | Dec | +0.62 | +0.76 | +0.48 | +0.52 | +1.42 | +1.12 | +1.54 |
| 2025 | Jan | +0.45 | +0.70 | +0.21 | +0.24 | -1.06 | +0.74 | +0.48 |
| 2025 | Feb | +0.50 | +0.55 | +0.45 | +0.26 | +1.04 | +2.10 | +0.87 |
The full UAH Global Temperature Report, along with the LT global gridpoint anomaly image for February, 2025, and a more detailed analysis by John Christy, should be available within the next several days here.
The monthly anomalies for various regions for the four deep layers we monitor from satellites will be available in the next several days at the following locations:


Caused by the Arctic temps.
Yes, the coldest places in the Northern Hemisphere during the coldest time of year continue to warm the most!
Yes, the HTE is still present in the Arctic and northwestern Europe.
That sounds like an excuse used to fit anywhere temperatures are higher than the average.
Hunga induced circulation changes that reduce stratospheric ozone and lower temperatures also play a role in the net forcing. The change in the radiative flux would result in a very slight 2022/3 cooling in Southern Hemisphere. The Hunga climate forcing has decreased to near zero by the end of 2023.
Evolution of the Climate Forcing During the Two Years After the Hunga Tonga-Hunga Ha’apai Eruption, M. R. Schoeberl et al, Journal of Geophysical Research: Atmospheres, v129 i14 Jul 2024.
https://doi.org/10.1029/2024JD041296
Appell,
Tongas climate impact depends on aerosol sensitivity, which remains highly uncertain. This papers timeline is presented as one scenario and there is a range. The current temperature spike is either an anomalous El Nio in amplitude and duration or a major Tonga-driven event, and it breaks the usual Nio 3.4-LT temperature lag relationship. Water vapor, a strong greenhouse gas, likely plays a key role, but also dont forget cloud interactions. The real test is whether this marks a step-change up like 199798 or reverts to pre tonga neutral ENSO like Pinatubos cooling returned the BASELINE. This data could redefine how wet eruptions are modeled in climate science and reduce some of the inherent uncertainty in modeling complex eruptions
What do you think?
Warm Arctic during winter would lead to subsequent cooling globally ccording to Javier Vinos and the Winter Gatekeeper theory.
How can this be? It is chilly at my house all month!
Here in south east Europe as well.
Coldest february since 2012.
Yes this Feb
https://www.wetteronline.de/?pcid=pc_rueckblick_data&pid=p_rueckblick_diagram&sid=StationHistory&diagram=true&iid=10385&gid=10385&month=03&year=2025&metparaid=TNLD&period=12&ireq=true
was a tiny bit cooler than 2024
https://www.wetteronline.de/?pcid=pc_rueckblick_data&pid=p_rueckblick_diagram&sid=StationHistory&diagram=true&iid=10385&gid=10385&month=03&year=2024&metparaid=TNLD&period=12&ireq=true
but Jan was a bit warmer.
*
Here is 2011 to see what was recently really colder
https://www.wetteronline.de/?pcid=pc_rueckblick_data&pid=p_rueckblick_diagram&sid=StationHistory&diagram=true&iid=10385&gid=10385&month=03&year=2011&metparaid=TNLD&period=12&ireq=true
*
And Feb 1956, Jan 1963, Jan 1979, Jan 1986/87 were way, way colder than what we experienced during this recent period:
https://drive.google.com/file/d/1PTd2yfGJd04OosRbFBtbW9XOoFDc2mEY/view
It’s warming in Germany, final point.
4th warmest February, but statistically tied with February 1998. Here are the 10 warmest Febs on record.
2024 0.88
2016 0.70
2020 0.58
2025 0.50
1998 0.49
2010 0.30
2017 0.30
2019 0.21
2021 0.20
2002 0.14
Compared with 2017, the last year following a big El Nino, 2025, this year is 0.2C warmer.
Anything less than 60 years (20 years * 2) is just a statistical anomaly.
…(30 years * 2)…
Tell that to Monckton who will soon be spamming yet another 5 year pause.
Why 60 years?
You don’t need 60 years. You need enough years to determine a statistically significant positive linear trend.
I doubt it will stay like this, but based on the first two month of the year, 2025 is on track to be close to 2023. My current projection is 0.42 +/- 0.18C.
https://i.imgur.com/YTh7YPF.png
Strange how we allow oscillations but not anything around 60 years long.
Go ahead and calculate 60-year trends for any of the records that are at least 60 years old, approximately one complete cycle of the AMO and PDO.
GISS global: +0.19 C/dec
NOAA global: +0.19 C/dec
JMA global: +0.18 C/dec
HadCRUT global: +0.19 C/dec
and so on.
I don’t see Monckton commenting here. Maybe you should wait for him in your bedroom.
A warm planet is a happy planet. 2025 is on track to be a good year.
Amen.
Check in with Carolina to see how their year is going so far.
The new Monckton Pause extends to 20 months and begins in 2023/06. The average anomaly during this period is 0.71 C.
The previous Monckton Pause peaked at 107 months beginning in 2014/06. The average anomaly during this period was 0.21 C. The warming rate since the beginning of the pause is +0.37 C.decade-1.
The leap from the previous pause to the current pause is currently 0.5 C.
silly stuff. bdgwx pays homage to the kind of snippet weather science that has informed his viewpoints.
since he fervently believes that natural weather semicycles don’t exceed 10 years and natural climate semicycles are never less than 50,000 years as stated by an element of mainstream climate science; the so-called Monckton pause is his favorite target to mock.
A ten year semicycle has long been recognized by NASA as a result of the motions of Saturn and Jupiter.
the monckton pause was likely a result of a cooling jupiter/saturn semicycle combined with the lowest energy solar cycle (#24) seen in 100 years. pretty much shattered the endless stream of propaganda that emerges from the science departments of our academic institutions.
but still ignored are longer termed solar cycle variations where high activity solar cycles form groupings of 6 or more cycles. Additionally institutional science also ignores the very interesting 2:1 orbit period ratio of uranus and neptune (84 and 165 years) with the recent completion of ~40 and ~80 year warming patterns as the jupiter and saturn influence also coincided.
kind a malfeasance seen in our national health science efforts. the more money poured into it the worse our national health has become. this is despite many amazing disease cures that have been discovered. waste, fraud, and abuse is obviously rampant. it like how the Soviets went through the Lysenko era bringing tens of millions more deaths to their citizens.
For climate predicting the next 40 years looks to be like the 40 year periods post 1878 and 1944. solar activity isn’t predictable but its worth noting that the 20th century represented unprecedented solar activity never seen before in the human observation of the sun.
Everything bdgwx said is based on Mockton’s metrics. If you have an issue, take it up with Monckton.
Its silly stuff because the ”New Monckton pause” is just made up by those who want to deny natural climate change.
The cause of the old Monckton pause was simply a termination of natural warming in the cycle of the gravitational pull of Jupiter and Saturn working together in a 20 year cycle with the cycle hitting bottom in 2010. That happens regularly during the LIA recovery as a minor shortlived effect that comes and goes over 20 years.
NASA has known about this for decades. Its the basis of modern rocket science when sending out probes of the solar system.
It just happened that in the pause which extended for 17 years instead of the usual 10 years is in 2007 when the 10 year period expired we entered into the extended solar quiet period between solar cycles 23 and 24. That combined with rock bottom occurring at the 10 year interval the warming influence of it didn’t take control again until 2013.
The only time that this doesn’t show up is during the 40s year influences of the outer gas giants as there is an underlying warming that is either an LIA recovery or CO2 emissions or a combination of the two which is even more likely than either of the two alone.
The next 40 years we can expect to be some variation akin to the decades that followed the turn of 19th century (decades leading up and the period from about 1940 to 1980, slightly shortened in effect by the above mentioned underlying LIA recovery/CO2 emissions.
Simple stuff to understand when you look at the solar input numbers. 5 more days languishing close to the sun in our elliptical orbit than when we are furthest.
Even Nate came up with a gravitation solution to the ice age cycles that involve Jupiter and Saturn. But thats short sighted and ignored by our special interest institutions looking for tragedies to fix.
Saturn and Jupiter have a cycle of 900 years where its influence grows and wanes due to changes in the position on the compass relative to the major axis of our orbit. But its not as pronounced as the Neptune/Uranus positional cycle because Jupiter and Saturns positional cycle changes by approximately 1/3 the compass every 20 years and only has only about 120 degrees of variation about 900 years. But the Uranus and Neptune cycle takes about 3,500 years. NASA recognizes the Jupiter and Saturn cycle of 900 years. And it was part and parcel of Nates gravitation model he produced to argue for a 100,000 year eccentricity cycle. But that is an incomplete analysis as the major cycle is around 26,000 years as our orbit semi-major axis completes one revolution in that time.
Its not just billionaires seeking money and power. Its everybody with all sorts of ambitions. . .obviously laid down to the degree of ambition there is in the individual. Folks with little ambition have limited abilities to influence the direction. But only one side is still trying to instigate class and racial 1warfare. . .suggesting that the real peak of the Holocene, or a secondary peak would occur at 13,000 years in or about where we are today.
So its not Monckton pauses in the first place its pauses well understood and labeled decadal step warming while completely avoiding saying what they know about it.
I discovered this 20 year cycle back around 2009 and it wasn’t the first occurrence of it. It occurred with the
“Its silly stuff because the ‘New Monckton pause’ is just made up by those who want to deny natural climate change.”
Well I disagree with your take on cycles, but you’re presenting this to the wrong people. Have a chat with the Viscount, whose ‘Monckton pause’ has been his theme for about 15 years, and he’s presented two of them already.
So do you have a source for that?
That Monckton has banged on about two different “pauses” over many years? Sure.
https://wattsupwiththat.com/2023/02/03/the-new-pause-lengthens-again-101-months-and-counting/
https://wattsupwiththat.com/2013/08/27/the-200-months-of-the-pause/
It’s his cameo gig at WUWT.
“Its silly stuff because the “New Monckton pause” is just made up by those who want to deny natural climate change.”
Are you saying Monckton denies natural climate change? He is the one who made up the new pause. It’s in the title of the first link, one of the many posts he wrote on it.
This is what bdgwx is referring to. You’re welcome.
I explained why there were pauses.
I said these pauses are recognized by NASA, the weather data, and the stuff that Monckton points out. Further the cause of the decadal step pattern is known by NASA but perhaps not you.
I am perfectly aware there is plenty of corrupt special interest institutional information that tries to cast shade on it but none of them have sources or links that supports that shade casting. Apparently neither do you.
I provided these links a few months ago. If you need the links I will happily provide them again.
The most recent pause got cut short by a once every 175 year event of the 4 gas giants clustering in an area of the sky where their combined gravitational forces will slow the fall of the earth toward the sun as the earth moves from aphelion toward perihelion.
Rather than simply elevating warming over the entire year it also gained a shortterm asssist from the planet that has the second greatest gravitational force on earth, Venus, that produced a small peak prior the usual peak of an El Nino.
I suspect that the result over the next few years could cause the lengthening of the original Monckton pause to extend into the 2030’s. We are not done seeing pauses and never have been. Along with that there is the real possibility that previous pauses that we think ended will be found out to have not ended.
I think there is possibility for a record high temperature to occur with a good sized El Nino going forward but I don’t think it will have lasting effects beyond the normal sub-climate length of time of the longer El Nino periods and be gone within a decade. The hard part of determining how much and when climate will naturally change has much to do with feedback periods and possibly the magnitude of effects from CO2.
Bottom line is we won’t see another confluence of the major planets for another 175 years.
When you said, “Its silly stuff because the ‘New Monckton pause’ is just made up by those who want to deny natural climate change” and I showed you that it was Monckton who came up with the “new pause,” you ignored that.
You said, “do you have a source for that?” referring to Monckton going on about the “new pause.” I provided, you ignored.
Not interested in your other babble – and it is babble – when you don’t discuss in good faith, but overlook information that you requested. You waste my time.
barry says:
When you said, Its silly stuff because the New Monckton pause is just made up by those who want to deny natural climate change and I showed you that it was Monckton who came up with the new pause, you ignored that.
You said, do you have a source for that? referring to Monckton going on about the new pause. I provided, you ignored.
Not interested in your other babble and it is babble when you dont discuss in good faith, but overlook information that you requested. You waste my time.
————————
LMAO! How do you manage to ignore so many facts Barry? You apparently have a daddy who manages what you think.
First you didn’t provide a link to your claim that the ”New Monckton Pause” was .5C higher than the previous Monckton pause as you claimed. Its certainly not in the link you provided.
So nothing was overlooked. The spin you guys want to put on the Monckton pause(s) is that Monckton is predicting the end of global warming when he directly says he isn’t in the link you provided.
You simply constructed a strawman that the new Monckton pause was now .5C in bad faith and totally made up as I said as apparently you have no source of that, thus you have not refuted my claim you or other alarmists made up the ”current” Monckton pause. Seems it must be the ”current Barry pause”.
Its typical of your daddy to only dispense facts convenient to your point of view. Obviously you have an undisclosed special interest in all this stuff or you wouldn’t be spewing meaningless pablum about what the ”current” ”New Monckton Pause” level is at.
Then when I point out that NASA recognizes that Saturn and Jupiter have a warming and cooling influence on the planet You want to call that babble and want to hear nothing about it. But its effect can be as much as .5C/decade (limited to an analysis of the past 85 years and its effect is a feature within the uneven pattern of warming seen in the temperature records.
NASA does recognize the effect of Saturn and Jupiter. But they don’t address the effect of Uranus and Neptune which should be a no brainer as gravity is influenced by both the length of a gravity cycle as well as the distance of the planets.
Fact is Uranus and Neptune inflict a speed change on earth as well and when that speed effect gets near maximized which only occurs every few thousand years. Their orbital cycle is 175 years which circles the compass over a period of about 3,500 years. With the compass heading of the orbital cycle being key to the effect of slowing earth through perihelion and speeding it through aphelion.
Each 175 years the orbital cycle advances about 18 degrees on the compass.
and thus the last time we were where we are now was about 1500BC
when according to ice core records it was considerably warmer than today.
The shorter termed cycles on top of this also come out as products orbital cycles of which include ~900 years, 86-88 years, 44 years, 20 years, and 12 years and perhaps others.
But its fine with me if you want to run off with your head in a bag with no eyeholes screaming ”babble”. Be my guest.
“First you didn’t provide a link to your claim that the ‘New Monckton Pause’ was .5C higher than the previous Monckton pause as you claimed.”
I didn’t make that claim. You’re not very good at following the conversation.
As you can’t focus on what you had said, and what I replied to it. I see no point trying to talk with you.
I’m certainly not wasting time with you astrology/climate babble. The other planets do not cause climate cycles on Earth of any significance. The immediate solar and lunar effects completely overwhelm the geological scale perturbations of Jupiter.
You’re off with the pixies, no doubt led astray by a blog or a bad science paper that has no support.
barry says:
”Im certainly not wasting time with you astrology/climate babble. The other planets do not cause climate cycles on Earth of any significance. The immediate solar and lunar effects completely overwhelm the geological scale perturbations of Jupiter.
Youre off with the pixies, no doubt led astray by a blog or a bad science paper that has no support.”
—————-
Not true at all.
As you know the papers I linked to are considered credible. You are just frantically waving your arms trying to discount them. And you are casting them aside without any support whatsoever.
You claim these papers have no support. But you haven’t even named one of them nor have you explained why it allegedly has no support.
The fact is Milankovic did his work in the first half of the twentieth century without the assistance of computers. Its well understood that even computer models haven’t adequately explained climate change using assumptions about CO2 and its feedbacks. Nothing at all fits. As Monckton discussed about his pauses warming is slower than predicted by CO2 models. It also goes through unexplained cycles like the original Monckton pause. Yet CO2 was increasing a relatively steady rate. Why is that? The answer is our institutions are so corrupt they don’t even want to know why and have made no effort at all to explain why. If they actually knew what you claim they know they could explain these multidecadal oscillations that are very apparent in all the instrument and proxy records available.
What good are climate models that can’t explain the variations in climate? The answer is they are junk. Its worse than spending money on transgender monkey experiments. At least there they claim to be looking for answers.
“As you know the papers I linked to are considered credible”
No papers are linked here, bub. How detached from reality are you becoming?
Milankovitch cycles are measured over geological time frames – tens of thousands of years. You’re talking about 20-year cycles due to gravitational perturbations of the other planets – this is where you’re off with the pixies. You won’t find any support for this time in Milankovitch’s works. I’m sure these phantom links of you will materialise in short order…
And thank you for acknowledging it wasn’t me who talked about a 0.5C difference. I really appreciate the honest, candid way you deal with your errors, rather than overlooking them so you don’t have to admit being wrong. It gives me confidence you’re in this because you’re genuinely curious, not because you just want to win the exchange.
Barry why should I acknowledge you didn’t talk about the .5c?
You did talk about it. bdgwx brought it up. I criticized it. bdgwx bailed. And you jumped in and said: ”Everything bdgwx said is based on Mocktons metrics. If you have an issue, take it up with Monckton.”
then you provided some links that don’t support what bdgwx said or your defense of them.
Obviously you operate purely off hearsay, any science paper that disagrees with what your daddy told you is junk automatically without you even reading it. You claim I didn’t provide any links a few months ago when I did as I said. You call the papers I linked to as junk without even knowing what they were apparently. You say there aren’t any natural climate cycles being caused by the planet or are less than 10’s of thousands of years or more because thats what your daddy told you. You have no science paper to support that view point as you just believe what your daddy told you. Talking to you is like talking to bozo the clown.
I’ve read Milankovitch in some detail. You obviously haven’t or you wouldn’t be citing him for orbital perturbations that cause climate change over a couple of decades. The shortest Milankovitch climate period is about 20,000 years. And I now remember that you have made this silly claim before and I called you on it and you still haven’t read Milankovitch to educate yourself.
You again mention links of yours that you haven’t provided. Hello?
Yes, I said that everything bdgwx said IS BASED ON Monckton. And you scoffed that this basis existed. When I showed you it does, you smoothly incorporated that fact into your argument as if you never doubted it. When I told you I did not make any claim about 0.5C, contrary to your assertion, you ignored that, and when called on it pretended the fact that I confirmed the basis for the claim is the same as me making the claim.
Your sophistry is dizzying, bill. But it’s not me who is unable to keep track of the conversation.
Did you even check to see if the newest ‘pause’ bdgwx calculated based on Monckton’s metrics is 0.5C higher than the previous? Here is a little graphic to help you.
https://www.woodfortrees.org/plot/uah6/from:1997.5/to:2015.9/trend/plot/uah6/from:1995/plot/uah6/from:2016/to:2023.8/trend/plot/uah6/from:2023.6/to:2025.3/trend
You may not appreciate bdgwx’s sarcasm, but we all know that the next pause talk will begin before long, and the same tired round will drone on yet again. We all predicted there would be a new ‘pause’ from 2016 as soon as that year’s global temperature peaked. The inanity of this talking point begs a good chuckle.
Barry we already know what bdgwx said. he bailed on supporting his statement. so you being bdgwx’s sock puppet jumped in and claimed. Everything bdgwx said is based on Mocktons metrics. If you have an issue, take it up with Monckton.
you haven’t shown a shred of evidence that you just didn’t make that up. without any support it just goes to show. . .again. . . how unreliable you are.
as to some links of many you can start here. https://www.drroyspencer.com/2024/10/uah-global-temperature-update-for-september-2024-0-96-deg-c/#comment-1690394
notice you even responded to them once again demonstrating what a bozo you are.
The February result seems to validate the January reading. The red line is still moving down. Given the potential for month-to-month variation, this may or may not represent a genuine downward trend. It certainly does not predict the future.
This is a very unusual and interesting period in the satellite record. I am not expecting any news media to claim a cooling trend in the same way they covered the upward movement and the new records.
Cooling trend? Why would they?
ENSO’s effects are known to be temporary. But the strong step-up in sea surface temperature has persisted for 2 years, and even with the La Nina, there has been little sign of it diminishing.
https://climatereanalyzer.org/clim/sst_daily/?dm_id=world2
The statistically significant trend in the UAH record has always been upwards. Because of that every few years we get a record-breaking warm year. And because of that, we have not had a record-breaking cold year for a few decades.
Should we get a record-breaking cold year, or a statistically significant cold trend in UAH, then I am willing to bet with you that it will be reported in the MSM.
But that will be a long time from now, so I am happy to make a bet with you about global warming that is more near term. Unless you are ambivalent about the occasional cooler years (which are expected), and you’re making a noise about nothing at all.
Shall we establish terms?
It’s the Sun, Stupid…
Here is a graph comparing monthly time series for
– the Sun Spot Number
– global temperatures
on the base of percentiles wrt the series’ respective maximum.
For such series with completely different value ranges, this is imho the only valuable comparison method.
https://drive.google.com/file/d/1YanVTQpbOvSxIBkP11-W212twIG_wzZY/view
It’s easy to see that solar activity and global temperatures don’t show any match anywhere.
*
Poeple tried and tried and tried to create this match by shifting the curves according to lags of x, y, z years over 100, 200, 300 years: they never obtained anything explaining the whole.
*
Sources
SILSO
https://www.sidc.be/SILSO/DATA/SN_m_tot_V2.0.txt
HadCRUT
https://www.metoffice.gov.uk/hadobs/hadcrut5/data/HadCRUT.5.0.2.0/analysis/diagnostics/HadCRUT.5.0.2.0.analysis.summary_series.global.monthly.csv
Ah…Binny has replaced Zarakova as an authority on solar activity.
He can’t replace Valentine until his prediction fails miserably and his paper is retracted.
Heh.
Zharkova when publishing by herself slipped in some policy recommendations with her solar predictions.
“This global cooling during the upcoming grand solar minimum 1 (20202053) can offset for three decades any signs of global warming and would require inter-government efforts to tackle problems with heat and food supplies for the whole population of the Earth.”
https://pmc.ncbi.nlm.nih.gov/articles/PMC7575229/
What a multidsiciplinarian…
Ah… Ignoramus Robertson has not a bit of an idea about what is SILSO but of course can’t stop his dumb, useless polemic.
Bindidon: “Its easy to see that solar activity and global temperatures dont show any match anywhere.”
Have you not seem my simple models?
https://github.com/bobf34/GlobalWarming/blob/main/hybridmodel.md
Solar activity information is encoded in the sunspot data, but you’ll never see it by looking at just magnitude of the sunspot number.
Here’s a spreadsheet version.
https://localartist.org/media/SunspotPredictionExcel.xlsx
Typo: Have you not SEEN my simple models?
“And Feb 1956, Jan 1963, Jan 1979, Jan 1986/87 were way, way colder than what we experienced during this recent period:
https://drive.google.com/file/d/1PTd2yfGJd04OosRbFBtbW9XOoFDc2mEY/view
Its warming in Germany, final point.”
——-
A historically cold winter in Europe requires two things:
1. An exceptionally strong, extended blocking high over Greenland (a 180 reversal of the typical Icelandic Low-Azores High pattern):
– This advects the Arctic air over the Norwegian Sea into Europe.
– Halts or reverses the typical zonal westerly flows (which is essential for air from Siberia to retrograde into Europe).
2. Deep, extensive snow cover over Siberia:
– For a robust cold pool to reinforce persistent westward cold air advection
– Stronger pressure gradient force (PGF)
This particular atmospheric setup is quite rare, than that hasn’t stopped Bindi-dingdong trolls from invoking it to support claims of a rapid warming trend. Nevertheless, it did occur in January 1963, leading to one of the coldest winters ever recorded in Europe.
https://journals.ametsoc.org/view/journals/mwre/91/4/1520-0493_1963_091_0209_twacoj_2_3_co_2.xml
As a result of the extreme positive departures near Iceland and low heights in eastern and southern Europe, the northerly flow over northern Europe was strongly augmented, veering to easterly flow over southern and western Europe.
EDIT: rare, though that hasn’t stopped
red…”A historically cold winter in Europe requires two things:”
***
Can we make that three? They had cold winters for the best part of 400 years during the Little Ice Age that ended circa 1850.
How cold? So cold that the Mer de Glace glacier in the French Alps, increased so far it wiped out long-established farms and villages in its path.
The IPCC and their brethern think that cold period happened only in Europe, which conveniently removes rewarming from the LIA as an explanation of current warming.
Based on your info, there would have to have been, over 400+ years…
1. An exceptionally strong, extended blocking high over Greenland (a 180 reversal of the typical Icelandic Low-Azores High pattern):
2. Deep, extensive snow cover over Siberia:
GR, another factor I’d consider would be extensive snow cover over Europe as well, which would enhance radiational cooling and reinforce persistent cold. I recall reading somewhere that Scandinavian blocking was more frequent early in the Little Ice Age, leading to drier conditions – so most of the snowfall would likely have accumulated in the autumn before the blocking became established.
What I find confusing in that scenario is how the jet stream would respond to the disruption caused by two separate blocking highs – one over Greenland and another over Scandinavia.
I repeat for the somewhat opinionated krokodillo
It’s warming in Germany, final point.
Your explanations are 100% correct and were welcome but don’t change anything to what I wrote.
Ok, sorry. My tone was aggressive and unjustified.
” Ok, sorry. ”
Thank you for the convenient reply. Respect.
*
” My tone was aggressive and unjustified. ”
Not in my opinion.
*
And above all… feel free to compare your valuable and meaningful reply to nonsense like this:
https://www.drroyspencer.com/2025/02/uah-v6-1-global-temperature-update-for-january-2025-0-46-deg-c/#comment-1699146
Let me add that when I write it’s warmming in Germany, I don’t look eye-balling at the curve, let alone press any CO2 alarm button.
It’s all in the data I processed (~ 600 stations)
http://opendata.dwd.de/climate_environment/CDC/observations_germany/climate/hourly/air_temperature/
*
Linear estimates in C/decade for anomalies wrt 1981-2010
– 1941-2024: 0.19 +- 0.02
– 1973-2024: 0.48 +- 0.04
– 2000-2024: 0.64 +- 0.12
– 2010-2024: 1.20 +- 0.25
Anyone having sufficient experience can download the data and prove my results wrong.
From your link –
http://opendata.dwd.de/climate_environment/CDC/observations_germany/climate/hourly/air_temperature/DESCRIPTION_obsgermany_climate_hourly_air_temperature_en.pdf
“Data before and including 1980 can reach as best quality check level QN=5. Data after 1980 can reach QN=10 as best quality check level.”
A quality control level of 5 is classified as ‘historic, subjective procedures.’
Given this, aligning pre-1980 data with post-1980 data would not be ideal. The document supports this:
“When using the ‘historical/’ and ‘recent/’ directories together, the temporal overlap must be taken into account and that the type of quality control differs.”
Non-Milankovitch climate cycles may be attributed to many causes which, when a number of these causes coincide, are meaningful. And these attributed causes need to be further attributed themselves, like ENSO, Madden-Julian, Atlantic and Pacific decadals, etc. So gravitational, solar, and cosmic radiation influences can act directly, like soliation, and indirectly, causing fluctuations in deep ocean volcanism and other tectonic events. Then there is man made causes. It seems the heat island effect is the strongest for direct temperature measurements. Last few decades has experienced breathtaking infrastructure building.
SOLAR MINIMUM UPDATE
About 2,000 low-income households in Alabama are poised to lose federal assistance to help them pay high energy bills, under an executive order issued by Donald.
For many of the recipients, the $100 credit had already been applied to their power bill. Now, with the funding removed, that amount will instead be added to their next bill.
https://insideclimatenews.org/news/14022025/trump-takes-back-funds-for-low-income-alabama-electric-bills/
a drop in the Ocean compared to the withdrawal of winter fuel payments for 3 million pensioners in the UK , thanks to our new socialist government.in one of the coldest Autumns and winters for quite some time.
I had a quick look at
https://researchbriefings.files.parliament.uk/documents/CBP-10094/CBP-10094.pdf
*
Let us assume that Labour had been in power for eight years and the Tories returned to govern the United Kingdom after the recent elections.
*
Would you then have also said
” … thanks to our new Tory government in one of the coldest Autumns and winters for quite some time. ”
???
Hmmmh.
It’s a strangely unsocialist policy for a supposedly ‘socialist government’.
SOLAR MINIMUM UPDATE
Today, the Superior Court of the District of Columbia delivered a resounding blow to overreach in the long-running defamation lawsuit brought by climate scientist Michael Mann against conservative commentator Mark Steyn.
https://wattsupwiththat.com/2025/03/04/a-victory-for-free-speech-mark-steyns-1-million-judgment-slashed-to-5000-in-landmark-climate-case/
red krokodile
I apologize for the correction, but it seems to me that you read the WUWT prose a little too quickly or were a little too restrictive in your presentation of it.
*
Here is what I miss in your comment.
1. ” Back in February 2024, a D.C. jury awarded Mann a symbolic $1 in compensatory damages and slapped Steyn with a jaw-dropping $1 million in punitive damages, alongside a similar $1,000 penalty for Rand Simberg of the Competitive Enterprise Institute (CEI). ”
The WUWT head post actually wrote also this:
” In a Final Judgment Order, Judge Alfred S. Irving, Jr. reduced Steyns punitive damages… ”
*
I, of course, welcome the comprehensive correction of the appalling verdict of the jury in D.C.!
But with the Supreme Courts decision, Steyn has finally lost his case.
Freedom of speech should not make you poor, that’s perfectly fine, but abusing it will still cost you a lost lawsuit and… a little (!) money.
Ref our earlier conversation,you were complaining about the loss of monies to a few thousand people,i refered to the loss of a winter fuel payment to 3 million people,which just happened to be one of the first things the Labour government did,we are now into March and temperatures are still below average , as for the Tories,can you imagine the howls from the trade unions and other Labour lackeys, if they had done that,three weeks after saying the winter fuel payment was safe,
Ian Brown
” Ref our earlier conversation,you were complaining about the loss of monies to a few thousand people… ”
No I wasn’t. That was in your eyes… commenter Willard.
red…”GR, another factor Id consider would be extensive snow cover over Europe as well, which would enhance radiational cooling and reinforce persistent cold”.
***
Red..I can see that explanation over a few months, or even a few years, but not over 400+ years. The Vikings had thrived in Greenland circa 1000 AD, during the Medieval Warm Period, but suddenly evacuated Greenland by 1300 AD. Was it coincidence that the LIA is estimated to have begun around that time?
Peaks of cold in the LIA were noted at the time of the Maunder (1645 – 1715) and Dalton (1790 – 1830) minima. If the cooling is related to solar activity, which seems likely, why is the LIA claimed to have begun circa 1300 AD, about 300 years before either minima, there must have been another minimum or cause that was missed.
Anyway, it’s clear that the planet began rewarming following the Dalton minimum, and as Syun Akasofu claimed, the IPCC erred by omitting rewarming from the LIA in their assessment.
I’ll go one further, the IPCC have tried to cover up the truth by claiming the LIA applied only to Europe. There is plenty of proxy and eye-witness evidence to prove otherwise, that the cooling was global.
On the Thames River, at London, between 1600 and 1800, the ice was so thick (11 inches) it supported frost fairs on the ice itself. It has been reported that the oceans itself froze solid off the coasts of England and Europe for miles that it caused problems for shipping.
That’s cold in anyone’s books, when salt water freezes solid. I doubt that atmospheric events in the locality of Europe were responsible, even if what you report is of interest.
Gordon,
The specifics of atmospheric circulation during the Little Ice Age are beyond my training, though I may look into it more later.
I agree with your argument that the Little Ice Age was not confined to Europe. I think you would find this paper interesting:
https://www.mdpi.com/2225-1154/11/3/71
The study explores the role of harsh climate conditions in the fall of the Ming Dynasty in 1644, while also critiquing simplistic cause and effect models that attribute the collapse solely to climate. And it contains references suggesting that the late 16th century (coinciding with the Maunder Minimum) was the coldest period in Chinese history.
an abrupt cooling about 1500bc, (the neoglacial). had a profound effect in North Africa and South Asia, the Sahara became dryer and less fertile,in Asia, wind shifts changed monsoon patterns and turned the Indus valley into what is now the Thar desert. in Europe glaciers advanced into the valleys in Alpine regions, in the UK glaciers began to reform in Scotland and Northern England, glaciers also advanced in North America and the Andes, all glaciers that exist today south of a latitude parralel with the Canadian border, are remnants of that time. Cambridge University has a wealth of papers and literature by people such as Edward Simone, Prof Gordon Manley,Prof Hubert Lamb,and many many more, the archives contain climate records going back to 12000bc,and written discriptions of weather events beginning with the first Roman invasion of Britain.in one reference to the LIA they record one winter with the ground in Somerset frozen solid to a remarkable four feet in depth.and another mentioned the great Tudor heatwave and drought,1538/41.so before we worry about a 1.5c increase since 1850. we should be gratefull it is not a 1.5c decrease since 1850.and all the pain and suffering that would bring.
The LIA and MWP were likely global, but even on 900-year time scales, the global effects are not likely to be identical. In some latitudes a 1500-year cycle is also influential.
That said, the driver of climate is the Jovian planets. I think that this is most likely through modulation of Solar activity as I can show the influence of the Jovian planets on time scales down to a few years — without using my sunspot-based model.
Here’s a spectrum I computed of the GISP2 ice core temperature reconstruction. The 900-year cycle can be found in the orbits of Jupiter and Saturn. The 1500-year cycle involves Neptune and/or Saturn. Because of how the ice-core data is sampled, the spectrum data is questionable above a frequency of 0.2 yr^-1.
https://localartist.org/media/BarySpectrum2.png
Here’s the 900-year cycle on Jupiter’s orbit. Notice how it’s fading as we head into the next glacial period? Coincidence?
https://localartist.org/media/Jupiter900V2.png
Why can’t I see typo’s until I press submit? Grr.
The 1500-year cycle involves Neptune and/or URANUS.
Why does climate care about the sun barycenter?
Why does the sun move around the barycenter?
So you have no answer?
BTW the Earth orbits the Sun, not the barycenter.
Gravitational forces accelerate the sun around the solar system barycenter. Those forces in turn modulate solar activity which can be detected in both modern temperature records for cycles with shorter periods, as well as temperature reconstructions and other proxies for longer periods — as I have shown.
BTW, Galileo’s telescope observations of the phases of Venus proved that the earth revolved around the sun and validated Copernicus heliocentric empirical model. Observations are important. Too bad that many think climate revolves around man.
‘Why does climate care about the sun barycenter?’
Earth is closer to the sun during parts of its orbit than it is when Sun is closer to center of system. So there is a warming cycle in the climate.
‘Why does the sun move around the barycenter?’
The barycenter is largely due to influence of gas giants Jupiter Saturn Neptune Uranus on the sun. When all the gas giants are in one quadrant (as now) the gravitational pull means the influence on the barycenter is more or less in one direction and is at peak.
‘BTW the Earth orbits the Sun, not the barycenter’
A simple explanation that excludes the influence of the other planets – Earth orbits the barycenter, which is a point in space near the sun. The barycenter is the center of mass of the Earth and the sun, and is the point around which they both orbit.
https://commons.wikimedia.org/wiki/File:Solar_System_Barycenter_2000-2050_Animation.gif
“Earth is closer to the sun during parts of its orbit than it is when Sun is closer to center of system. So there is a warming cycle in the climate.”
False.
Not how it works, Ken. The Earth orbits the sun, not the barycenter.
“Gravitational forces accelerate the sun around the solar system barycenter. Those forces in turn modulate solar activity”
Not aware of that effect Robert. Do you have a source to support that claim?
Nate: “Not aware of that effect Robert. Do you have a source to support that claim?”
I’m working on a paper now. What I’ve discovered after figuring out why my sunspot-based model works is new, even though the concept is not.
My findings are different than what’s in this paper, but there are some similarities.
The Planetary Theory of Solar Activity Variability: A Review
Scafetta and Bianchini 2022
doi: 10.3389/fspas.2022.937930
In the GISP2 spectrum plot above I showed the longer cycles compared to acceleration. In Fig 6 A&B of the paper, you can see something similar comparing velocity to temperature. It shows the 61-year cycle, a Jupiter-Saturn 20-year cycle, and a 14-year cycle which is also related to Jupiter and Saturn.
Nate
This is from NASA
“Planets and stars actually orbit around their common center of mass.”
“Our entire solar system [sic] has a barycenter. The sun, Earth, and all of the planets in the solar system orbit around this barycenter.”
See the full article here: https://spaceplace.nasa.gov/barycenter/en/
I won’t festoon this thread with politics, but we have reached an all-time low in the US presidency.
Trump has suspended intelligence sharing and military aid to Ukraine.
This is coercion. Blackmail. Trump is ransoming Zelensky with the lives of his people, and now is materially helping Russia in the war, because Zelensky wouldn’t sign away his people’s national resources without bringing them a security guarantee. Likely Trump is also punishing Zelensky on a personal level.
Regardless of the motive, the immorality of this heinous ‘tactic’ is absolutely repulsive.
Yep, with Trump his tantrums become policy. And his team members like Rubio fundamentally disagree, but are too scared to speak their mind.
Yes barry, the Trumping boy is a disgusting, cowardy person.
*
And he has a lot of admirators everywhere…
After Jacinda Ardern’s resignation due to burnout after 6 years, it was evident that her Labour party would lose the next elections in New Zealand because of Ardern’s unprecedented popularity.
Then came Luxon (New Zealand National Party), which radically changed New Zealand’s political direction in every conceivable area.
*
So it was no wonder for me to read today that NZ’s government sacked Phil Goff, NZ’s ambassador to UK, after he questioned Trump’s grasp of history.
*
What poor, boot-licking and sycophantic people.
Exactly what the Trumping boy loves and needs, however. Not only at home.
Good.
You think threatening Zelensky with harm to his people is legitimate diplomacy?
You don’t deserve democracy.
Michael Mann claims Republicans are an existential threat in a recent interview:
https://www.hopiumchronicles.com/p/my-interview-with-dr-michael-mann
Michael Mann has been given promotions/awards by:
– The American Geophysical Union
– National Academy of Sciences
– Royal Society
Your point?
FYI, a half hour video isn’t going to get much interest. At least give a timestamp for the reference.
I was just curious what people thought about the video.
SOLAR MINIMUM UPDATE
Canada, China, and Mexico are among Alabama’s top five trading partners in terms of imports and exports. In 2024, Alabama exported $375 million in goods to Canada, $329 million to Mexico, and $325 million to China. During the same year, Alabama imported $465 million worth of goods from Mexico, $319 million from China, and $367 million from Canada, the OEC says.
The top exports include cars, aircraft, and motor vehicle parts and accessories. During car production, these parts are frequently shipped in and out of Alabama until the vehicle is completed. With the new tariffs, we expect the cost of car manufacturing to increase, which will likely raise the price of buying a new car.
https://www.usatoday.com/story/news/2025/03/04/president-trumps-tariffs-could-make-big-impact-on-alabama-car-manufacturing-exports-imports/81342208007/
Trump 2020: “The USMCA is the fairest, most balanced, and beneficial trade agreement we have ever signed into law. It’s the best agreement we’ve ever made”
https://trumpwhitehouse.archives.gov/briefings-statements/remarks-president-trump-usmca-celebration-american-workers-warren-mi/
Now he is violating his own agreement because it’s so unfair.
It’s amazing to think people credit this absolutely transparent huckster.
The only hucksters around are leftists like you, from countries that have swung so far left they make China blush, who come on here and try to influence American politics. What is it? Misery loves company?
What has my country got to do with Trump violating his own trade agreement? Let me think. Oh yeah, nothing.
I guess when you can’t defend the indefensible you try and have silly digs at people.
Point is, Trump is now saying the trade agreement he authored and said was the best ever, is unfair, and that is why he is violating it.
If you can’t see the huckster in that blatant self-contradiction then you’d better stick to whining about what other people say.
Your leader is a feckless thug.
barry
” The only hucksters around are leftists like you… ”
*
It is always astonishing to be called a “leftist” by someone who also calls dictators like Pinochet or Videla “leftists”, even though these two were responsible between 1973 and 1980 for the murder of tens of thousands of (real) leftists. About 3,000 of them were flown across the Atlantic from Argentina and dropped alive from the planes.
*
This is typical of people with ultra-right views.
*
Even Alice Weidel, co-leader of the German ultra-right AfD party, dared to call Hitler a ‘communist’ in a conversation with the ultra-right billionaire Musk, which, however, earned Weidel a harsh scolding from one of the AfD founders.
Between 1933 and 1945, Hitler, Goebbels and SS Oberfhrer Himmler murdered in addition to 6 million Jews almost a million communists, socialists, social democrats and Christians.
For most American conservatives, anyone who disagrees with them or their politicians is a socialist. They have no idea, just a label to stick on their opponents whenever they don’t want to think too hard, which is often.
Help, I fell and can’t post
red…”I was just curious what people thought about the video”.
***
Could not bring myself to watch a video featuring Mann. Just looking at his over-fed face gives me hives and looking at him and listening to his bs is cruel and unusual punishment for me. Not being a masochist, I avoid anything to do with Mann.
What turned me right off with the clown was his misogynist shots at Judith Curry, simply because she changed sides. I have never seen anything from him that even comes close to hard science.
I see what you mean, Gordon.
Mann and the interviewer really leaned into the idea that skepticism (whether in climate science or fields like immunology, where Mann compared himself to Peter Hotez) is inherently ideological and anti-science, which seems like a dramatic oversimplification.
I understand that politics can influence how people view climate change, but there are skeptics, like you and RLH, who don’t fit neatly into that narrative. You’ve both been openly critical of the Trump administration, yet that nuance gets ignored.
I’ve also had polite disagreements with you on vaccines. I fully support their role (provided they are safe) as essential tools in controlling dangerous epidemics, whereas you’ve emphasized the role of improved hygiene practices over widespread immunization.
It’s just odd that someone with Mann’s background wouldn’t acknowledge how complex bias really is.
red…”Mann and the interviewer really leaned into the idea that skepticism (whether in climate science or fields like immunology, where Mann compared himself to Peter Hotez) is inherently ideological and anti-science, which seems like a dramatic oversimplification”.
***
Mann is a legend in his own mind. His views on skepticism align with the new politically-correct propaganda that anything that disagrees with the status quo opinion is misinformation.
Example. When the mRNA so-called vaccine was issued, claiming to cure a covid infection, Dr. Robert Malone, an expert in mRNA technology claimed that an mRNA-based solution could not prevent infection, as was being claimed. His views were immediately branded as misinformation and he was generally banned from the main-stream media.
Malone was proved correct. After people had been injected with the 2nd dose here in Canada, 70% of new infection that required hospitalization were people who had been doubly injected.
The question arises as to who is running the medical community, researchers or the media? When HIV was first claimed to be discovered, the wording was ‘HIV, the virus THOUGHT to cause AIDS’. The media slowly converted that correct statement to ‘HIV, the AIDS virus’.
Then there is the comment by climate modeler Stephen Schneider. He queried whether or not scientists should use the media to lie about theories like climate change. His justification for lying was the politically-correct meme, ‘for the good of the public’.
***
“Ive also had polite disagreements with you on vaccines. I fully support their role (provided they are safe) as essential tools in controlling dangerous epidemics, whereas youve emphasized the role of improved hygiene practices over widespread immunization”.
***
I don’t have a position on the effectiveness of vaccines. I don’t know either way. However, I am willing to support the view that an effective proof has not been supplied to corroborate the use of vaccines as opposed to other factors which have been dismissed out of hand.
The popular hypothesis is that certain diseases have been eradicated using vaccines. There is adequate evidence that polio has always appeared and disappeared on its own. In fact, the peak period for polio was circa 1910, whereupon it went away by itself. There is evidence that Salk’s polio vaccine was introduced when polio was on the wane.
We need to look at the causes of polio between 1910 and 1950s when the vaccine was introduced. There definitely were major hygiene issues, in part, due to two major wars. Also, in the UK, as I have pointed out, there were major health issues in major cities due to a sheer lack of sanitation.
This applies to modern claims re the swine and bird flu. The animals are kept in horrendous, filthy conditions, and when they get sick, the cause is claimed to be a virus. Not a shred of evidence that a virus is involved.
In the southern states of the US, a pellagra outbreak occurred circa 1915 and the cause was hypothesized to be bacterial or viral for some 30 years, even though a health worker sent to investigate immediately reasoned the cause appeared to be diet-related. His views were dismissed till the 1940s, when the B-vitamin whose deficiency causes pellagra, was discovered. So, it was diet-related and 30 years was wasted following a dead end related to a virus.
It’s plain that prior to the 1950s we were living in a relative dark-ages of medicine. In particular, viral research was in the dark ages. In 1935, a prominent researcher claimed that viral theory did not meat the basis rues of Koch’s hypothesis.
So, what changed post-1950s? Nothing really, with the exception of the discovery of the DNA molecule. That discovery started a plethora of opinions, some of which are currently used to hypothesize a virus, where no direct physical indication of a virus is available.
Meantime, Dr. Stefan Lanka has set the world of virology on its head. He has become so dangerous to the virology theories that he is attacked via ad homs and insults, with no evidence being provided to contradict him.
Lanka has gone so far as to offer a 100,000 Euro prize for anyone who can provide a paper with objective proof, in one paper, that the measles virus has been isolated. He was challenged by an upstart (Bardens) who was awarded the prize based on an egregiously incorrect appraisal of Lanka’s stipulations by a lower German court.
Upon review by a higher court, the lower court decision was reversed. The plaintiff challenged the higher court decision and he lost that too. One of our alarmists here, Binny, thinks the plaintiff’s appeal somehow means something, the point being that Lanka’s claim of no proof for the measles virus has been upheld by a higher German court.
The case in the higher court allowed Lanka to present an astounding find. He claimed that none of the modern viruses had been physically isolated and that none of the experiments used a control group. He subsequently proved, using an independent lab, that any cells used in the experiments would have died on their own due to the treatment they received in a lab.
That is major. Healthy cells claimed to have been killed by a virus would actually have died on their own due to pre-treatment in the lab.
In light of that finding, we need to go back and verify every virus claimed and to prove that any vaccine used to combat them is effective.
SOLAR MINIMUM UPDATE
[Elon]’s DOGE purge now includes the building housing the historic Freedom Rides Museum in Montgomery.
https://www.alreporter.com/2025/03/06/historic-montgomery-bus-station-freedom-riders-museum-part-of-doge-ordered-sell-off/
stephen…”The only hucksters around are leftists like you, from countries that have swung so far left they make China blush…”
***
Stephen…don’t know where you live in the States but why don’t you visit Vancouver sometime and I’ll be glad to show you around our left wing system first hand. I can assure you that you won’t notice much difference between here and the States with the exception of…
1)you can walk around our city at night (and day) with little fear of being mugged. I was at a telecommunications symposium years ago and all the Yanks commented on the freedom they enjoyed walking around our city late at night.
2)If you get sick here and don’t have insurance, you’ll have to pay but you won’t get ripped off the way you will in the US. Trump recently claimed that Canada joining the US would provide us with better medical care. When I stopped laughing I had to shake my head a few times. He is talking about the treatment offered his wealthy buddies not the US citizens turned away from hospitals because they don’t have medical insurance.
Remember the time he claimed US citizens should get their pharmaceutical drugs from Canada because they are cheaper here.
A friend recently went to an ER in the States with pain. He was given an MRI and the total came to $30,000 US. Luckily, he had travel insurance and the insurance company managed to reduce the cost to about $18,000 US. $12,000 US is an incredible fudge factor for an MRI and basic ER care.
I mean this in a kind way but you guys in the US are totally misinformed about life in Canada. Trump is increasing the misunderstanding with his stoopid comments about Canada. The Wall Street Journal wrote an op ed claiming his tariffs are stoopid.
His claim about our border and fentanyl are totally bogus. He could not pass his tariff nonsense without an excuse that threatened the US, hence the security/fentanyl ruse.
Also. many Yanks are under the wrong impression re the Twin Tower catastrophe. They are under the impression the terrorists entered trough Canada. Bullfeathers!!! They were already in the US for months on visas issued by the US and they were taking lesson on flying passenger jets.
Unless you are extremely wealthy, Trump is no friend of yours. His entire agenda is aimed at the wishes of his wealthy buddies.
yb6t7w
On the media and its distortion of climate science: https://medium.com/the-environment/latest-study-confirms-two-things-the-atlantic-current-is-weakening-and-words-shape-reality-dae33c8c9cae
5 years ago today, the WHO declared COVID-19 a pandemic
https://www.npr.org/2025/03/11/nx-s1-5323221/5-years-ago-today-the-who-declared-covid-19-a-pandemic
stephen,
did you see Trump and Musk on the Whitehouse grounds with a bunch of Teslas lined up, with Trump spruiking them and even announcing he was buying one?
If you can’t see what a grifting, huckster sales pitch this is on the taxpayer’s dime, then there is no hope for you.
After Trump promised Musk would be removed from any DOGE activities that conflicted with his businesses.
No worries, we’ll just do a Tesla ad at the Whitehouse together, buddy!
How blatant does it have to be before you realize how little they care for proceeding with any integrity or constitutional fidelity as the billionaire club runs the presidency?
The billionaire club runs the presidency, has that not always been the case?. the Kennedys were hardly paupers.
Indeed, they were anything but beggars, but… the Kennedy clan had nothing in common with the Trumping boy and his Muskito in any respect or area – neither socially, politically, economically nor financially.
Global for Feb 2025
https://climatedatablog.wordpress.com/2025/03/18/uah-mean-and-median-global-for-feb-2025/
Tropics for Feb2025
https://climatedatablog.wordpress.com/2025/02/21/uah-mean-and-median-tropics-for-jan-2025/
SOLAR MINIMUM UPDATE
In February, Bradley Bartell and his wife Camila Munoz, a Peruvian national, went on their honeymoon in Puerto Rico. When they returned to the mainland, immigration officials asked Munoz about her legal status. She reportedly replied that she was not a citizen and was in the process of obtaining a green card. Munoz was detained and sent to a facility maintained by Immigration and Customs Enforcement in Louisiana.
https://www.mediaite.com/trump/trump-supporter-still-backs-president-after-ice-arrests-wife-i-dont-regret-the-vote/
Three cheers for the Louisiana economy!
UAH 6.1 LT with cascaded triple running means and… correct medians
https://docs.google.com/spreadsheets/d/174CxYCkDKfQMUhAR4TnWXeKj58yhIiCYvCOF4koSfec/edit?gid=447018934#gid=447018934
There was no reply to this comment:
https://www.drroyspencer.com/2025/02/uah-v6-1-global-temperature-update-for-january-2025-0-46-deg-c/#comment-1699331
Still with your high frequency leak through. Typical in all your charts.
” Still with your high frequency leak through. Typical in all your charts. ”
*
Again you discredit and denigrate what I do with a couple of condescending words only – no technical let alone scientific proof.
Blindsley H00d, you behave exactly like Robertson: you never admit your mistakes.
And above all, you are still unable to present us a triple cascaded 60 month running median based on Vaughan Pratt’s coefficients. That tells us all we need.
Your median computation is wrong; I have proved this with an Excel comparison of cascaded running means and medians based on exactly the same model presented by Greg Goodman on Judith Curry’s blog 12 years ago.
How is it possible to be such a coward?