YR MON GLOBE NH SH TROPICS
2009 1 0.252 0.472 0.031 -0.065
2009 2 0.247 0.569 -0.074 -0.044
2009 3 0.191 0.326 0.056 -0.158
2009 4 0.162 0.310 0.013 0.012
2009 5 0.140 0.160 0.120 -0.057
2009 6 0.044 -0.011 0.100 0.112
2009 7 0.429 0.194 0.665 0.507
2009 8 0.242 0.229 0.254 0.407
2009 9 0.504 0.590 0.417 0.592
2009 10 0.361 0.335 0.387 0.381
2009 11 0.479 0.458 0.536 0.478
2009 12 0.283 0.350 0.215 0.500
2010 1 0.649 0.861 0.437 0.684
2010 2 0.603 0.725 0.482 0.792
2010 3 0.653 0.853 0.454 0.726
2010 4 0.501 0.796 0.207 0.634
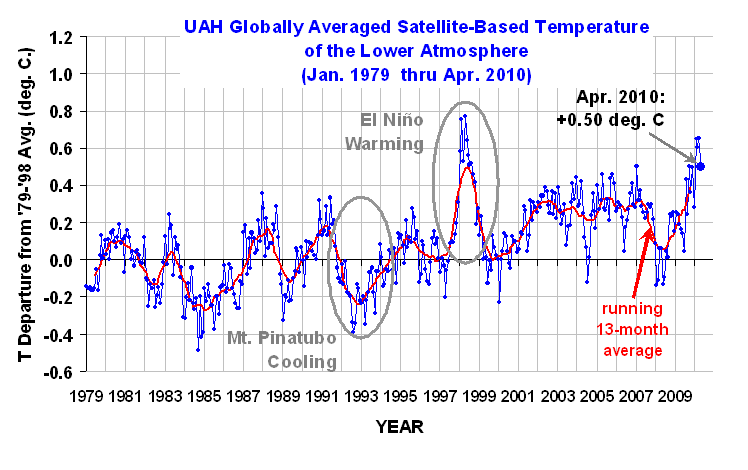
The global-average lower tropospheric temperature continues warm: +0.50 deg. C for April, 2010, although it is 0.15 deg. C cooler than last month. The linear trend since 1979 is now +0.14 deg. C per decade.
Arctic temps (not shown) continued a 5-month string of much above normal temps (similar to Nov 05 to Mar 06) as the tropics showed signs of retreating from the current El Nino event. Antarctic temperatures were cooler than the long term average. Through the first 120 days of 1998 versus 2010, the average anomaly was +0.655 in 1998, and +0.602 in 2010. These values are within the margin of error in terms of their difference, so the recent global tropospheric warmth associated with the current El Nino has been about the same as that during the peak warmth of the 1997-98 El Nino.
As a reminder, two months ago we changed to Version 5.3 of our dataset, which accounts for the mismatch between the average seasonal cycle produced by the older MSU and the newer AMSU instruments. This affects the value of the individual monthly departures, but does not affect the year to year variations, and thus the overall trend remains the same as in Version 5.2. ALSO…we have added the NOAA-18 AMSU to the data processing in v5.3, which provides data since June of 2005. The local observation time of NOAA-18 (now close to 2 p.m., ascending node) is similar to that of NASA’s Aqua satellite (about 1:30 p.m.). The temperature anomalies listed above have changed somewhat as a result of adding NOAA-18.
[NOTE: These satellite measurements are not calibrated to surface thermometer data in any way, but instead use on-board redundant precision platinum resistance thermometers (PRTs) carried on the satellite radiometers. The PRT’s are individually calibrated in a laboratory before being installed in the instruments.]

 Home/Blog


