YR MON GLOBE NH SH TROPICS
2009 1 0.251 0.472 0.030 -0.068
2009 2 0.247 0.565 -0.071 -0.045
2009 3 0.191 0.324 0.058 -0.159
2009 4 0.162 0.315 0.008 0.012
2009 5 0.139 0.161 0.118 -0.059
2009 6 0.041 -0.021 0.103 0.105
2009 7 0.429 0.190 0.668 0.506
2009 8 0.242 0.236 0.248 0.406
2009 9 0.505 0.597 0.413 0.594
2009 10 0.362 0.332 0.393 0.383
2009 11 0.498 0.453 0.543 0.479
2009 12 0.284 0.358 0.211 0.506
2010 1 0.648 0.860 0.436 0.681
2010 2 0.603 0.720 0.486 0.791
2010 3 0.653 0.850 0.455 0.726
2010 4 0.501 0.799 0.203 0.633
2010 5 0.534 0.775 0.292 0.708
2010 6 0.436 0.550 0.323 0.476
2010 7 0.489 0.635 0.342 0.420
2010 8 0.511 0.674 0.347 0.364
2010 9 0.603 0.556 0.651 0.284
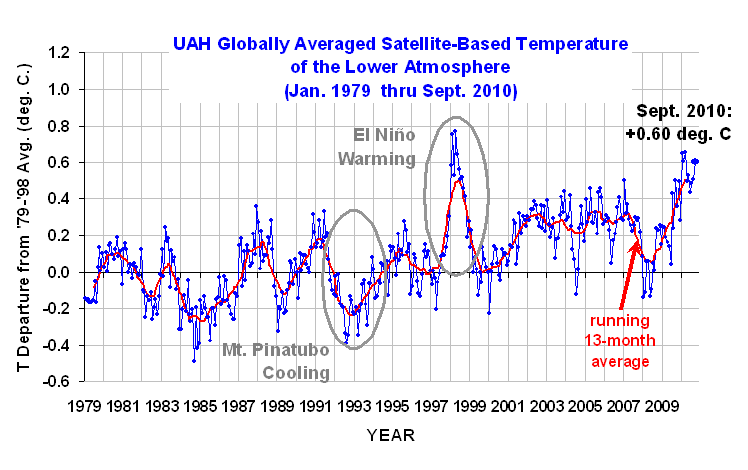
Despite cooling in the tropics, the global average lower tropospheric temperature anomaly has stubbornly refused to follow suit: +0.60 deg. C for September, 2010.
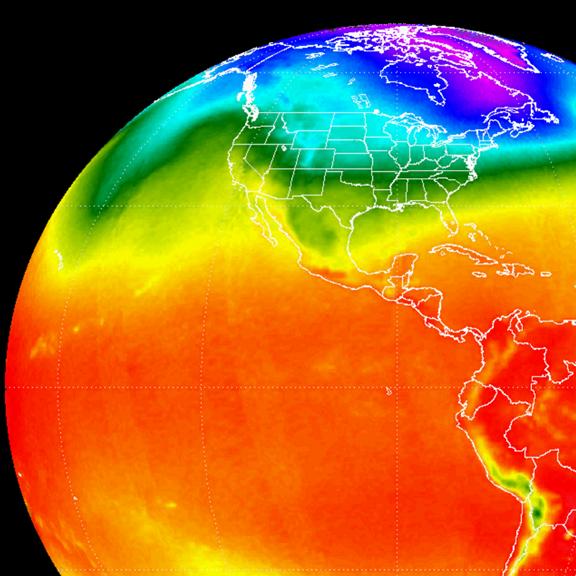
Since the daily global average sea surface temperature anomalies on our NASA Discover web page have now cooled to well below the 2002-2010 average, there remains a rather large discrepancy between these two measures. Without digging into the regional differences in the two datasets, I currently have no explanation for this.
For those following the race for warmest year in the satellite tropospheric temperature record (which began in 1979), 2010 is slowly approaching the record warm year of 1998. Here are the 1998 and 2010 averages for Julian Days 1 through 273:
1998 +0.590
2010 +0.553
[NOTE: These satellite measurements are not calibrated to surface thermometer data in any way, but instead use on-board redundant precision platinum resistance thermometers (PRTs) carried on the satellite radiometers. The PRT’s are individually calibrated in a laboratory before being installed in the instruments.]
 |

 Home/Blog


