Yesterday I posted time series since 1987 of global average oceanic water vapor, surface wind speed, cloud water, and rain rate from the SSM/I and SSMIS instruments. Those plots show the global-average influence of El Nino and La Nina activity.
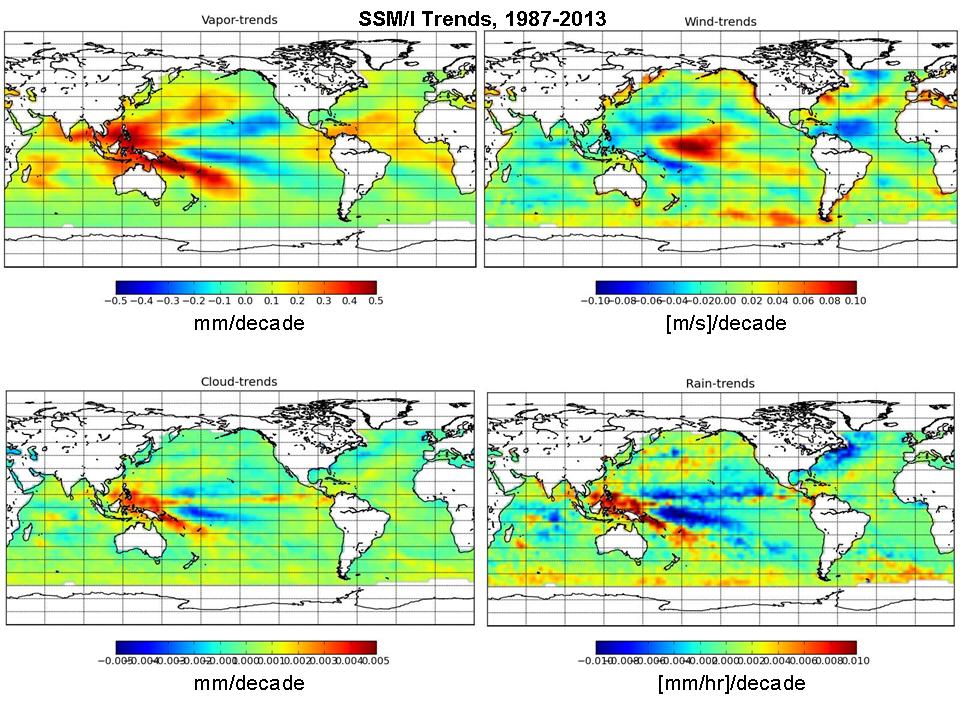
Today I will show the gridpoint linear trends from those products for the period July 1987 through last Saturday (21 September 2013). The first one (upper left corner) is similar to the one Frank Wentz has at the Remote Sensing Systems website, and shows gridpoint trends in vertically integrated vapor since July 1987 (click for large version):

The major patterns shown in these plots are classic La Nina-type patterns, with atmospheric moisture being pushed more towards the western Pacific basin in recent years. The trends reflect the change from stronger El Nino activity over the first ~2/3 of the SSM/I period of record to more La Nina type activity recently.
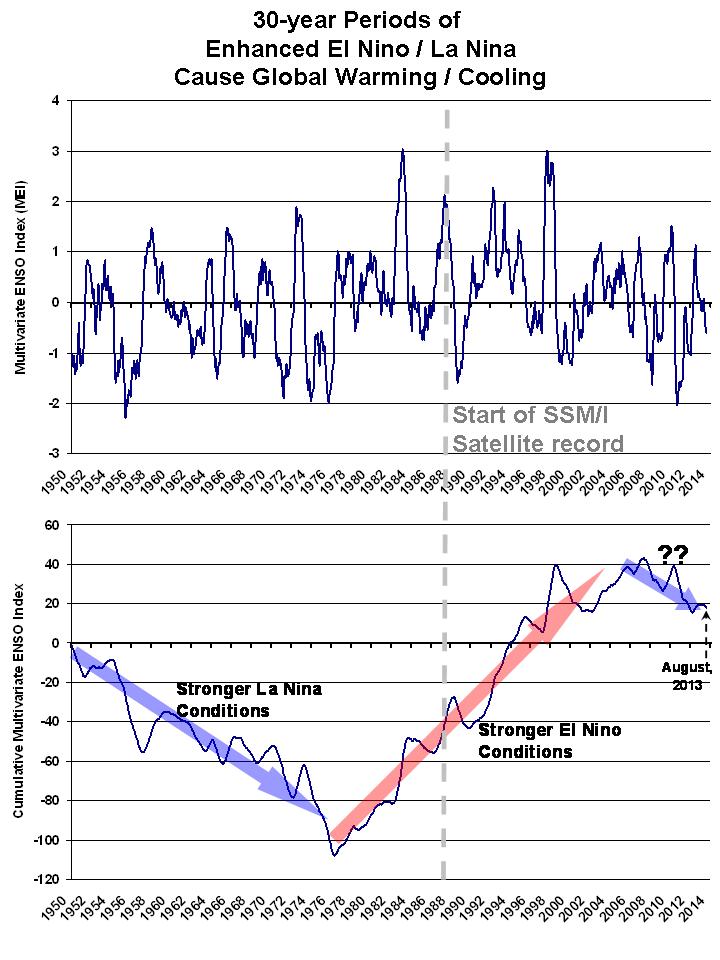
The recent change from stronger El Nino to stronger La Nina conditions is revealed in monthly Multivariate ENSO Index (MEI) data since 1950…which is also related to the Pacific Decadal Oscillation (PDO, some researchers consider the PDO to be a low-frequency modulation of El Nino and La Nina activity):

The second panel in the above plot shows the time-cumulative values of MEI since 1950, which is good for seeing the ~30 year periods when one or the other regime persists. (This is nothing new…I and others have pointed this out before).
Of significance to the current ‘global warming hiatus’ issue is the observation that we might have now entered into a new La Nina-dominant phase. In the previous plot, imagine if we repeat the 1950s-1970s period…such a scenario could well lead to a 25- or 30-year period of no warming — or even cooling — just as was experienced up until the 1970s.
But what is different now is the radiative forcing from more CO2 in the atmosphere. Depending upon how sensitive the climate system is, the long-term warming trend from extra CO2 will be superimposed upon the cooling influence of stronger La Nina activity. If the IPCC has overestimated climate sensitivity (which I believe they have), then very weak warming or even flat temperatures could prevail for the next 25-30 years. (Yes, I know I seldom mention solar activity, which I still consider very speculative. But I admit to being under-informed on the issue, so you can probably ignore my opinions on it.)
The fact that it has taken so long for the mainstream climate research community to ‘discover’ the importance of ENSO to multi-decadal climate is very troubling to me. There is no other explanation for them not seeing what was staring them in the face, except the political influence the IPCC and its supporters in government have had on the climate research community, in effect paying them to downplay the role of natural climate variations until nature could no longer be ignored.

 Home/Blog


