As most of you are aware, the dominant mode of tropical climate variability is the El Nino Southern Oscillation (ENSO), comprised of El Nino (warm ENSO phase) and La Nina (cool ENSO phase) activity.
The IPCC has traditionally maintained that El Nino and La Nina activity effectively cancel each other out over time and so ENSO can’t cause multi-decadal time scale warming or cooling. Some of us think this is nonsense, since we know that there are ~30 year periods when El Ninos are stronger, then ~30 year periods when La Nina is stronger.
So, what does 30 year natural climate change have to do with long-term anthropogenic global warming? Well, AGW is can only explain warming over the last 60 years or so, because there weren’t appreciable greenhouse gas emissions before then. And it just so happens that the last 60 years was comprised of 30 years of stronger La Ninas (cool conditions) followed by 30 years of stronger El Ninos (warm conditions). So, it is only “natural” that some recent papers have (finally!) begun to explore the potential role of natural climate fluctuations in explaining at least some of recent warming (or lack thereof).
While our forthcoming paper will address this in a more physically consistent manner, here I will continue this theme by showing just how easy it is to statistically explain tropical sea surface temperature (SST) variations since 1950 with natural modes of climate variability. This is not an entirely new or novel idea, and if someone else has done something very close to the following, consider this independent verification of their calculations. 😉
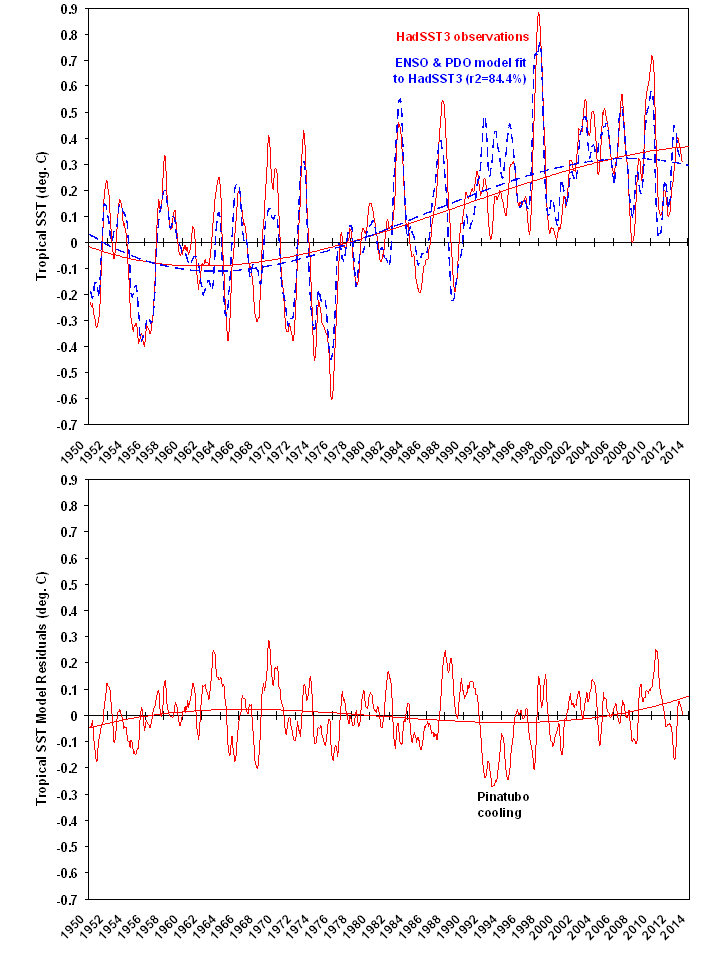
You can use statistical linear regression (I did it within Excel, the spreadsheet is here) to explain 5-month running average tropical HadSST3 variations as a linear combination of the Multivariate ENSO Index (MEI), the cumulative MEI index since 1950, and the cumulative Pacific Decadal Oscillation (PDO) index since 1950. The original HadSST3 data, and the model fit are shown in the first panel of the following figure, and the model residuals are shown in the second panel (click for larger version; fitted curves are 3rd order polynomials):

Note the largest excursion in the model residuals (variations the model can’t explain, 2nd panel) is the cooling caused by the Mt. Pinatubo eruption. The linear trends in the observed and model-fitted SSTs are essentially identical.
Of course, the most important (and controversial) aspect of this exercise is explaining the warming trend in terms of the time-accumulation of the MEI index, which would be more than just a statistical artifact *if* persistent La Nina’s early in the record are associated with a net loss of deep-layer ocean thermal energy, and persistent El Nino’s later in the record are associated with a net gain of heat by the ocean. Our paper published next month will show the evidence that this, indeed, happens. The third term in the model equation (time accumulated PDO index) has a smaller influence than the accumulated MEI term, by about a factor of 2.3.
Of course, being a statistical exercise, the above results are far from proof that nature explains everything. From a theoretical perspective, I would expect that increasing CO2 should have some non-zero warming influence.
But as I have mentioned before, the rate of rise in ocean heat content since the 1950s corresponds to only a 1 in 1,000 imbalance in the radiative energy budget of the Earth (~0.25 W/m2 out of ~240 W/m2).
The IPCC’s belief that nature keeps the climate system energy-stabilized to better than 1 part in 1,000 is a matter of faith, not of physical “first principles”.

 Home/Blog


