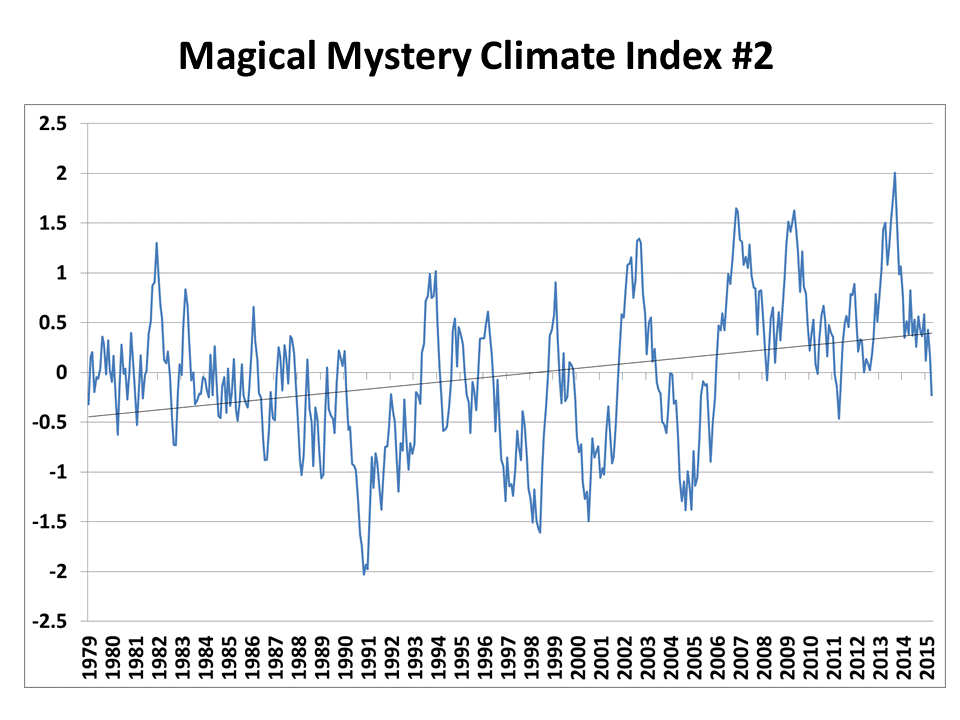
A little over a year ago I posted a climate riddle of sorts: a time series that showed warming, then a “pause”, then warming again, etc.
The point of the exercise was to demonstrate how a natural climate cycle sumperimposed upon a linear warming trend can cause what we have seen in global temperatures. I wasn’t necessarily advocating that’s what’s going on…although it would be at the top of my list of educated guesses.
Anyway, an ongoing e-mail discussion I’ve been having with Lubos Motl about a possible 3.7 year cycle in the satellite-based global temperatures led me to my second Magical Mystery Climate index riddle:
My question is this: What, if anything, can you infer about the physical cause(s) of this time series?
All I’ll tell you is that (1) it is “temperature-related”, and (2) the data aren’t “real”…the year labels are only meant to indicate a monthly time series a little over 36 years in length, like the satellite record.
If you feel so inclined, here are the data contained in the graph.
I will post the answer tomorrow.

 Home/Blog


