Archive for the ‘Blog Article’ Category

Allstate Should Pull this Ad and Apologize for Misleading the Public

Monday, December 17th, 2018

I’ve been meaning to comment about this TV ad for Allstate insurance, which enraged me the first time I saw it. Allstate knows better (the insurance business deals with probability and statistics) and they knew this was a lie when they put the ad together:

In the ad, actor Dennis Haysbert says:

“A once-in-500-year storm should happen once every 500 years, right? The fact is, there have been 26 in the last decade.”

Setting aside the fact that we don’t have enough statistics to say anything meaningful about what happens over 500 years (hydrologists prefer to stick to 100 years as justified when talking about rare events), Allstate knows very well that such statistics refer to the repeat period for the same location… not for (say) the whole United States. It is not unusual for once-in-100 year weather events to occur more than once, maybe several times, each year somewhere in the U.S.

I consider this false advertising because Allstate knows better, and is purposely misleading the public to make more money.

Can Space.com Teach Us Anything Useful about Climate?

Monday, December 3rd, 2018

According to Space.com, Venus and Earth were really quite similar, until something went wrong. Horribly wrong.

I saw a Space.com article today entitled, Can Venus teach us to take climate change seriously? While Space.com writers should know quite a bit about the other planets, the article was a fount of misinformation and gross exaggeration.

The obvious purpose of the article was scare us into taking increasing carbon dioxide levels seriously, following on the Fourth National Climate Assessment (NC4) report (which I’m still trying to digest). After repeating the NC4 claim that “10 percent of the U.S. economy could evaporate by 2100” due to climate change, the Venusian silliness begins:

…a nearby world has an even hotter climate problem than ours, and scientists say we could learn some valuable lessons from it. That world is Venus, Earth’s “evil twin,” which was once nice enough until something went wrong and the atmosphere began trapping a little too much heat.

First of all, it is extremely speculative to claim that the climate of Venus “was once nice enough“. Then to further claim, “something went wrong and the atmosphere began trapping a little too much heat.” This makes it sound like Venus was just another hospitable planet until it reached some tipping point and a runaway greenhouse effect ensued.

This kind of prose might be good for science fiction, but it does a disservice to the facts.

While it is true that the surface of Venus has a temperature around 860 deg. F., the fact is that Venus has over 220,000 times as much CO2 as Earth’s atmosphere!

By way of comparison, since the Industrial Revolution started, it is widely believed we are now approaching 1.5 times as much atmospheric CO2 as we had hundreds of years ago.

220,000x versus 1.5x. Do you see the grotesqueness of comparing Venus to Earth?

If we used distances to make the comparison, and 1.5x was 1.5 inches, then 220,000x would be 2.3 miles! Imagine that the water level in the ocean increased by 0.5 inches, and people were trying to scare you about what might happen if it goes up another half an inch in the next 50 years by comparing it to 2.3 miles of water depth.

To make matters worse, the article then builds upon this Venus-is-so-much-like-Earth theme with the supposed reason why Venus is hotter than the Earth:

Much of the appeal of Venus comes from the fact that despite its horrifying modern appearance, it’s actually really similar to Earth. “Picture a planet that’s just like Earth but it’s a little hotter because it’s a little closer to the sun and that would be Venus,” David Grinspoon, a planetary scientist and astrobiologist at the Planetary Science Institute, told Space.com.

Wrong again, Dr. Planetary Scientist.

Because Venus is perpetually cloud-covered, it actually absorbs less sunlight than the Earth, even though it is closer to the sun. Were it not for its extreme greenhouse effect, its surface temperature would actually average colder than the Earth.

Using Venus to scare people about increasing CO2 levels on Earth is nothing new. But I’m surprised that a reputable website like Space.com would stoop to such a level of pseudo-science to support reductions in greenhouse gas emissions.

UAH Global Temperature Update for November, 2018: +0.28 deg. C

Monday, December 3rd, 2018

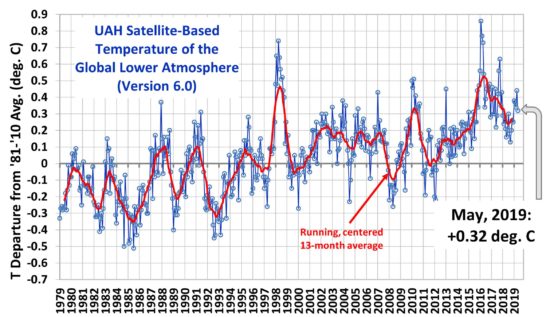
The Version 6.0 global average lower tropospheric temperature (LT) anomaly for November, 2018 was +0.28 deg. C, up a little from +0.22 deg. C in October:

Global area-averaged lower tropospheric temperature anomalies (departures from 30-year calendar monthly means, 1981-2010). The 13-month centered average is meant to give an indication of the lower frequency variations in the data; the choice of 13 months is somewhat arbitrary… an odd number of months allows centered plotting on months with no time lag between the two plotted time series. The inclusion of two of the same calendar months on the ends of the 13 month averaging period causes no issues with interpretation because the seasonal temperature cycle has been removed, and so has the distinction between calendar months.

Various regional LT departures from the 30-year (1981-2010) average for the last 23 months are:

YEAR MO GLOBE NHEM. SHEM. TROPIC USA48 ARCTIC AUST
2017 01 +0.33 +0.32 +0.34 +0.10 +0.28 +0.95 +1.22
2017 02 +0.39 +0.58 +0.20 +0.08 +2.16 +1.33 +0.21
2017 03 +0.23 +0.37 +0.09 +0.06 +1.22 +1.24 +0.98
2017 04 +0.28 +0.29 +0.27 +0.22 +0.90 +0.23 +0.40
2017 05 +0.45 +0.40 +0.50 +0.41 +0.11 +0.21 +0.06
2017 06 +0.22 +0.34 +0.10 +0.40 +0.51 +0.10 +0.34
2017 07 +0.29 +0.31 +0.28 +0.51 +0.61 -0.27 +1.03
2017 08 +0.41 +0.41 +0.42 +0.47 -0.54 +0.49 +0.78
2017 09 +0.55 +0.52 +0.58 +0.54 +0.30 +1.06 +0.60
2017 10 +0.63 +0.67 +0.60 +0.48 +1.22 +0.83 +0.86
2017 11 +0.36 +0.34 +0.38 +0.27 +1.36 +0.68 -0.12
2017 12 +0.42 +0.50 +0.33 +0.26 +0.45 +1.37 +0.36
2018 01 +0.26 +0.46 +0.06 -0.11 +0.59 +1.36 +0.43
2018 02 +0.20 +0.25 +0.16 +0.03 +0.92 +1.20 +0.18
2018 03 +0.25 +0.40 +0.10 +0.07 -0.31 -0.32 +0.60
2018 04 +0.21 +0.32 +0.11 -0.12 -0.00 +1.02 +0.69
2018 05 +0.18 +0.41 -0.05 +0.03 +1.94 +0.18 -0.39
2018 06 +0.21 +0.38 +0.04 +0.12 +1.20 +0.83 -0.55
2018 07 +0.32 +0.43 +0.21 +0.29 +0.51 +0.30 +1.37
2018 08 +0.19 +0.22 +0.17 +0.12 +0.07 +0.09 +0.26
2018 09 +0.15 +0.15 +0.14 +0.24 +0.88 +0.21 +0.19
2018 10 +0.22 +0.31 +0.12 +0.34 +0.25 +1.11 +0.39
2018 11 +0.28 +0.27 +0.29 +0.50 -1.13 +0.69 +0.53

The linear temperature trend of the global average lower tropospheric temperature anomalies from January 1979 through November 2018 remains at +0.13 C/decade.

The UAH LT global anomaly image for November, 2018 should be available in the next few days here.

The new Version 6 files should also be updated at that time, and are located here:

Lower Troposphere: http://vortex.nsstc.uah.edu/data/msu/v6.0/tlt/uahncdc_lt_6.0.txt
Mid-Troposphere: http://vortex.nsstc.uah.edu/data/msu/v6.0/tmt/uahncdc_mt_6.0.txt
Tropopause: http://vortex.nsstc.uah.edu/data/msu/v6.0/ttp/uahncdc_tp_6.0.txt
Lower Stratosphere: http://vortex.nsstc.uah.edu/data/msu/v6.0/tls/uahncdc_ls_6.0.txt

The Sorry State of Climate Science Peer Review, and Kudos to Nic Lewis

Wednesday, November 14th, 2018

For decades now those of us trying to publish papers which depart from the climate doom-and-gloom narrative have noticed a trend toward both biased and sloppy peer review of research submitted for publication in scientific journals.

Part of the problem is the increased specialization of climate science (and other sciences in general), so that there are relatively few peers who know enough about what they are reviewing to pass expert judgement on it. Instead, they simply give the paper author(s) the benefit of the doubt. I have been in this position many times when reviewing a paper for publication. This leads to group-think, as the number of experts in any sub-discipline dwindles.

If the conclusions of the paper support a more alarmist narrative on the seriousness of anthropogenic global warming, the less thorough will be the peer review. I am now totally convinced of that. If the paper is skeptical in tone, it endures levels of criticism that alarmist papers do not experience. I have had at least one paper rejected based upon a single reviewer who obviously didn’t read the paper…he criticized claims not even made in the paper.

A recent paper published in what is arguably the world’s most prestigious science journal, Nature, claimed that the oceans have been warming considerably faster than estimates made from actual thermometer measurements, which remain rather sparse even in the Argo float era.

Enter Nic Lewis, who along with Judith Curry has been publishing some of the most thorough estimates of climate sensitivity based upon the observational data and the usual assumed anthropogenic climate forcings (mostly increasing CO2). Despite not being a credentialed climate scientist, Mr. Lewis immediately identified a significant error in the paper, substantially altering the conclusions, which the authors now acknowledge.

The good news is that this is a case where the error was caught, and admitted to.

The bad news is that the peer review process, presumably involving credentialed climate scientists, should have caught the error before publication.

UAH Global Temperature Update for October, 2018: +0.22 deg. C

Friday, November 2nd, 2018

The Version 6.0 global average lower tropospheric temperature (LT) anomaly for October, 2018 was +0.22 deg. C, up a little from +0.14 deg. C in September:

Global area-averaged lower tropospheric temperature anomalies (departures from 30-year calendar monthly means, 1981-2010). The 13-month centered average is meant to give an indication of the lower frequency variations in the data; the choice of 13 months is somewhat arbitrary… an odd number of months allows centered plotting on months with no time lag between the two plotted time series. The inclusion of two of the same calendar months on the ends of the 13 month averaging period causes no issues with interpretation because the seasonal temperature cycle has been removed, and so has the distinction between calendar months.

Various regional LT departures from the 30-year (1981-2010) average for the last 22 months are:

YEAR MO GLOBE NHEM. SHEM. TROPIC USA48 ARCTIC AUST
2017 01 +0.33 +0.32 +0.34 +0.10 +0.28 +0.95 +1.22
2017 02 +0.39 +0.58 +0.20 +0.08 +2.16 +1.33 +0.21
2017 03 +0.23 +0.37 +0.09 +0.06 +1.22 +1.24 +0.98
2017 04 +0.28 +0.29 +0.26 +0.22 +0.90 +0.23 +0.40
2017 05 +0.45 +0.40 +0.49 +0.41 +0.11 +0.21 +0.06
2017 06 +0.22 +0.34 +0.10 +0.40 +0.51 +0.10 +0.34
2017 07 +0.29 +0.31 +0.28 +0.51 +0.61 -0.27 +1.03
2017 08 +0.41 +0.41 +0.42 +0.47 -0.54 +0.49 +0.78
2017 09 +0.55 +0.52 +0.57 +0.54 +0.30 +1.06 +0.60
2017 10 +0.63 +0.67 +0.60 +0.47 +1.22 +0.83 +0.86
2017 11 +0.36 +0.34 +0.38 +0.27 +1.36 +0.68 -0.12
2017 12 +0.42 +0.50 +0.33 +0.26 +0.45 +1.37 +0.36
2018 01 +0.26 +0.46 +0.06 -0.11 +0.59 +1.36 +0.42
2018 02 +0.20 +0.25 +0.16 +0.03 +0.92 +1.19 +0.18
2018 03 +0.25 +0.40 +0.10 +0.07 -0.32 -0.33 +0.59
2018 04 +0.21 +0.31 +0.11 -0.12 -0.00 +1.02 +0.69
2018 05 +0.18 +0.41 -0.05 +0.03 +1.93 +0.18 -0.39
2018 06 +0.21 +0.38 +0.04 +0.12 +1.19 +0.83 -0.55
2018 07 +0.32 +0.43 +0.21 +0.29 +0.51 +0.30 +1.37
2018 08 +0.19 +0.22 +0.17 +0.12 +0.06 +0.09 +0.26
2018 09 +0.14 +0.15 +0.14 +0.24 +0.88 +0.21 +0.19
2018 10 +0.22 +0.31 +0.12 +0.34 +0.25 +1.11 +0.38

The linear temperature trend of the global average lower tropospheric temperature anomalies from January 1979 through October 2018 remains at +0.13 C/decade.

The UAH LT global anomaly image for October, 2018 should be available in the next few days here.

The new Version 6 files should also be updated at that time, and are located here:

Lower Troposphere: http://vortex.nsstc.uah.edu/data/msu/v6.0/tlt/uahncdc_lt_6.0.txt
Mid-Troposphere: http://vortex.nsstc.uah.edu/data/msu/v6.0/tmt/uahncdc_mt_6.0.txt
Tropopause: http://vortex.nsstc.uah.edu/data/msu/v6.0/ttp/uahncdc_tp_6.0.txt
Lower Stratosphere: http://vortex.nsstc.uah.edu/data/msu/v6.0/tls/uahncdc_ls_6.0.txt

Florida Major Hurricane Strikes: Still No Trend

Thursday, October 11th, 2018

Note: The first plot had Michael’s wind speed plotted incorrectly, which has been fixed.

I’ve updated a plot of Florida major hurricane strikes since 1900 with Hurricane Michael, and the result is that there is still no trend in either intensity or frequency of strikes over the last 118 years:

This is based upon National Hurricane Center data. The trend line in intensity is flat, and the trend line in number of storms (not shown) is insignificantly downward.

Nevertheless, the usual fearmongers are claiming Hurricane Michael is somehow tied to climate change.

After all, the Gulf of Mexico is unusually warm, right?

Yes, but if you look at the history of Jul-Aug-Sept average sea surface temperature (SST) anomalies over the eastern Gulf (available here, 25N-30N, 80W-90W), you will see that since 1860, this summer is only the 9th warmest in the eastern Gulf of Mexico.

Even more astounding is that out of the top 10 warmest Gulf years since 1860, 7 occurred before 1970, which is before we experienced any significant warming.

So, all the “experts” can do is make vague claims about how major hurricanes like Michael are what we can expect more of in a warming world, but the data show that – so far at least – the data do not support the theory.

Major hurricanes are part of nature. As evidence of this, I will also remind people of the study of lake bottom sediments in Western Lake in the Florida panhandle, not far from where Michael made landfall, that showed the last 1,000 years have been relatively quiet for Category 4 to 5 hurricanes, but the period from 1,000 to 3,400 years ago was a “hyperactive” period for intense landfalls at that location.

Hurricane strikes in the U.S. are notoriously variable, as evidenced by the recent (and unprecedented) 11+ year “drought” in major hurricane landfalls, which was finally broken in 2017.

Where were the claims that the hurricane drought was due to global warming?

Crickets.

Attributing the latest hurricane in any way to global warming is the ultimate in cherry-picking the data. In fact, they don’t even show the data.

Which brings us back to those vague claims by the experts.

UPDATE:

I also included Michael in the count of ALL U.S. landfalling major hurricanes, again from NHC data. The marked downward trend since the 1930s, 40s, and 50s is quite evident:

Where is the news story about THAT?

More crickets.

New Record Low Tornado Count as of October 3

Thursday, October 4th, 2018

NOAA’s Storm Prediction Center keeps a daily count of cumulative number of tornadoes in the U.S. each year, and recent years have had an unusually low number of tornadoes.

As of October 3, the cumulative total for 2018 is 759; the previous lowest number of tornadoes for this date was 761. The SPC has records extending back 65 years.

This lack of tornadic storms in recent years should also correlate with lesser severe thunderstorm activity in general in the U.S., since the conditions which produce large hail and damaging winds are generally the same as are required for tornadoes (strong instability, plentiful moisture, and wind shear).

UAH Global Temperature Update for September, 2018: +0.14 deg. C

Tuesday, October 2nd, 2018

Globally, the coolest September in the last 10 years.

The Version 6.0 global average lower tropospheric temperature (LT) anomaly for September, 2018 was +0.14 deg. C, down a little from +0.19 deg. C in August:

Global area-averaged lower tropospheric temperature anomalies (departures from 30-year calendar monthly means, 1981-2010). The 13-month centered average is meant to give an indication of the lower frequency variations in the data; the choice of 13 months is somewhat arbitrary… an odd number of months allows centered plotting on months with no time lag between the two plotted time series. The inclusion of two of the same calendar months on the ends of the 13 month averaging period causes no issues with interpretation because the seasonal temperature cycle has been removed, and so has the distinction between calendar months.

This was the coolest September in the last 10 years in the global average.

Some regional LT departures from the 30-year (1981-2010) average for the last 21 months are:

YEAR MO GLOBE NHEM. SHEM. TROPIC USA48 ARCTIC AUST
2017 01 +0.33 +0.32 +0.34 +0.10 +0.28 +0.95 +1.22
2017 02 +0.39 +0.58 +0.20 +0.08 +2.16 +1.33 +0.21
2017 03 +0.23 +0.37 +0.09 +0.06 +1.21 +1.24 +0.98
2017 04 +0.28 +0.29 +0.26 +0.22 +0.90 +0.23 +0.40
2017 05 +0.45 +0.40 +0.49 +0.41 +0.11 +0.21 +0.06
2017 06 +0.22 +0.33 +0.10 +0.39 +0.51 +0.10 +0.34
2017 07 +0.29 +0.31 +0.28 +0.51 +0.61 -0.27 +1.03
2017 08 +0.41 +0.40 +0.42 +0.46 -0.54 +0.49 +0.78
2017 09 +0.54 +0.51 +0.57 +0.54 +0.29 +1.06 +0.60
2017 10 +0.63 +0.67 +0.59 +0.47 +1.21 +0.83 +0.86
2017 11 +0.36 +0.34 +0.38 +0.27 +1.35 +0.68 -0.12
2017 12 +0.42 +0.50 +0.33 +0.26 +0.45 +1.37 +0.36
2018 01 +0.26 +0.46 +0.06 -0.11 +0.59 +1.36 +0.42
2018 02 +0.20 +0.25 +0.16 +0.03 +0.92 +1.19 +0.18
2018 03 +0.25 +0.40 +0.10 +0.07 -0.32 -0.33 +0.59
2018 04 +0.21 +0.31 +0.11 -0.12 0.00 +1.02 +0.69
2018 05 +0.18 +0.41 -0.05 +0.03 +1.93 +0.18 -0.40
2018 06 +0.21 +0.38 +0.04 +0.12 +1.19 +0.83 -0.55
2018 07 +0.32 +0.42 +0.21 +0.29 +0.51 +0.29 +1.37
2018 08 +0.19 +0.21 +0.17 +0.12 +0.06 +0.09 +0.25
2018 09 +0.14 +0.15 +0.14 +0.24 +0.88 +0.21 +0.18

The linear temperature trend of the global average lower tropospheric temperature anomalies from January 1979 through September 2018 remains at +0.13 C/decade.

The UAH LT global anomaly image for September, 2018 should be available in the next few days here.

The new Version 6 files should also be updated at that time, and are located here:

Lower Troposphere: http://vortex.nsstc.uah.edu/data/msu/v6.0/tlt/uahncdc_lt_6.0.txt
Mid-Troposphere: http://vortex.nsstc.uah.edu/data/msu/v6.0/tmt/uahncdc_mt_6.0.txt
Tropopause: http://vortex.nsstc.uah.edu/data/msu/v6.0/ttp/uahncdc_tp_6.0.txt
Lower Stratosphere: http://vortex.nsstc.uah.edu/data/msu/v6.0/tls/uahncdc_ls_6.0.txt

My Tucker Carlson Interview Last Night, and Calling Out Bill Nye & James Hansen

Saturday, September 15th, 2018

It didn’t last long, but I was interviewed in one segment on Tucker Carlson’s show of Fox News Channel last evening:

The subject was Hurricane Florence and whether it could be blamed on President Trump (specifically) or humanity (more generally).

You really can’t say much in only a couple of minutes, and it’s difficult when you don’t know what the questions will be. I got a plug in for Anthony Watts’ revealing the deception Bill Nye’s (The Science Guy) faked global-warming-in-a-jar experiment.

How did I get on Tucker’s show? It started when the folks at the Texas Public Policy Foundation asked me to write an op-ed to counter the global warming hype around Hurricane Florence. That was published in USA Today yesterday morning. They also set up several radio talk show interviews during the day, and scored the Tucker Carlson spot several hours before showtime.

I have to drive 2 hours to Nashville for national TV interviews, since our local TV affiliates have stopped honoring requests to handle the studio work here in Huntsville. If it’s a major show, the network pays for a makeup artist to come in and take a few years off my face.

I never get to see TV interview while we are doing them remotely. I have an earpiece and stare into a TV camera. It takes a few times to get used to having a conversation with a camera lens.

The more I think about Bill Nye’s experiment, the more irritated I get with the consensus scientific establishment for not telling Bill Nye that such an experiment cannot work; you cannot demonstrate the greenhouse effect on temperature with CO2 in a glass jar. Scientists who understand atmospheric radiative transfer know that.

The fact that the “Climate 101” video is still out there means the scientific establishment (plus Al Gore, who used it in his “Climate Reality Project”), are complicit in scientific fraud in order to advance the alarmist global warming narrative.

If their evidence for human-caused climate change is so good, they shouldn’t have to fake evidence to support their claims. I realize Bill Nye isn’t part of the climate research establishment, but he has a huge influence on public perception and scientific understanding. James Hansen also has had a huge influence on the public debate, and yet broke NASA rules by speaking to the press and Congress without management approval (and also likely violated the Hatch Act by campaigning politically..yes, he did, ThinkProgress, because he was a member of the Senior Executive Service, which has special Hatch Act rules.. I know because I was one of them, and I resigned NASA rather than have my hands tied).

This is the state of climate science today: if you support the alarmist narrative, you can exaggerate threats and connections with human activities, fake experiments, break government rules, intimidate scientific journal editors (and make them resign),and even violate the law.

As long as you can say you are doing it for the children.

U.S. Major Landfalling Hurricanes Down 50% Since the 1930s

Friday, September 14th, 2018

While the wind, storm surge, and freshwater flooding from Category 1 Hurricane Florence will no doubt cause massive damage, we should remember that – historically speaking – major landfalling hurricanes were more frequent in past decades.

Contrary to popular perception, the number of major hurricanes making landfall in the U.S. has dropped by an average of more than 50% since the 1930s:

While you might object that the current decade isn’t over with yet, if we assume the long-term average of 6 storms per decade continues for the remaining 2.5 hurricane seasons, the downward trend since the 1930s will still be a 50% reduction.

Why did I pick the 1930s as the starting point?

Because yesterday I presented U.S. Government data on the 36 most costly hurricanes in U.S. history, which have all occurred since the 1930s. Since the 1930s, hurricane damages have increased dramatically. But, as Roger Pielke, Jr. has documented, that’s due to a huge increase in vulnerable infrastructure in a more populous and more prosperous nation.

It’s not due to stronger hurricanes hitting the U.S. or to global warming.