Home/Blog
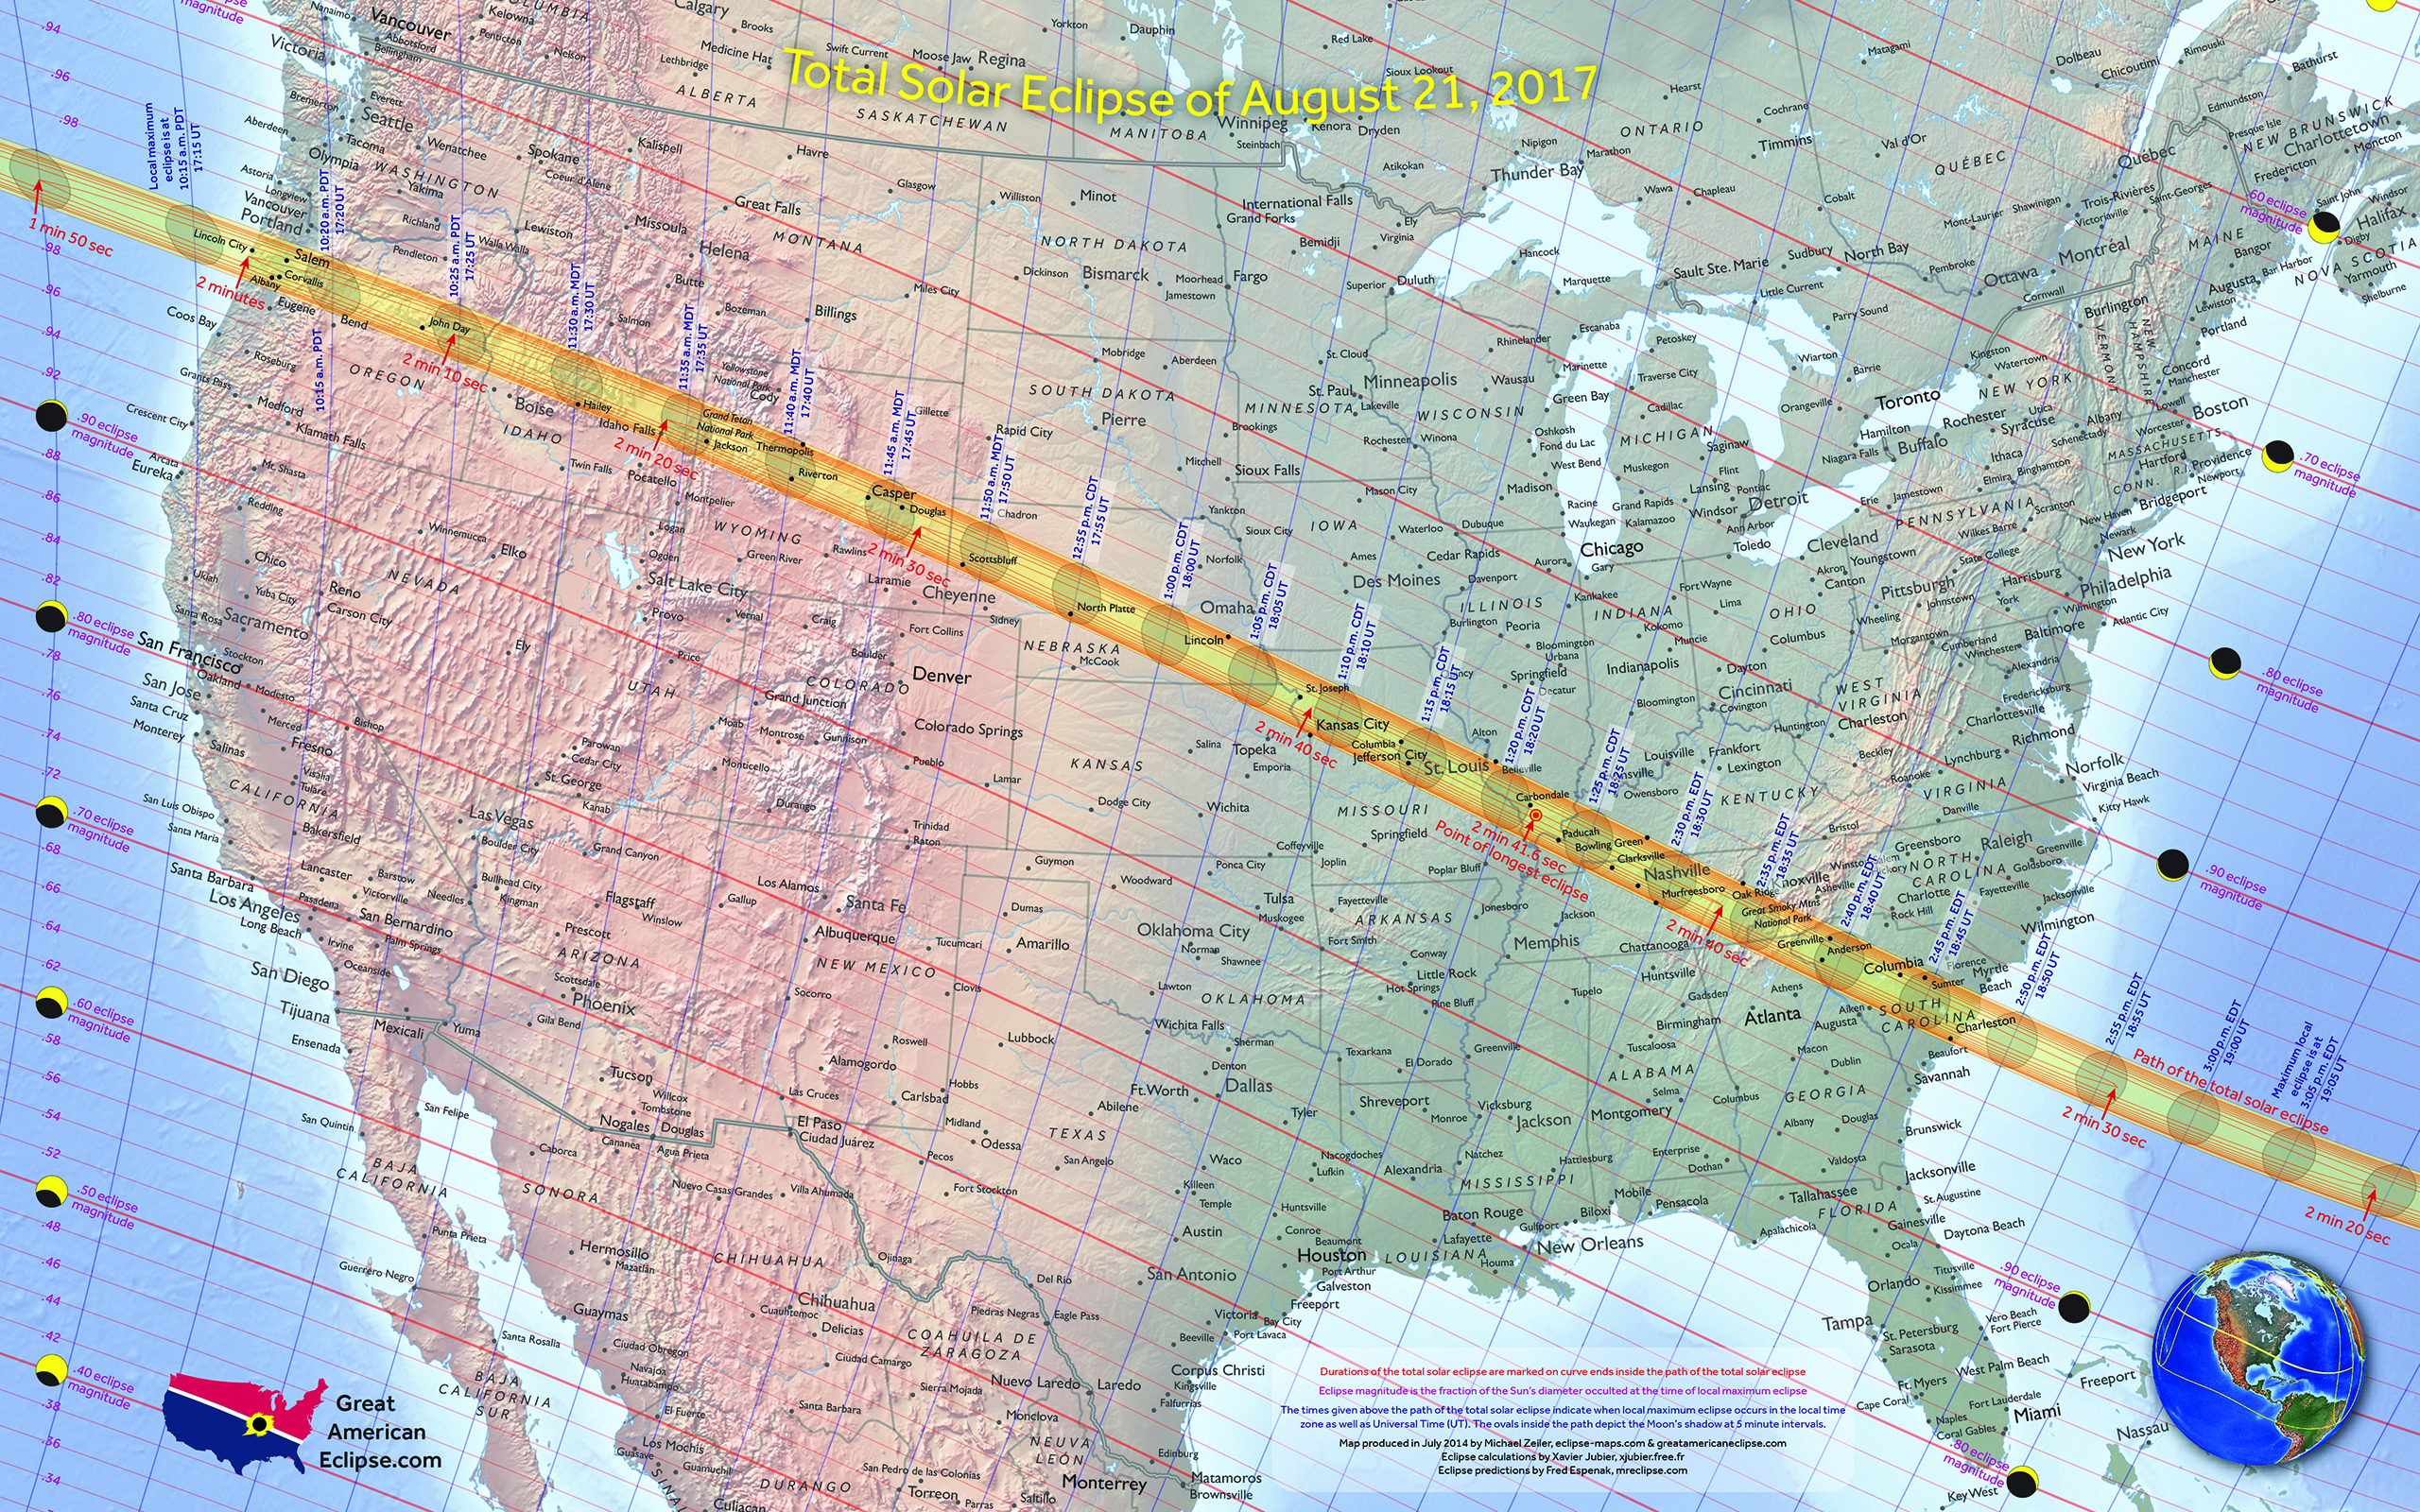
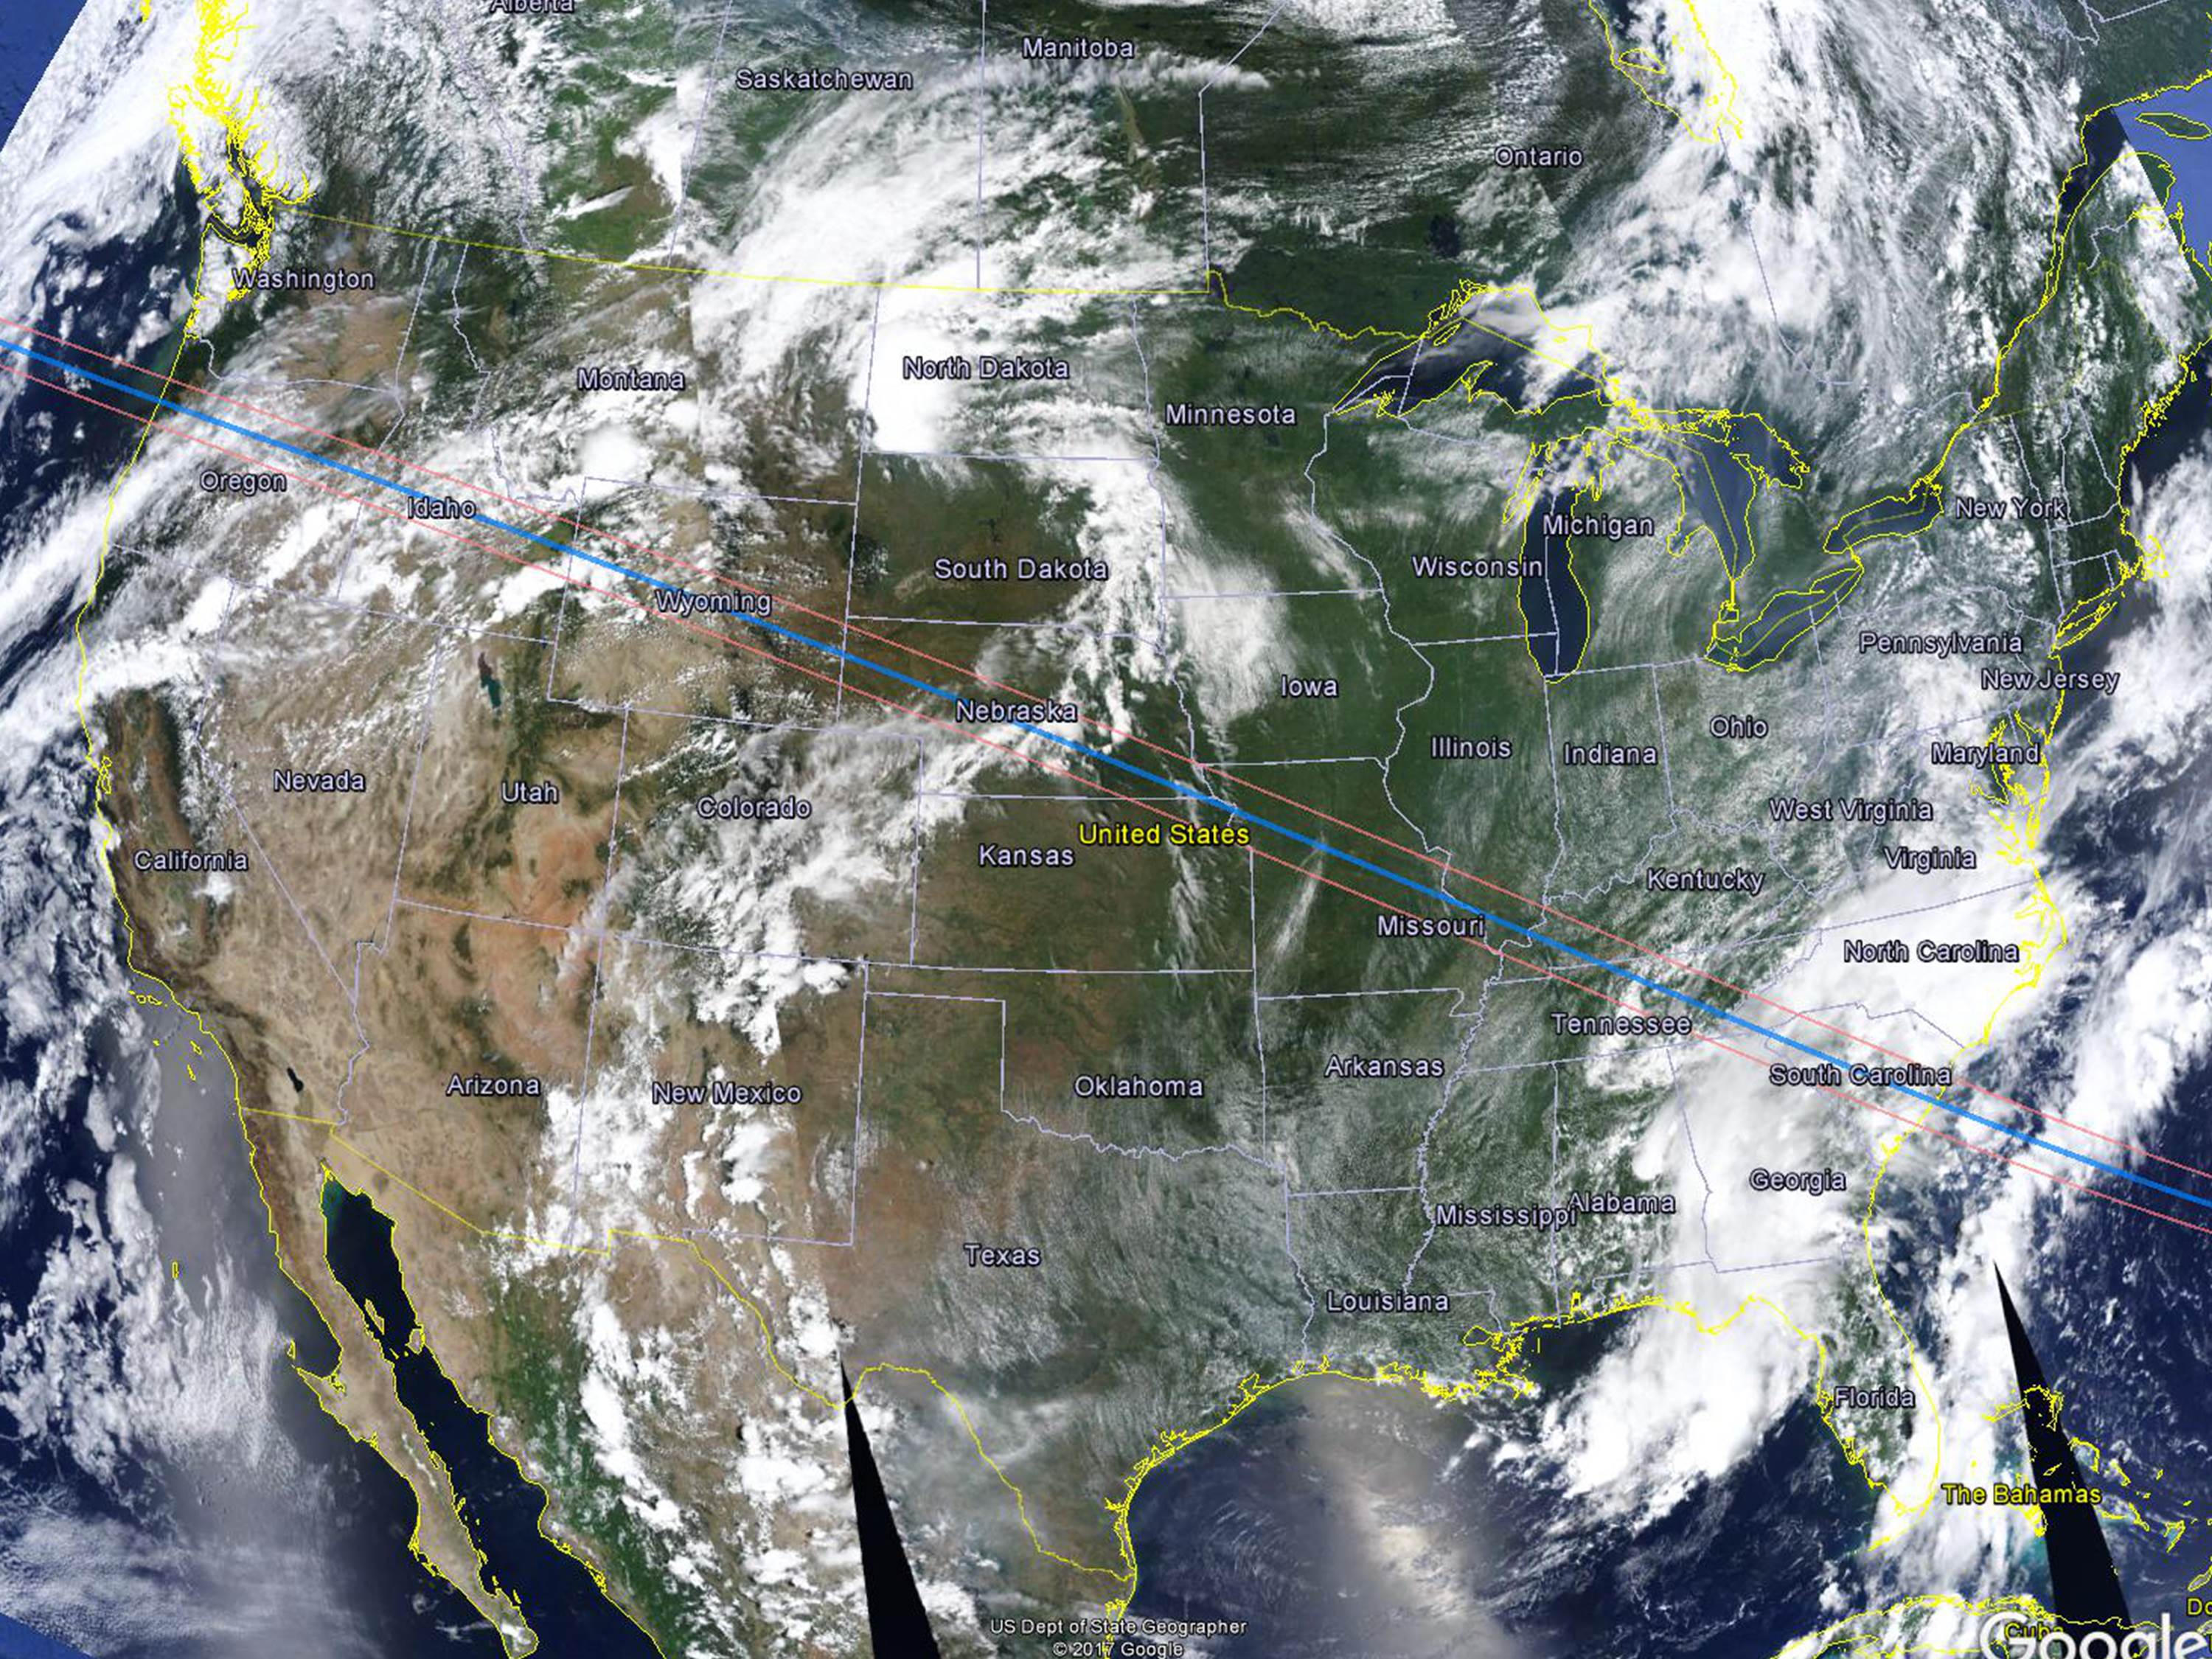
My family and friends drove north from Huntsville, AL the 2-3 hours to get into the path of totality. The weather was better than usual. As we drove into Tennessee, scattered cumulus and towering cumulus clouds were forming.
Our preferred destination was Hurricane Marina, 50 miles east of Nashville. This is a beautiful and rather remote spot on Center Hill Lake, and it has huge houseboats owned (I assume) by some of the wealthier people in Nashville.
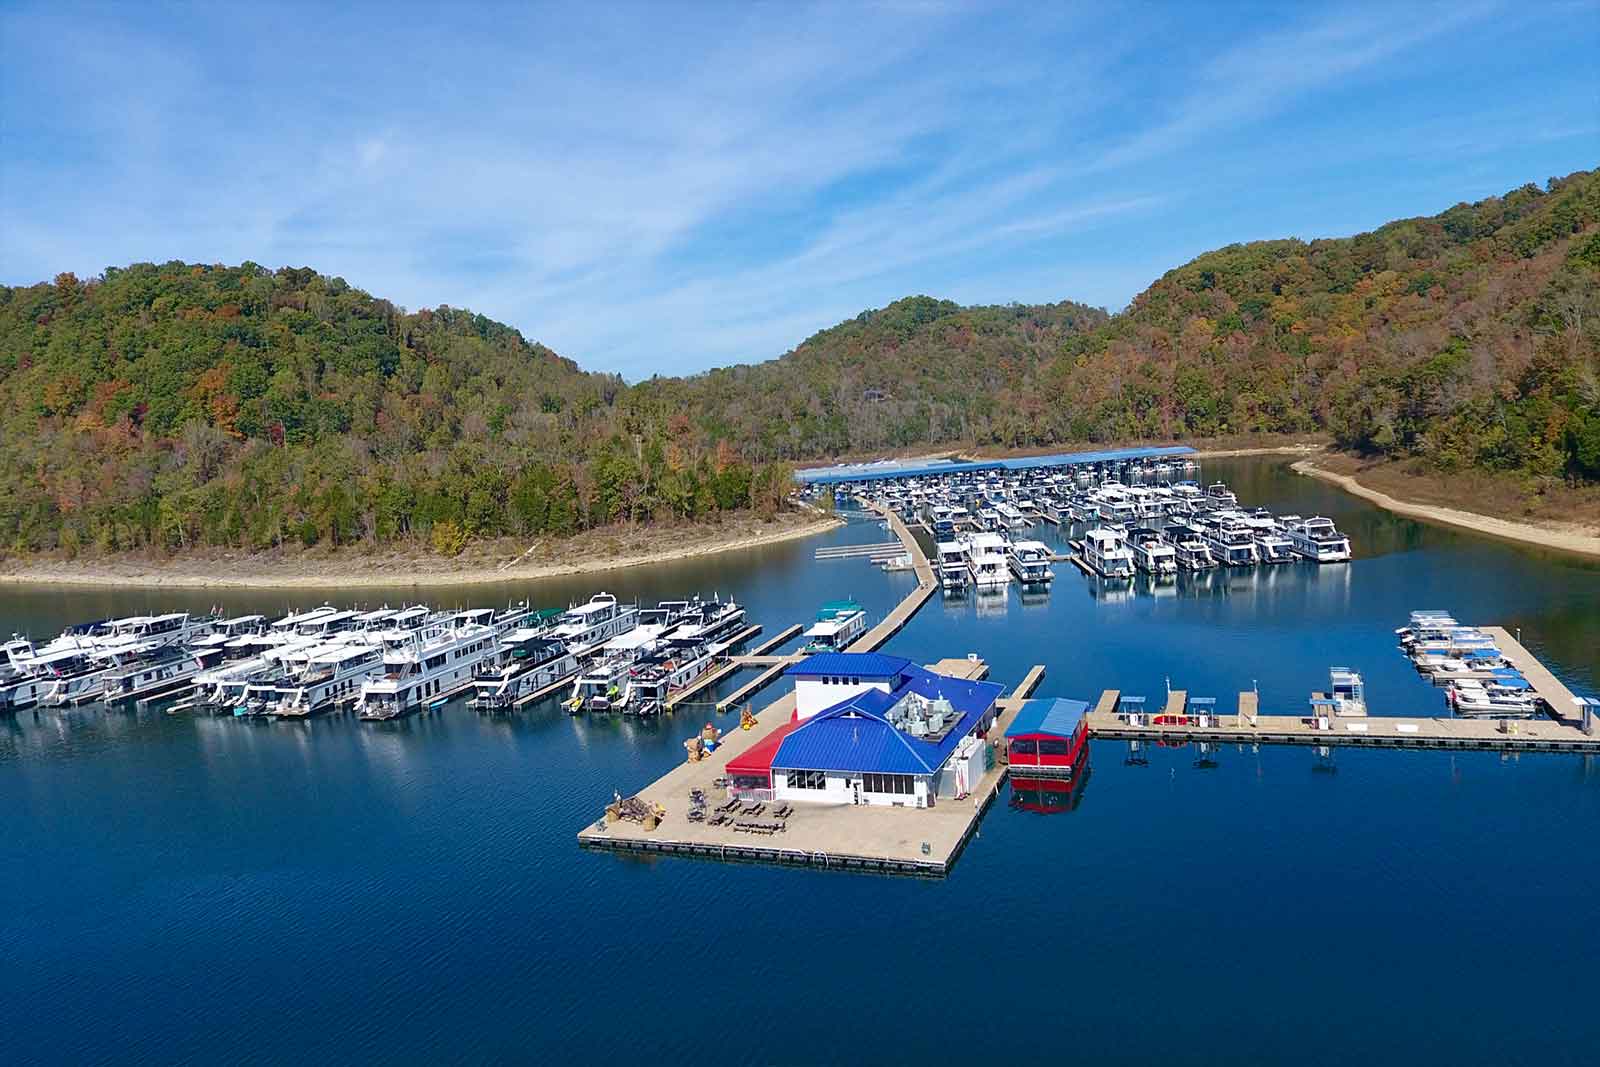
Hurricane Marina on Center Hill Lake, 50 miles east of Nashville.
The two concerns driving there were traffic and the weather. Traffic was not too bad. We had previously decided to take the back roads as much as possible. Scattered clouds were forming, but I hoped that the skies would be clearer around the lake, which is large and often suppresses convection during fair weather.
When we arrived the parking lot — which is huge — was already full. We walked out on the dock to the restaurant/store, and set up folding chairs in the red tent with the blue roof in the photo, to the right of the main building. It was very warm and humid, typical for Tennessee in August.
I started setting up my two camera tripods at the lower-right corner of the platform the restaurant and shop are on. It was then that I realized the entire dock was floating (even the one with the store & restaurant) and it wouldn’t be stable enough for time lapse photography.
So, we watched the sun become covered by the moon with our eclipse glasses. The surroundings darken so gradually you barely notice the effect.
Then I suddenly realized all of the clouds were gone. The reduction in solar heating was just enough to cause the convective thermals to weaken and not penetrate the inversion that was no doubt present.
I decided to carry my equipment to the rocky shoreline in the left-center portion of the above photo. By the time I got there the landscape was getting darker by the second. I set up both tripods up the bank a ways and realized my main camera would not get both the lake surface and the sun in the frame, even at 15 mm focal length, which is very wide angle.
I quickly took one tripod to the water’s edge, set it up on three unstable rocks, inserted my intervalometer that controls the timing of the photos, and… the little button battery fell out into the water under one of the rocks.
I quickly found it, dried it, inserted it, set it to 2 second intervals and started it up. Here’s the resulting time lapse video… this is high-def, so if you watch full-screen at 1080p, you will see Jupiter at left-center.
I set the camera to a fixed exposure so you could see just how dark it gets during totality; the start of the video, even though overexposed, is when the moon has covered the sun by 97-98%, so it was already pretty dark. The video is running 30 times faster than real time.
As the sky quickly darkened, I rushed to the other tripod and placed my Nikon P900 superzoom, which I only use for video at high magnification, on it. I had already decided to not fool with the settings, and just let it run on “auto” and see what I got. The camera took video for about 5 minutes, and I learned afterward it was having difficult focusing.
Here are a couple of screen shots from the video:
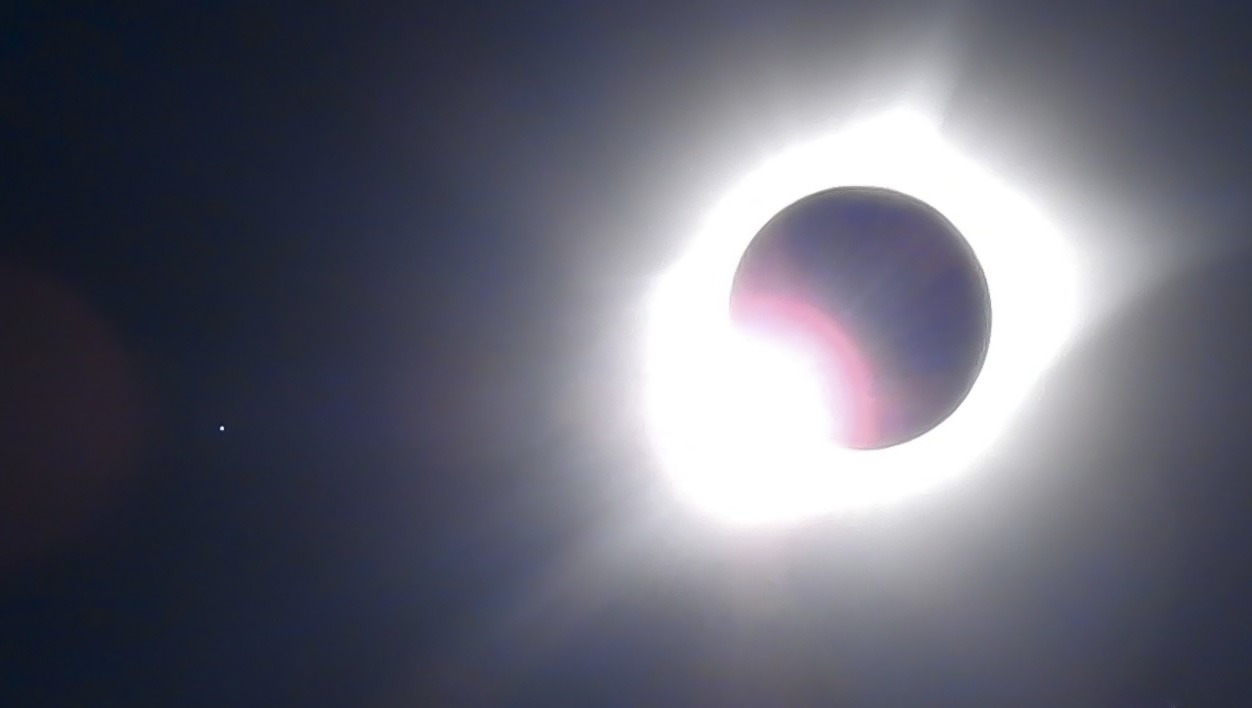
“Diamond ring” effect just before totality, with Regulus to the left.
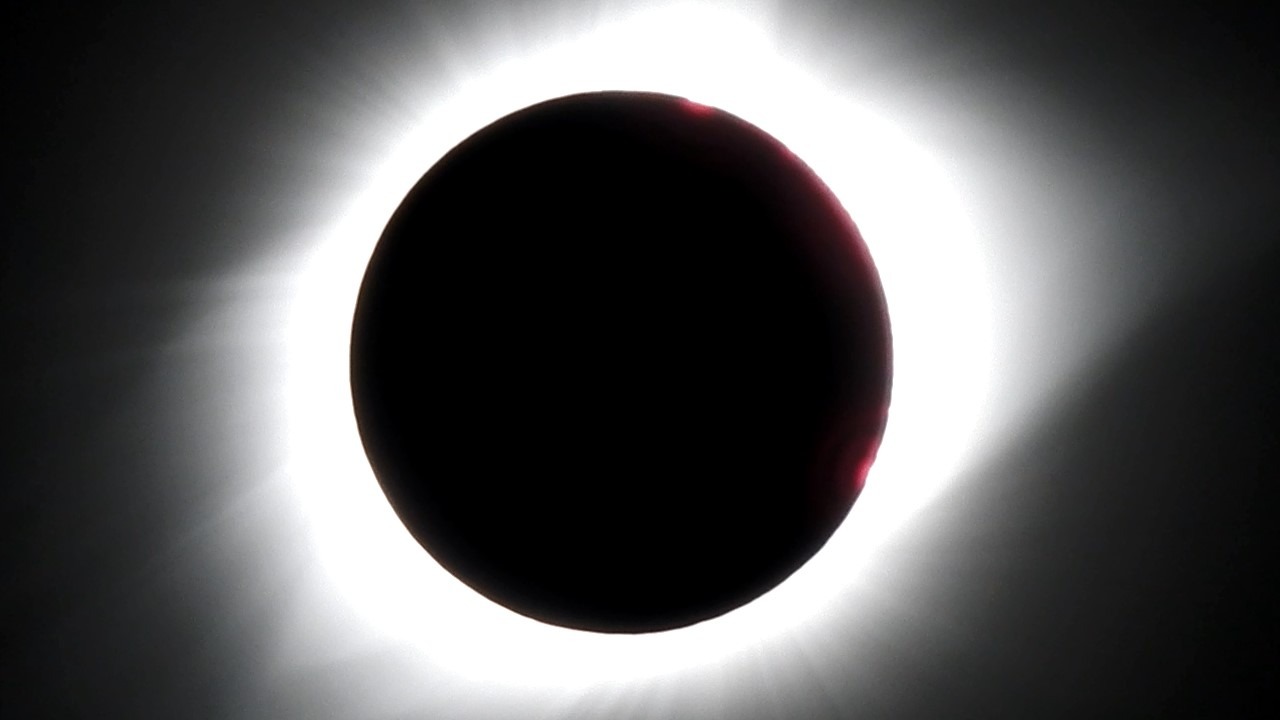
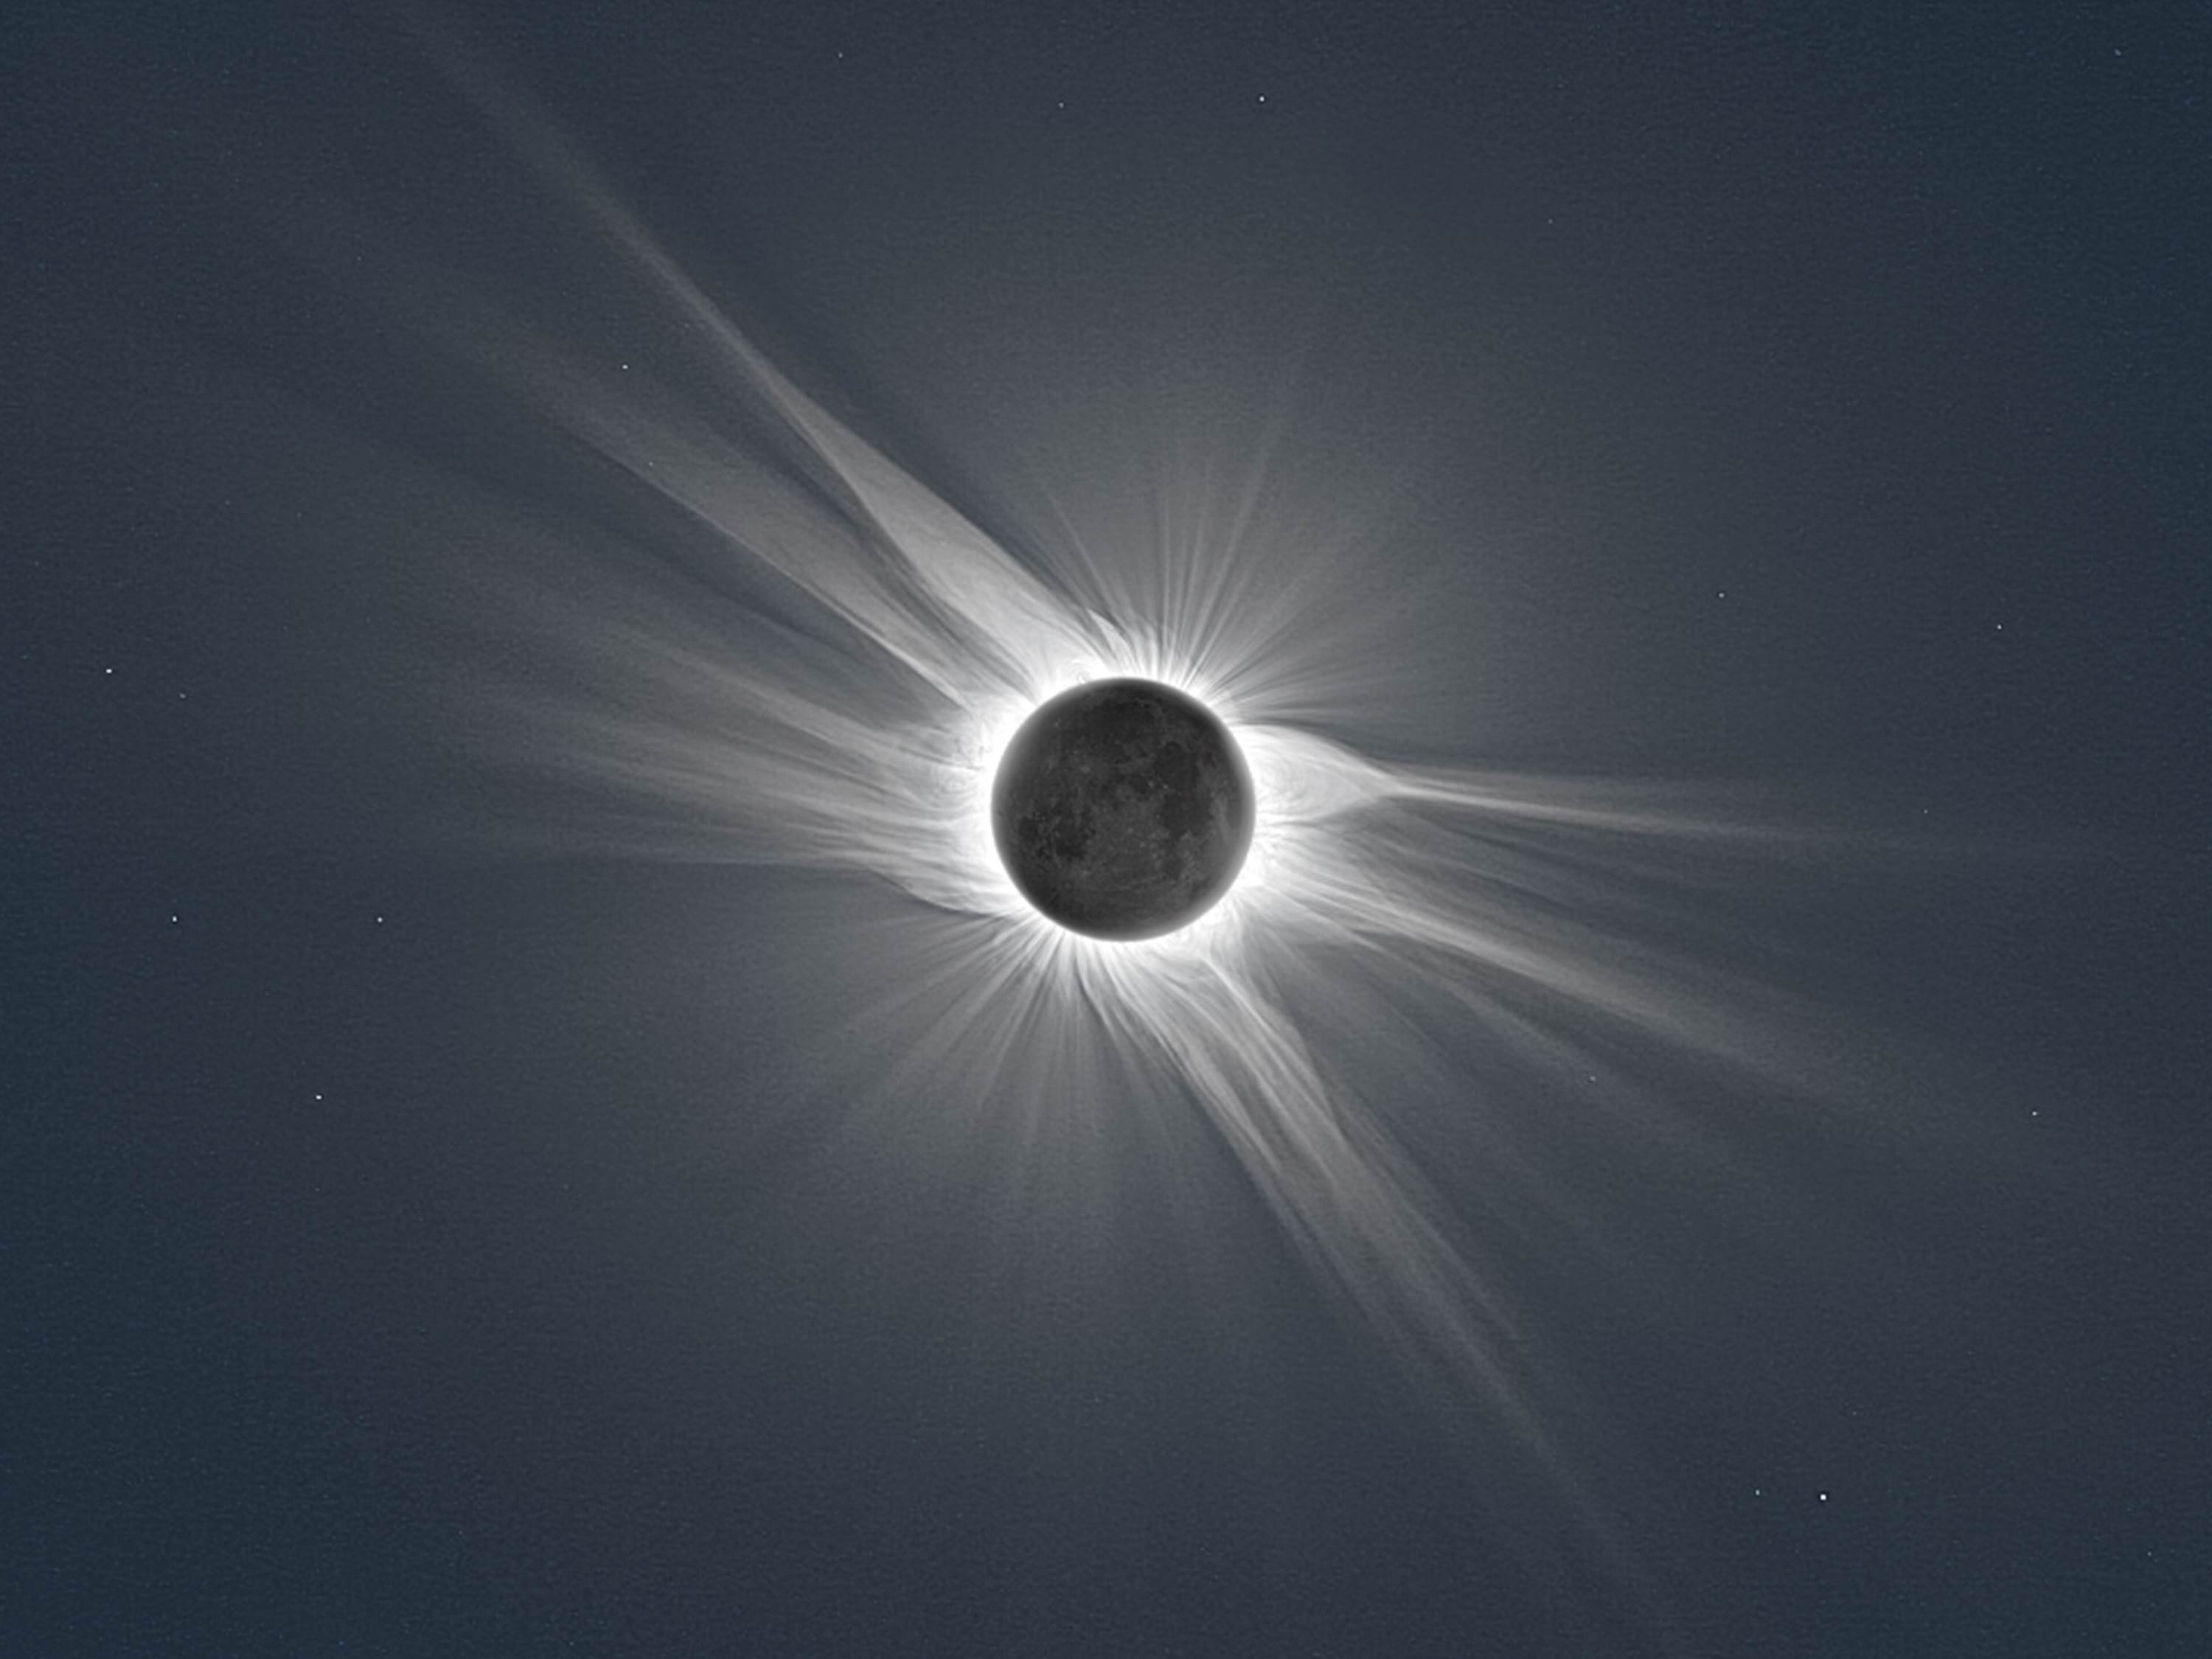
Late in totality.
I was surprised how quickly it becomes dark as totality approaches. We had 2 minutes and 38 seconds of totality. Just as soon as totality started, fish near me jumped out of the water, and birds and crickets started chirping.
Back in Huntsville, which experienced 97% of totality, I was taking air temperatures every 10 sec in our backyard. I took ambient air temperature, as well as the air temperature in a Styrofoam cooler, painted black inside, with Saran Wrap covering it. The ambient air temperature drop during the maximum portion of eclipse was about 10 deg. F, while temperature drop in the cooler was over 100 deg. F.
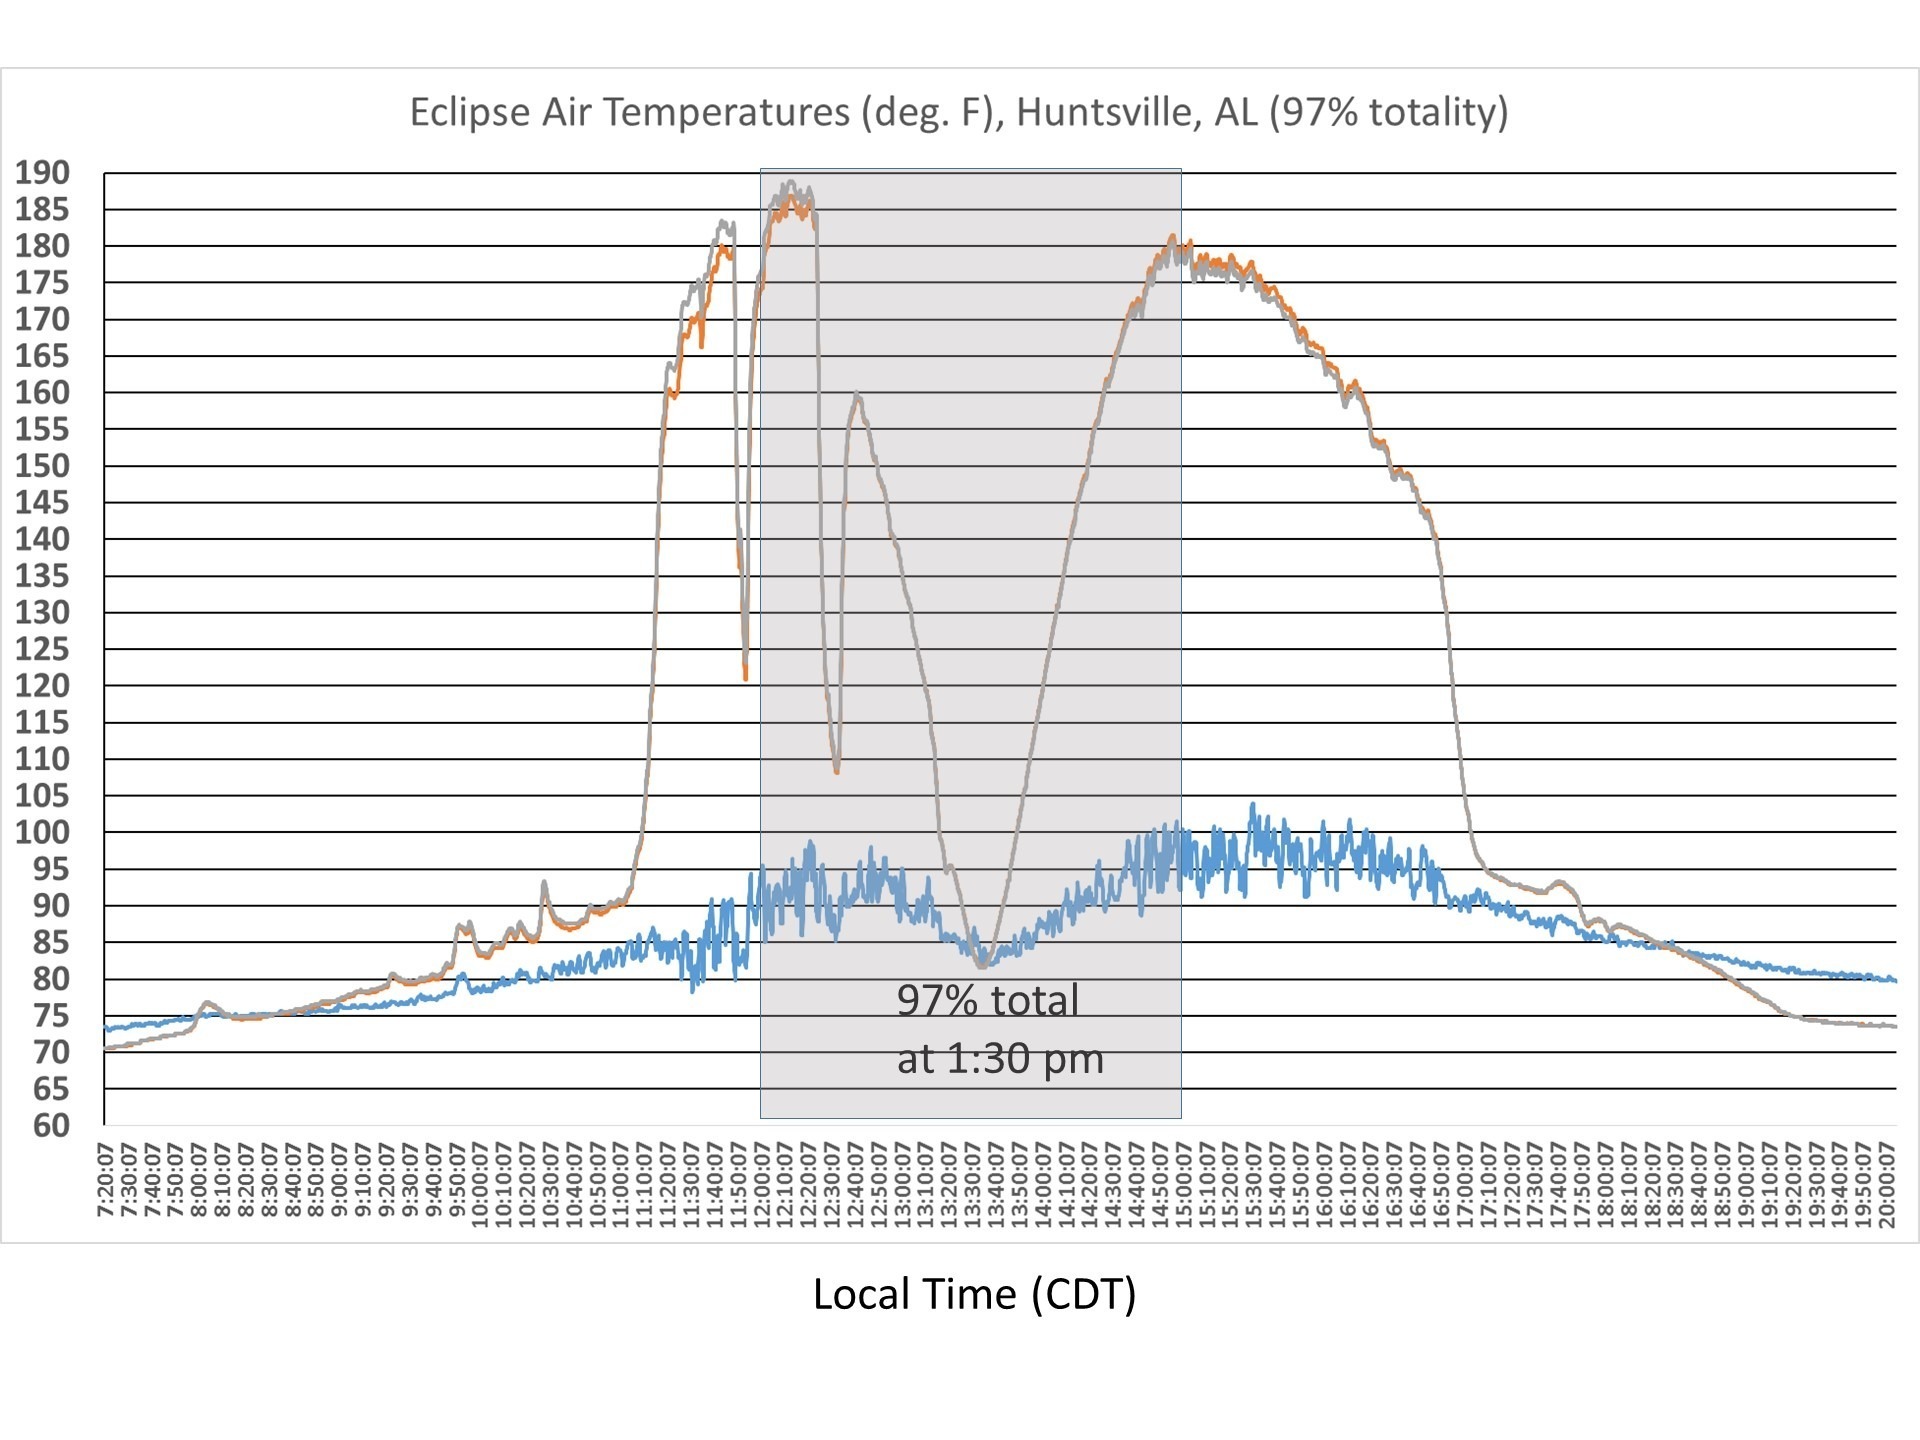
Air temperatures outside (blue trace) and inside a Styrofoam cooler (other 2 traces) during the solar eclipse in Huntsville, AL, 21 August 2017.
It was a thoroughly enjoyable experience. This was my first total eclipse, and we were indeed fortunate to have good weather for it.