Home/Blog
No, not that kind of feedback…
BACKGROUND
It’s been quite a while since I’ve discussed why the diagnosis of feedbacks in the climate system (and thus climate sensitivity) from observations is biased toward high climate sensitivity. It’s a controversial topic, one which we have a few published papers on, yet one I am more firmly convinced about than any other climate research I have ever published.
I’m pretty convinced that most of our detractors on the subject don’t even know what we are talking about. The refutations against our work have been a mixture of strawman arguments, red herrings, silliness, and deception.
To put it simply, if temperature change causes a change in the top-of-atmosphere radiative balance, then you can (with some assumptions regarding time lags) diagnose feedbacks by simply regressing the radiative variations against the temperature variations. BUT if it is instead a time-varying radiative imbalance causing a surface temperature change (causation reversed), then you cannot diagnose feedbacks.
If you try, then you will usually diagnose positive feedback, even if strongly negative feedback exists. Our most complete analysis of the effect was described here.
In general, both directions of causation are operating in the climate system. People like Andy Dessler will claim that ALL radiation changes are ultimately caused by temperature change, maybe at some earlier time, and so he thinks you can diagnose feedback.
But I totally reject that…there are many reasons why (for example) clouds (and thus albedo) can change that are not caused by temperature.
And if Dr. Dessler really believes it, why does he not include a time lag in his feedback diagnoses? (It usually take time — sometimes months — for the atmospheric response to a surface temperature change to fully develop). When you do that, the diagnosed feedback parameter almost always shifts in the direction of low climate sensitivity (Dick Lindzen has also published work on this issue).
ANOTHER REASON WHY FEEDBACKS CAN BE BIASED POSITIVE
For years, I’ve been mulling another reason (other than the radiation-causing-temperature change one) for diagnosed feedbacks to be biased positive. It would occur if different sources of climate variation have different feedbacks.
When feedbacks are strongly negative, then temperature changes will be minimized, because that’s what negative feedback does — it damps temperature change.
But when feedbacks are positive, the temperature changes are allowed to grow.
So, the BIG temperature changes and their associated radiation changes during positive feedback events will dominate our observations of the climate system, while the small temperature changes during negative feedback events will be less noticeable.
The net result will be an average diagnosed feedback that is biased positive, that is, toward high climate sensitivity, because we are really only analyzing the big climate events that were allowed to grow due to positive feedbacks.
1D FORCING-FEEDBACK MODEL TEST
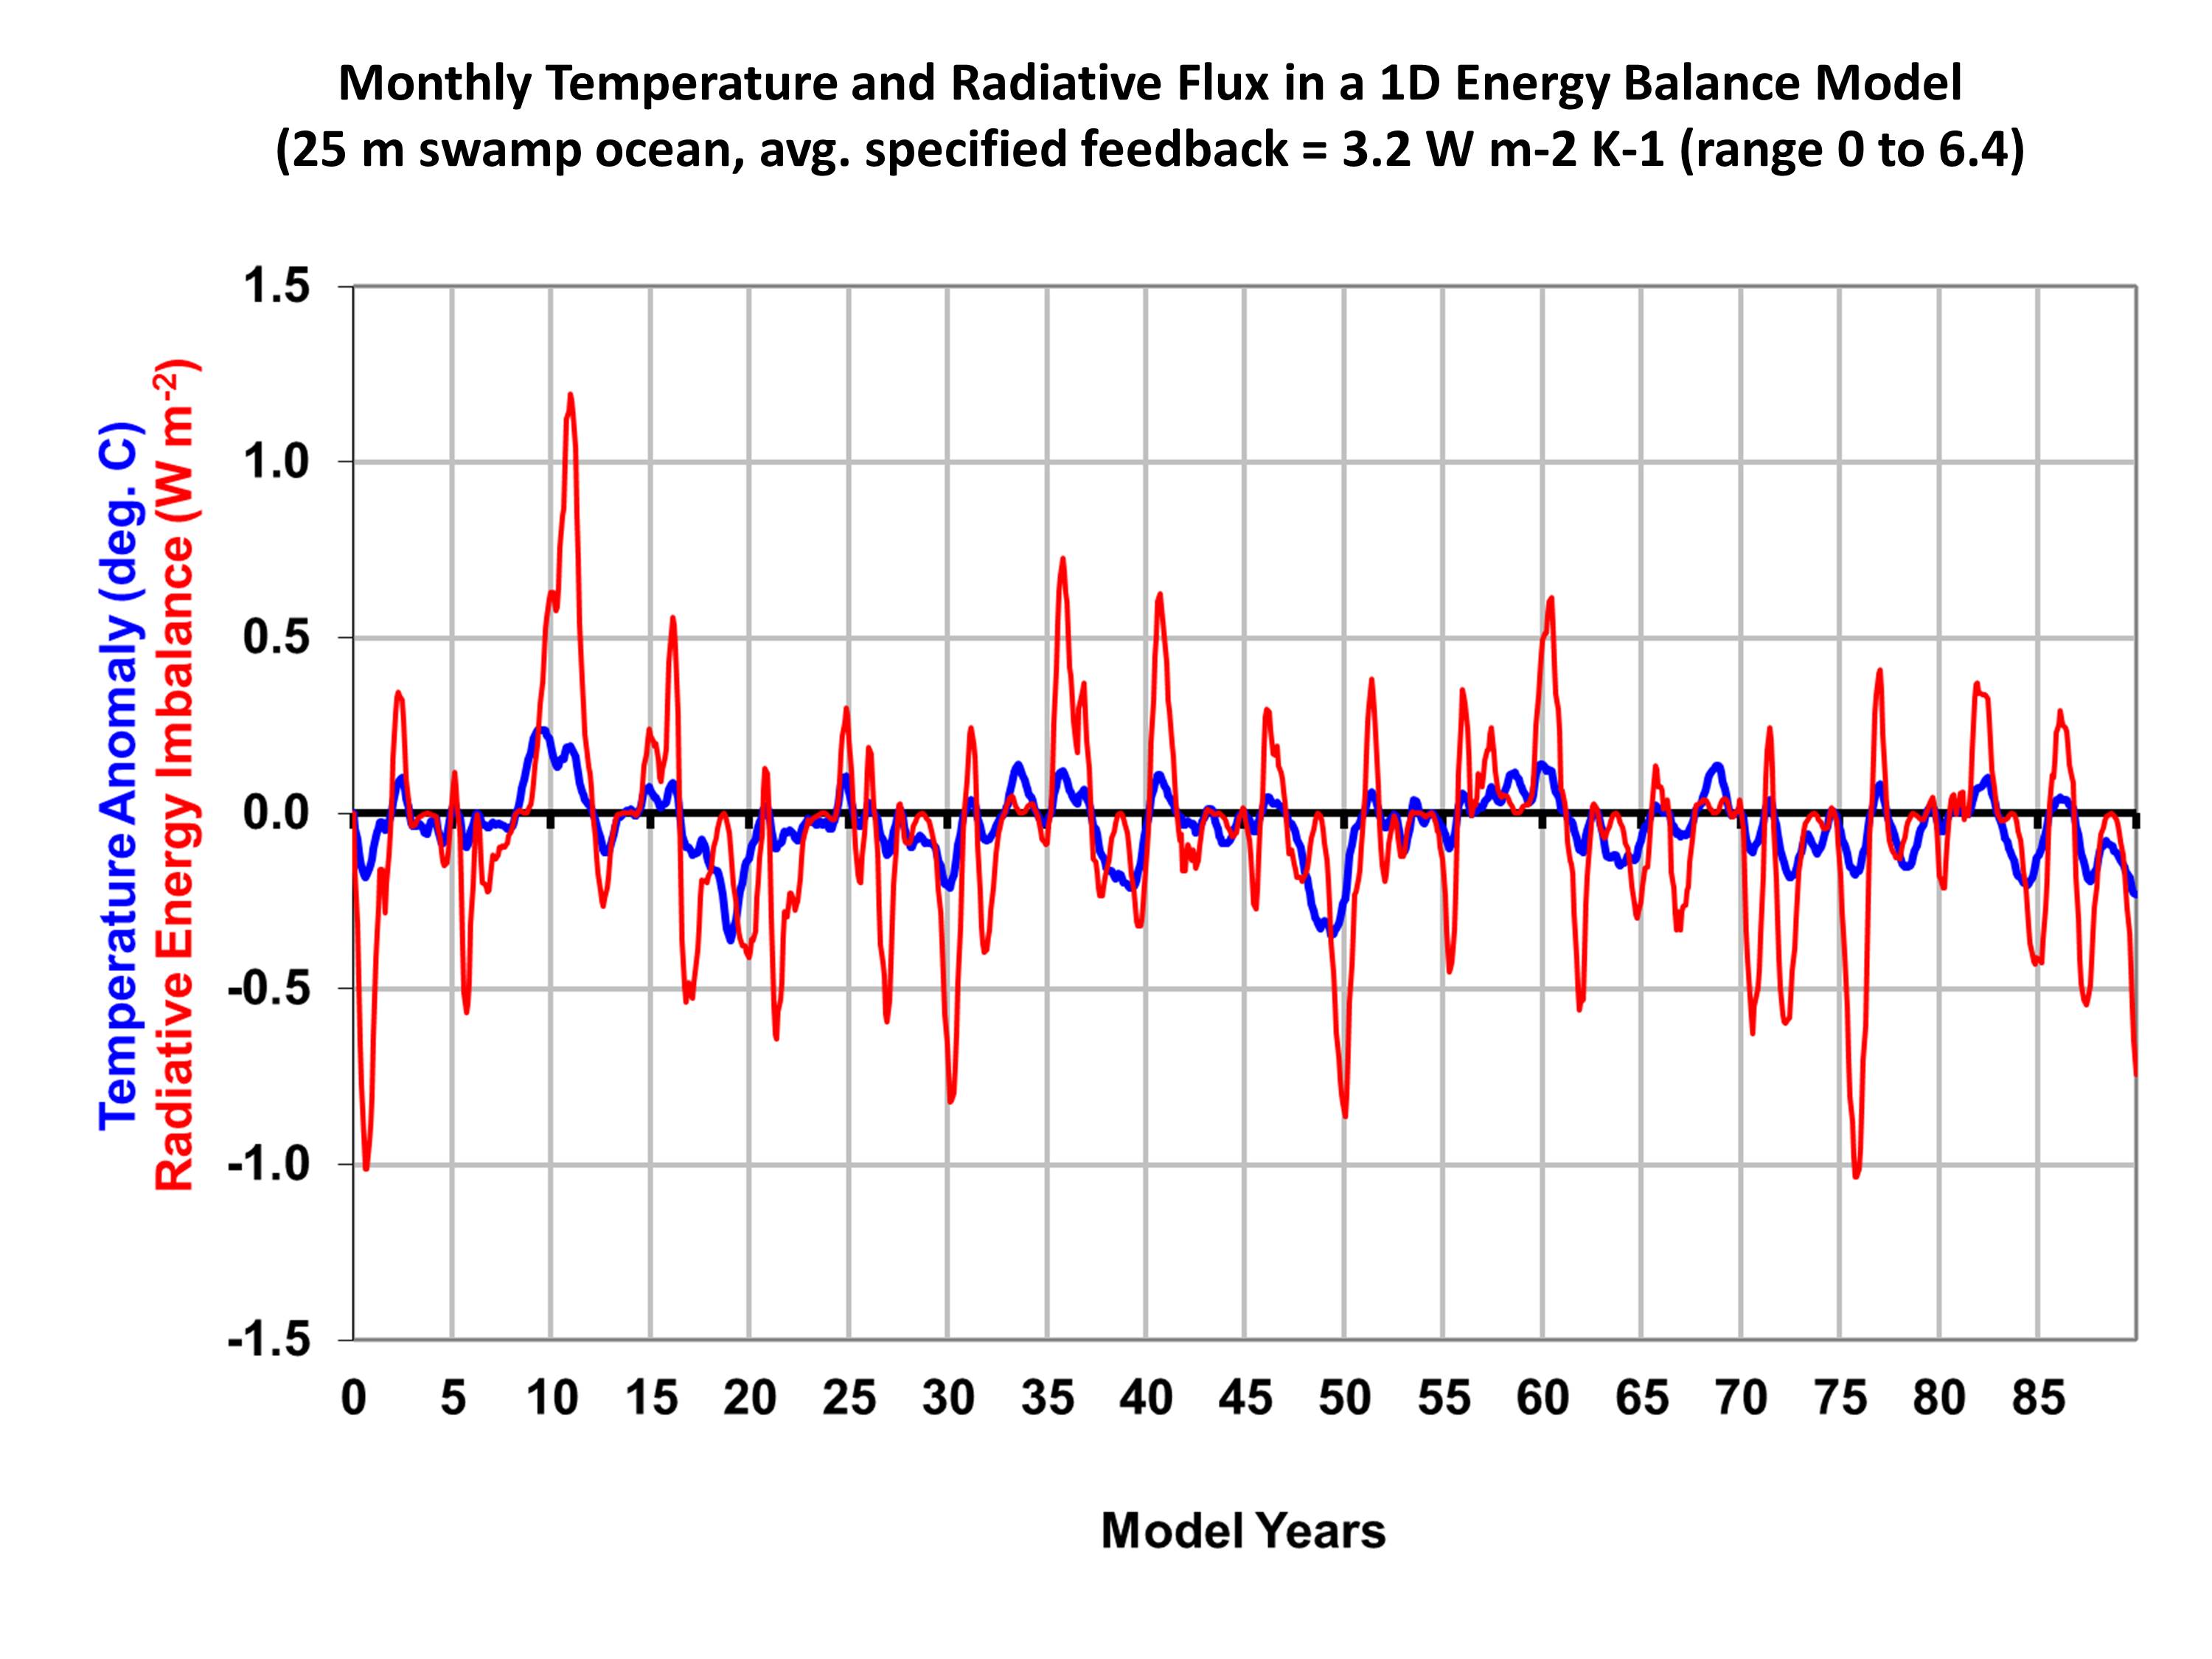
One can test this idea quantitatively with a simple 1D forcing-feedback energy balance model (like the one we have use in our papers, but here assuming a simple 1-layer swamp ocean 25 m deep, and a 30 day time step). If I force the ocean surface temperatures departures from an average state with a random number generator that is smoothed in time, then assume a sinusoidally varying feedback parameter between 0 and 6.4 W m-2 K-1 over a period of 28 months as the radiative response to those temperature variations, I get behavior like this:
The net feedback parameter diagnosis is then usually just the regression slope between the radiative flux variations and the temperature variations, which from the model output looks like this:
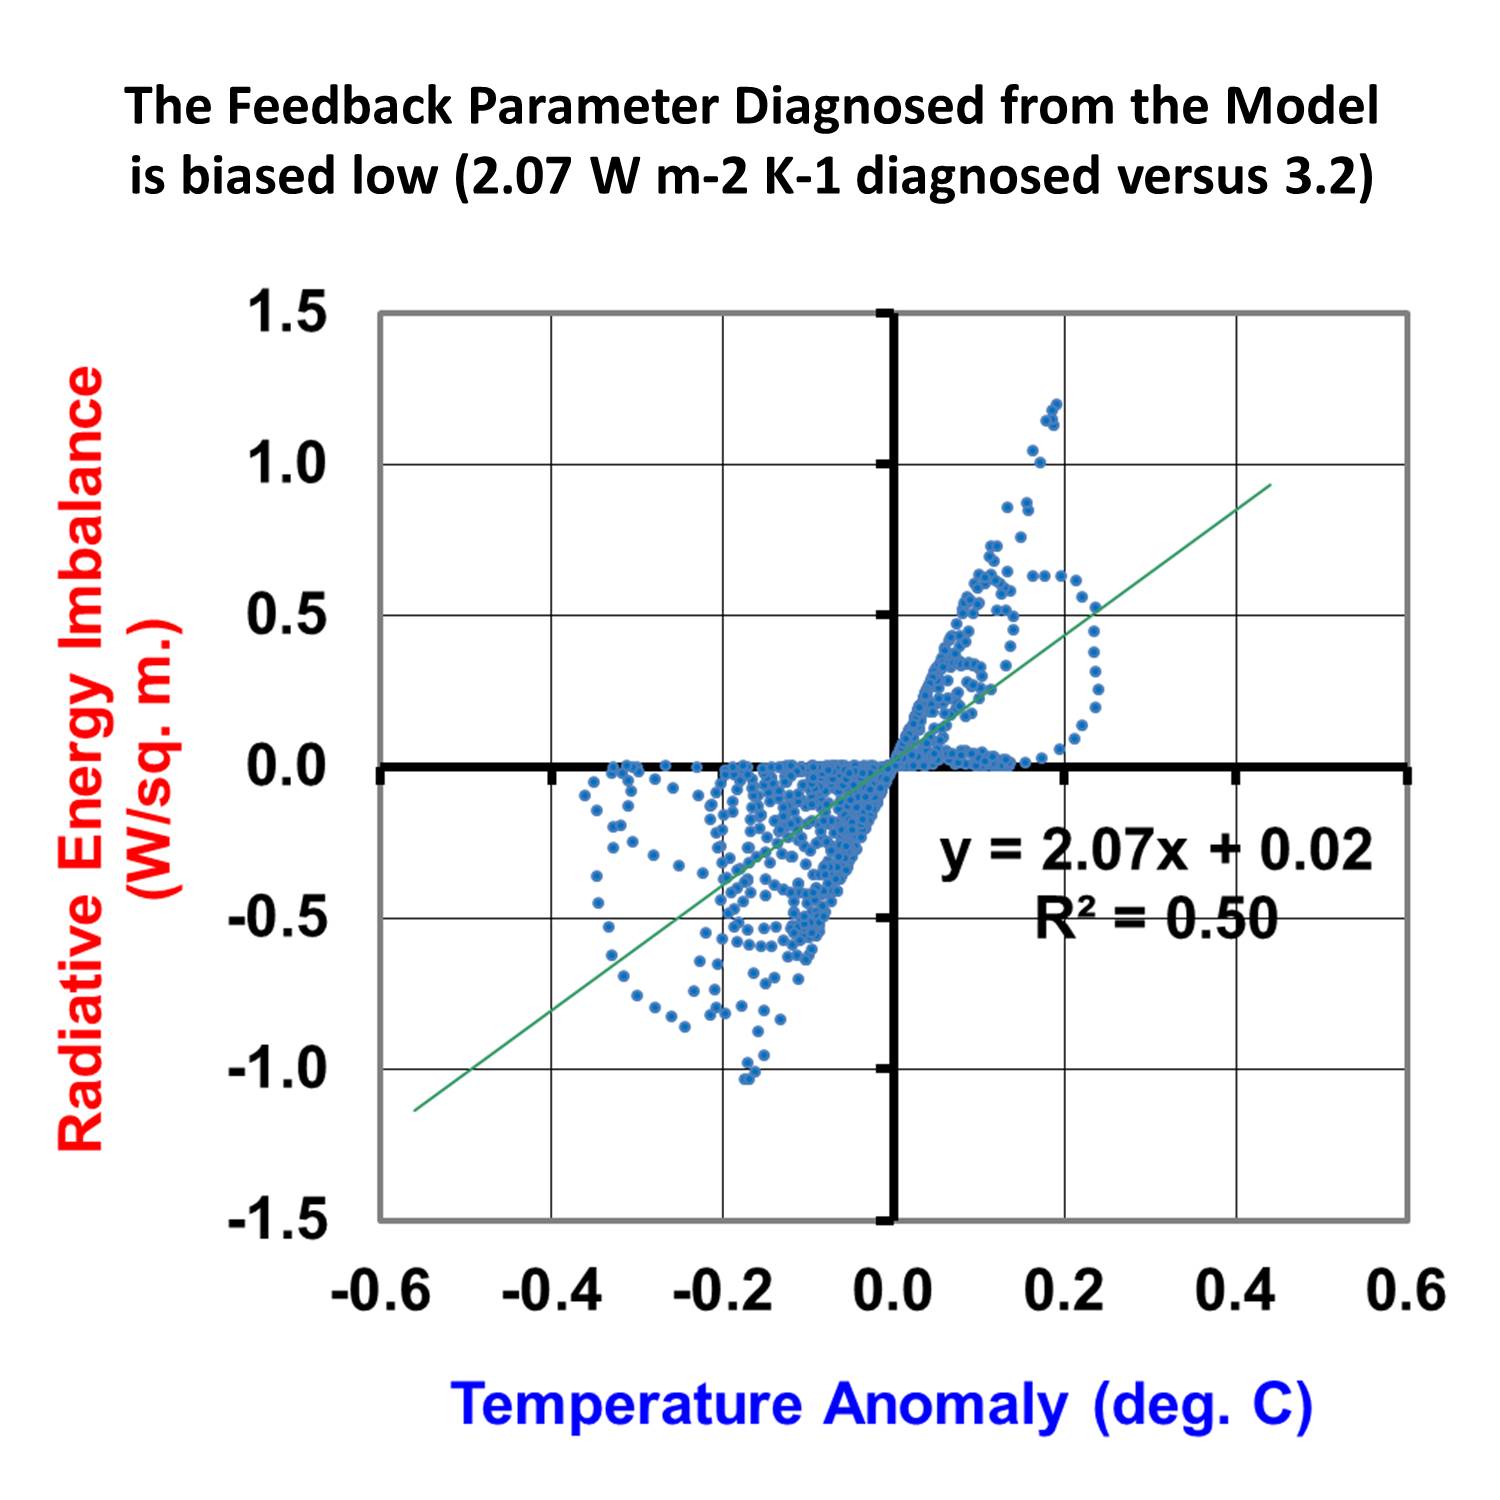
We see that the regression diagnosis of the feedback parameter is biased low. Instead of an average of 3.2 W m-2 K-1 as specified (which would be 1.2 deg. C equilibrium climate sensitivity), the diagnosis is 2.07 W m-2 K-1 (about 1.8 deg. C climate sensitivity).
If I add in some time-varying radiative forcing like we have addressed in our recent papers (e.g. this one), the bias toward high climate sensitivity is even greater (not shown here).
The above discussion is nowhere near exhaustive; I’m just trying to stimulate thought and discussion on an issue I feel very strongly about, that is: climate feedbacks diagnosed from observational data are very error-prone, with the errors most likely leading to overestimates of climate sensitivity.