Archive for the ‘Blog Article’ Category

Winter Returns: Rockies Expecting Up to 5 ft

Wednesday, April 15th, 2015

Updated with model forecast made Thursday morning, April 16.

A strong spring storm developing over the Northern Rockies will bring heavy snow and strong winds to portions of Wyoming and Colorado over the next few days, with the heaviest snows expected on Friday. Winter storm watches and warnings are starting to be issued, with more modest snow totals expected in Montana, Idaho, Utah, and New Mexico.

Predicted total snowfall amounts from the GFS model reach up to 5 ft by Sunday morning in the mountains (graphic courtesy of Weatherbell.com):
gfs_6hr_snow_acc_central_13

The cold air mass is expected to then shift east, with reinforcing cold air coming south through Canada, bringing a chance of Spring snows to the upper Midwest, including Chicago, by late next week.

Why Summer Nighttime Temperatures Don’t Fall Below Freezing

Friday, April 10th, 2015

frozen-lady-libertyThere’s something about the greenhouse effect /sky radiation / downwelling infrared / back radiation issue that keeps drawing me back to the subject.

I guess it’s the number of people who don’t believe the so-called greenhouse effect exists (I still get e-mails from them, even today), combined with the difficulty of convincing them that their everyday experience is consistent with its existence.

I’ve used a handheld IR thermometer to directly measure its effect (the temperature of the surface of a thermopile in the device increases as you scan from pointing straight up in a clear sky to pointing at an angle…voila! Downwelling sky radiation changing surface temperature!). But, no, that’s not enough.

I’ve also tried to explain that the temperature of the Earth and its atmosphere (or anything else, for that matter) is a function of rates of energy gain and energy loss, not of just how much solar radiation is absorbed. I’ve argued this using the analogy of insulation in a house…even though the insulation does not add “new energy” (just as the atmospheric greenhouse effect doesn’t add new energy to the Earth system,) it does make the house warmer in winter by reducing the rate of energy loss to its colder surroundings.

But, no, that’s not accepted since, you know, house insulation works by conduction, not by radiation. Sigh.

So, just for laughs, here’s another demonstration, involving a simple model of the cooling of the soil at night.

At night the soil cools by loss of infrared radiation. The Stefan-Boltzmann equation lets us estimate the rate at which IR energy is being lost based upon surface temperature and emissivity, and simply dividing that by the product of the soil depth and soil bulk heat capacity gives us the rate at which the soil layer temperature will fall. Basic physics and thermodynamics.

From that we can make a simple time-dependent model to calculate the change in temperature throughout the night. This simple spreadsheet model I’ve provided here will allow you to change assumed parameters to see how to get a realistic temperature decline over 12 nighttime hours. What you will find is that the temperature falls to unrealistically cold levels unless you assume a large downwelling energy flux from the sky into the soil (also adjustable in the model).

If you are wondering, “what about cooling of the atmosphere in contact with the ground?”, well just make the soil layer deeper…it turns out that 0.2 meters of soil is equivalent in bulk heat capacity to about 200 m of atmosphere.

The adjustable parameters (in red in the spreadsheet) are soil depth (0.2 m is typical for day-night temperature changes), the soil heat capacity (2.5 is typical, water is 4.18), the IR emissivity (0.90-0.95 would be typical), the downwelling sky radiation intensity (0 for all you sky dragon slayers [SDSs] out there, 250-350 for the rest of us), and the starting temperature (300 K is about 80 deg. F).

For example, for a 0.2 m moist soil layer (about 8 inches thick), starting at 80 deg. F, the rate of energy loss over 12 hours is enough to cool that soil layer down to 25 deg. F….IF you don’t assume any downwelling IR from the sky (the SDS-recommended setting):

soil-cooling-model-no-GHE

But, if you assume the Trenberthian global-average value of 330 W/m2 for downwelling sky radiation, the soil cools from 80 to about 67 deg. F, a much more realistic value:

soil-cooling-model-with-GHE

In reality, the soil surface cools faster that does the deeper layers, but I didn’t want to complicate things with a multi-level model (which I don’t have time to work on anyway). This is just a simple, bulk model calculation meant to illustrate how extremely cold it would get at night without downwelling IR from the sky (aka, the “greenhouse effect”) reducing the net rate of energy loss to outer space.

Of course, downwelling IR from the sky is going on 24-7-365, acting to keep daytime temperatures warmer than they would otherwise be, too.

Warmer daytime + warmer nighttime = Warmer Earth.

Now, as I’ve mentioned before, as much as 75% of this big, bad greenhouse effect is “short-circuited” by convective heat loss by the surface, which is almost entirely a daytime phenomenon over land (nighttime surface temperatures quickly cool the near-surface air to make it convectively stable). (And, just for completeness, a greenhouse atmosphere is colder in the upper layers than it would otherwise be.) My point is that, just because the “greenhouse effect” exists doesn’t mean that our 1-2% enhancement of it with carbon dioxide is going to cause anything bad to happen. There are natural cooling mechanisms in place for the lower atmosphere. The stratosphere, though, probably will cool, as we have seen in satellite data.

But denying the existence of downwelling IR radiation from the sky (which is measured continuously at many sites around the world) is, in my opinion, a losing strategy.

Now, let the silliness begin….

Amazing Video of Rochelle, IL Tornado Yesterday

Friday, April 10th, 2015

Storm chasers captured over 6 minutes of amazing footage of the EF3 or EF4 tornado that killed one person and caused extensive damage in Fairdale, Illinois (northeast of Rochelle, southeast of Rockford) yesterday. This is one of the best tornado videos I have ever seen.

For those hearing this was a global warming-fueled tornado, here’s my post from 4 years ago explaining why more tornado activity typically requires an unseasonably cool airmass.

If warm, moist air was the missing ingredient, the tropics would be filled with tornadoes.

And if you are wondering, “Well, couldn’t more warm, moist air next to a cool air mass enhance tornado formation?” Well, yes, except the equator-to-pole temperature contrast has decreased during warming, not increased. In other words, the cool air masses have warmed more than the warm airmasses, reducing the available energy for these types of storms.

It’s just weather, folks. Global warming didn’t cause your tornado, and it didn’t cause your daughter’s asthma.

Has The Guardian “Rolling Stoned” Christy & Spencer?

Tuesday, April 7th, 2015

That tireless ecological zealot over at The Guardian, Dana Nuccitelli, took the opportunity of our 25th anniversary of satellite-based global temperature monitoring to rip us a new one.

Comparing John Christy and me to “scientists who disputed the links between smoking and cancer”, Dana once again demonstrates his dedication to the highest standards of journalism.

Well done, Grauniad.

I prefer to compare us to Barry Marshall and Robin Warren, who rejected the scientific consensus that peptic ulcers were due to too much stress or spicy food. While they eventually received the Nobel Prize after years of ridicule and scorn from the medical research community, we have no illusions that we will ever be credited for our long-standing position that global warming fears have been overblown. I’m sure the UN’s IPCC will find a way to take credit for that, and get another Peace Prize for it.

(I wonder if Marshall and Warren were being paid off by the spicy food lobby?)

The “97% of all climate scientists agree“ meme that Dana bitterly clings to has been thoroughly discredited…. as if scientific consensus on something so poorly understood as climate change (or stomach ulcers 15 years ago?) really means anything, anyway.

To prove that Dana should probably avoid trying to interpret simple graphs, let’s examine this chart he so likes, which allegedly shows that our (UAH) global temperature dataset has been continually adjusted for errors over the years, resulting in an increasing warming trend:

Danas-excellent-chart

Now, setting aside the fact that (1) we actually do adjust for obvious, demonstrable errors as soon as they have been found (unlike the IPCC climate modelers who continue to promote demonstrably wrong models), and (2) RSS gets about the same (relatively benign) warming trend as we do, let’s examine some other popular temperature datasets in the same manner as the above graph:

Accum_Trend

Looks a lot like Dana’s plot, doesn’t it?

Do you want to know why? Is it really because all those other temperature dataset providers were also busily correcting mistakes in their data, too?

No, it’s largely because as the years go by, the global temperature trend changes, silly.

About the only thing Dana got reasonably correct is his article’s tag line, “John Christy and Roy Spencer are pro-fossil fuel and anti-scientific consensus.”

You’re damn right we are. But not because we are paid to say it, which we aren’t. (What are you paid to say for The Guardian, Dana?)

We are pro-fossil fuel because there are no large scale replacements available, wind and solar are too expensive, and you can’t just cut fossil fuel use without causing immense human suffering. Yes, I’ve talked to some of the top economists about it.

And indeed we are “anti-scientific consensus” because the consensus (which mostly just follows the average of the IPCC climate models) has been demonstrated to be wrong.

Finally, if Dana objects to me tiring of being called a “global warming denier” (with the obvious Holocaust connotations) for the last seven eight years and fighting back, read this and then tell me where I am wrong.

Answering Ron Bailey’s Question: “What Evidence Would Persuade You That Man-Made Climate Change Is Real?”

Monday, April 6th, 2015

I just found out that Ron Bailey at Reason.com published an article a few days ago entitled, “What Evidence Would Persuade You That Man-Made Climate Change Is Real?

I’ve spent some time with Ron, and he is a very sharp guy. That’s why I’m a little disappointed that he would publish this mixture of straw man arguments and uncritical thinking. He is the only deep thinker I know of who switched from being a skeptic about the causes of global warming to a believer…an epiphany which occurred in 2005, according to the article. (Hmmm…I wonder if he was fooled by all those major hurricanes that hit the U.S. that year? It’s now almost 10 years later, and we haven’t had one since.)

The first problem I have is with his premise: that skeptics believe humans have no role in climate change. I don’t know of any serious skeptics who hold such a view. Now, maybe he is addressing people who deny any human involvement in global warming. His article is vague, and maybe he can clarify his intent for us.

The second problem I have is with Ron’s list of a variety of evidences of global-average warming, which (again) no skeptic worth their salt disputes. The science dispute is over how much of the warming is manmade versus natural. Like too many others, Ron conflates climate change with human-caused climate change, which are not the same thing.

Regarding his list, he seems to believe they are independent evidences of manmade warming. Wrong. To the extent warming occurs, even if it is entirely natural, warming would occur in the atmosphere and deep ocean; it would cause an increase in atmospheric water vapor, as well as precipitation; the warming would be stronger in the upper troposphere than the lower troposphere; and stronger over land than over the ocean.

These things would all occur together anyway, no matter the cause of the warming, Ron. And causation is, indeed, the question which science so far cannot answer.

Since climate models cannot even hindcast what has happened (let alone forecast), they clearly have no handle on multi-decadal temperature changes brought about by natural effects. There does not even need to be any forcing — e.g. the sun, volcanoes, etc. — in order for climate to change because the ocean-atmosphere system is nonlinear and dynamical — in a word, chaotic. It can change all by itself. For example, it this plot we see that global warming (and cooling) has been the rule, not the exception, for the last 2,000 years:

Ljungqvist-2000-yrs-temp-reconstruction

If the above graph is anywhere close to what has actually happened, then most centuries have experienced global warming or cooling. So, what would it take to predict global warming (along with all of the correlated changes, listed above) due to any cause you’d like to invoke?

Basically, all it takes is a flip of a coin.

If you wonder, how could so many scientists be wrong? Well, the medical community had millions of peptic ulcers to study, and it took decades (and two brave Australian researchers) to finally convince them of a bacterial basis for ulcers.

The Earth, in contrast, is a single subject, and we can’t easily or quickly test its response to various treatments. It would be very easy for group think to dominate the scientific community, especially when continued funding depends on a continued climate crisis.

A third problem I have with Ron’s article: he uses “falsifiable predictions” of the future as evidence supporting his case! Really? Well, we’ve already had abundant predictions of what would happen by now from modelers like James Hansen that have turned out to be wrong. There you go, skeptics have real falsified predictions they can point to….not predictions of what might happen 10 years from now.

Why didn’t he mention the recent increase in papers (our APJAS paper included) with evidence that recent warming has been partly natural? Yes, as he says, natural variability can work both ways (warming OR cooling), but the available evidence is that recent warming was partly due to nature. Significantly, that warming occurred during the period when climate modelers developed their models, and since they assumed all warming was manmade, they had to increase the models’ sensitivity. Now, they are between a rock and a hard place, continuing to publish overly-sensitivity models they know are wrong (based upon both surface AND deep ocean warming rates).

Such a travesty would never be allowed in a hard discipline that uses physics, like engineering. An impartial judge with any cajones wouldn’t even allow climate models as evidence in a court of law since they have, so far, largely failed in their predictions.

Does Ron know that the deep-ocean warming since the 1950s is so weak (if it is even real from an observational error perspective) that it represents only a 1 part in 1,000 imbalance between incoming and outgoing energy? Do we really believe that chaotic changes in the circulations of the ocean and atmosphere cannot create such a tiny imbalance? The above graph (along with historical evidence of the Little Ice Age and Medieval Warm Period) suggests such small changes are fairly routine.

So, Ron asks what evidence would convince me that recent warm was manmade? Well, how about knowledge of how much natural climate change would have occurred without human influence? Then we would know the remainder was human-induced. Except, there is no way to know the natural component. If there was, climate models would have reasonably replicated the temperature changes since the 1950s rather than looking like a bowl of spaghetti.

And since I already believe manmade climate change (to some non-zero extent) is real, maybe I can ask Ron: What evidence would persuade you that your original question is nothing more than a straw man argument?

I hate to impute motives, but I really have to wonder if he is succumbing to peer pressure, since believing anything that smacks of denial-ism is really frowned upon in the intellectual circles I’m sure Ron is part of.

Yes, I believe that adding CO2 to the atmosphere has probably caused some warming, even though there is no way to prove it. Just how much human-caused warming is the question. And, as Ron correctly notes, it says nothing about what if anything should (or even can) be done about it anyway.

Global Temperature Update for March, 2015: +0.26 deg. C

Friday, April 3rd, 2015

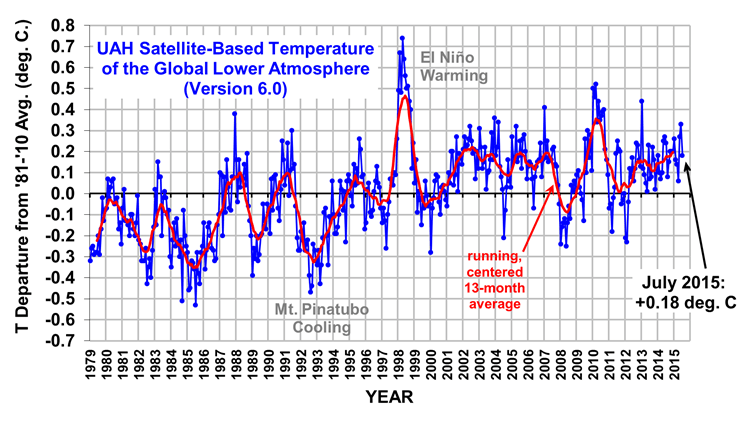
The Version 5.6 global average lower tropospheric temperature (LT) anomaly for March, 2015 is +0.26 deg. C, down a little from the February, 2015 value of +0.30 deg. C (click for full size version):
UAH_LT_1979_thru_March_2015_v5

The global, hemispheric, and tropical LT anomalies from the 30-year (1981-2010) average for the last 15 months are:

YR MON GLOBAL NH SH TROPICS
2014 01 +0.291 +0.387 +0.194 -0.029
2014 02 +0.170 +0.320 +0.020 -0.103
2014 03 +0.170 +0.338 +0.002 -0.001
2014 04 +0.190 +0.358 +0.022 +0.092
2014 05 +0.326 +0.325 +0.328 +0.175
2014 06 +0.305 +0.315 +0.295 +0.510
2014 07 +0.304 +0.289 +0.319 +0.451
2014 08 +0.199 +0.244 +0.153 +0.061
2014 09 +0.294 +0.187 +0.401 +0.181
2014 10 +0.365 +0.333 +0.396 +0.189
2014 11 +0.329 +0.354 +0.303 +0.247
2014 12 +0.322 +0.465 +0.178 +0.296
2015 01 +0.351 +0.553 +0.150 +0.126
2015 02 +0.296 +0.433 +0.160 +0.014
2015 03 +0.256 +0.409 +0.103 +0.082

We are probably past the point of reaching a new peak temperature anomaly from the current El Nino, suggesting it was rather weak.

The global image for March, 2015 should be available in the next several days here.

Popular monthly data files (these might take a few days to update):

uahncdc_lt_5.6.txt (Lower Troposphere)
uahncdc_mt_5.6.txt (Mid-Troposphere)
uahncdc_ls_5.6.txt (Lower Stratosphere)

25th Anniversary of Global Satellite Temperature Monitoring

Wednesday, April 1st, 2015

Photo -Eric Schultz.

Photo -Eric Schultz.

Sunday marked the 25th anniversary of John Christy and I announcing the new technique for monitoring global temperatures with satellites. We had no idea the methodology would end up being central to the global warming wars. It’s been a wild ride since then.

A story today by Paul Gattis at AL.com has the details:

The silver anniversary of Roy Spencer’s career-defining moment arrived with no expectation in March. He didn’t realize it until someone mentioned it to him.

For John Christy, he had no idea that a discovery announced in 1990 would not only still resonate 25 years later but would be at the center of a raging debate.

The date was March 29, 1990. That was the day – though unbeknownst to either Christy or Spencer – they publicly became climate change skeptics.” ..the rest of the story here.

White House Declares April “Earth Month”

Wednesday, April 1st, 2015

EH_switchAfter Saturday night’s unprecedented success with Earth Hour, the White House announced today that, by Executive Order, April has been declared “Earth Month”, the next step in reducing our dependence on fossil fuels.

For the month of April, U.S. residents and businesses are being required to turn off all electrical appliances and lights. A special waiver is being given to electric cars and homes running entirely on solar-powered electricity. Compliance will be monitored by volunteers who report infractions to a special EPA hotline.

White House press secretary Josh Earnestly stated, “The President’s science advisor has informed us that the resulting reduction in greenhouse gas emissions, especially from coal-fired power plants, will be the same as taking 92 billion cars off the road for 15 years.”

While hospitals will be inconvenienced as life-saving equipment is shut down, economist Paul Krugman has stated that there will be a significant savings in the health care sector as fewer and fewer patients will eventually be requiring such services. “The U.S. population will, on average, be healthier at the end of the month”, Krugman said.

When asked how the country can function without using electricity, Josh Earnestly replied, “If North Korea can do it, so can we.” Repeated attempts to reach North Korean leader Kim Jong Un for comment were unsuccessful.

This is Your President’s Science Advisor

Saturday, March 21st, 2015

A President’s political appointees are chosen because their views support the President’s political leanings. This is to be expected.

One might expect the Science Advisor position to be more politics-free, but not these days. The President’s choice of John Holdren, previously a professor at Berkley, to be his science advisor tells us something about his policies.

Holdren wrote this 1975 newspaper article, entitled Too Much Energy, Too Soon, a Hazard, about the dangers of having too much energy available for human use.

Among some of the gems of wisdom there, we find this:

Finally, less energy can mean more employment. The energy producing industries comprise the most capital intensive and least labour intensive major sector of the economy. Accordingly, each dollar of investment capital taken out of energy production and invested in something else, and each personal consumption dollar saved by reduced energy use and spent elsewhere in the economy will create more jobs than are lost.

Now, one doesn’t need to be an economist to see the problem with this position. Holdren thinks that because the energy sector generates so much energy so efficiently with so few people and with so much capital investment, that must be a bad thing. He is either unaware (he can’t be that stupid) or he chooses to hide the fact that all of that energy is demanded by the rest of the country for everything we do. Energy enables people to make things and provide services.

As I’ve said before (and I’ve asked some of the nation’s top economists about the validity of my views), if you really want full employment, just put everyone to work digging holes in the ground and filling them up again. Just having “jobs” is not the desired goal; what we do in those jobs makes all the difference. Jobs must efficiently provide goods or services desired by the rest of society in order for everyone, poor and rich alike, to prosper.

And abundant, affordable energy is required for all of those productive jobs.

It literally scares me that people like this have so much influence in our country.

Color Satellite View of Solar Eclipse

Friday, March 20th, 2015

Here’s a NASA MODIS view of this morning’s solar eclipse from the Terra polar-orbiting satellite. Terra takes a “snapshot” as it passes over every ~100 minutes, and this montage shows three successive orbits, with the second orbit capturing the effect of the eclipse on the solar illumination of the landscape and clouds. Note the distinctive difference in color (click image for full-size):

NASA's Terra satellite MODIS imager captures effects of the solar eclipse on March 20, 2015.

NASA’s Terra satellite MODIS imager captures effects of the solar eclipse on March 20, 2015.