The recent devastating floods in western North Carolina were not unprecedented, but were certainly rare. A recent masters thesis examining flood deposits in the banks of the French Broad River over the last 250-300 years found that a flood in 1769 produced water levels approximately as high as those reported in the recent flood from Hurricane Helene. So, yes, the flood was historic.
Like all severe weather events, a superposition of several contributing factors are necessary to make an event “severe”, such as those that led to the NC floods. In that case, a strong hurricane combined with steering currents that would carry the hurricane on a track that would produce a maximum amount of orographic uplift on the east side of the Smoky Mountains was necessary in order to produce the widespread 12-20 inch rainfall amounts, and the steering currents had to be so strong that the hurricane would penetrate far inland with little weakening.
Again, all severe weather events represent the somewhat random combining of amplifying components: In the case of Hurricane Helene, they produced the unlucky massive flooding result that the region had not seen in hundreds of years.
The Random Component of Precipitation Variability
The rare superposition of several rare contributing factors, or the more common superposition of more common factors, can be examined through statistics when one examines many events. For example, it has long been known that precipitation statistics gathered over many years exhibit a log-normal frequency distribution. Simply put, the lowest precipitation amounts are the most frequent, and the highest amounts are the least frequent. This is the statistical result of the superposition of contributing factors, such as (in the case of excessive rainfall) abundant humidity, an unstable air mass, low-level convergence of air, a stationary or slow-moving storm (In western NC, the mountains providing uplift are stationary), etc.
Extreme precipitation events are (of course) the most rare, and as such, they can exhibit somewhat weird behavior. This is why hydrologists disagree over the usefulness of the term “100-year flood”, since most weather records don’t even extend beyond 100 years. One would probably need 1,000 years of rainfall records to get a good estimate of what constitutes a 100-year event.
Simulating Extreme Rainfall Events through Statistics
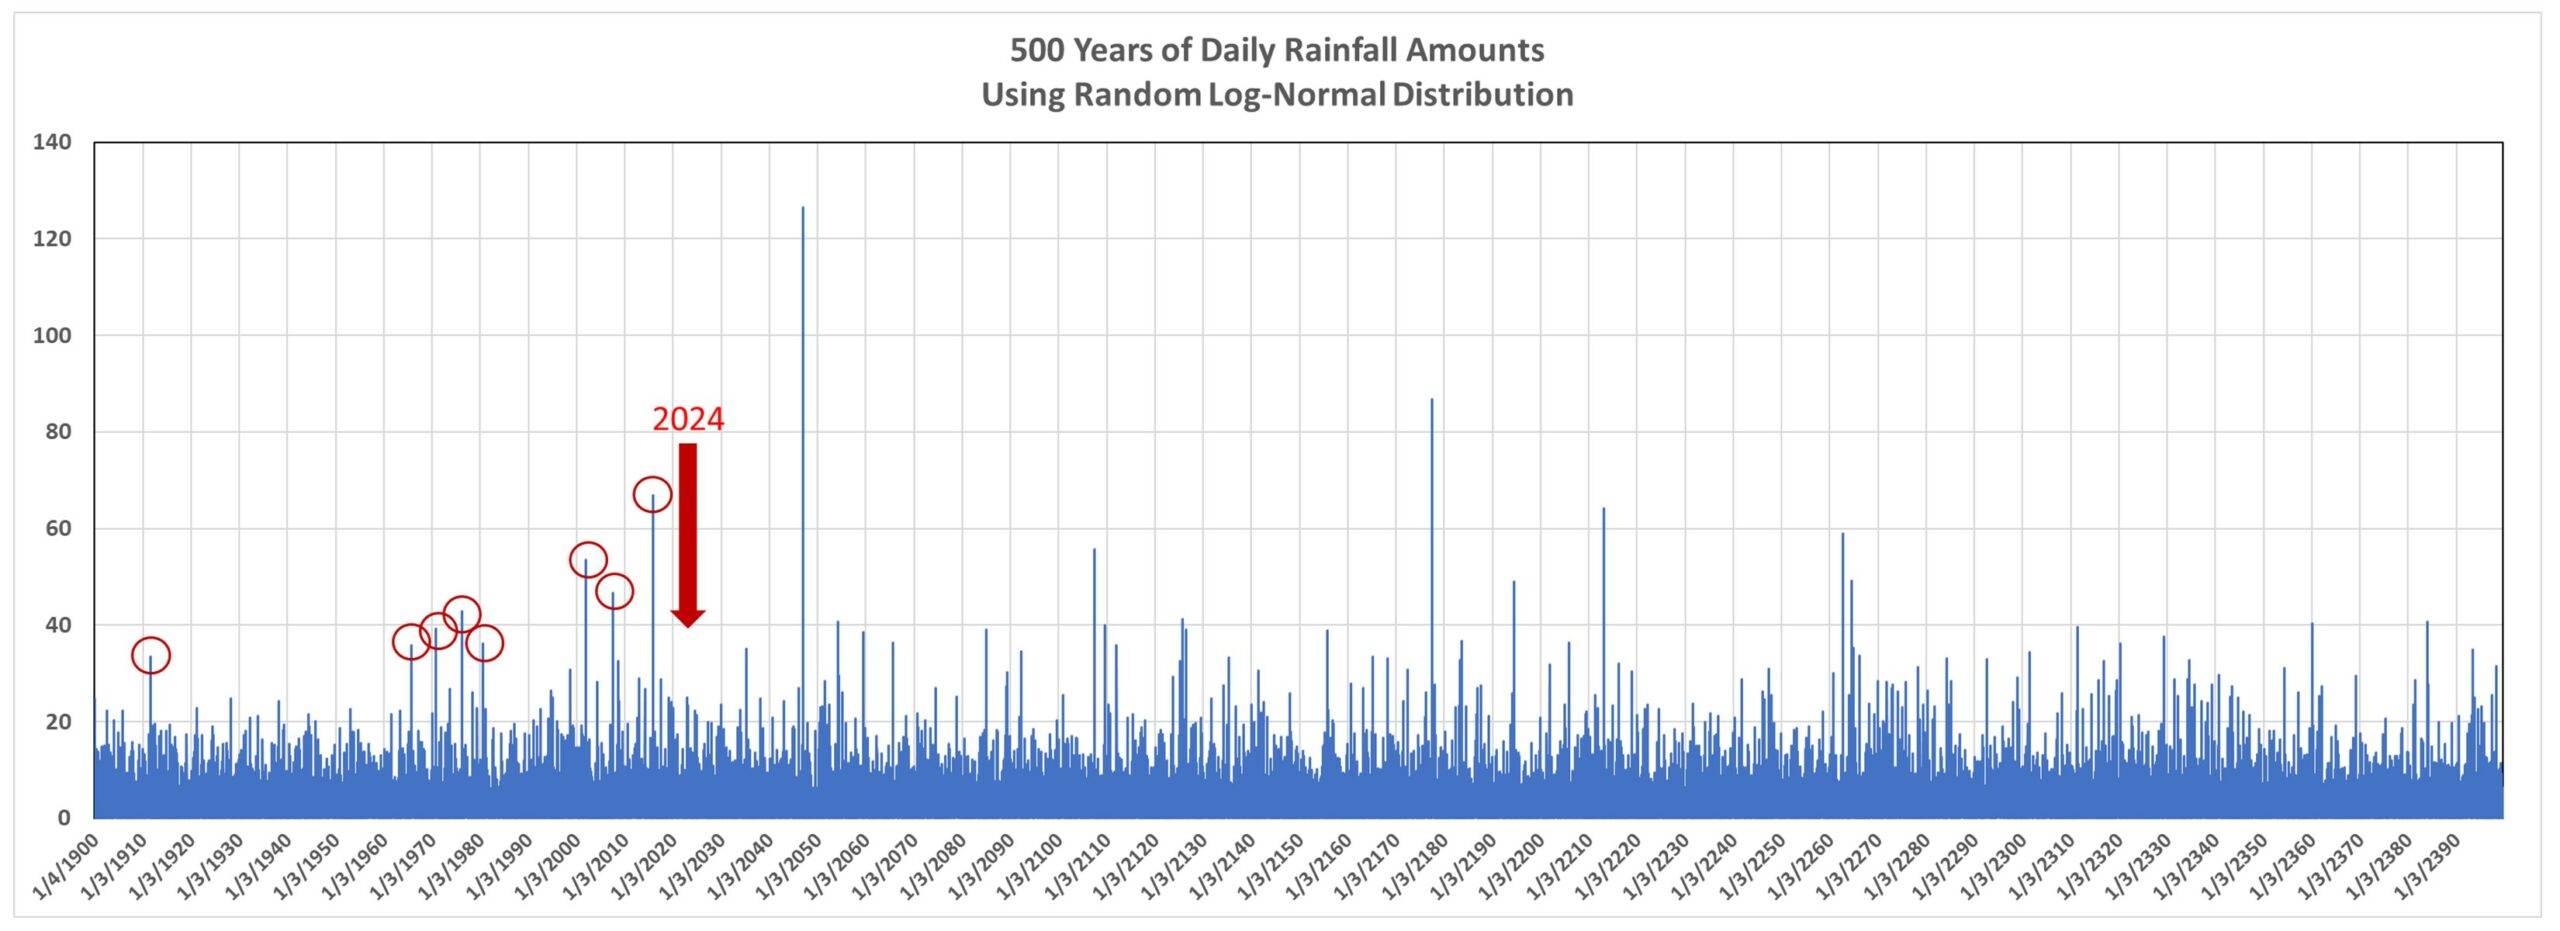
It is easy in Excel to make a simulated time series of rainfall totals having a log-normal distribution. For example, the following plot of hypothetical daily totals for the period 1900 through 2024 shows an seemingly increasing incidence of days with the heaviest rainfall (red circles). Could this be climate change?
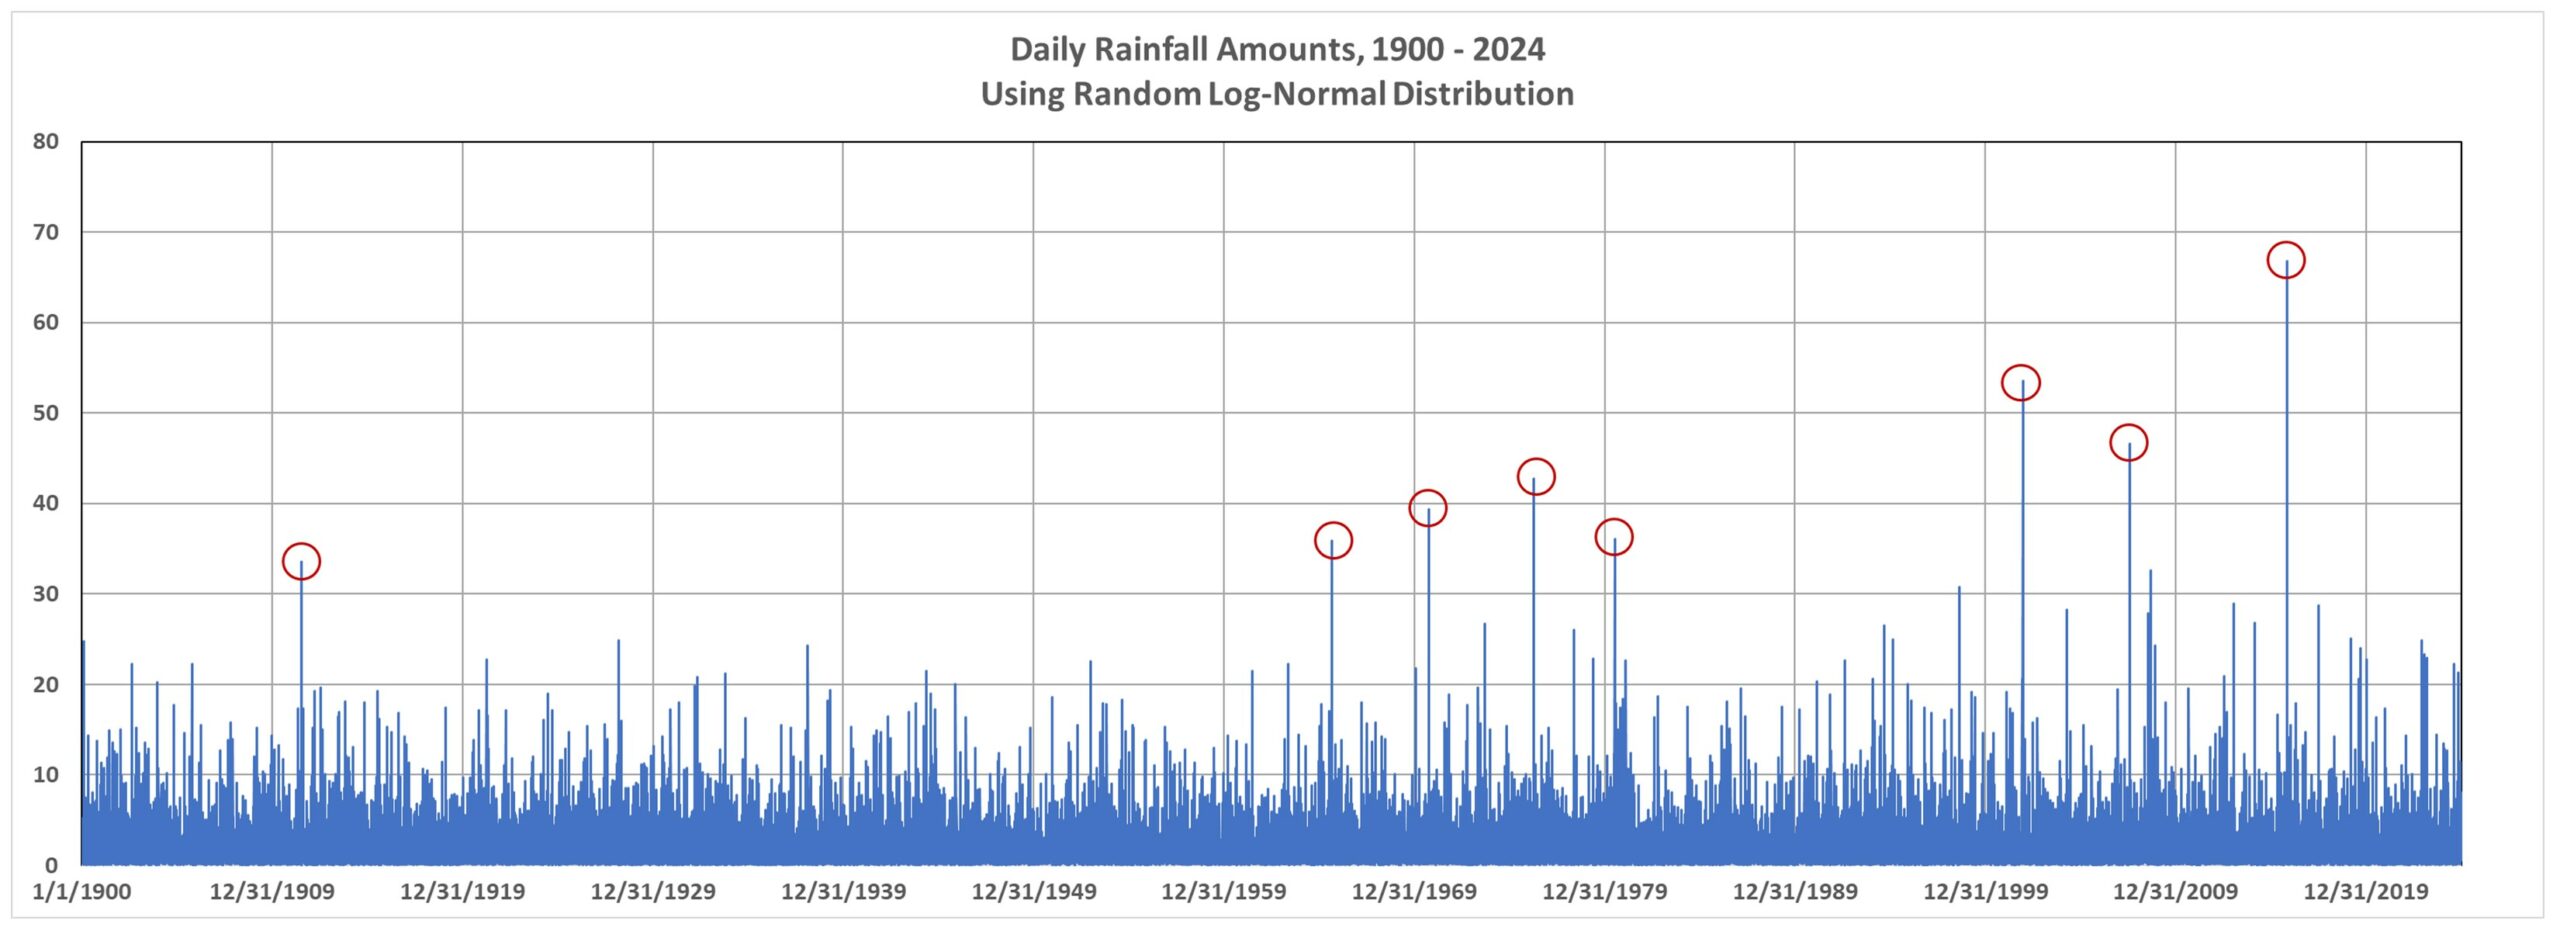
But remember, these are randomly generated numbers. Just like you can flip a coin and sometimes get 4 heads (or 4 tails) in a row doesn’t mean there is some underlying cause for getting the same result several times in a row. If we extend the above plot from 125 years to 500 years, we see (following plot) that there is no long-term increasing trend in heavy rainfall amounts:
Black Swan Events
Or, how about this one, which I will call “The Great Flood of August 28, 2022”?:
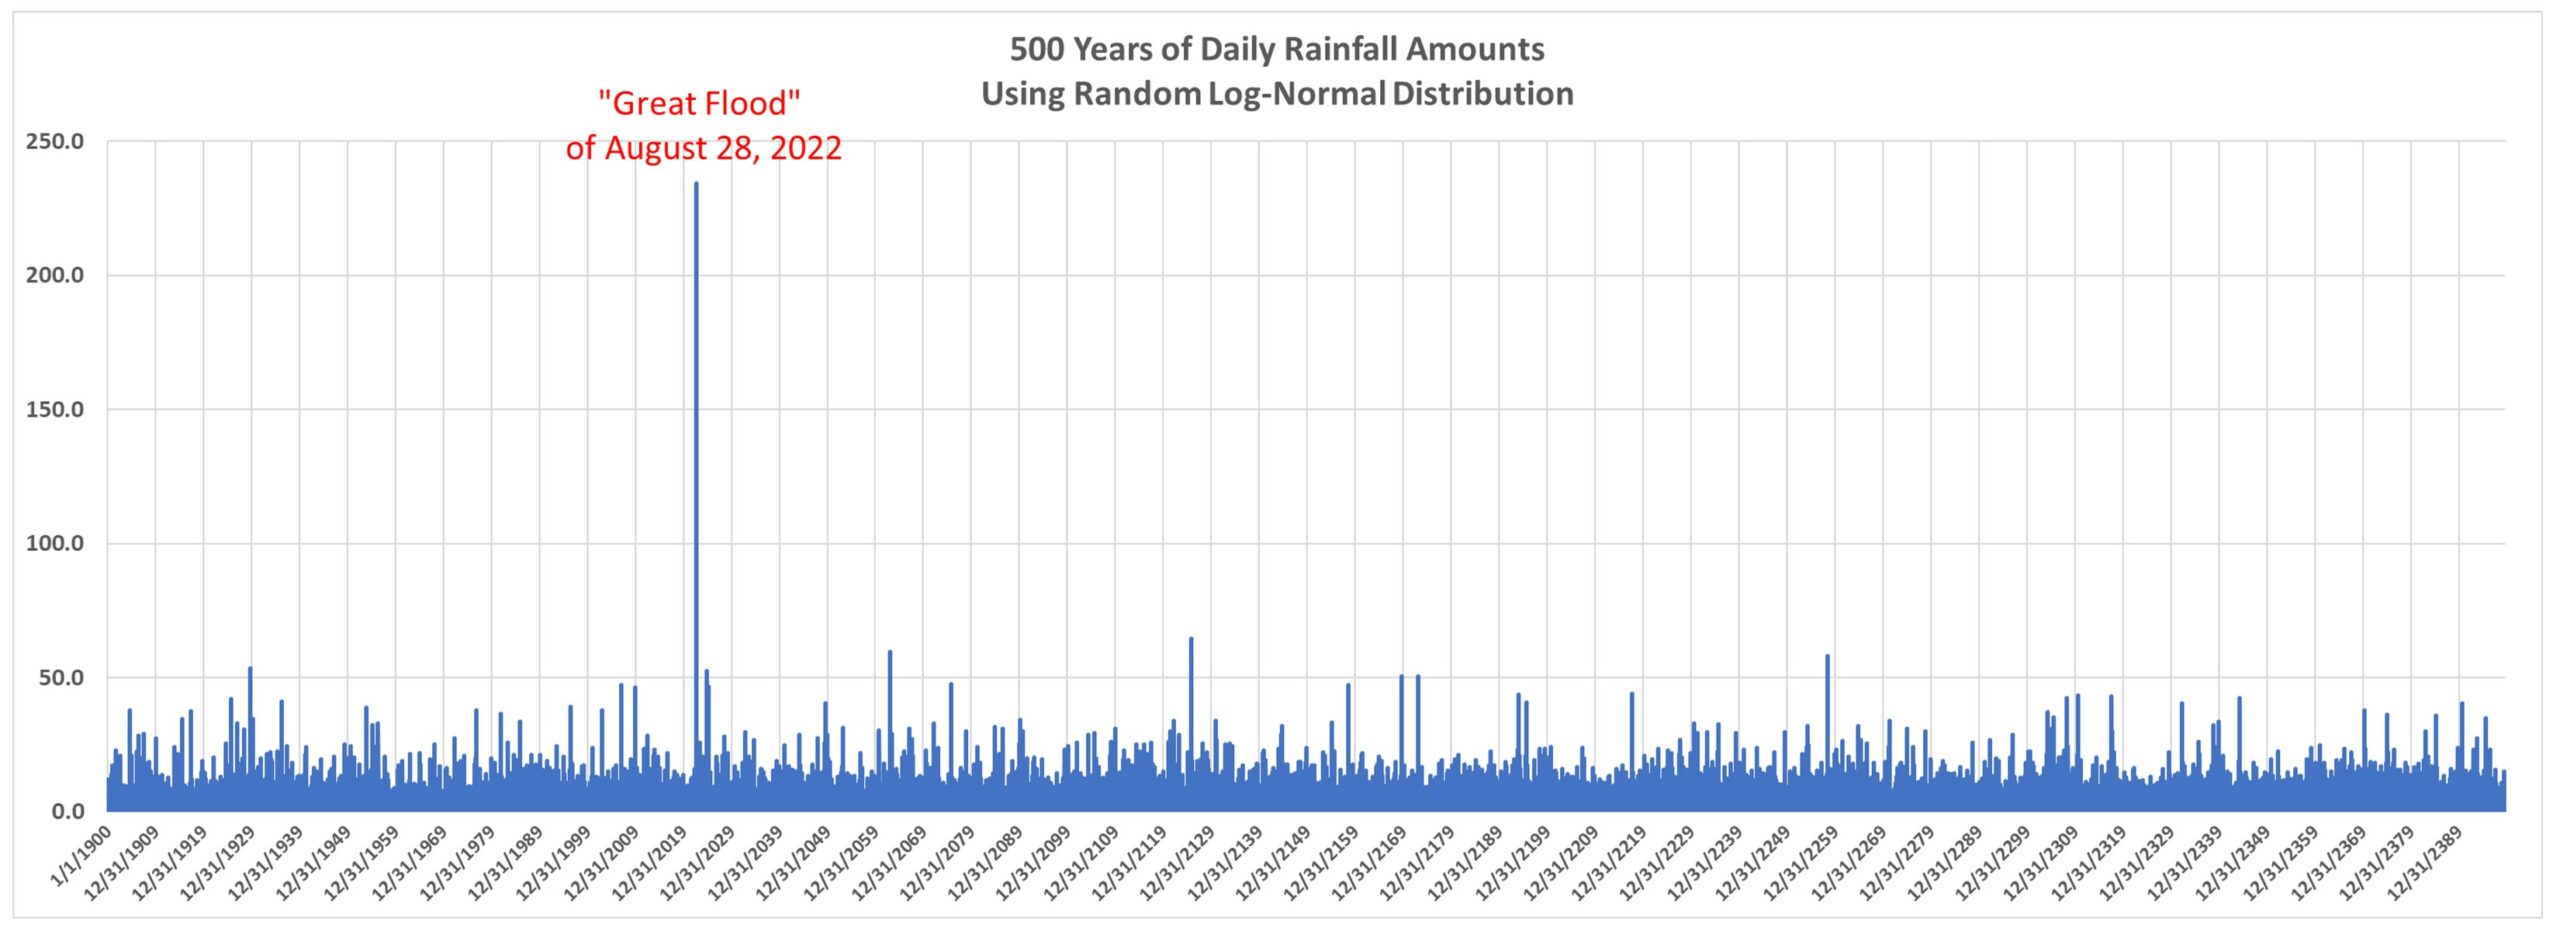
Note that this event (generated with just log-normally distributed random numbers) far exceeds any other daily event in that 500-year plot.
The point here is that too often we tend to attribute severe weather events to some underlying cause that is emerging over time, such as global warming. And, I believe, some of the changes we have seen in nature are due to the (weak and largely benign) warming trend most regions of the world have experienced in the last 100 years.
But these events can occur without any underlying long-term change in the climate system. To attribute every change we see to global warming is just silly, especially when it comes to precipitation related events, such as flood… or even drought.
A “Random Drought”
Now changing our daily random log-normal precipitation generator to a monthly time scale, we can look at how precipitation amounts change from decade to decade. Why monthly? Well, weather variations (and even climate cycles) tend to have preferred time scales. Several days for synoptic weather patterns, quasi-monthly for some kinds of persistent weather patterns, and even yearly or decadal for some natural internal climate cycles.
When I generate random log-normal time series at monthly time scales, and compute decadal averages over the last 120 years, seldom is the long-term trend close to zero. Here’s one what shows low precipitation for the most recent three decades, just purely through chance:
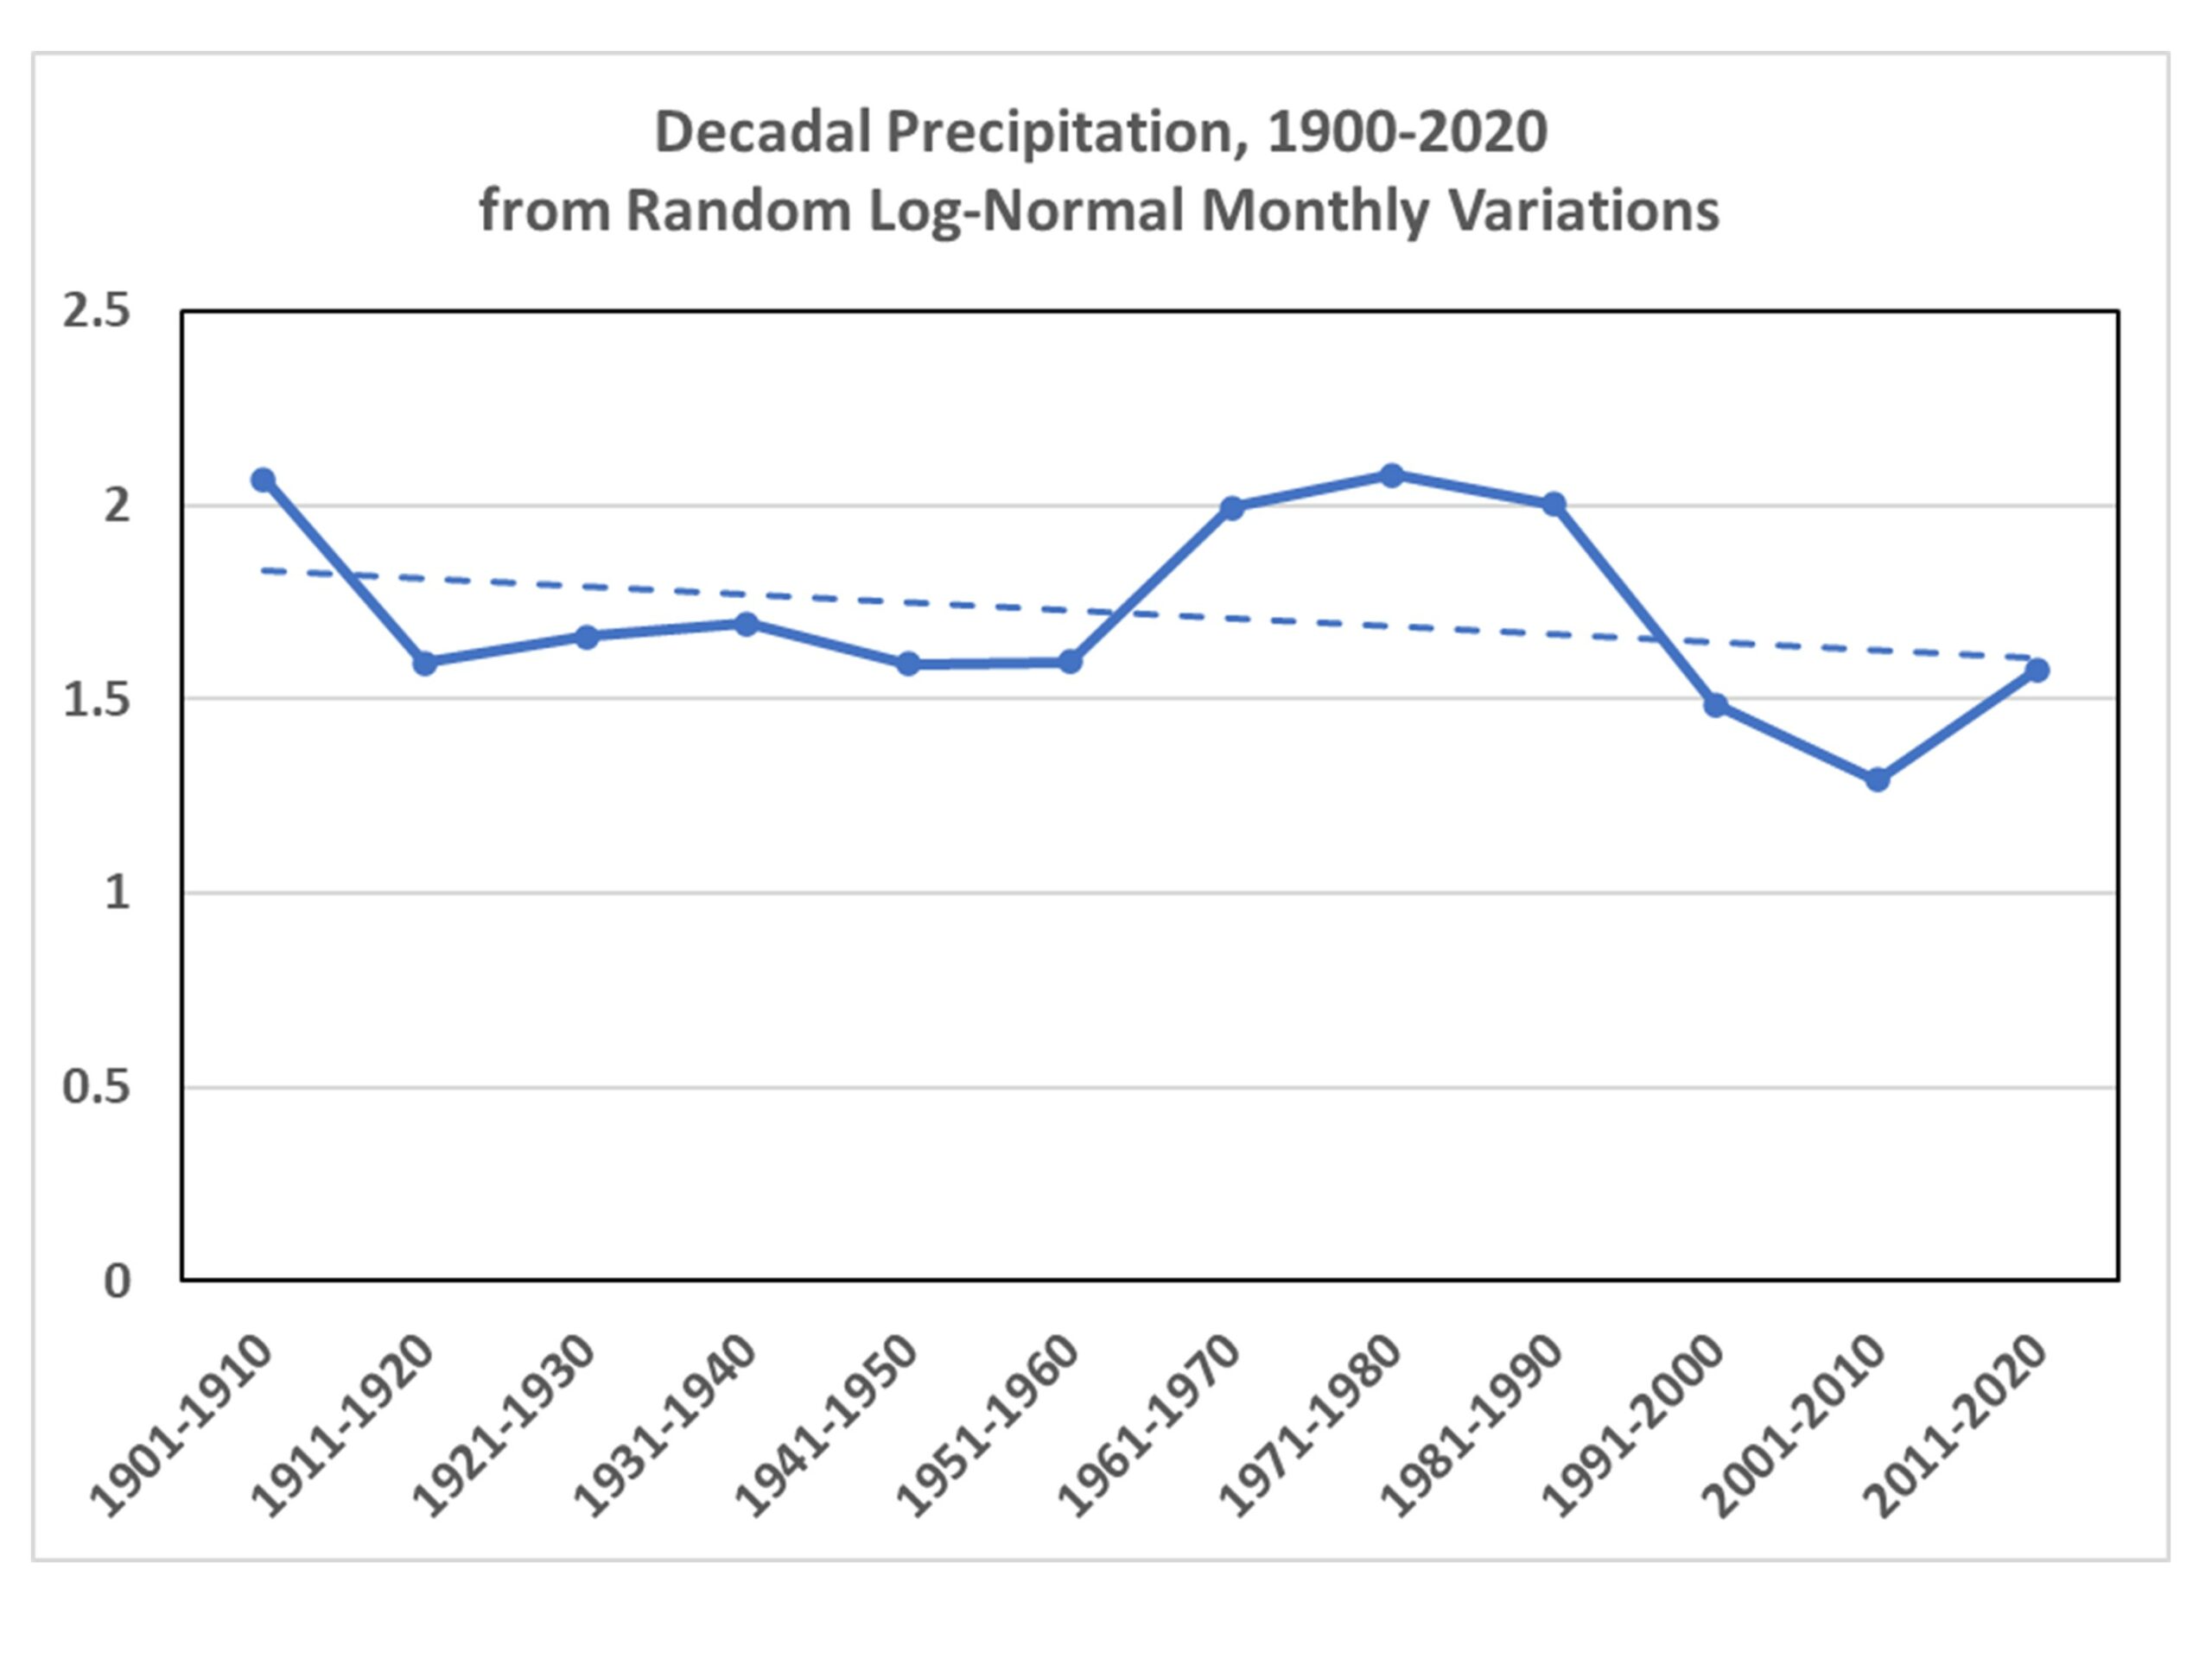
That looks like something we could attribute to drought in California, right? Yet, it’s just the result of random numbers.
Or, we can choose one of the random simulations that has an increasing trend:
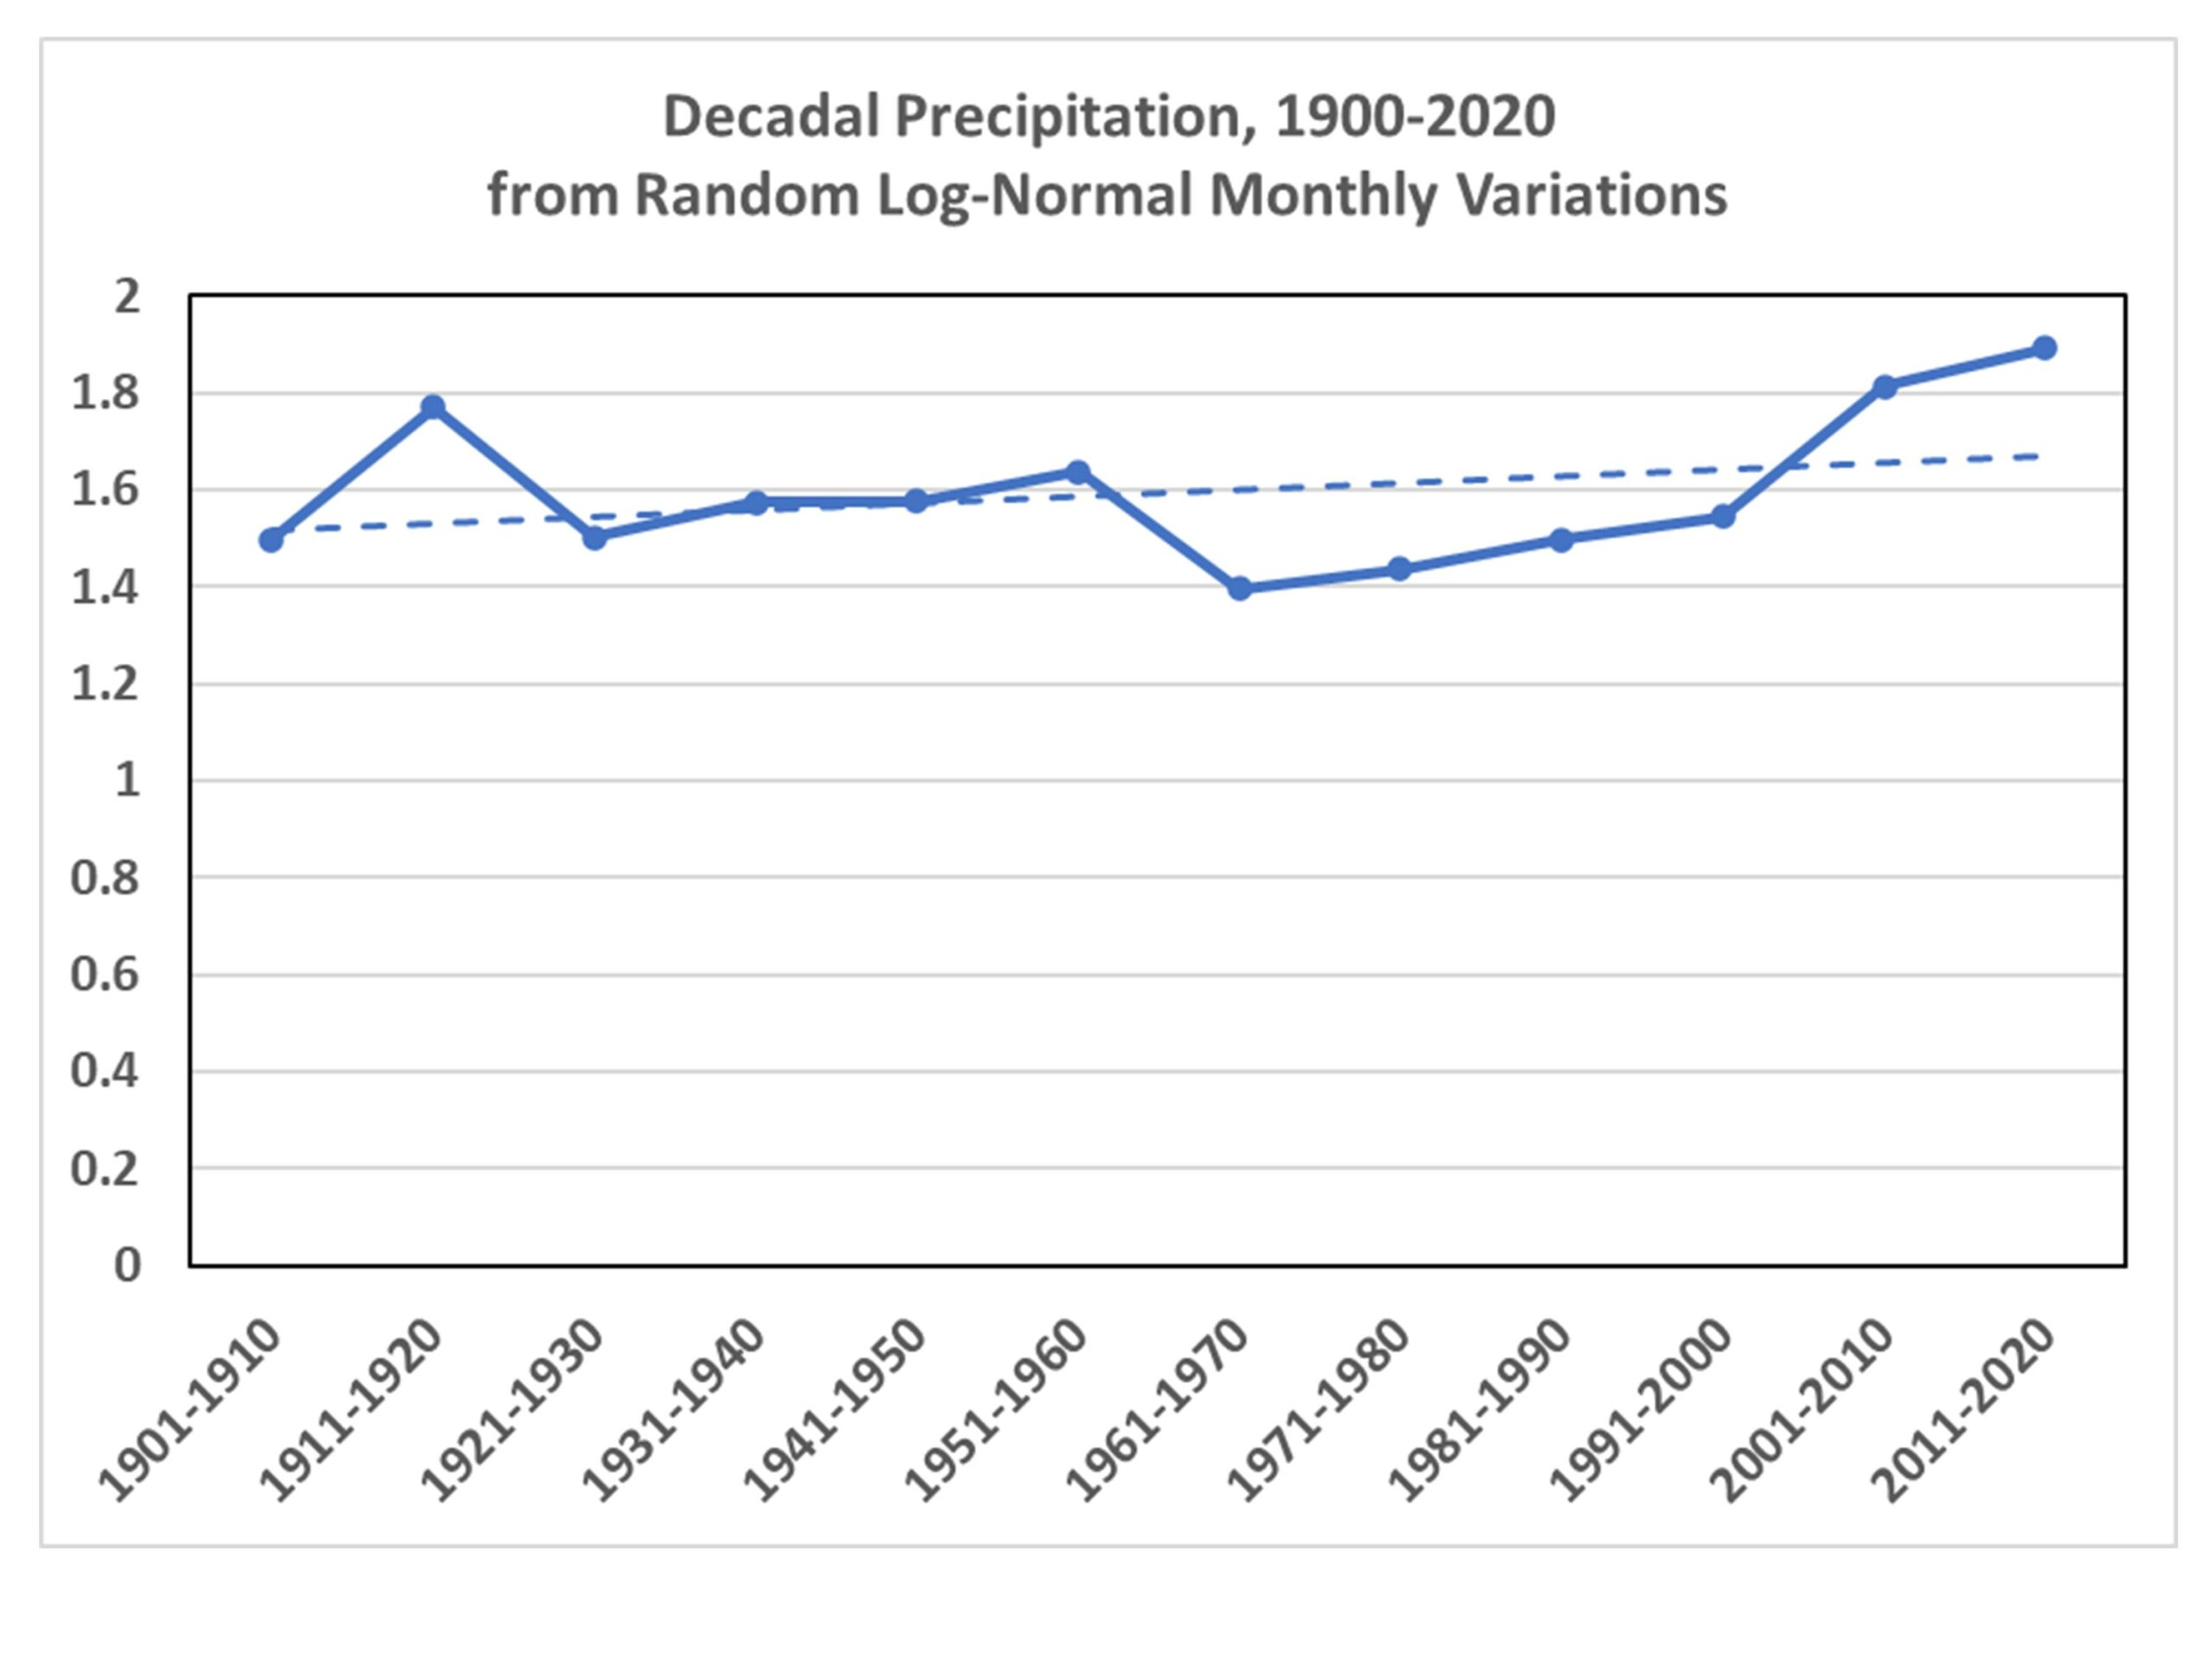
I’m sure someone could tie that to global warming.
A Final Word About 100-Year Flood Events
There seems to be some misunderstanding about 100-year events. These almost always apply to a specific location. So, you could have 100-year events every year in the U.S., and as long they are in different locations, there is nothing unusual about it. A 100-year flood in western North Carolina this year could be followed by a 100-year flood in eastern North Carolina next year. That doesn’t mean 100-year floods are getting more frequent.
I’m not claiming that all severe weather is due to randomness. Only that there is a huge random component to it, and that’s what makes attribution of any kind of severe weather event to climate change essentially impossible.

 Home/Blog