Home/Blog
Summary: The recently reported upward adjustment in the 1971-2010 Ocean Heat Content (OHC) increase compared to the last official estimate from the IPCC is actually 11%, not 40%. The 40% increase turns out to be relative to the average of various OHC estimates the IPCC addressed in their 2013 report, most of which were rejected. Curiously, the new estimate is almost identical to the average of 33 CMIP climate models, yet the models themselves range over a factor of 8 in their rates of ocean warming. Also curious is the warmth-enhancing nature of temperature adjustments over the years from surface thermometers, radiosondes, satellites, and now ocean heat content, with virtually all data adjustments leading to more warming rather than less.
I’ve been trying to make sense out of the recent Science paper by Cheng et al. entitled How Fast are the Oceans Warming? The news headlines I saw which jumped out at me (and several others who asked me about them) were:
World’s Oceans Warming 40% Faster than Previously Thought (EcoWatch.com),
The oceans are heating up 40% faster than scientists realized which means we should prepare for more disastrous flooding and storms (businessinsider.com)
For those who read the paper, let me warn you: The paper itself does not have enough information to figure out what the authors did, but the Supplementary Materials for the paper provide some of what is needed. I suspect this is due to editorial requirements by Science to make articles interesting without excessive fact mongering.
One of the conclusions of the paper is that Ocean Heat Content (OHC) has been rising more rapidly in the last couple decades than in previous decades, but this is not a new finding, and I will not discuss it further here.
Of more concern is the implication that this paper introduces some new OHC dataset that significantly increases our previous estimates of how much the oceans have been warming.
As far as I can tell, this is not the case.
Dazed and Confused
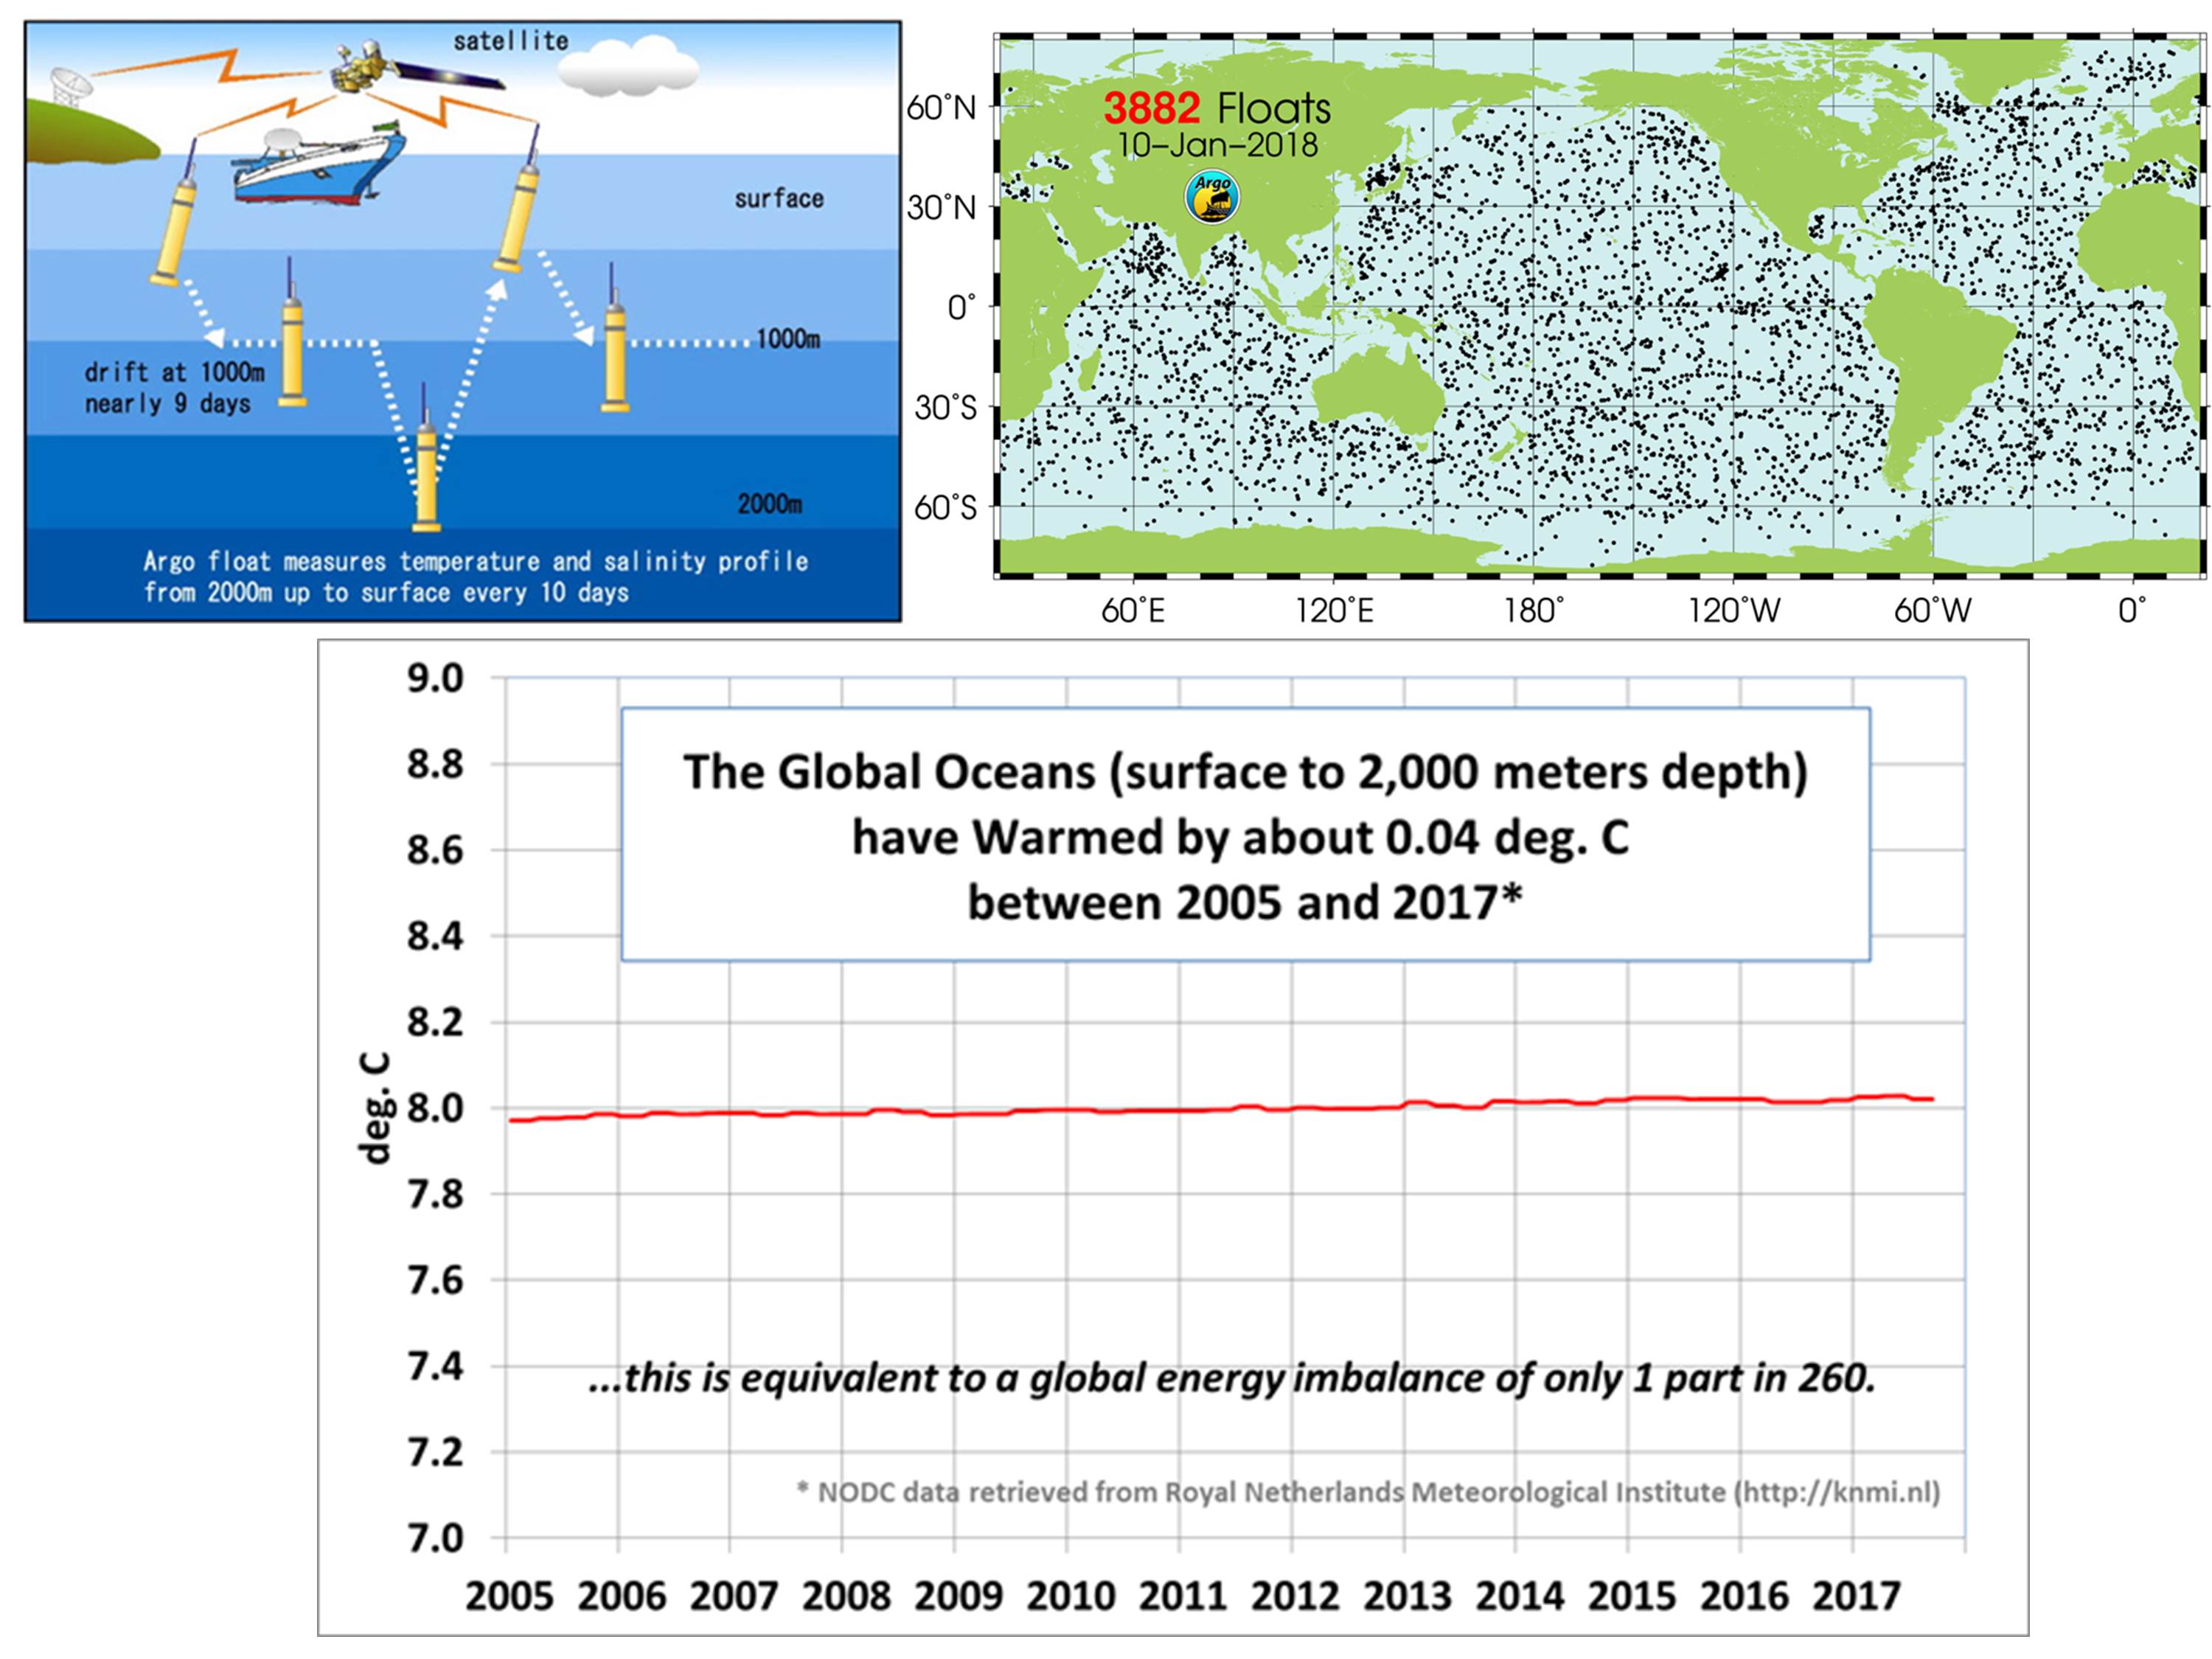
Most of the paper deals with just how much the global oceans from the surface to 2,000 m depth warmed during the period 1971-2010 (40 years) which was also a key period in the IPCC 5th Assessment Report (AR5).
And here’s where things get confusing, and I wasted hours figuring out how they got their numbers because the authors did not provide sufficient information.
Part of the confusion comes from the insistence of the climate community on reporting ocean warming in energy content units of zettajoules (a zettajoule is 1,000,000,000,000,000,000,000 Joules, which is a billion trillion Joules… also a sextillion Joules, but male authors fear calling it that), rather than in what is actually measured (degrees). This leads to confusion because almost nowhere is it ever stated what assumed area of ocean was used in the computation of OHC (which is proportional to both temperature change and the volume of seawater involved in that temperature change). I’ve looked in this paper and other papers (including Levitus), and only in the 2013 IPCC report (AR5) did I find the value 3.6 x 10^14 square meters given for ocean area. (Just because we know the area of the global oceans doesn’t mean that is what is monitored, or what was used in the computation of OHC).
Causing still further confusion is that Cheng et al. then (apparently) take the ocean area, and normalize it by the entire area of the Earth, scaling all of their computed heat fluxes by 0.7. I have no idea why, since their paper does not deal with the small increase in heat content of the land areas. This is just plain sloppy, because it complicates and adds uncertainty when others try to replicate their work.
It also raises the question of why energy content? We don’t do that for the atmosphere. Instead, we use what is measured — degrees. The only reason I can think of is that the ocean temperature changes involved are exceedingly tiny, either hundredths or thousandths of a degree C, depending upon what ocean layer is involved and over what time period. Such tiny changes would not generate the alarm that a billion-trillion Joules would (or the even scarier Hiroshima bomb-equivalents).
But I digress.
The Results
I think I finally figured out what Cheng et al. did (thanks mostly to finding the supporting data posted at Cheng’s website).
The “40%” headlines derive from this portion of the single figure in their paper, where I have added in red information which is either contained in the Supplementary Materials (3-letter dataset IDs from the authors’ names) or are my own annotations:
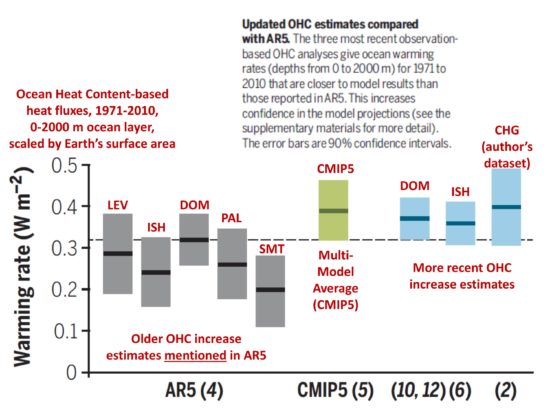
The five different estimates of 40-year average ocean heating rates from the AR5 report (gray bars) are around 40% below the newer estimates (blue bars), but the AR5 report did not actually use these five in their estimation — they ended up using only the highest of these (Domingues et al., 2008). As Cheng mentions, the pertiment section of the IPCC report is the “Observations: Oceans” section of Working Group 1, specifically Box 3.1 which contains the numerical facts one can factmonger with.
From the discussion in Box 3.1, one can compute that the AR5-estimated energy accumulation rate in the 0-2000 m ocean layer (NOT adjusted for total area of the Earth) during 1971-2010 corresponds to an energy flux of 0.50 Watts per sq. meter. This can then be compared to newer estimates computed from Cheng’s website data (which is stated to be the data used in the Science study) of 0.52 W/m2 (DOM), 0.51 W/m2 (ISH), and 0.555 W/m2 (CHG).
Significantly, even if we use the highest of these estimates (Cheng’s own dataset) we only get an 11% increase above what the IPCC claimed in 2013 — not 40%.
Agreement Between Models and Observations
Cheng’s website also contains the yearly 0-2000m OHC data from 33 CMIP5 models, from which I calculated the average warming rate, getting 0.549 W/m2 (again, not scaled by 0.7 to get a whole-Earth value). This is amazingly close to Cheng’s 0.555 W/m2 he gets from reanalysis of the deep-ocean temperature data.
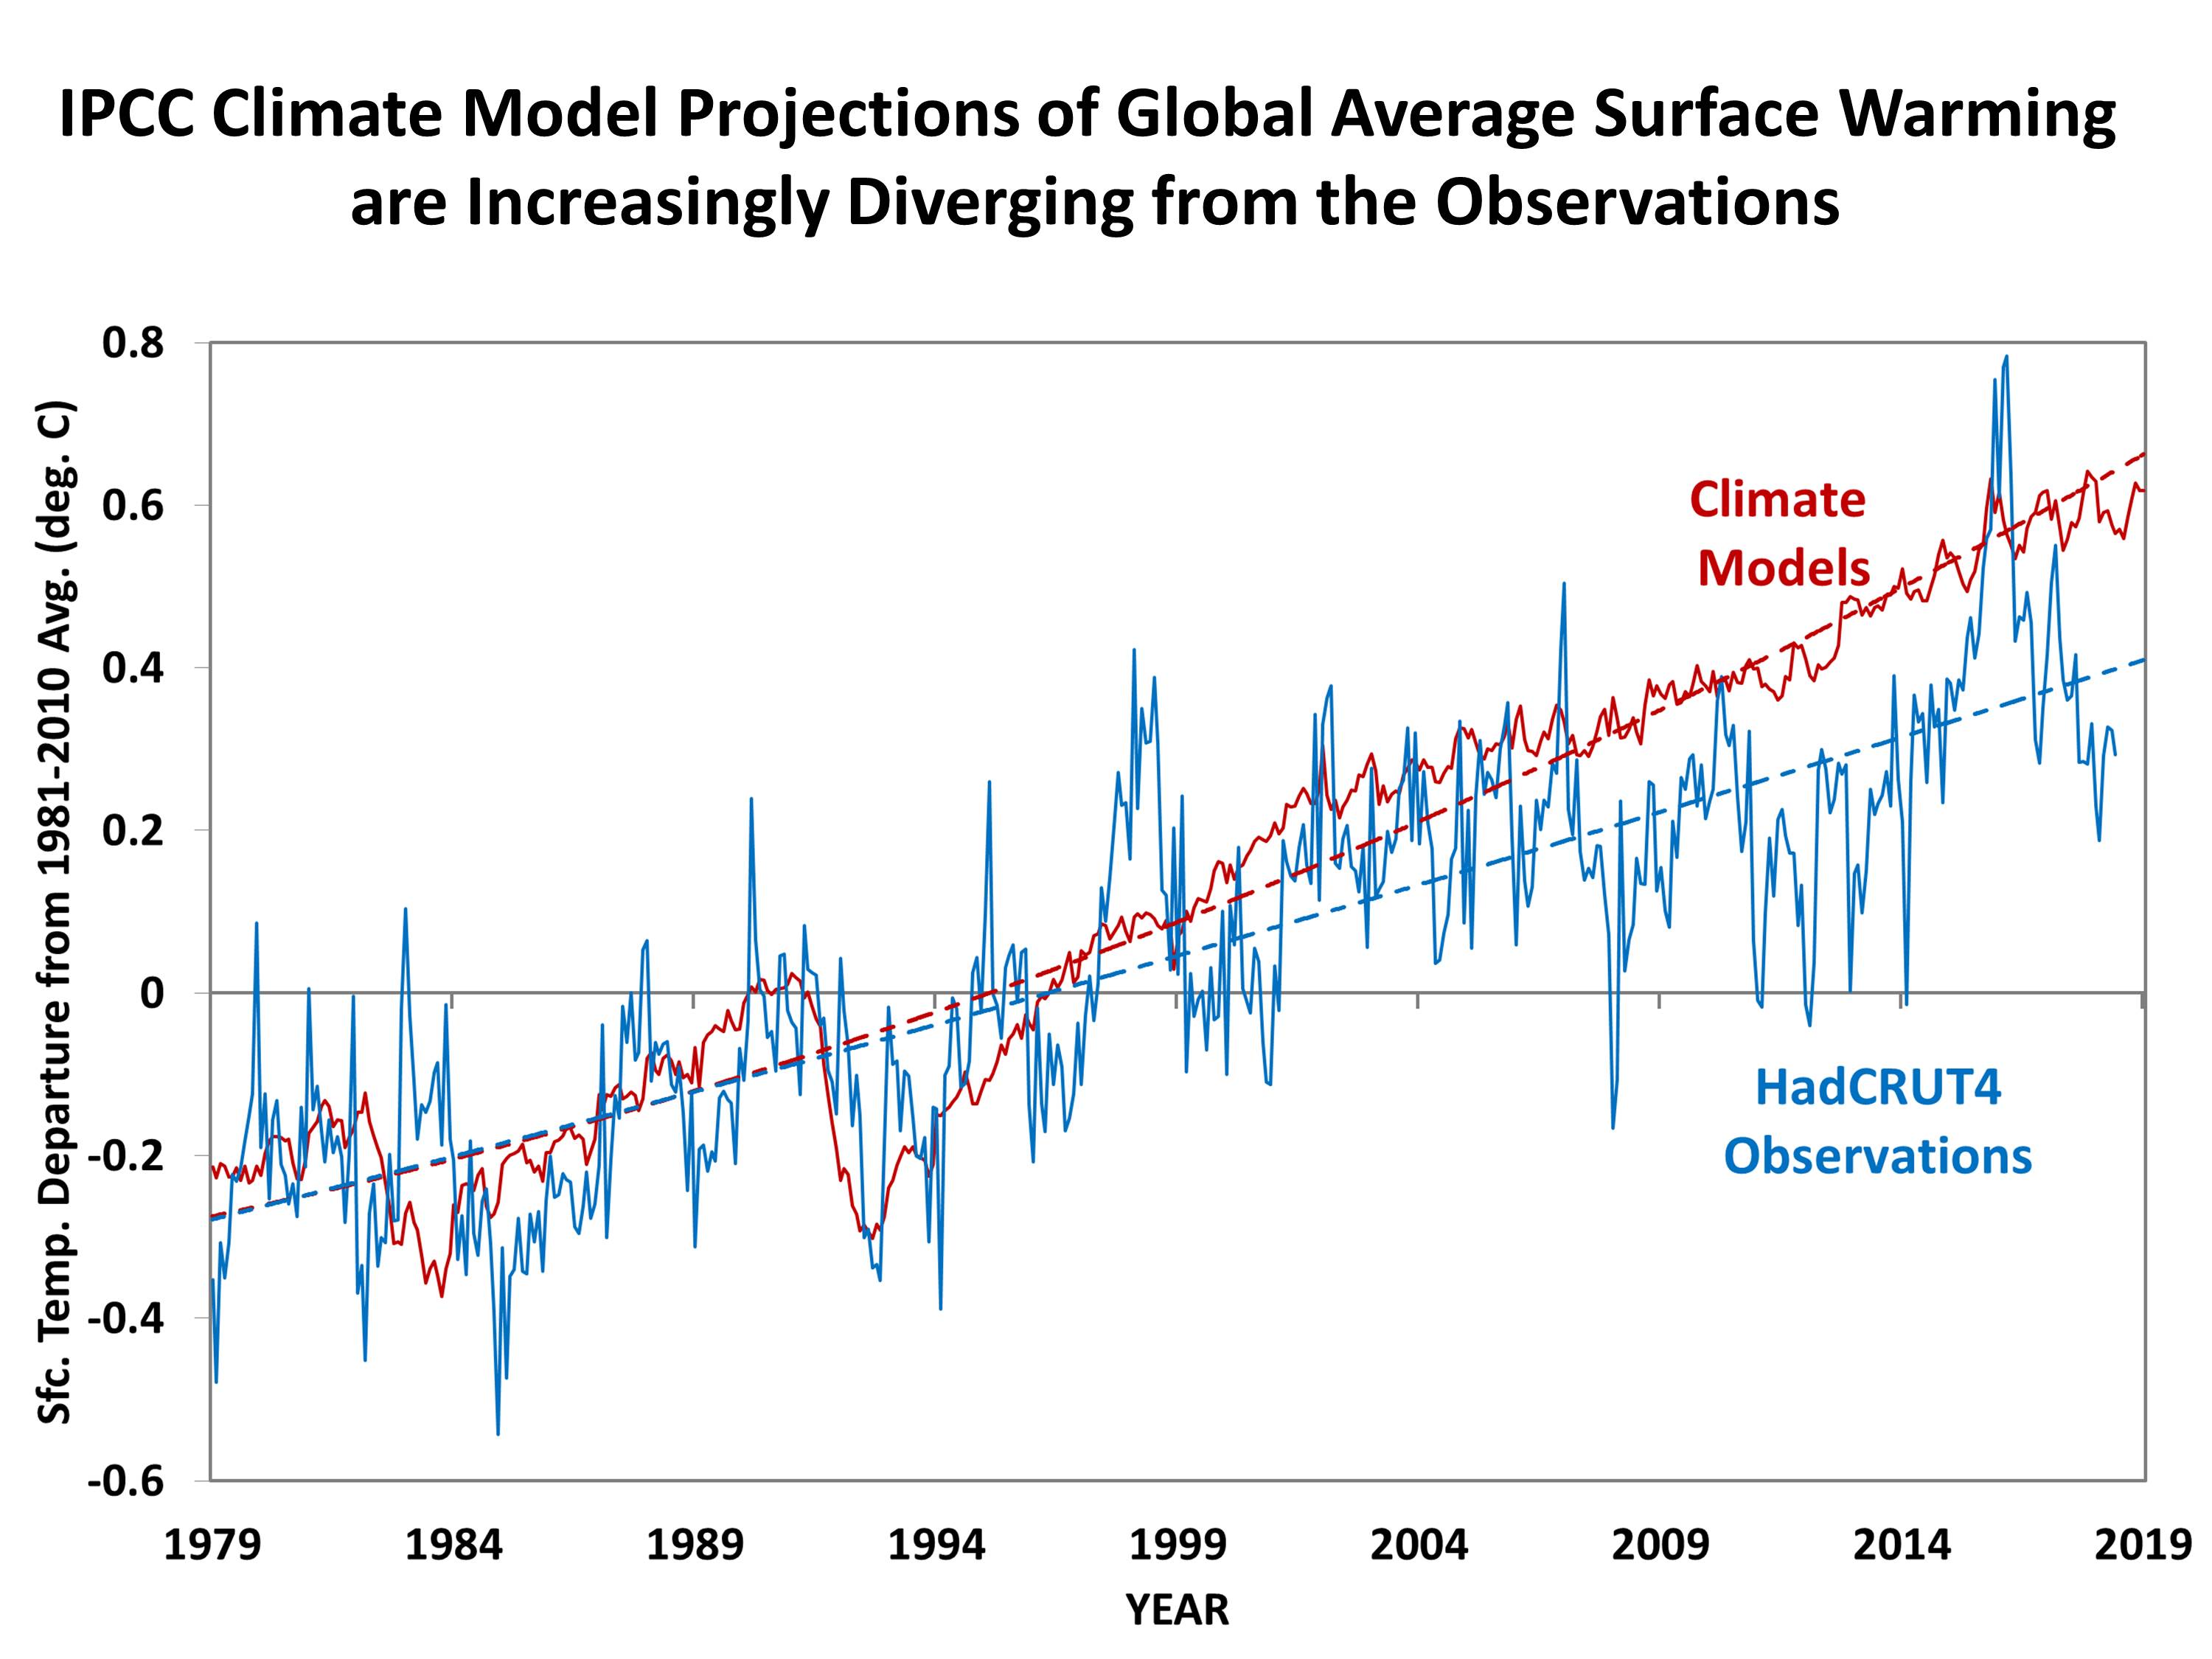
This is pointed to as evidence that observations support the climate models which, in turn, are of course the basis for proposed energy policy changes and CO2 emissions reduction.
How good is that multi-model warming rate? Let me quote the Science article (again, these number are scaled by 0.7):
“The ensemble average of the models has a linear ocean warming trend of 0.39 +/- 0.07 W/m2 for the upper 2000 m from 1971-2010 compared with recent observations ranging from 0.36 to 0.39 W/m2.”
See that +/- 0.07 error bar on the model warming rate? That is not a confidence interval on the warming rate. It’s the estimated error in the fit of a regression line to the 33-model average warming trace during 1971-2010. It says nothing about how confident we are in the warming rate, or even the range of warming rates BETWEEN models.
And that variation between the models is where things REALLY get interesting. Here’s what those 33 models’ OHC warming profiles look like, relative to the beginning of the period (1971), which shows they range over a factor of 8X (from 0.11 W/m2 to 0.92 W/m2) for the period 1971-2010!
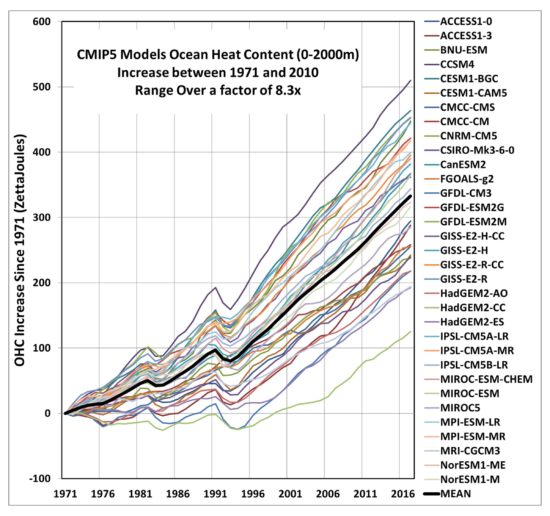
What do we make of a near-perfect level of agreement (between Cheng’s reanalysis of OHC warming from observational data, and the average of 33 climate models), when those models themselves disagree with each other by up to a factor of 8 (700%)?
That is a remarkable stroke of luck.
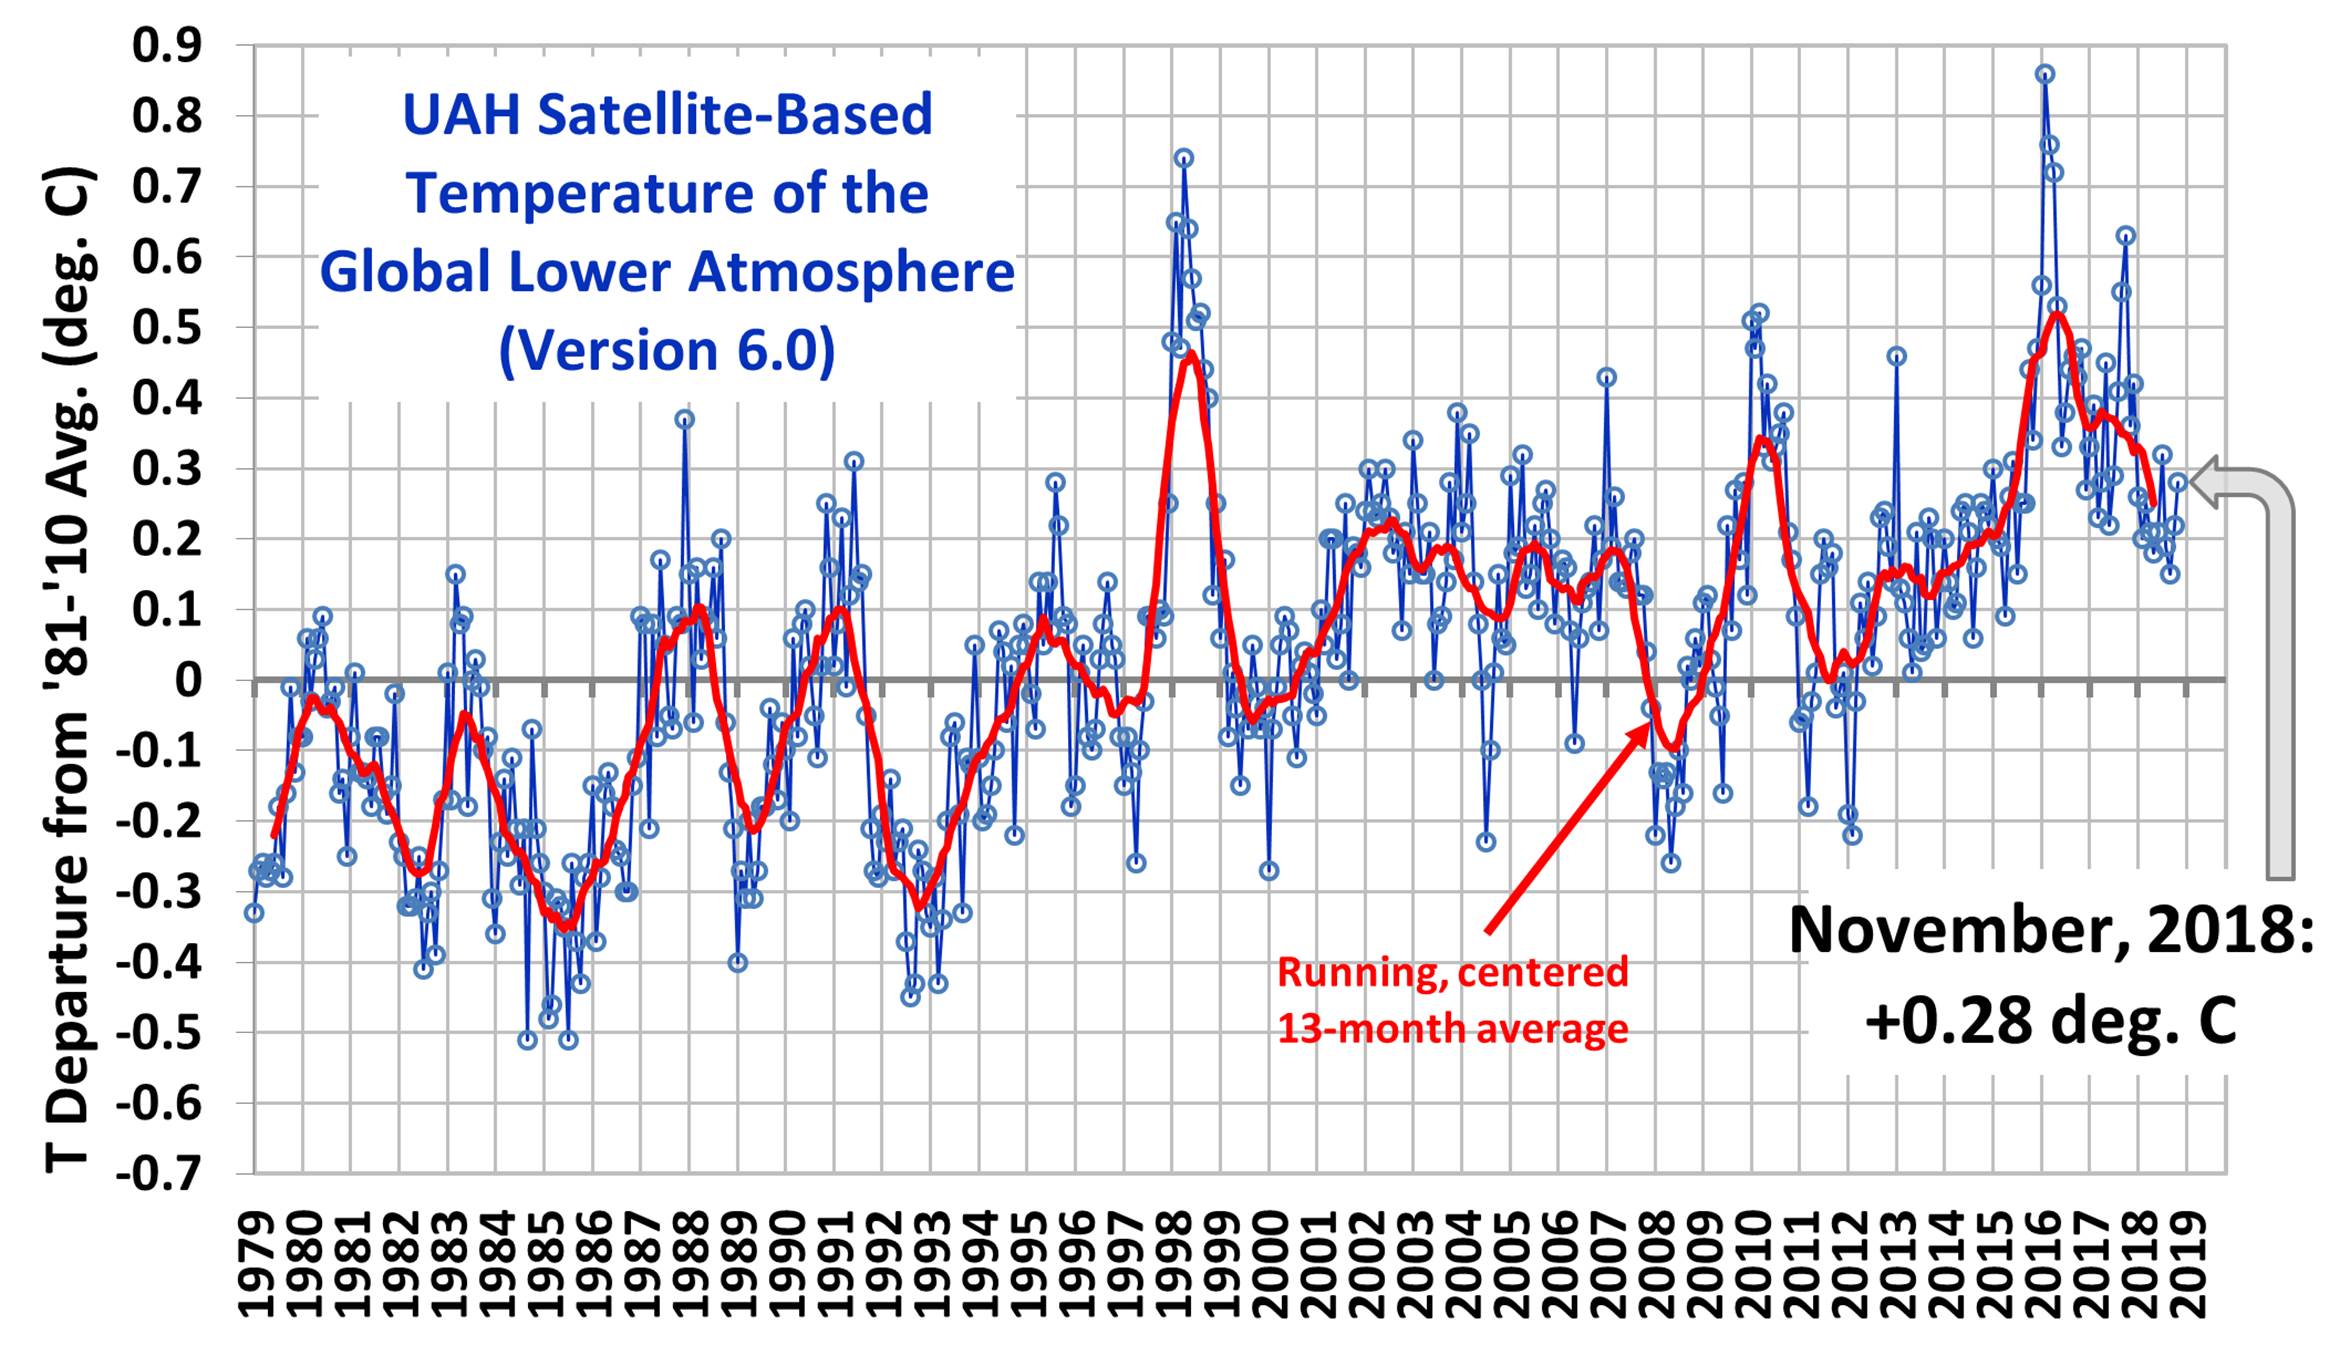
It’s Always Worse than We Thought
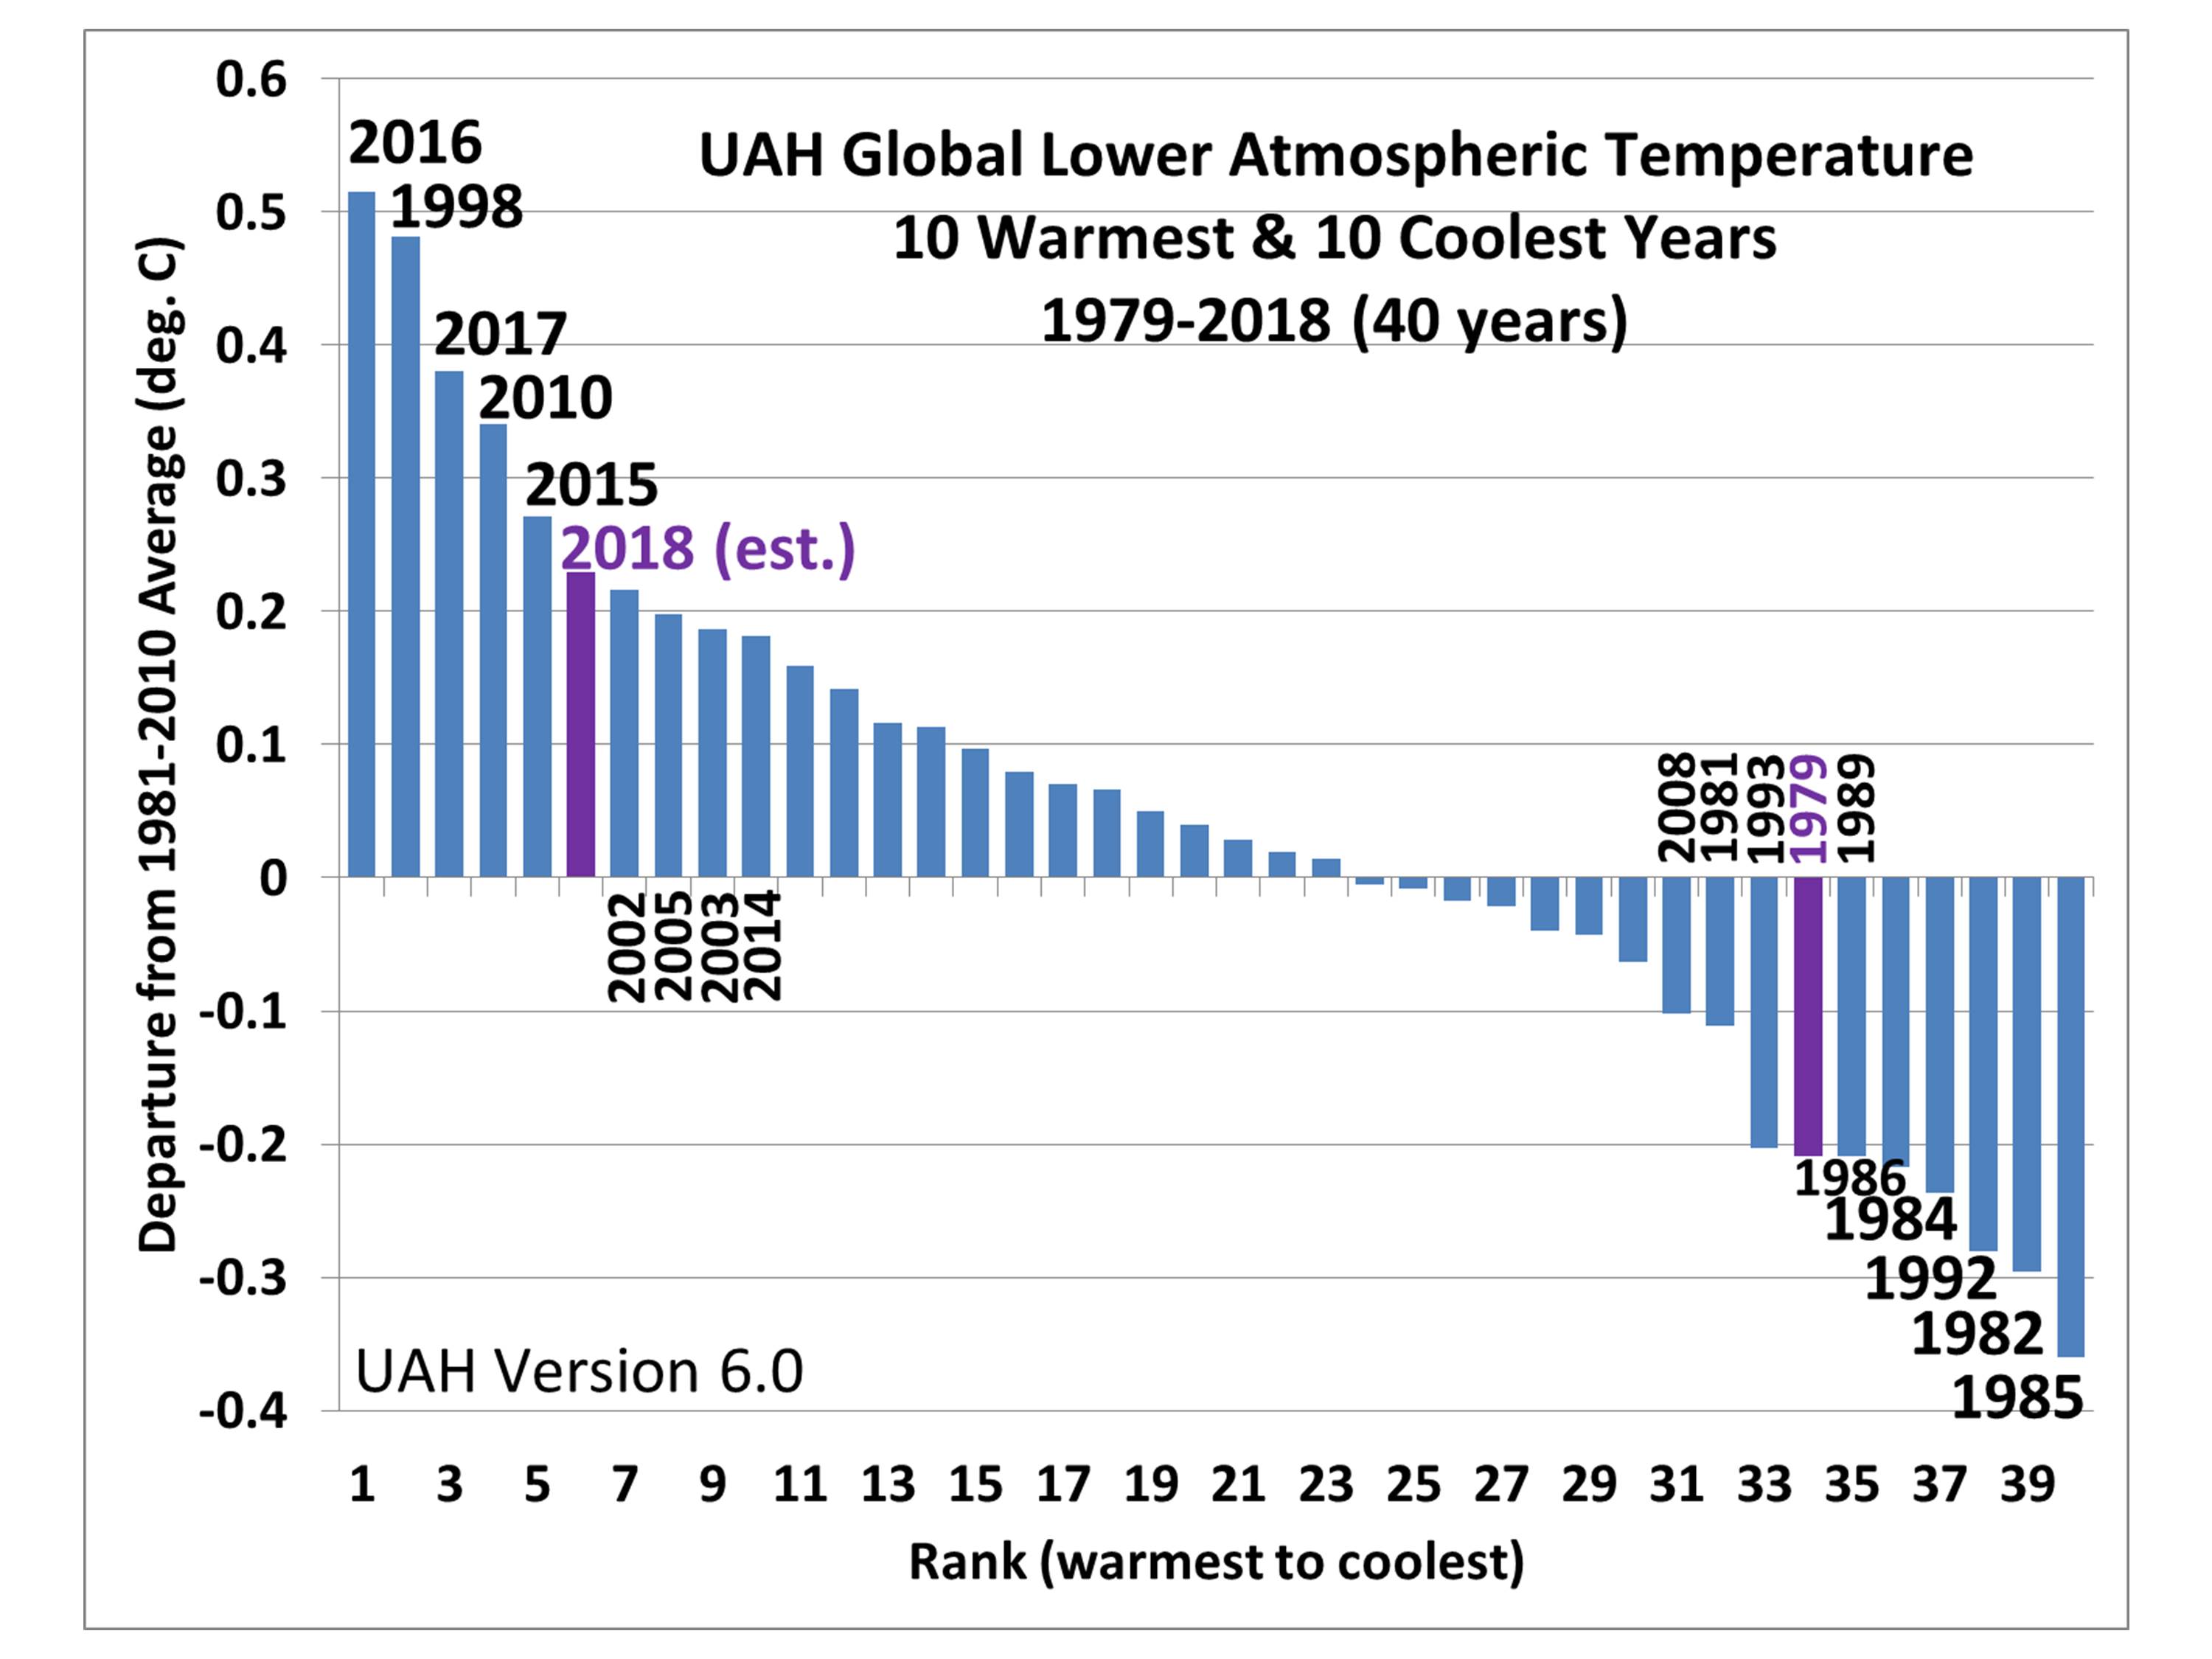
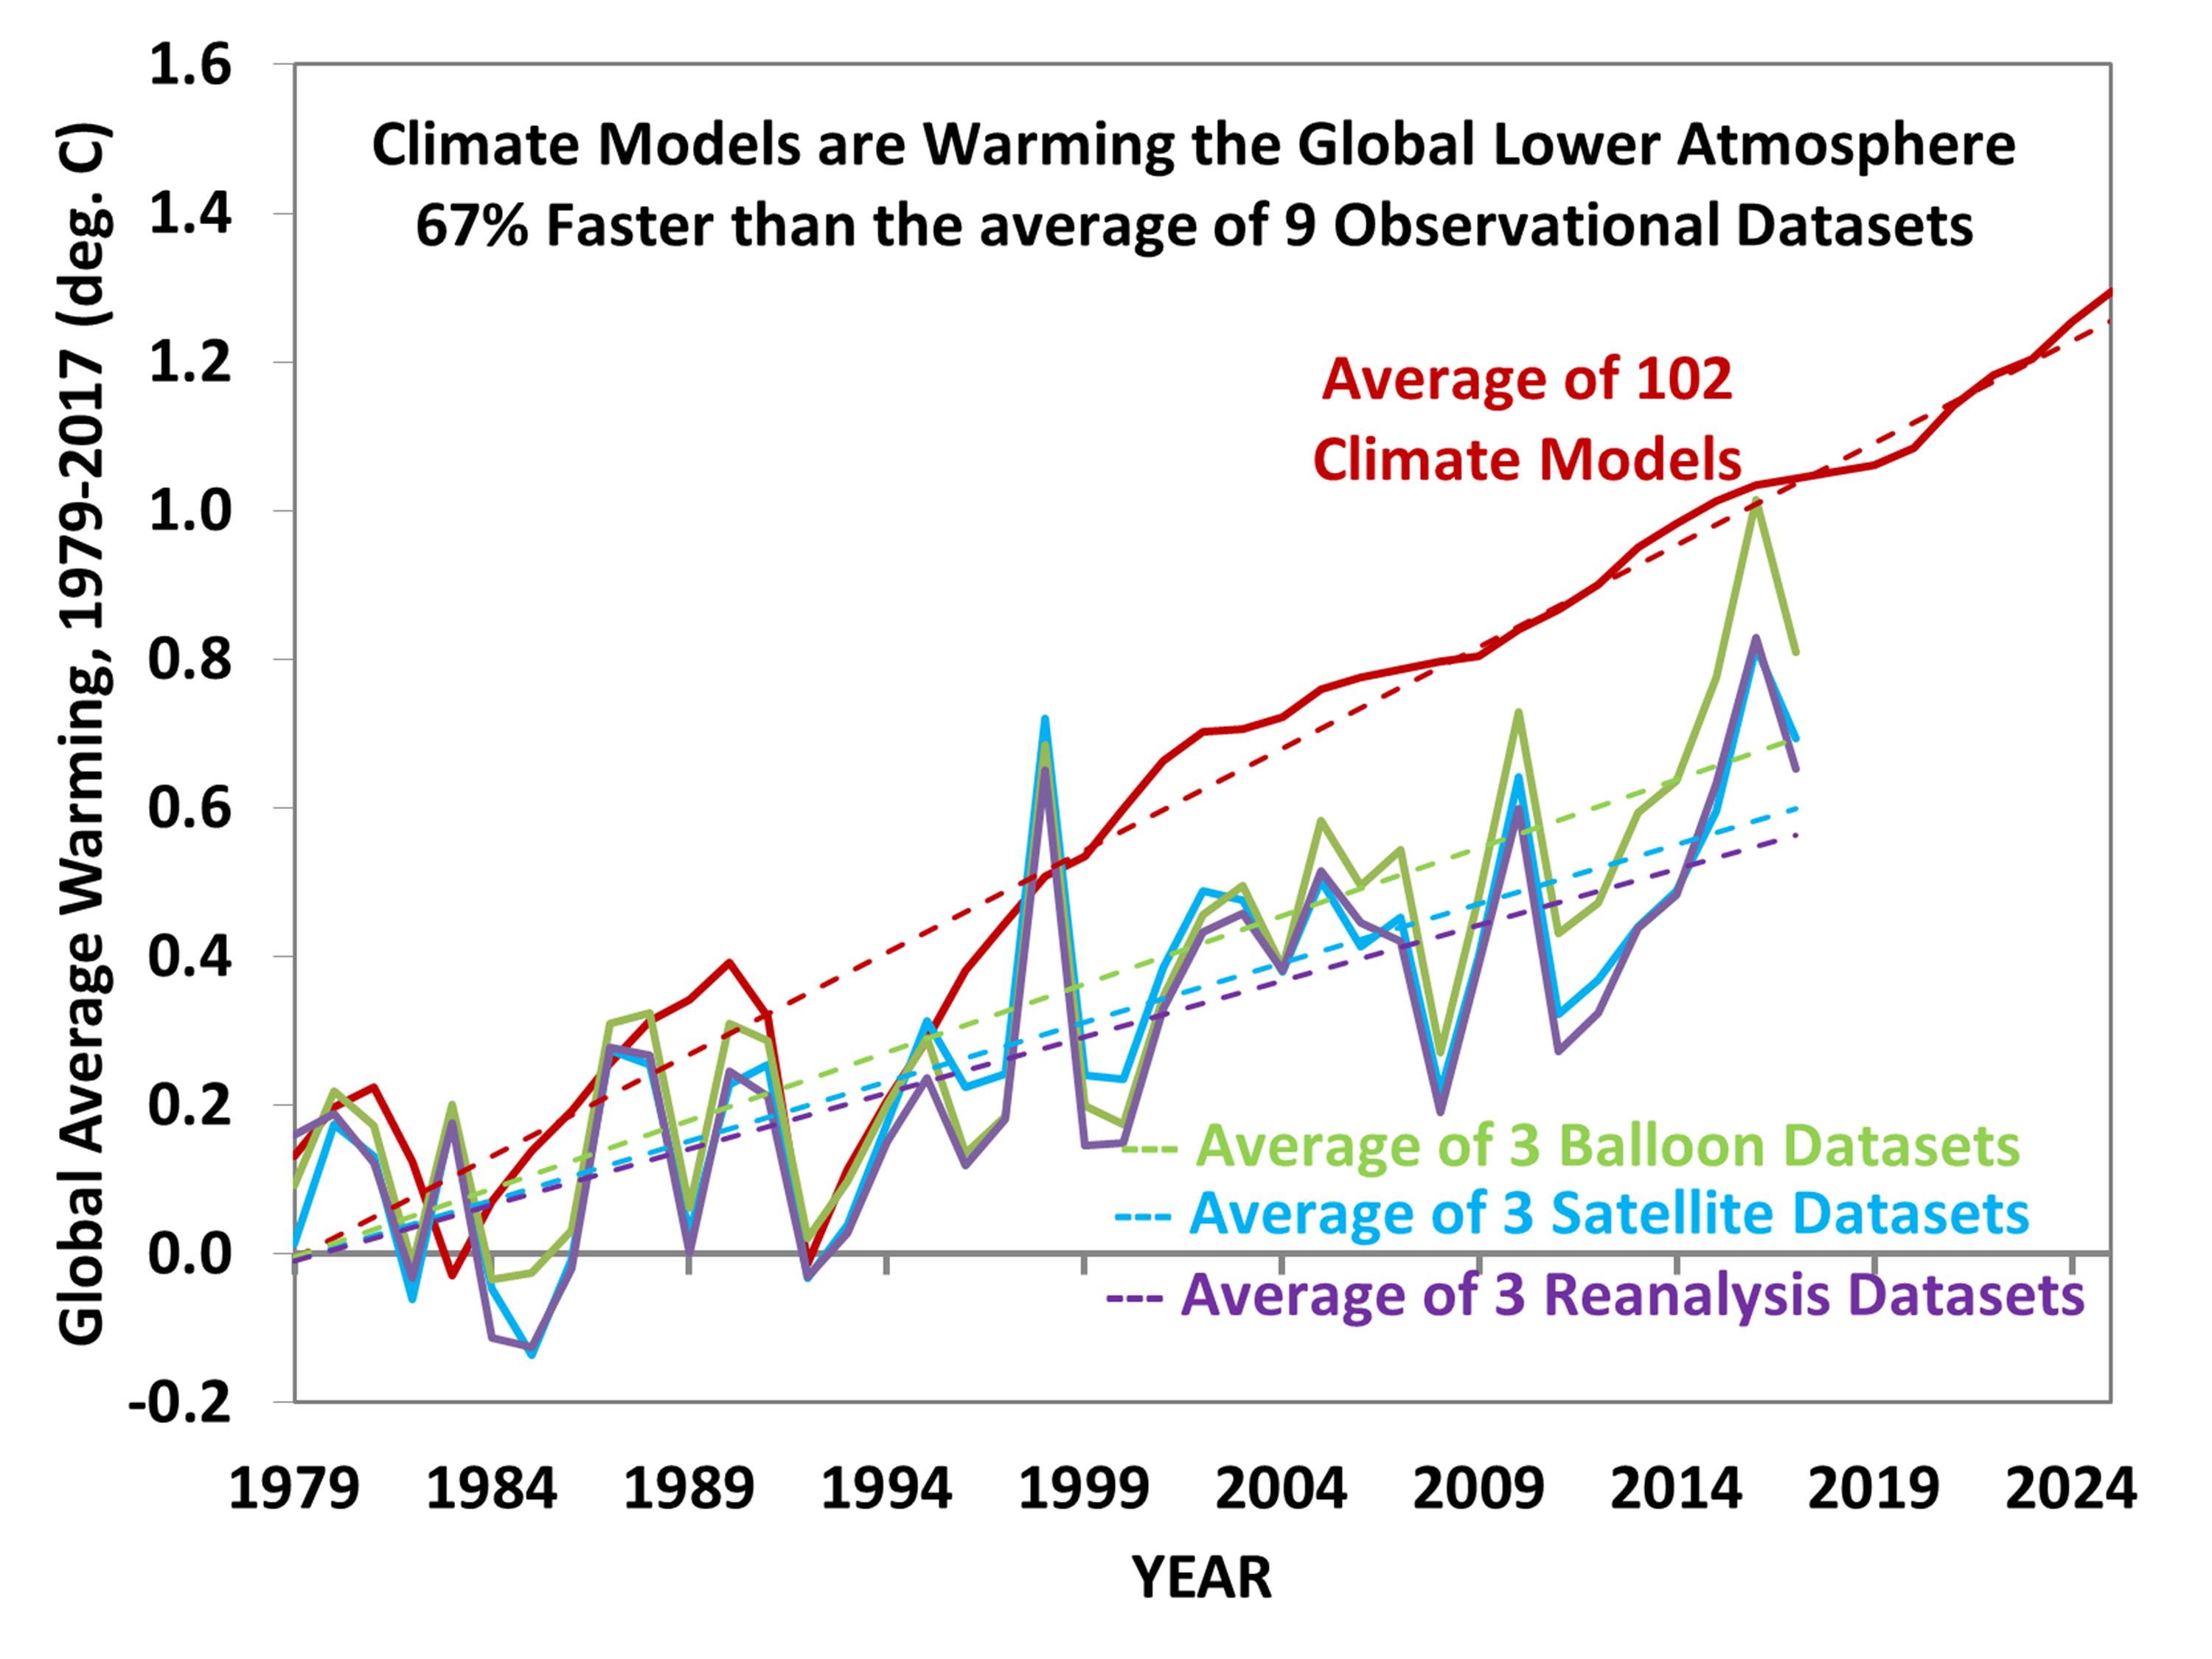
It is also remarkable how virtually every observational dataset — whether (1) surface temperature from thermometers, (2) deep-ocean temperature measurements, atmospheric temperature from (3) satellites, and from (4) radiosondes, when reanalyzed for the same period, always ends up with more (not less) warming? What are the chances of this? It’s like flipping a coin and almost always getting heads.
Again, a remarkable stroke of luck.