UPDATE(2/23/18): The previous version of this post had improper latitude bounds for the HadCRUT4 Tsfc data. I’ve rerun the results… the conclusions remain the same. I have also added proof that ENSO is accompanied by its own radiative forcing, a controversial claim, which allows it to cause multi-decadal climate change. In simple terms, this is clear evidence the climate system can cause its own, natural, internally-generated climate changes. This is partly what has caused recent warming, and the climate modelling community has assumed it was all human-caused.
Executive Summary
A 1D forcing-feedback model with two equivalent-ocean layers is used to model monthly global average surface temperatures from 1880 through 2017. Reflected shortwave (SW) and thermally emitted longwave (LW) forcings and feedbacks are included in an attempt to obtain the closest match between the model and HadCRUT4 surface temperatures based upon correlation and long-term trends.
The traditional radiative forcings included are RCP estimates of volcanic (SW), anthropogenic greenhouse gases (LW), and anthropogenic direct aerosol forcing (SW). The non-traditional forcings are ENSO-driven SW radiative forcing based upon the observed lagged relationship between CERES satellite SW radiative flux and the Multivariate ENSO Index during 2000-2017, which shows radiative accumulation (loss) during El Nino warming (La Nina cooling), and a non-radiative forcing of surface temperature proportional to ENSO activity since 1871 (MEI “ext” index).
Heat is pumped into the deep ocean in proportion how far the surface layer temperature deviates from energy equilibrium, with the proportionality constant chosen to match the observed average rate of heat accumulation in the 0-2000m layer between 1990 and 2017 from NODC data.
LW and SW feedbacks are adjusted in the model to optimize model agreement with observations, as is the model surface layer depth, and the ENSO non-radiative forcing strength. By incrementally changing the adjustable parameters, the model and observed surface temperature trends are matched and (using monthly running 12-month averages) a correlation of 0.88 is achieved from 1880-2017. The optimum effective depth of the surface mixed layer is 38 meters (equivalent to 54 m ocean, 0 m land in the global average), and the resulting model equilibrium climate sensitivity is 1.54 deg. C, which is less than half the average IPCC AR5 model sensitivity of 3.4 deg.
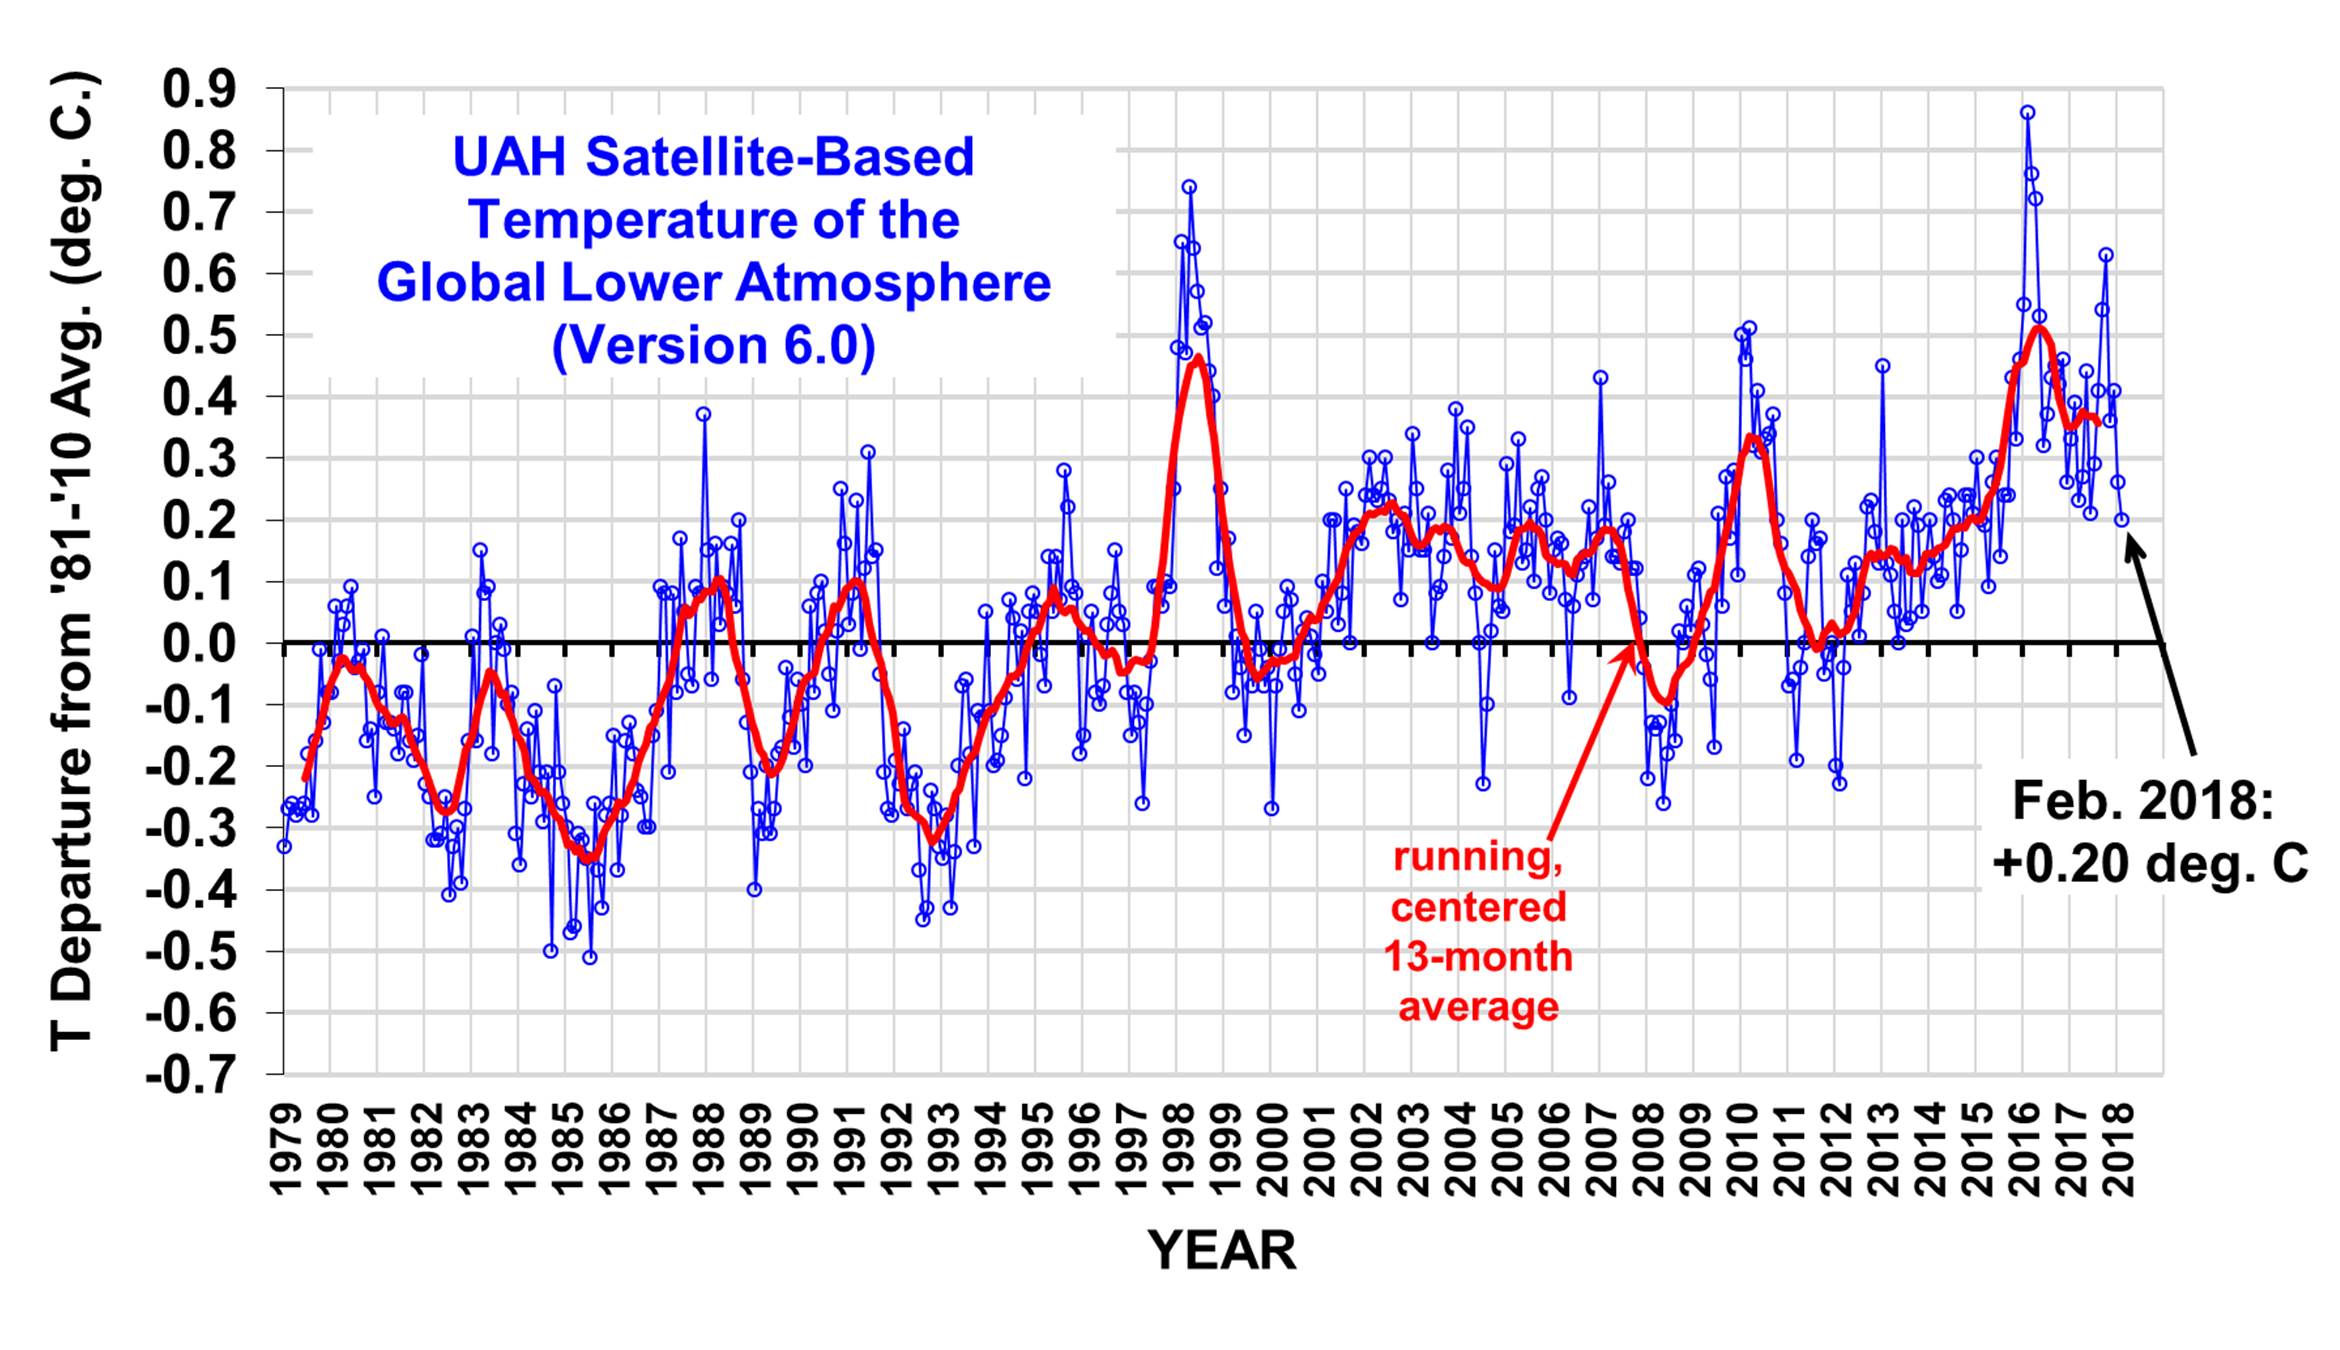
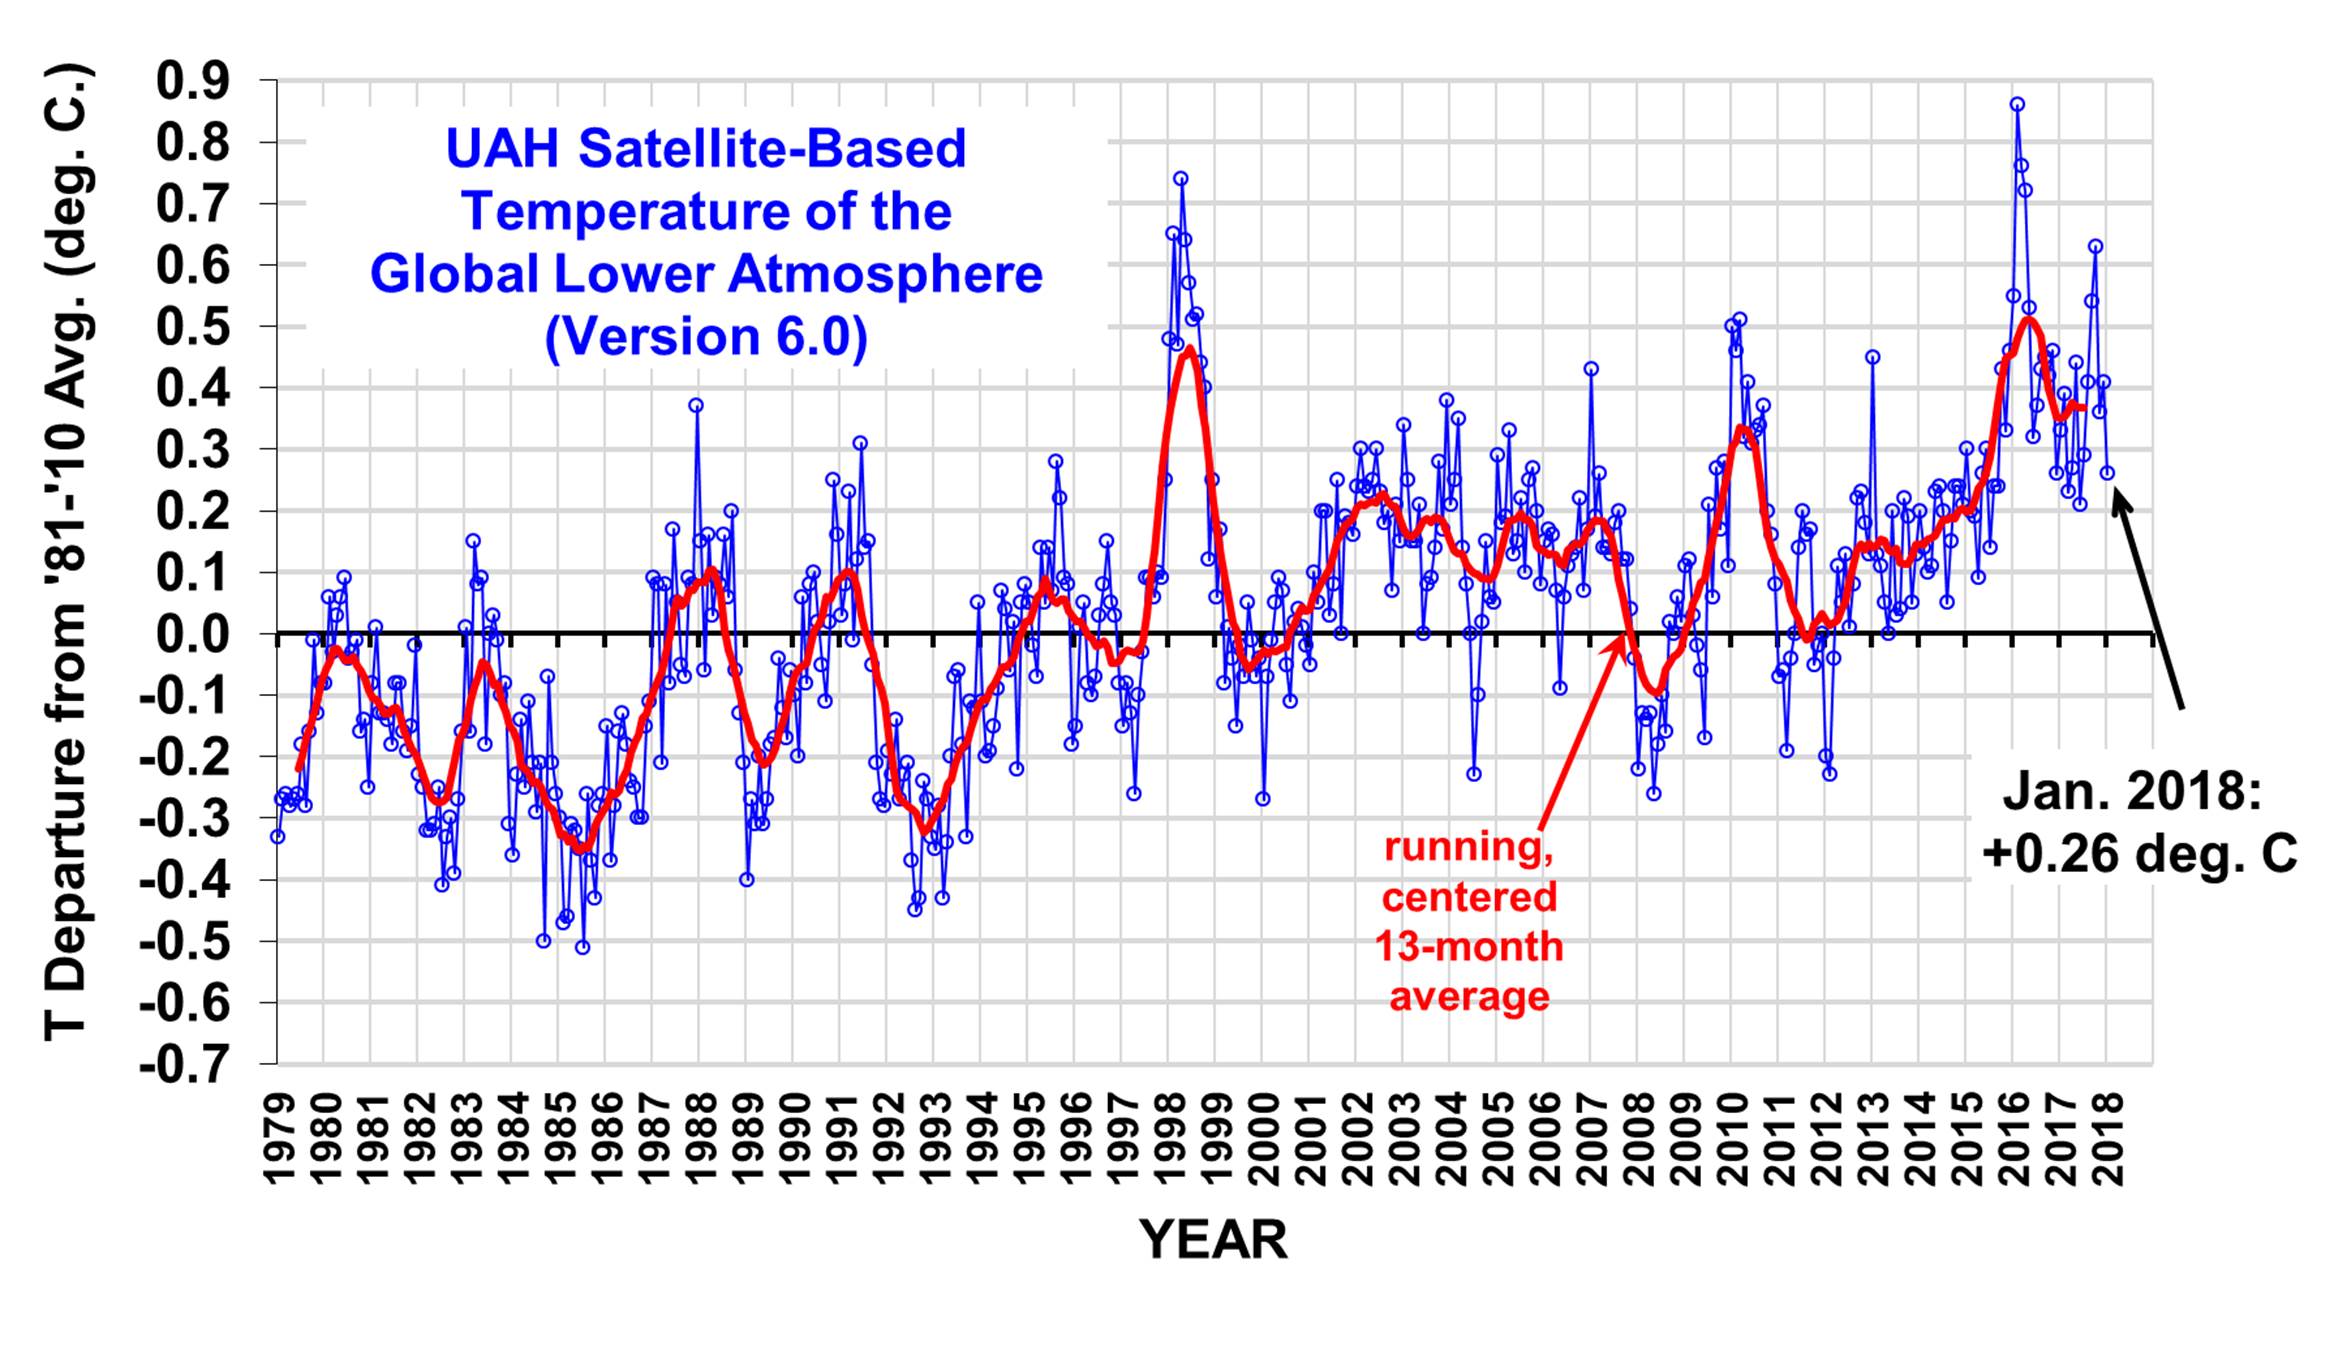
Curiously, the model surface temperature trend during 1979-2017 (+0.113 C/decade) is a much closer match to our UAH LT data (+0.128 C/decade) than it is to the HadCRUT4 data (+0.180 C/decade), despite the fact the model was optimized to match HadCRUT4 during 1880-2017.
It is also demonstrated that using either the model-generated, or the CERES-observed, radiative fluxes during 2000-2017 to diagnose feedbacks results in a climate sensitivity that is far too high, consistent with the published papers of Spencer & Braswell on this subject. Thus, CERES-derived radiative feedback, while useful for model comparison, should not be used to diagnose feedbacks in the climate system.
Background: CERES Radiative Fluxes Cannot be Used to Diagnose Global Feedbacks
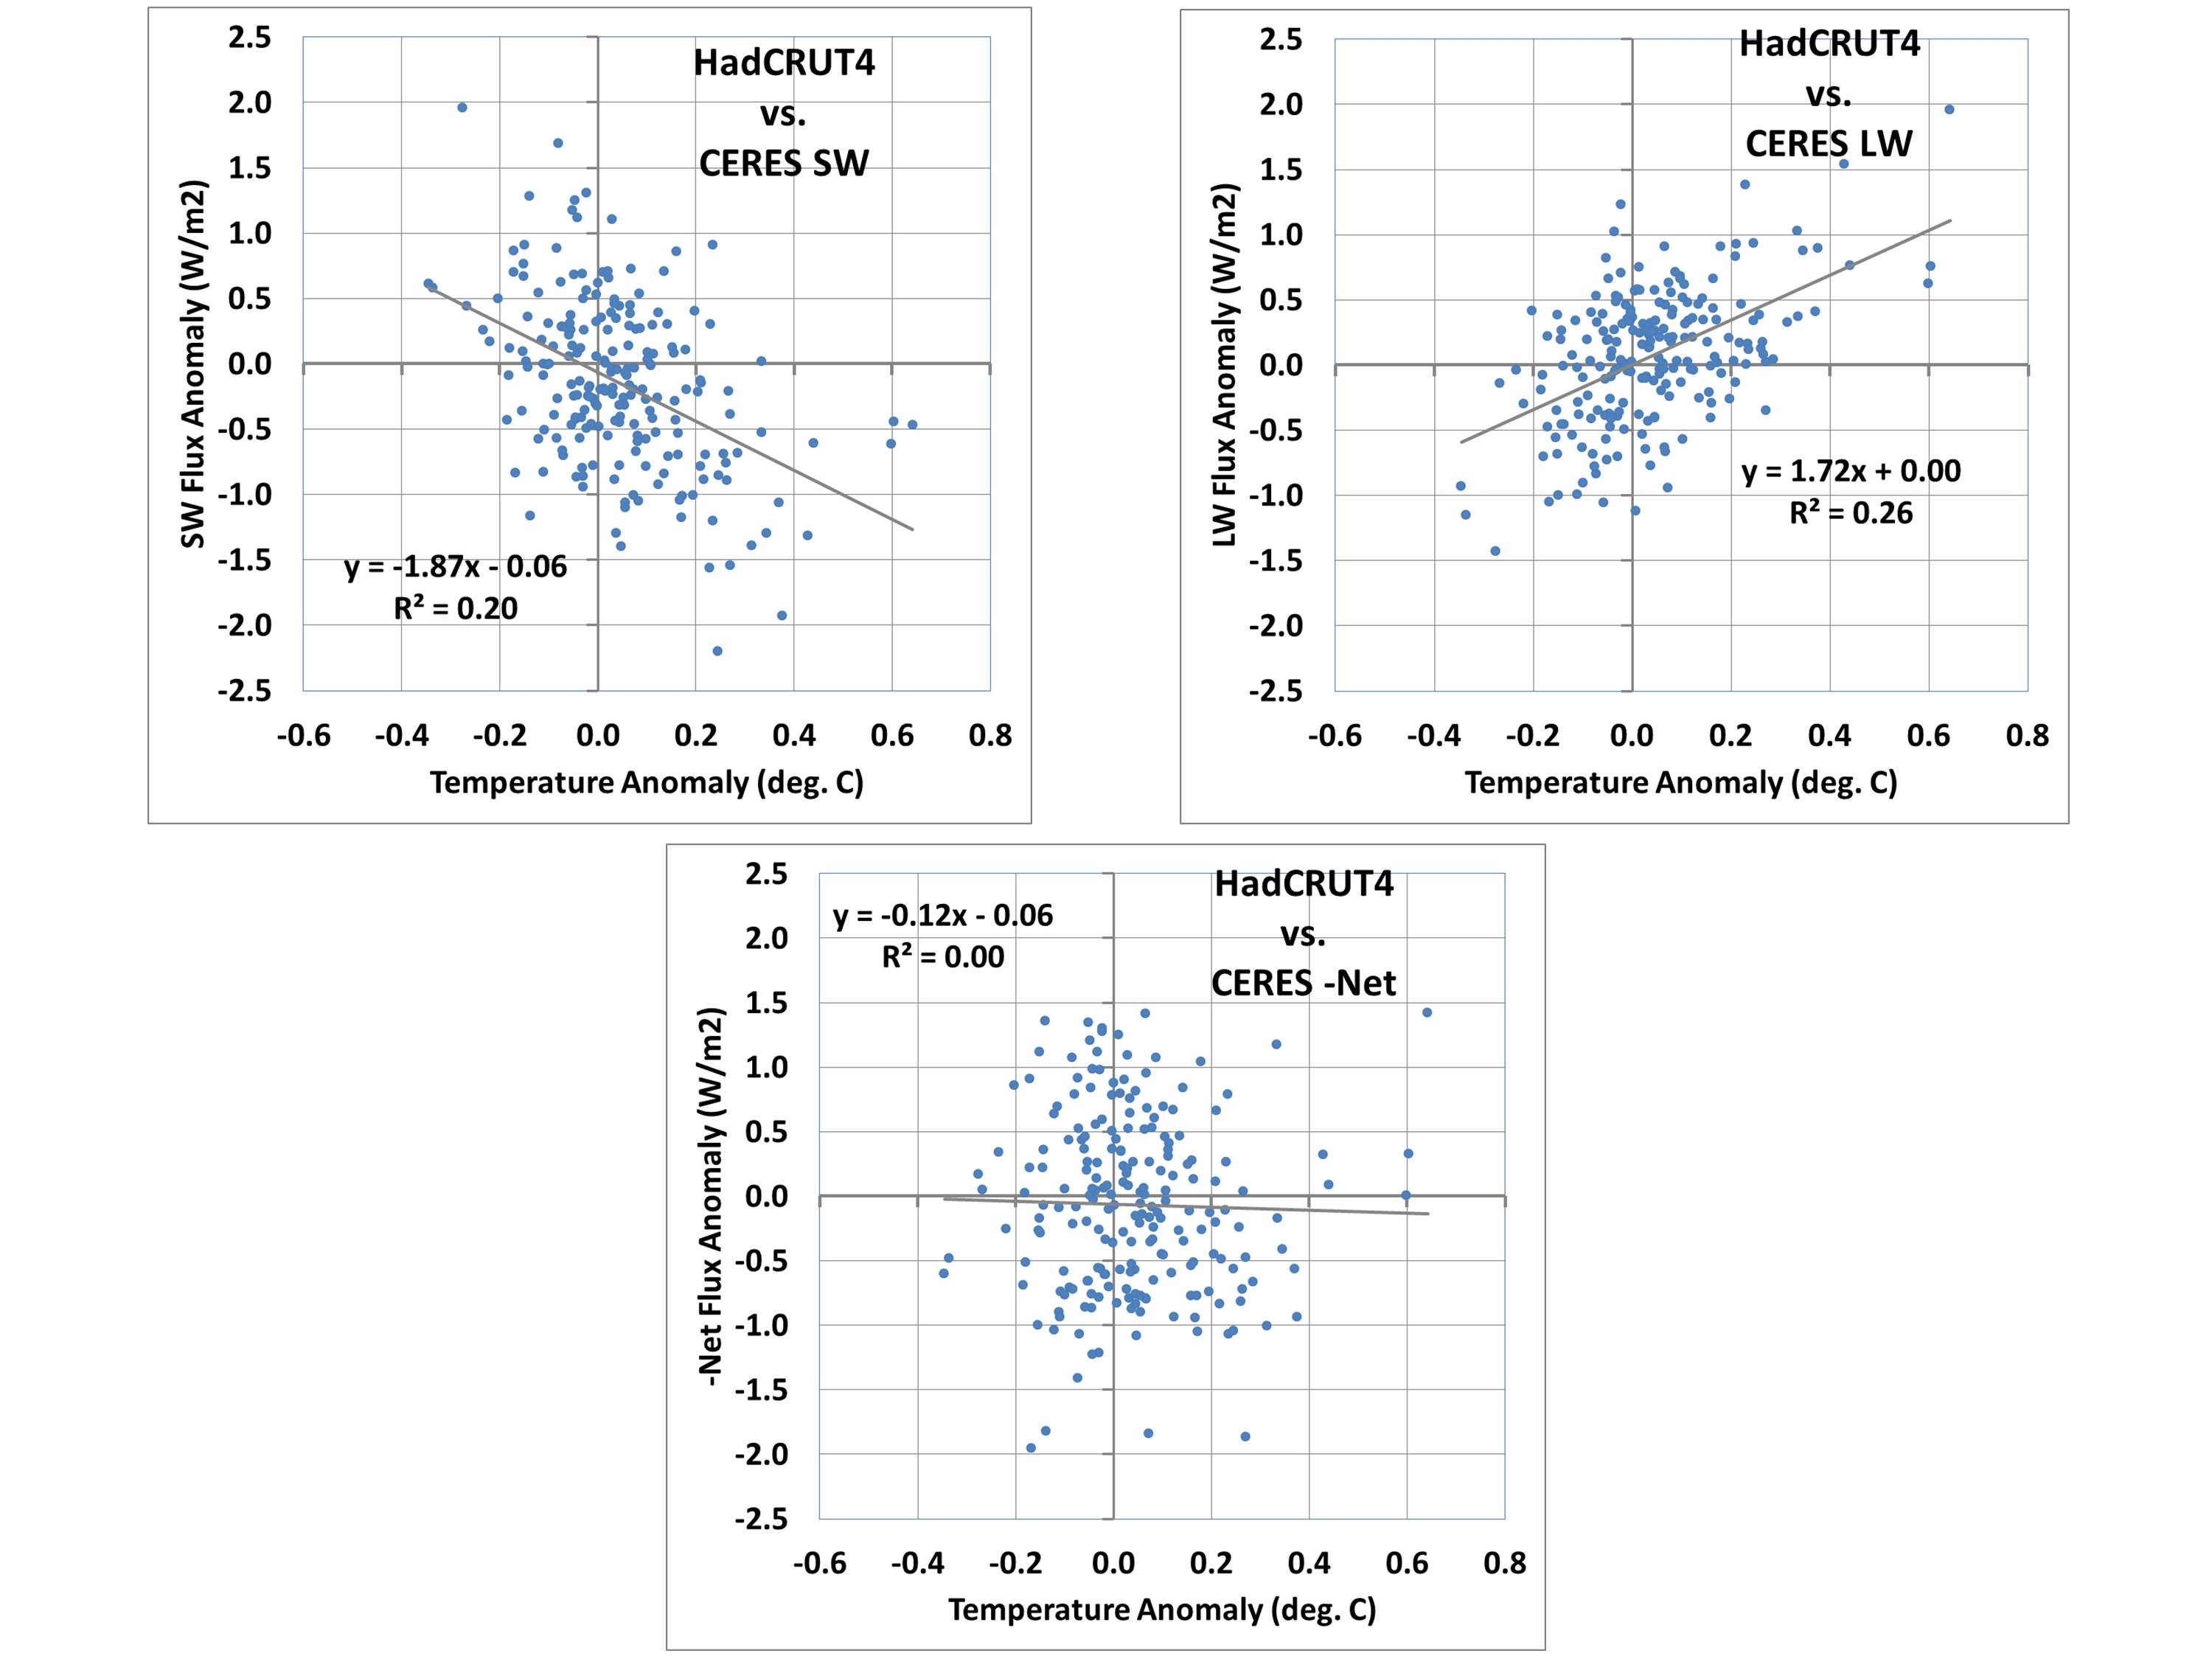
I recently revisited the CERES-EBAF dataset of top-of-atmosphere (TOA) radiative fluxes, a multi-satellite best-estimate of those fluxes updated for the period March 2000 through September, 2017. When I examined the feedback parameters (regression coefficients) diagnosed from the new, longer data record, the result for the Net (thermally emitted longwave LW + reflected shortwave SW) was clearly unrealistic. The plot of monthly global radiative flux variations are shown in Fig. 1, for LW, SW, and Net (LW+SW) fluxes compared to global average surface temperature variations from HadCRUT4.
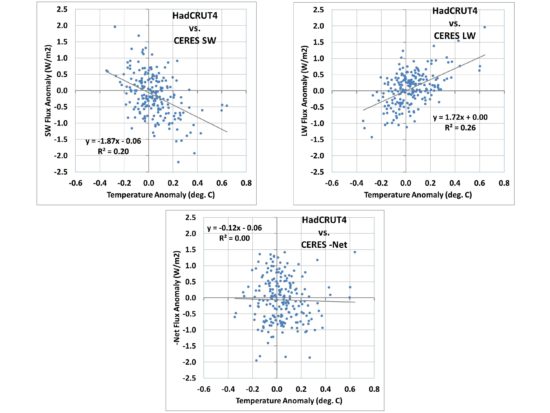
FIG. 1. Scatterplots of monthly global average anomalies in CERES SW, LW, and Net (LW+SW) radiative fluxes versus HadCRUT4 surface temperatures, March 2000 through September 2017. The negative sign of the regression result in the bottom plot is physically impossible if interpreted as a net feedback parameter in the climate system.
Significantly, the Net flux regression result in Fig. 1 (-0.12 W/m2 K) is physically impossible as a feedback interpretation, with the wrong sign. It would suggest that as the climate system warms, it traps even more radiative energy, which would produce an unstable climate system with runaway warming (or cooling).
The SW and LW regression results in Fig. 1 are at least possible in terms of their signs… at face value suggesting positive SW feedback, and for the longwave (compared to a temperature-only “Planck effect” value of 3.2 W/m2 K), the 1.72 W/m2 K value would suggest positive LW feedback, probably from water vapor (maybe high clouds).
As I will demonstrate, however, the regression coefficients themselves are not well related to feedback, and thus climate sensitivity. (The equilibrium climate sensitivity is computed by dividing the theoretically-expected radiative forcing from a doubling of atmospheric CO2 [2XCO2], 3.7 W/m2, by the Net feedback parameter, which must be positive for the climate system to be stable [all IPCC models have Net feedback parameters that are positive]).
We have published a few papers on this subject before, and it was the theme of my book, The Great Global Warming Blunder. I have, quite frankly, been disappointed that the climate research establishment (with the exception of Dick Lindzen) has largely ignored this issue. I hope that the work (in progress) I post here will lead to some renewed interest in the subject.
After spending some time (once again) trying to come up with some way to convincingly explain why the regression coefficients like those in Fig. 1 aren’t really a measure of feedback (without gnashing of teeth in the climate community, or journal editors resigning after publishing our paper), I decided to code up a simple 1D forcing-feedback model that would allow me to (1) explain the temperature variations since 1880 in a physically consistent way, and then (2) use the radiative output from the model during the CERES period (2000-2017) to show that the model-diagnosed feedback parameters indicate a much higher climate sensitivity than was actually specified in the model run.
In the rest of the post below, I believe I will convincingly demonstrate what I am saying… while also providing both an estimate of climate sensitivity from the last 137 years of climate variability, and explaining features like the pre-1940 warming trend, the post 1940 warming hiatus, and the post-1997 warming hiatus.
The 1D Energy Balance Forcing-Feedback Model
While striving for maximum simplicity while still explaining the observed data, I finally realized that the 20-layer ocean used in the model of Spencer & Braswell (2014) was needlessly complex, and the resulting criticism of our ocean heat diffusion scheme was a distraction from the core conclusions of the paper.
So, I’ve now convinced myself that all that is required is a 2-layer model, where the rate of deep ocean storage is simply proportional to how warm the surface layer gets compared to energy equilibrium. While not necessarily totally representative of how the ocean works, it does meet the IPCC expectation that as global temperatures warm, the deep ocean also warms, and allows a sink for a portion of the energy that accumulates in the surface layer. The proportionality constant for this is set to produce the same amount of average 0-2000m warming from NODC ocean heat content (OHC) during 1990-2017. We couldnt do this in our original work because estimates of 0-2000m OHC were not yet published (I contacted Sid Levitus at the time, and he said they were working on it).
The depth of the model top layer is an adjustable parameter that can be tuned to provide the best agreement with HadCRUT4 observations; it is assumed to represent a global average of an ocean mixed layer of constant depth, and assumed no net storage (or loss) of energy by land during warming (or cooling).
The model is based upon the commonly used forcing-feedback energy budget equation for the climate system, assuming temperature deviations are from some state of energy equilibrium (I know, that’s debatable… bear with me here):
ΔT/Δt = [F(t) – λ ΔTsfc]/Cp
This equation simply says that the temperature change with time of a system with heat capacity Cp is related to the time-varying forcings F (say, excess radiative energy forced into the system from anthropogenic GHG accumulation) minus the net radiative feedback (radiative loss by the system proportional to how warm it gets, with λ being the net feedback parameter with units W/m2 K). The net feedback parameter λ implicitly includes all fast surface and atmospheric feedbacks in the system: clouds, water vapor, lapse rate changes, etc.
In our case, there are two model layers, the forcings are several, and there is a transfer of energy between the two ocean layers. Importantly, I also separate out the LW and SW forcings (and feedbacks) so we can ultimately compare the model results during 2000-2017 with the CERES satellite measurements during the same period of time.
The model radiative forcings include the RCP6.0 anthropogenic GHGs (assumed LW), volcanic aerosols (assumed SW), and anthropogenic aerosol direct forcing (assumed SW). The indirect aerosol forcing is excluded since there is recent evidence aerosol forcing is not as strong as previously believed, so I retain only the direct forcing as a simple way to reduce the total (direct+indirect) anthropogenic aerosol forcing.
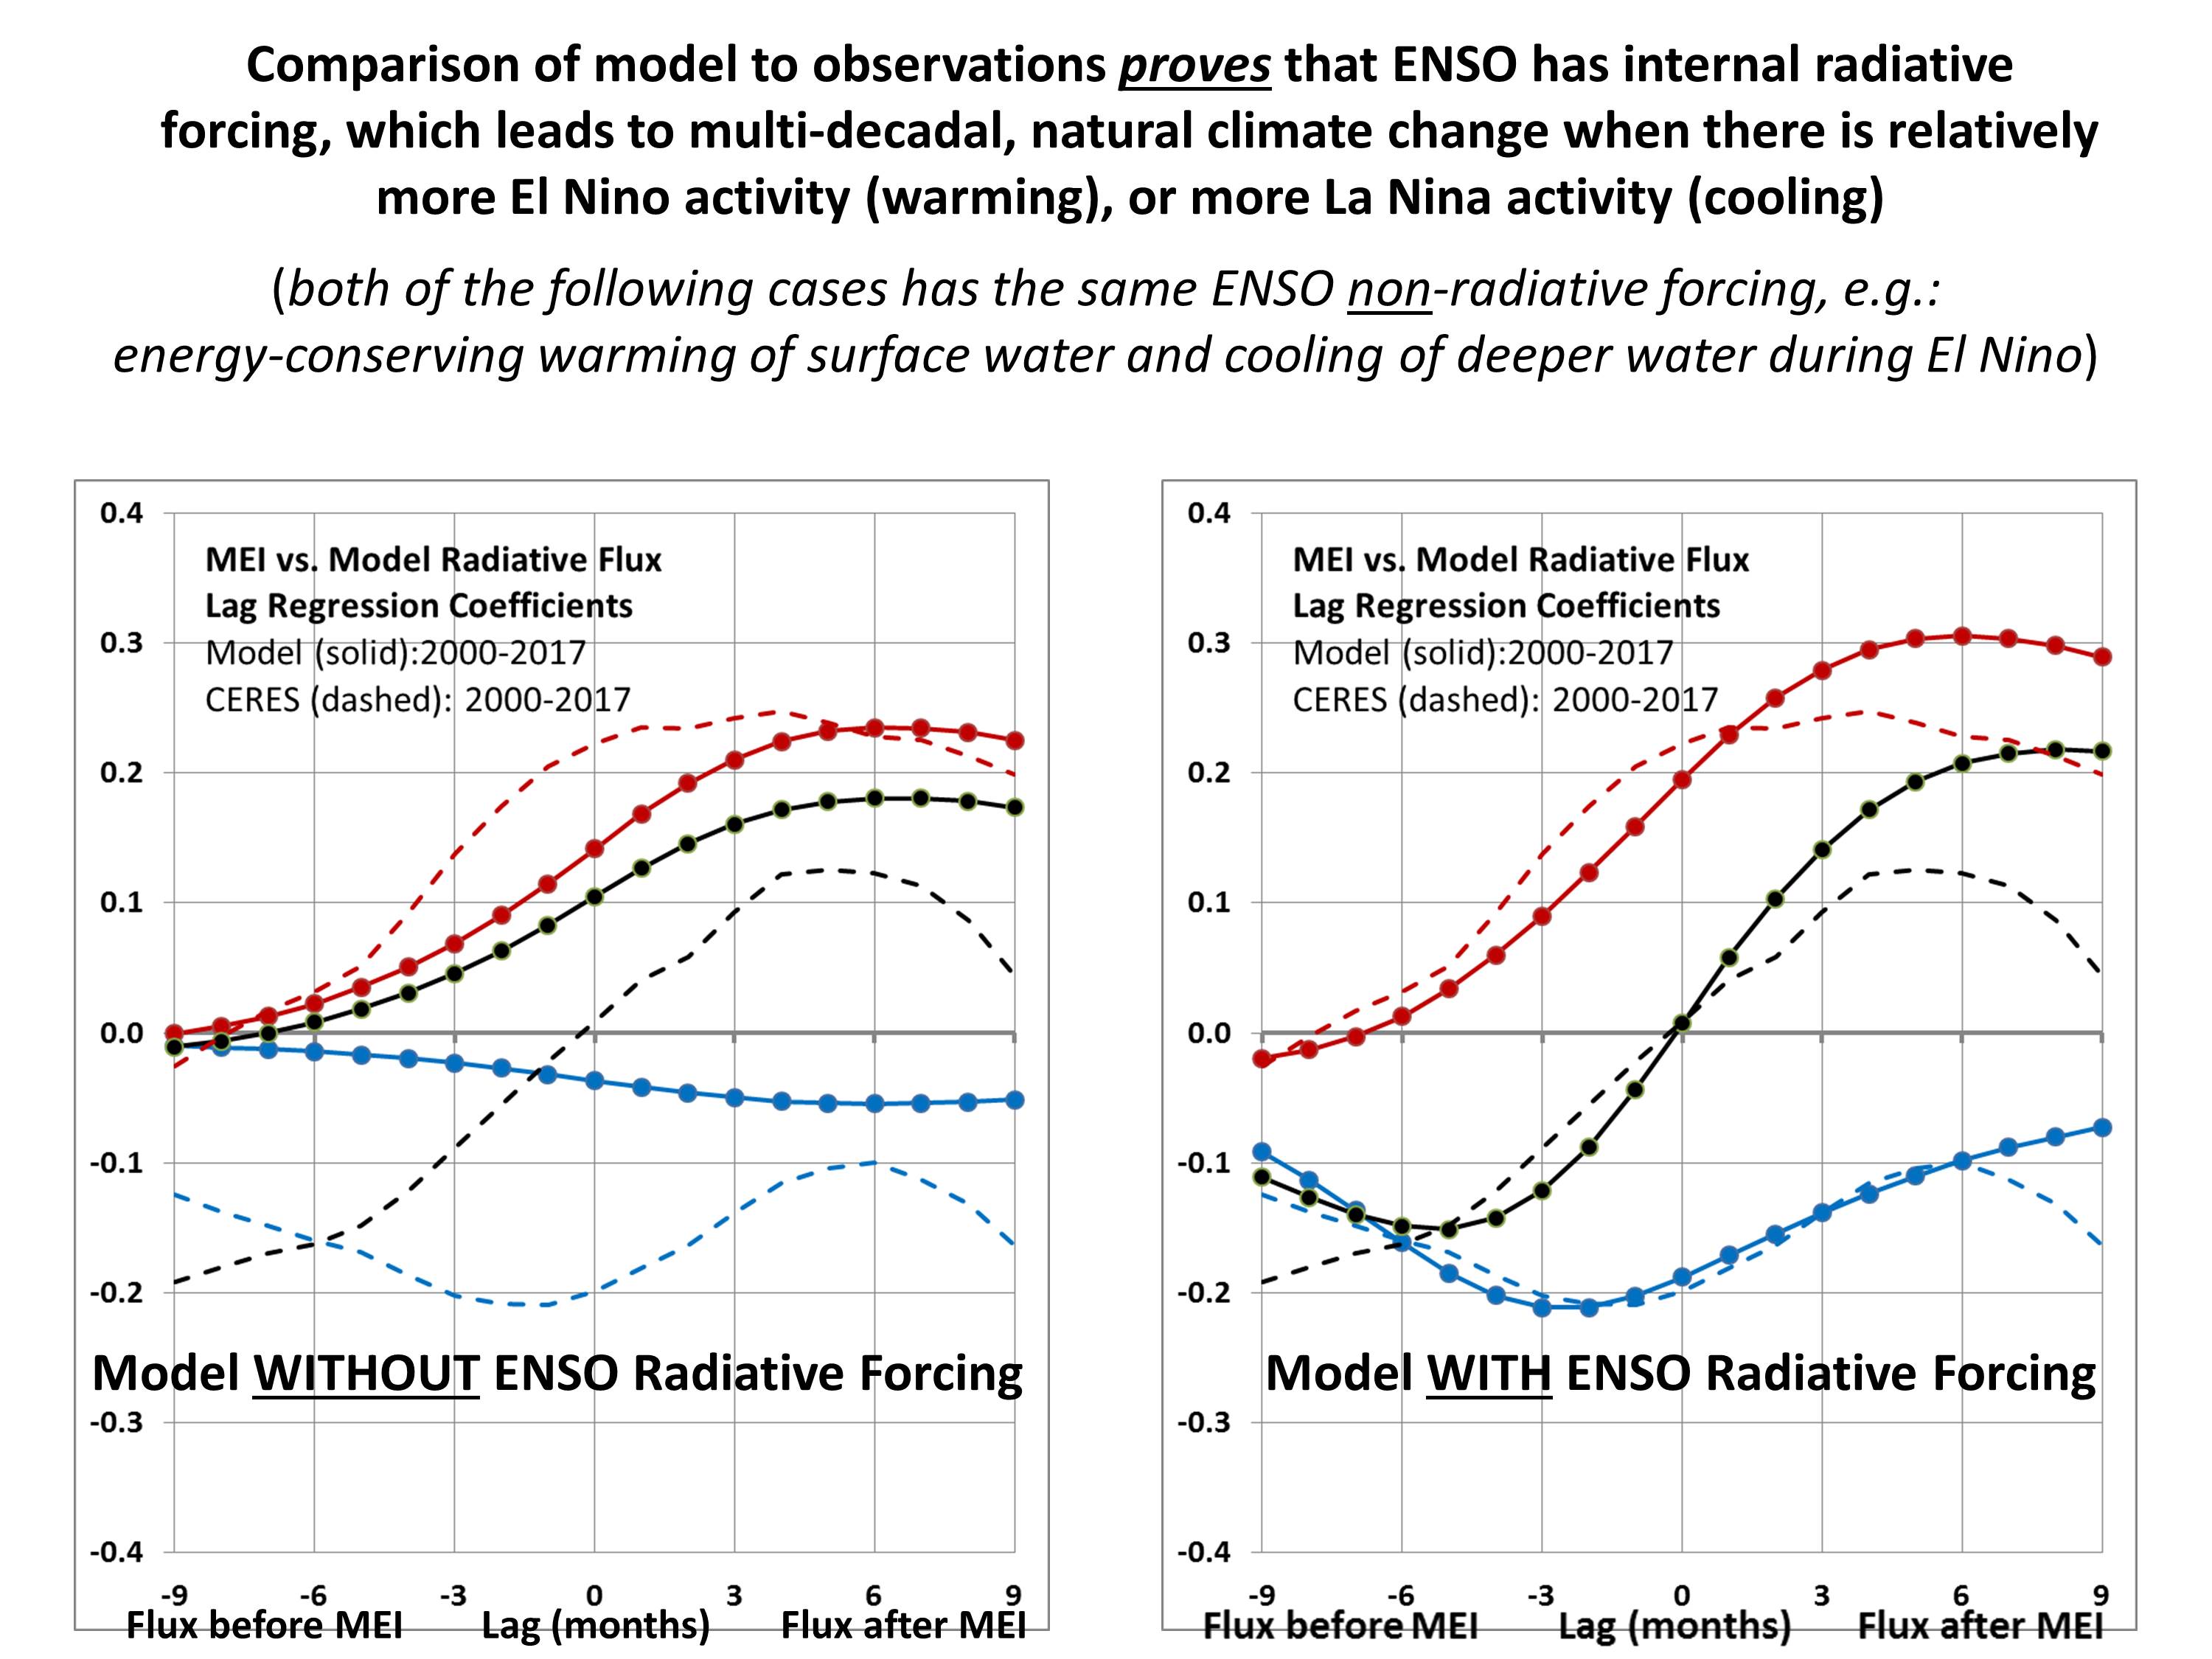
As Spencer and Braswell (2014) did, I include an ENSO-related SW radiative (and a little LW) forcing, proportional to the MEI extended index (1871-2017). I use a total value of 0.23 W/m2 per MEI index, initially calculated as 0.20 by regression from how much average CERES SW energy accumulation (loss) there is averaged over the 1 to 3 months before El Nino (La Nina) during the updated CERES data record (March 2000-September 2017). The SW and LW forcing values were adjusted slightly as the model was run until the model lag regression coefficients of MEI versus radiative flux matched the same metrics from CERES observations. I have added the following intermediate figure to demonstrate this controversial claim: that ENSO involves not only a change in the vertical temperature structure of the ocean (non-radiative forcing of surface temperature), but that radiative changes precede ENSO; that is, ENSO provides its own radiative forcing of the climate system:
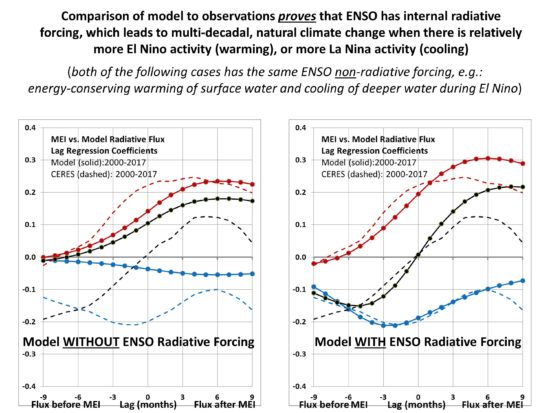
Intermediate Plot A: The CERES observed relationship between radiative flux and ENSO activity can ONLY be explained by invoking radiative forcing prior to ENSO. This significantly impacts the “feedback” interpretation of CERES radiative fluxes, decorrelating their relationship to temperature, thus giving the illusion of an excessively sensitive climate system if one interprets the regression slopes as only due to feedback.
The ENSO non-radiative forcing (e.g. warming of the surface layer during El Nino, with an energy-equivalent cooling of the deeper layer, due to a global-average reduction in the rate of ocean overturning) is directly proportional to the MEI index value, with no time lag. It is tuned to help maximize the match between modeled and observed ENSO warming and cooling episodes in surface temperatures.
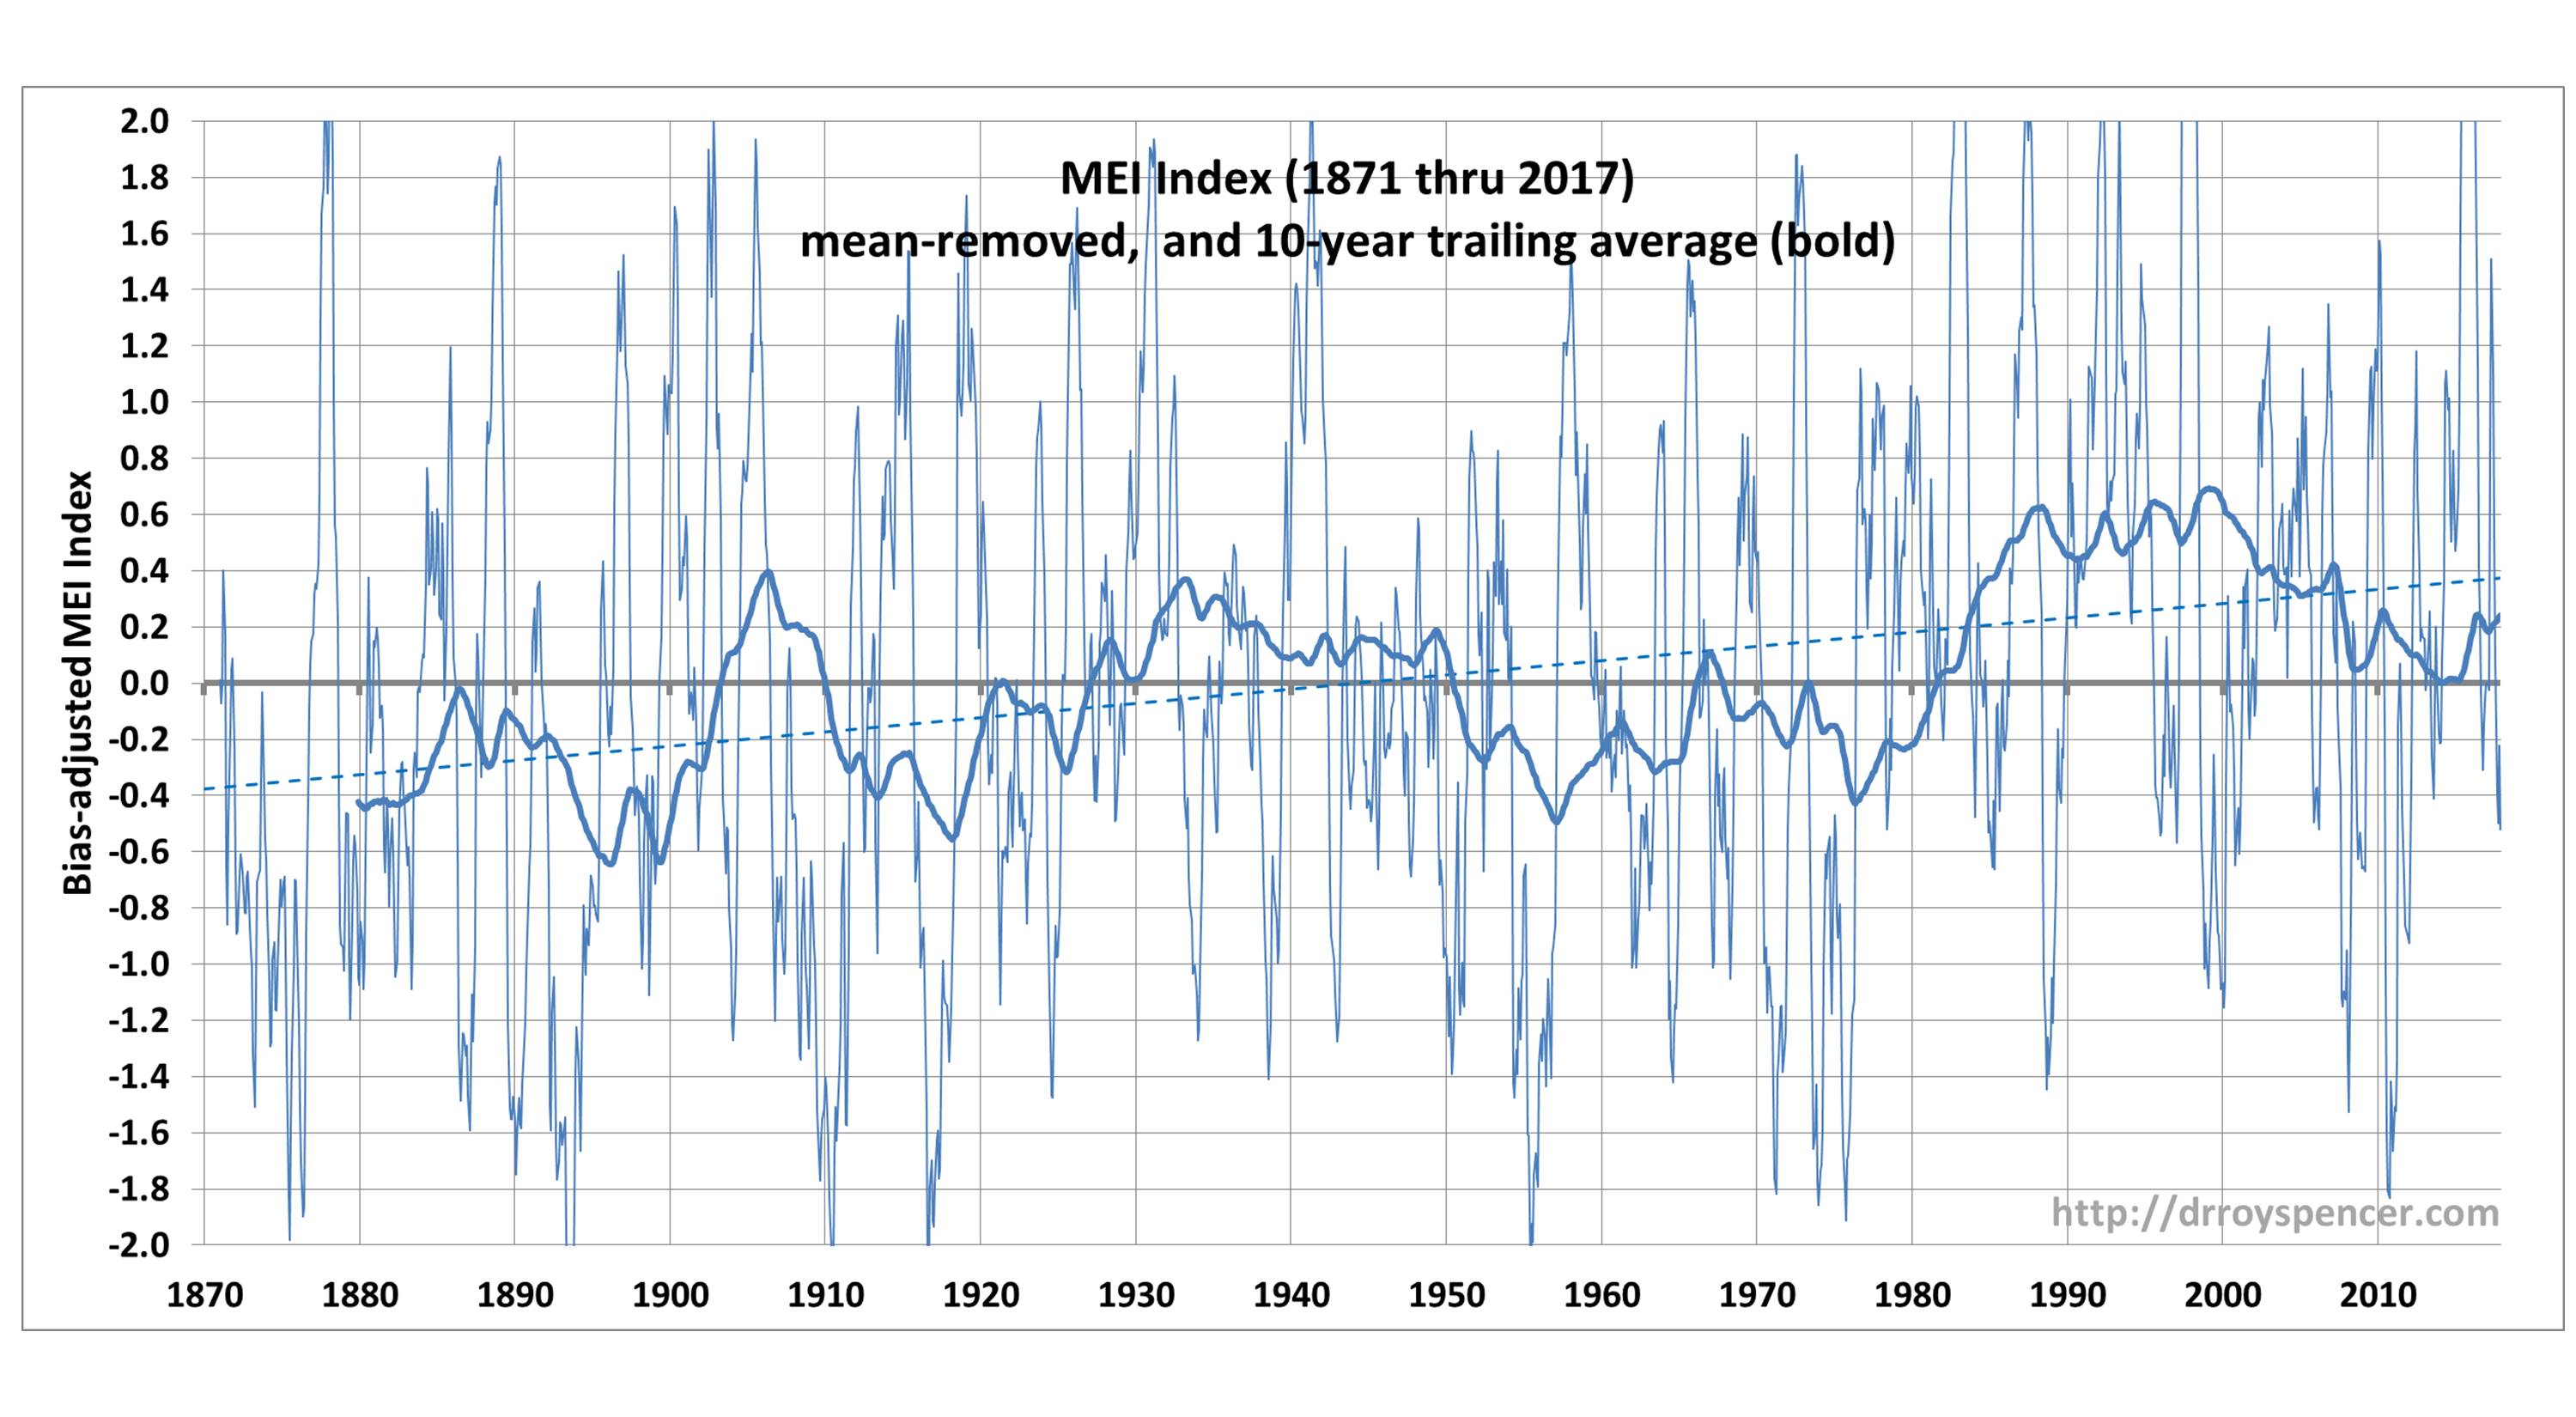
Significantly, I have adjusted the MEI values by a constant so that their sum during 1871-2017 is zero. This is to avoid expected criticism that the MEI index could be inadvertently driving a net gain or loss of energy by the model climate system over this time because it has a net high bias. (This is indeed a possibility in nature; I note even that with the mean removed, there is a small upward linear trend in the MEI, corresponding to a radiative forcing of -0.08 W/m2 in 1871, linearly increasing to +0.08 W/m2 in 2017 using my CERES-derived coefficient; I have not looked at how much this trend affects the results, and it might well be that La Nina activity was more prevelant in the late 1800s and El Nino more prevalent in the last 20th Century). Here is what the MEI time series looks like, on an expanded scale so you can see how the 10-year trailing averages of MEI reveals interdecadal variations, which are an important component of global temperature variability:
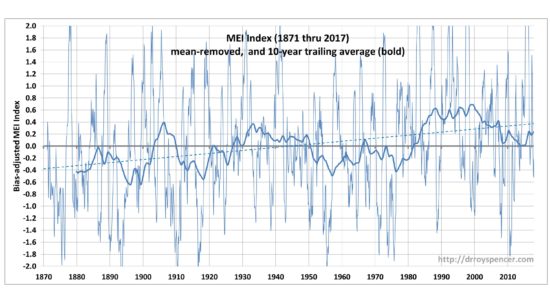
Intermediate Plot B. The merged and biased-adjusted extended MEI time series, 1871 through 2017, revealing decadal time scale variability in the trailing 10-year averages. This decadal variability, combined with both radiative and non-radiative forcing of surface temperatures related to MEI causes much of the multidecadal temperature variations we have experinced in the instrumental record.
As mentioned above, the rate of deep-ocean heat storage is simply assumed to be proportional to how far the surface layer temperature departs from energy equilibrium… the warmer the surface layer gets, the faster heat is pumped into the model deep ocean. The proportionality constant is tuned until the model produces an average deep-ocean (0-2000m) heating rate of 0.51 W/m2 over the period 1990 through 2017, matching NODC data after being modified by the global coverage by ocean (71%), and assuming the land does not store (or lose) appreciable energy.
The model is entered into an Excel spreadsheet with each row being a one month time step. It is initialized in the year 1765, which is when the RCP radiative forcing is initialied to zero. Correspondingly, the model temperature is initialized at zero departure from energy equilibrium in 1765 (this is not necessary if one believes the climate system was in the Little Ice Age at that time, but for now I want to make assumptions as similar to IPCC climate model assumptions as possible).
The adjustable parameters of the model are changed to improve the model fit to the HadCRUT4 data in real time in the Excel spreadsheet. For example, one parameter (say, the surface layer thickness) is adjusted until maximum agreement is reached. Then another parameter is adjusted (say, the LW feedback parameter) in the same way until further improvement is achieved. But then the other parameters must be re-adjusted. This iterative process is rather brute-force, but within a few hours one converges on a set of adjustable parameter values which produce the best results in terms of correlation and matching temperature trends between the model and HadCRUT4 observations.
Model Results
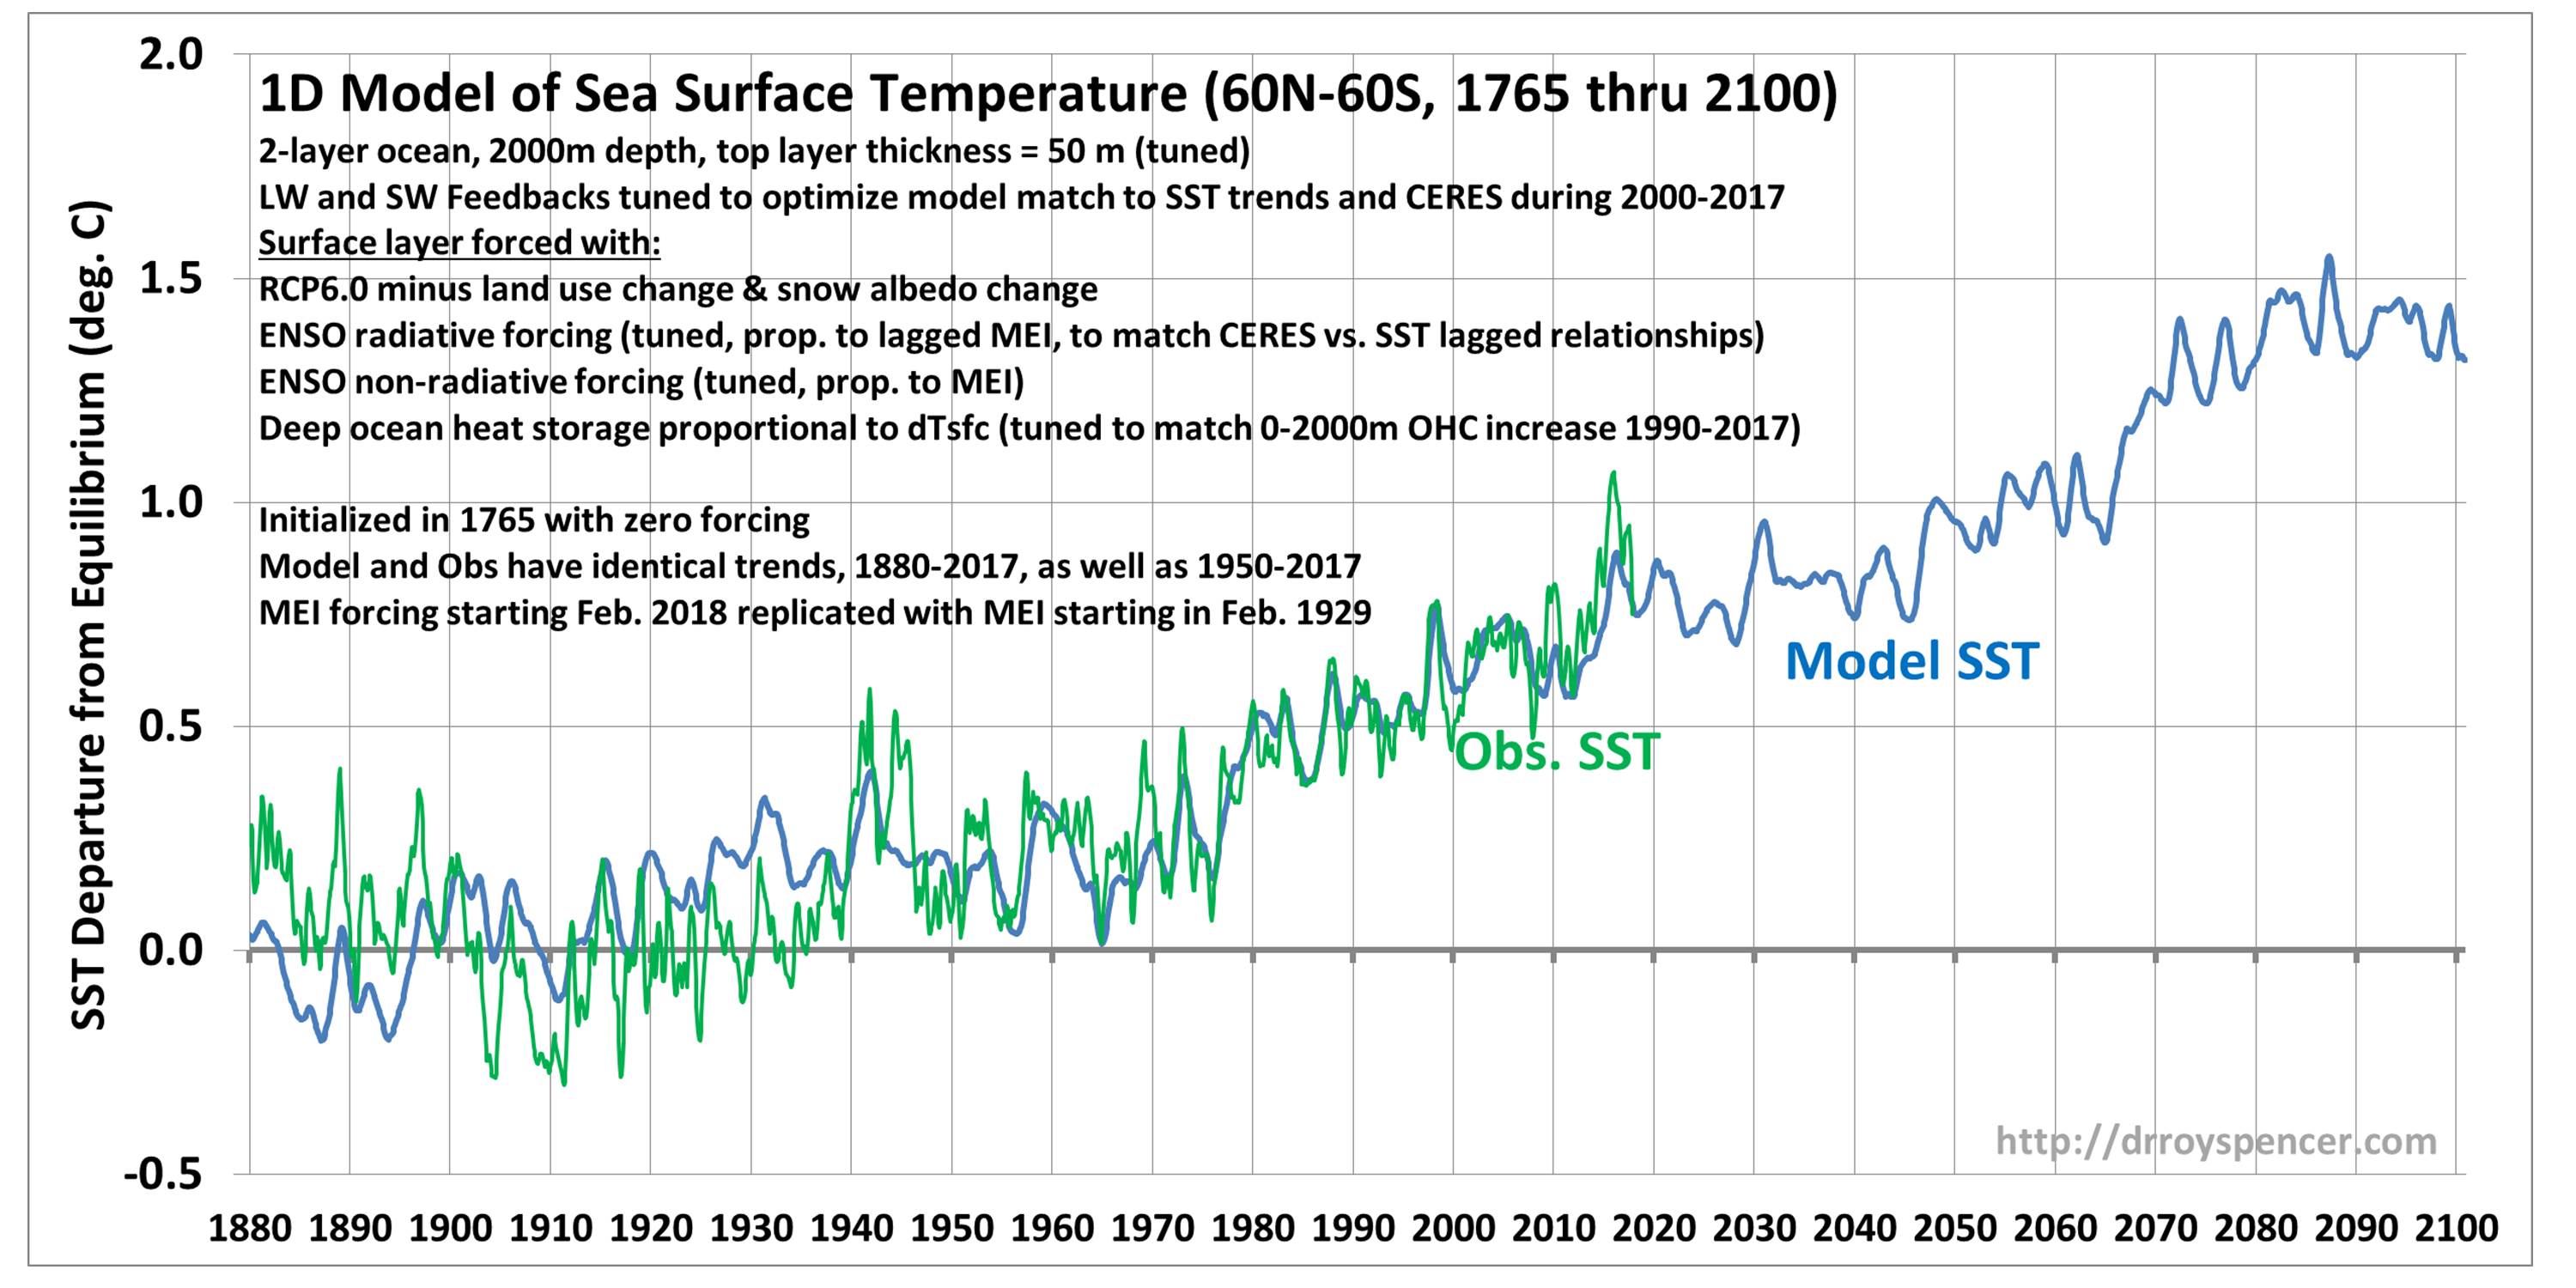
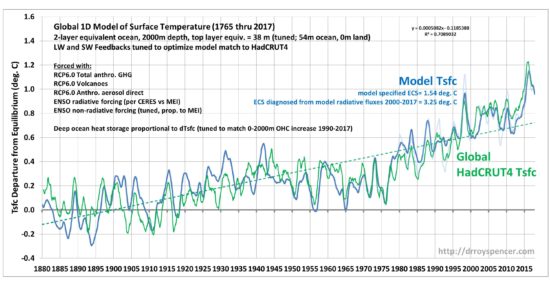
Fig. 2 shows one of many model realizations which comes close to the data, in terms of correlations (here about 0.88) and the same temperature trends. Note that the observed temperature time series has a 12-month smoother applied (click for large version).
Fig. 2. One-dimensional time-dependent model of global average equivalent-ocean surface layer temperature departures from energy equilibrium (dark blue), using RCP6 radiative forcings, ENSO-related radiative and non-radiative forcing, and deep ocean storage of heat proportional to the surface layer temperature departure from equilibrium. HadCRUT4 surface temperature anomalies (12-month smoothed, red) are adjusted vertically on the graph to have the same average values as the model. The temperature trends lines (1880-2017, dashed) of the model and observations coincide, since part of the feedback tuning is to force the trends to match. The UAH LT temperature variations are shown in light blue.
Following are several significant findings from this modeling exercise:
1. the specified model feedback parameters correspond to an equilibrium climate sensitivity of only 1.54 deg. C. This is less than half of the IPCC AR5 model average of 3.4 deg. C, and in close agreement with the best estimate of 1.6 deg. C of Lewis and Curry (2015). As we already know, the IPCC models tend to overestimate warming compared to what has been observed, and the current study suggests their excess warming is due to the models’ climate sensitivity being too high.
2. Note that the ENSO activity during the 20th Century largely explains the anomalous warmth around the 1940s. In fact, this feature exists even with the anthropogenic aerosol forcing removed, in which case a warming hiatus exists from the 1940s to the 1980s. This is the result of the ENSO radiative forcing term (0.23 W/m2 per MEI index value) combined with stronger El Ninos before the 1940s and weaker ones from the 1940s until the late 1970s.
3. The warming hiatus from 1997 to 2016 is evident in the model.
4. The model trend during the satellite temperature record (1979-2017) shows much better agreement with the UAH LT (lower troposphere) temperatures than with HadCRUT4, even though HadCRUT4 was used to optimize the model (!):
Here are the 1979-2017 trends, and correlation with model:
Model: +0.113 C/decade
UAH LT: +0.128 C/decade (r=0.81)
HadCRUT4: +0.180 C/decade (r=0.85)
Compared to the model, the UAH LT trend is only 0.015 C/decade higher, but the HadCRUT4 trend is 0.067 C/decade higher.
5. We can take the model output radiative fluxes, which include both forcing and feedback, during the CERES satellite period of record (March 2000 through September 2017) to see if the “feedbacks” diagnosed from regression are consistent with the actual feedbacks specified in the model. What we find (Fig. 3) is that, just as Spencer & Braswell have been arguing, the feedback parameters diagnosed from the radiative flux and temperature variations lead to regression coefficients quite far from those specified:

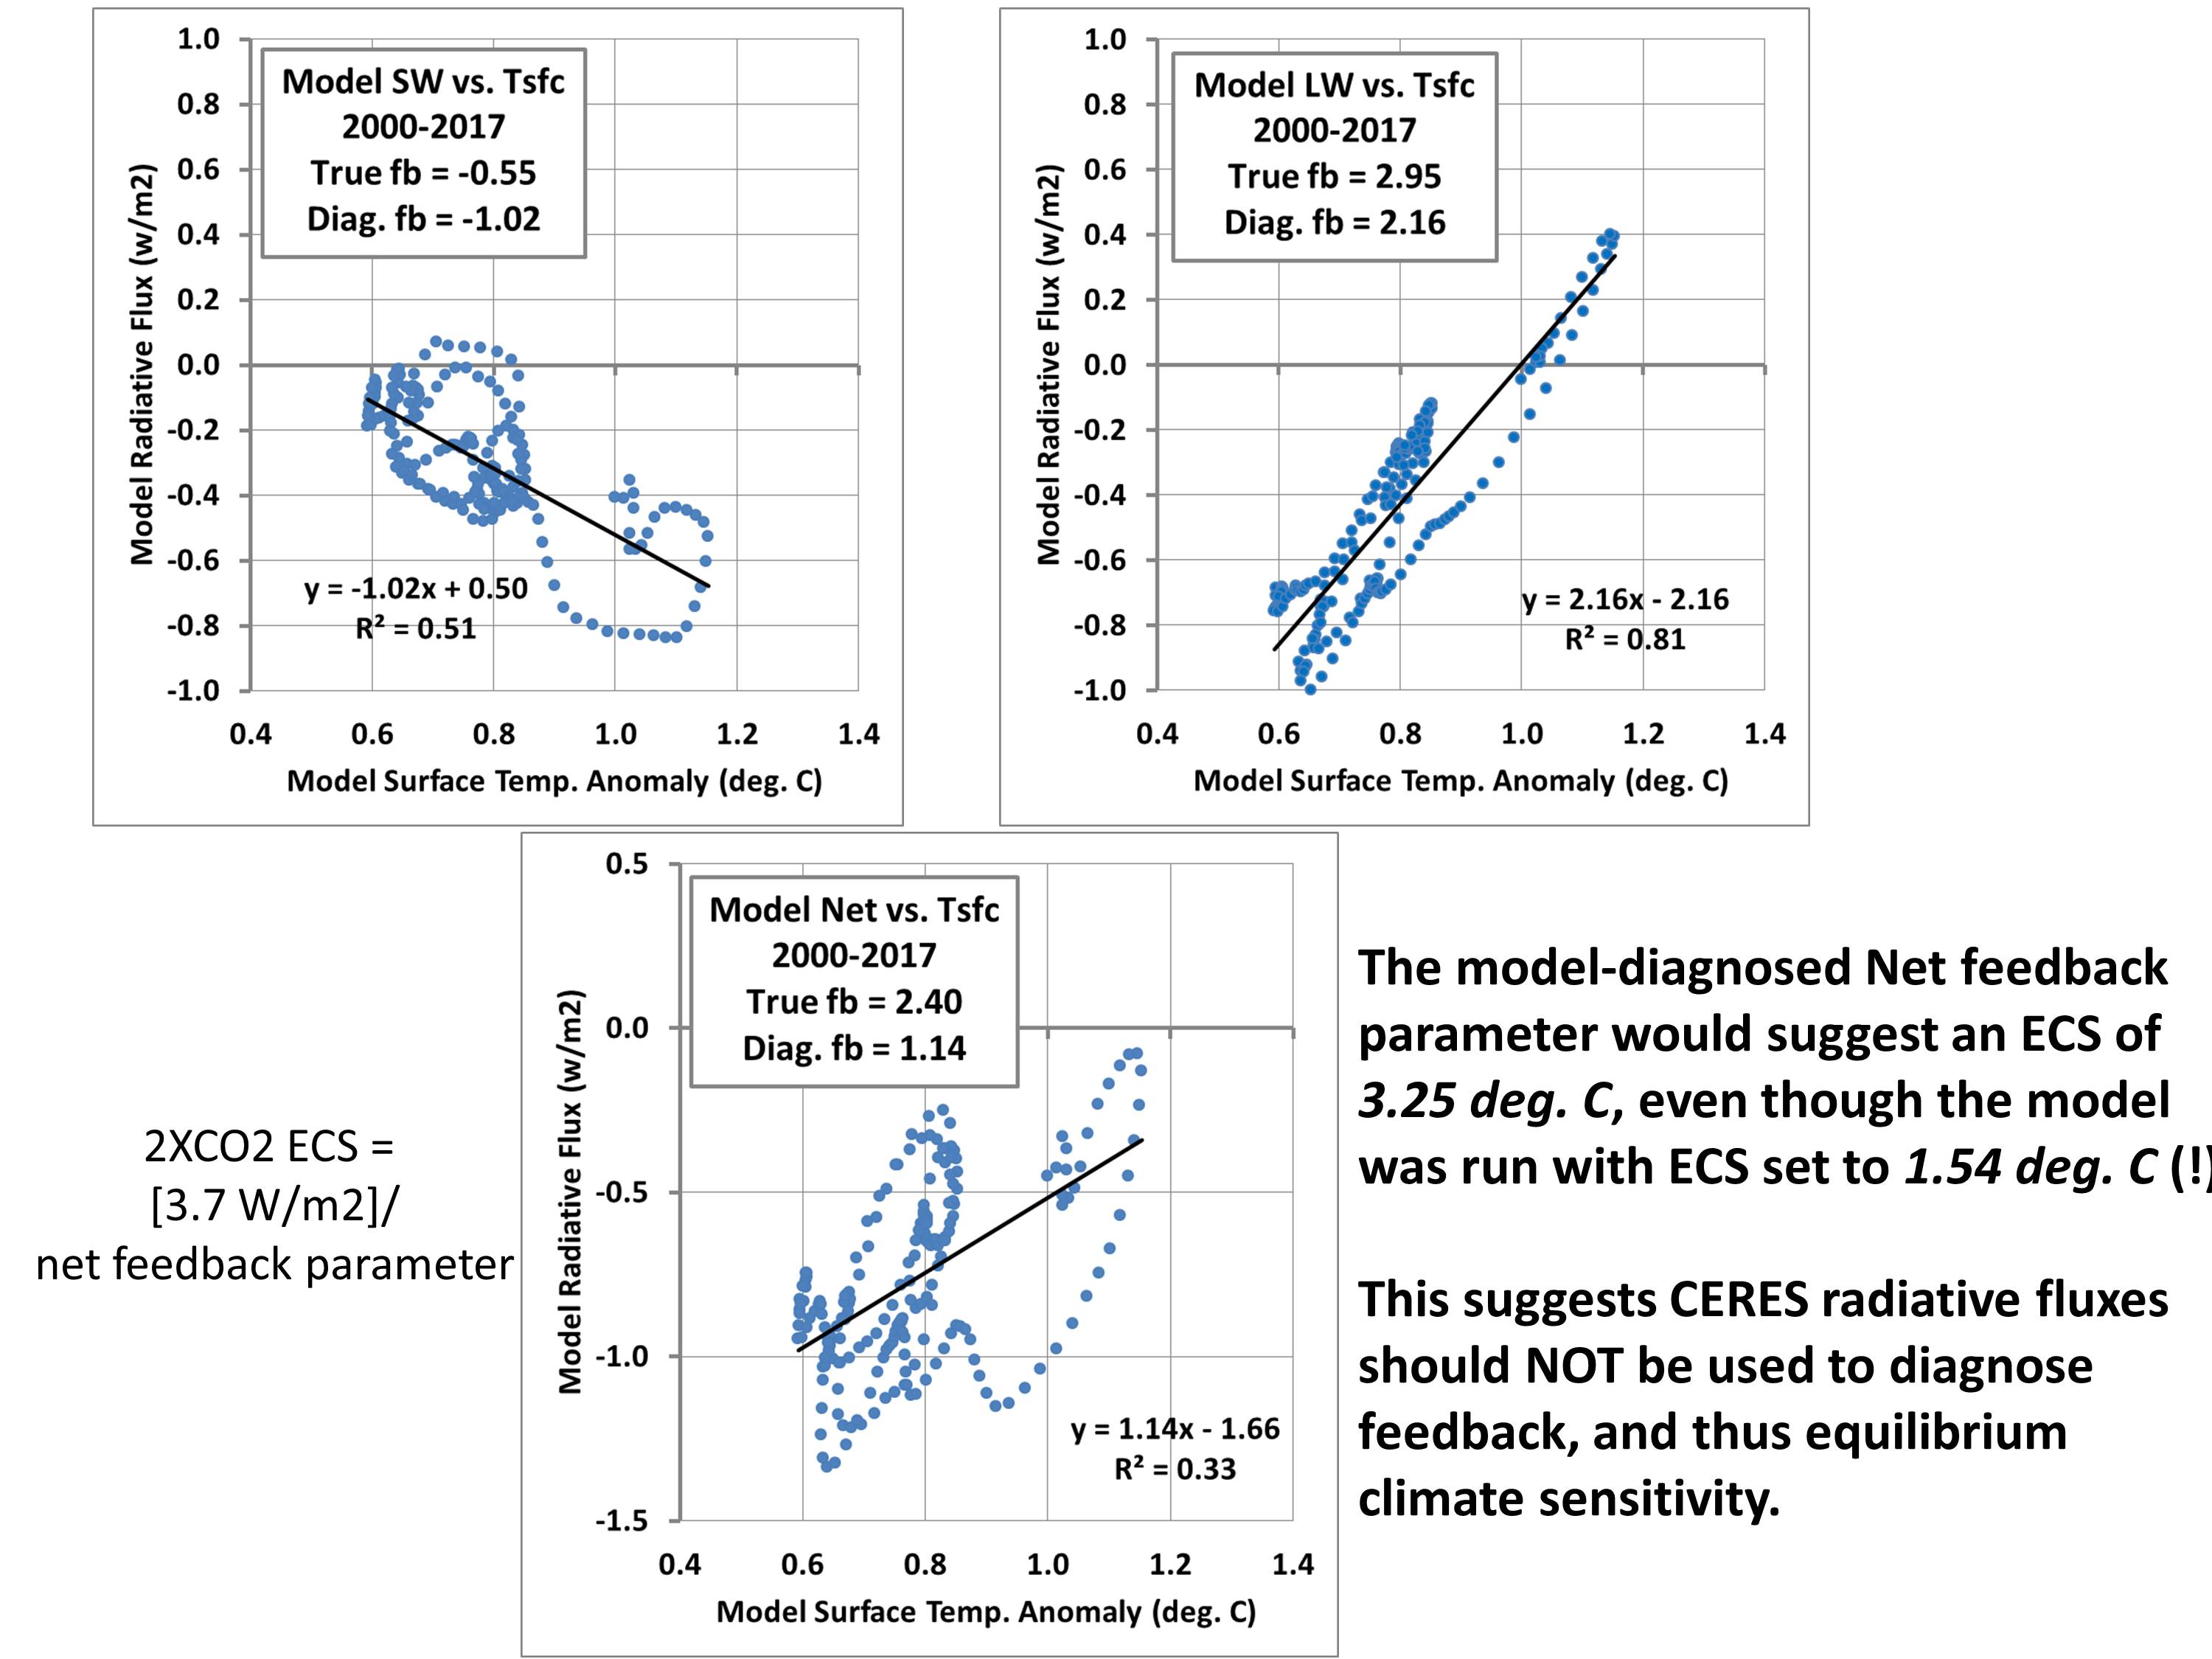
Fig. 3. Model diagnosed feedback parameters for the same period as the CERES satellite radiative flux record (March 200 through September 2017) shown in Fig. 1. Significantly, the model-diagnosed feedback parameters (regression slopes) are far from those specified in the model, leading to a gross overestimation of climate sensitivity if interpreted as feedback parameters.
The ECS thus (incorrectly) diagnosed from the model radiative fluxes is 3.25 deg. C, even though the feedbacks specified in the model have an ECS of 1.54 deg. C! This supports our contention that use of CERES radiative fluxes to estimate ECS will lead to overestimation of climate sensitivity (e.g. Spencer & Braswell, 2011). The cause of the problem is time-varying radiative forcing internal to the climate system contaminating the radiative feedback signal.
Note that there is less scatter in the model plots (Fig. 3) that in the observations (Fig. 1). This is mainly due to the observations in Fig. 1 having far more sources of internal radiative forcing than the one specified in the model (only ENSO-related). Contrary to what the IPCC seems to believe (and what Andy Dessler has argued to me before), there are all kinds of non-feedback radiative variations in the climate system, internally generated by chaotic variability not caused by temperature changes. Cloud (and thus SW radiative flux) variations are NOT simply a response to surface temperature changes; some of those temperature changes are due to cloud variations caused by any number of atmospheric circulation-related changes.
Put more simply, causation works in both directions between temperature and radiative flux; if causation is assumed in only one direction (temperature change => radiative flux change), then diagnosing feedback parameters from the data will lead to a bias toward high climate sensitivity.
Conclusions
The 1D model fit to the HadCRUT4 data is quite good, despite the simplicity of the model. The model climate sensitivity of only 1.54 deg. C is just within the IPCC’s likely ECS range of 1.5 to 4.5 deg. C, and well below the AR5 model average ECS of 3.4 deg. C.
I believe this is some of the strongest evidence yet that (1) the real climate system is relatively insensitive, and (2) feedbacks diagnosed from TOA radiative fluxes cannot be used to diagnose feedbacks, and thus climate sensitivity.
The above must be considered as a work in progress. Publication (if it is ever allowed by the IPCC gatekeepers) will require demonstration of the sensitivity of the model results to changes in the adjustable parameters. I do posts like this partly to help guide and organize my thinking on the problem.
It is also worth noting that one can do all kinds of experiments with such a simple model, such as exploring the effect of the inclusion or exclusion of various forcings on the model results. Some of this was done by Spencer and Braswell (2014) who found that inclusion of ENSO effects substantially reduced the model’s climate sensitivity.
References
Lewis, N., and C.A. Curry, 2015: The implications for climate sensitivity of AR5 forcing and heat uptake estimates. Climate Dynamics, 45 (3-4), 1009-1023.
Spencer, R. W., and W. D. Braswell, 2011: On the misdiagnosis of surface temperature feedbacks from variations in Earths radiant energy balance. Remote Sensing, 3, 1603-1613; doi:10.3390/rs3081603
Spencer, R.W., and W.D. Braswell, 2014: The role of ENSO in global ocean temperature changes during 1955-2011 simulated with a 1D climate mode. Asia-Pacific Journal of Atmospheric Sciences, 50(2), 229-237.

 Home/Blog