No, Our Ability to Monitor Sea Ice Has Not Ended
Yesterday, The Guardian ran a story with the headlines:
Donald Trump accused of obstructing satellite research into climate change
Republican-controlled Congress ordered destruction of vital sea-ice probe
But as NASA’s leader of the U.S. Science Team on one of the best satellite instruments developed for monitoring sea ice, I can tell you we will not lose our ability to monitor sea ice.
Admittedly, the premature failure of the Defense Department’s DMSP F17 and F19 satellites has definitely reduced the number of times a day we can measure the polar regions.
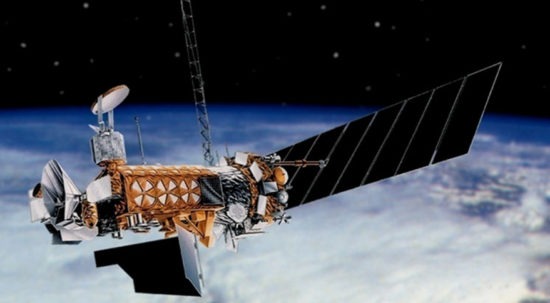
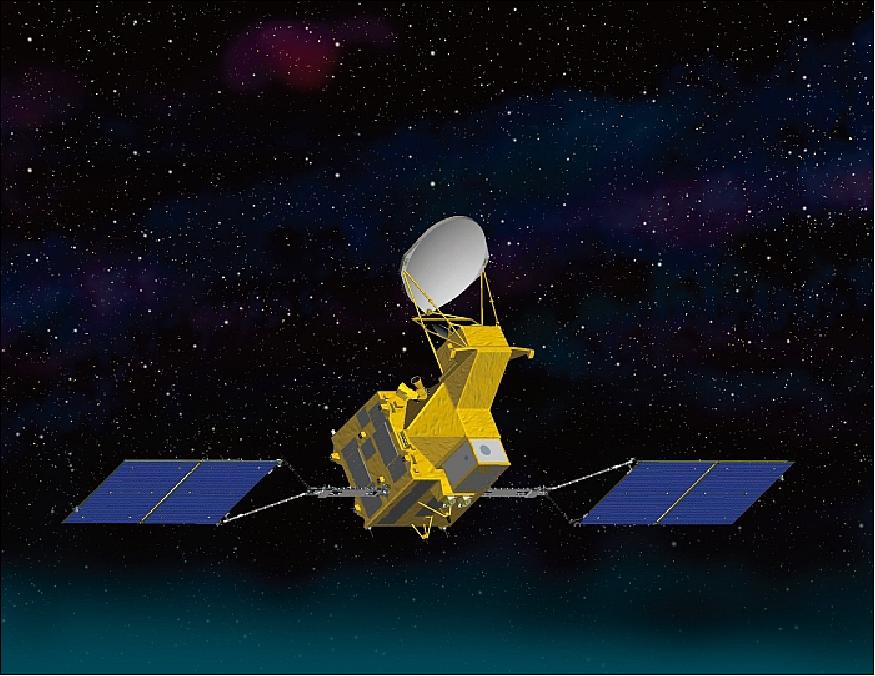
Artist rendering of the Defense Meteorological Satellite Program (DMSP) satellite, carrying the SSMIS instrument (upper-left) since July 1987. The unexpected failure of the F17 and F19 satellites has led to criticisms of the defunding of the final, F20 satellite in the series.
But even once a day is plenty for the purpose (sea ice doesn’t change that fast), and there are other — and better — satellites that can now do the job.
The Decision Was Made On Obama’s Watch
The first point The Guardian got wrong was that Congress’s fiscal decision to dismantle the last remaining DMSP F20 satellite was made by Congress in 2016, when Obama could have done something about it. These satellites do much more than monitor sea ice, and the decision was made knowing that we have more modern satellites that can do these jobs now. The specific sensor on that satellite that monitors sea ice, the SSMIS, is a modified microwave radiometer that was first launched in July, 1987, and was designed in the early 1980s. Because microwaves penetrate clouds, and since the polar regions are often cloudy, these window-frequency microwave radiometers have become the workhorses of sea ice monitoring.
The U.S. Long Ago Decided to Let Other Countries Take Over
I have worked with satellite microwave radiometers for 30 years now, doing NOAA and NASA sponsored research with them. The U.S. long ago made the decision to help Japan take the lead on this capability. As a result, the Japanese built the AMSR-E instrument with newer technology, more microwave channels, and higher spatial resolution to fly on NASA’s Aqua satellite in 2002. As the U.S. Science Team leader on that instrument, I and others helped Japan become a leader in producing and interpreting this kind of data.
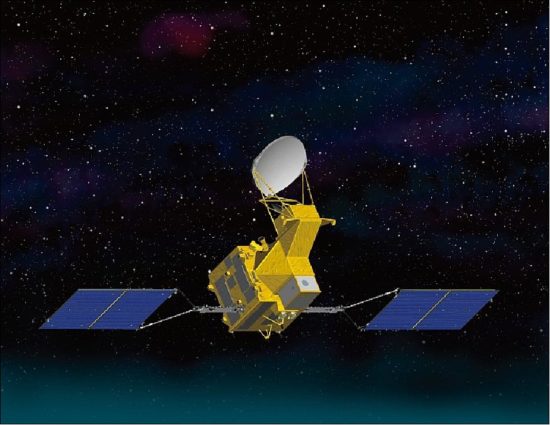
Artist rendering of the AMSR2 instrument on the Japanese GCOM-W satellite, the new generation of climate monitoring with window frequency microwave remote sensing.
After the failure of AMSR-E in 2011, Japan launched an even better version — AMSR2 — on their own GCOM-W satellite. They are currently designing a third one for launch. Everyone in the business knows that these are expected to be the sea ice monitoring workhorses of the future, providing a daily global climate monitoring capability for a wide variety of weather and climate variables.
Other U.S. Satellites Could Help Out as Well
Even without the newer and fancier AMSR series of sea ice monitoring instruments, and even with the complete failure of the old SSMIS series of satellite instruments (many of these last much longer than their design lifetime), in a pinch we could use the window channels of the AMSU sensors flying on the NOAA polar-orbiting satellites, and the newer ATMS instruments flying on the NOAA polar orbiting satellites. The next copy of the ATMS is scheduled to be launched this Friday, November 10 on the first JPSS satellite. These instruments are not ideal for the purpose, though, and the Japanese AMSR series of sensors are expected to be the main sea ice monitoring satellites into the future.
Trump Derangement Syndrome?
One could more justifiably ask why President Obama in his 8-year term could not have asked for a dedicated climate monitoring network of global satellites. Most people don’t realize that our long-term climate monitoring with satellites has always been piggy-backed on either NOAA weather satellites, which are not designed with the stability and lifetimes needed to monitor subtle trends in climate, or on NASA one-off science experiment satellites which provide just enough data to help address specific science questions.
This is why it feels more than a little disingenuous to blame President Trump for the dismantling of a single satellite as if is going to cripple our ability to monitor climate change from space. Quoting from the Guardian article:
President Trump has been accused of deliberately obstructing research on global warming after it emerged that a critically important technique for investigating sea-ice cover at the poles faces being blocked….
This is like throwing away the medical records of a sick patient, said David Gallaher of the National Snow and Ice Data Center in Boulder, Colorado. Our world is ailing and we have apparently decided to undermine, quite deliberately, the effectiveness of the records on which its recovery might be based. It is criminal.
This claim that the Trump Administration is to blame, or that our capability is being blocked or crippled is, quite frankly, silly.

 Home/Blog


