Oroville Emergency Spillway: Does this Look Like Bedrock to You?

February 13th, 2017

I’ve had a little criticism here and on Facebook that I’m not a geologist, so I shouldn’t be second-guessing the Oroville Dam engineers. They called for evacuations last evening out of an abundance of caution. That the emergency spillway is no doubt built on bedrock, and so it is safe.

Well, if it was only out of an abundance of caution that evacuations were ordered, why did emergency officials claim that there might be only one hour until the concrete weir topping the emergency spillway would fail? Hmmm?

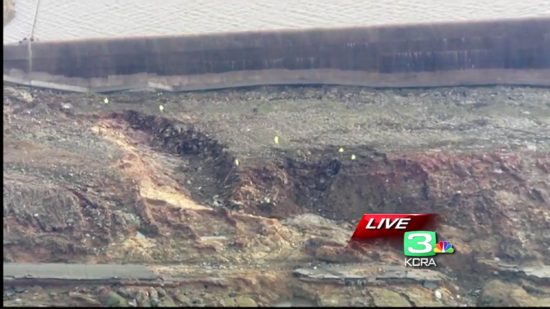
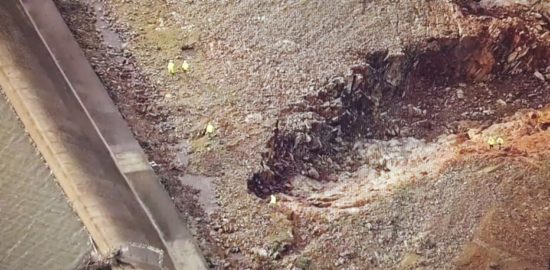
And take a look at one of the ravines that eroded from only a little over 24 hours of flow over the emergency spillway

One of two major eroded areas just below the emergency spillway of Oroville Dam (Feb. 13, 2017). The little yellow spots are people.

Does that erosion feature look like it’s cutting into bedrock? Even though the spillway is supposed to handle 250-350,000 CFS, it was only ~10,000 CFS total flow across the 1,700 ft. long weir that caused this.

The latest press conference held shortly after noon today suggested that officials are avoiding hard questions. At one point a reporter asked, “With two parts of the system compromised (the main spillway and emergency spillway), how secure can people be?“. The speaker was not allowed to answer the question.

I honestly don’t know what’s going on, but if I lived in the flood plain (and now one of the near-200,000 people evacuated), I’d be wanting some more definitive information.

Oroville Dam Emergency Spillway Repairs Starting

February 13th, 2017

With daylight and Oroville Lake water levels now 4 feet below the lip of the emergency spillway, we can see that the area of concern is a gouge which developed near the far end of the concrete weir, and was eroding uphill toward that structure; for scale, those yellow spots are people inspecting the gouge (click images for full-size):

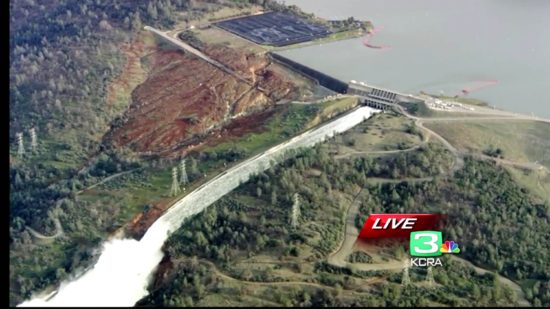
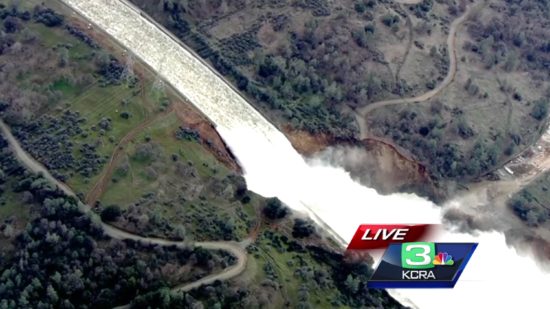
A wide-angle view (KCRA-TV helicopter frame grabs) shows the main, heavily damaged spillway which still has a huge 100,000 CFS flow continuing in an attempt to reduce the lake level as much as possible:

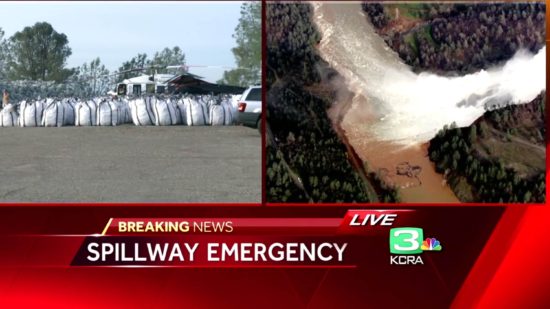
Rocks have been bagged overnight and helicopters will soon start filling the gouge:

The 100,000 CFS flow through the main spillway continues to erode the break in the concrete flume, but engineers are not worried about the damage eroding uphill and damaging the main portion of the dam:

Oroville Dam Emergency Spillway Expected to Fail within the Hour

February 12th, 2017

So, it turns out all of that bedrock that made the Oroville Dam design so fail-safe is not going to stand in the way of Mother Nature.

Mandatory evacuations have been ordered, and the emergency spillway is expected to fail within the hour.

Flash flood warnings have been issued. This will affect Oroville all the way to Sacramento I assume.

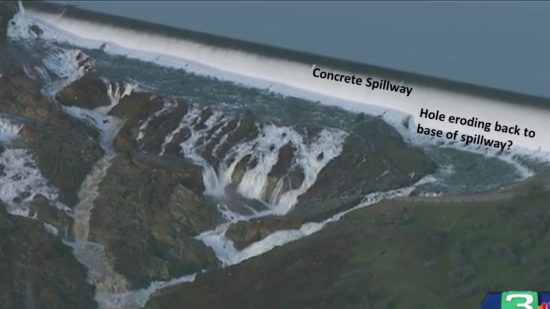
UPDATE: Evening briefing announcement that a hole has developed slightly downhill of the base of the 1,700 ft-long concrete portion of the emergency spillway. Here’s a screenshot from this evening from the KCRA-TV helicopter with my annotation of my *guess* of where the problem might be (they were NOT specific in the press conference). They said if the hole migrates uphill much farther and undercuts the spillway, the concrete portion could fail, which is why the evacuations were announced. (Another view I’m hearing is the problem is at the left end of the spillway, not at the right end.)

Frame grab from KCRA-TV helicopter video showing water over flowing the emergency spillway at Oroville Dam, evening of Feb. 12, 2017.

The flow out the main spillway has been increased to 100,000 CFS, which should stop the flow over the emergency spillway tonight. But even if the concrete does not fail tonight, I suspect the problem won’t go away as new rain systems are forecast in the coming week, and snow melt season hasn’t even started yet.

UPDATE:

Updates at: https://twitter.com/Oroville_Dam

Live helicopter video from KCRA-TV

Why the Oroville Dam Won’t Fail

February 12th, 2017

While it is said, “never say never”, after researching this issue I’m pretty convinced that it would be nearly impossible for the Oroville Dam to fail.

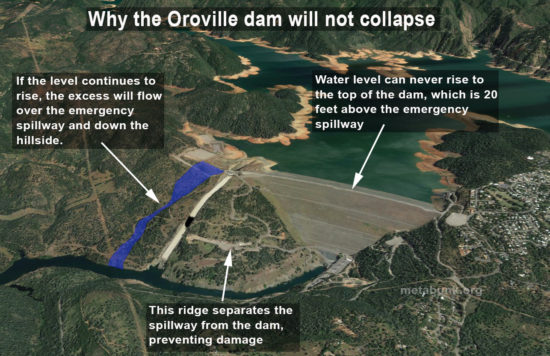
Even though it is an earthfill embankment dam, which can be destroyed if the dam is topped, the following Metabunk graphic demonstrates why the Oroville design is virtually foolproof:

The emergency spillway (which is now in use) drains excess water along its 1,700 ft length when the lake level exceeds 901 ft. At this writing the lake level is 902.5 ft, which is 1.5 ft. above the lip of the spillway.

The water level would have to rise another 18.5 feet (!) in order to reach the top of the dam itself, which would never happen because the emergency spillway flow (which occurs over a natural ridge made of bedrock) would handle the excess flow long before the lake level ever reached that point.

Now, is there any scenario in which this might happen? I’m not a hydrologist, so I can’t answer that. But if there was a sudden warm spell in the next few weeks with say, 10-20 inches of rain over the watershed melting most of the mountain snowpack, adding tremendously to the inflow into the lake, I’m sure we would see a much greater flow over the emergency spillway. But I suspect it would never reach the top of the dam itself. Nevertheless, there would be a massive flooding event downstream in the Feather and Sacramento Rivers.

Is Failure of the Oroville Dam Possible?

February 11th, 2017

The last couple of days have not made me very confident in the predictions of engineers associated with the Oroville Dam.

While I am a climate researcher, and not hydrologist, it took me less than an hour midday yesterday (see comments here) to estimate that the emergency spillway would be breached around 9 a.m. PST this morning. I was off by an hour…it was breached at 8 a.m.

But engineers were leaning toward the lake level never getting that high (901 ft.)

This kind of calculation isn’t rocket science. As long as inflow into the lake exceeds outflow (both of which are monitored hourly), the lake level will rise.

Why were engineers reluctant to predict the (admittedly historic) event?

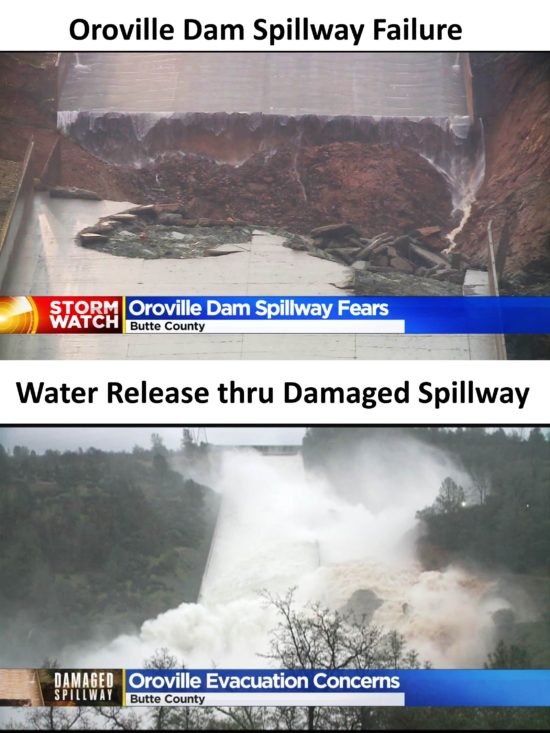
Now let’s talk about something that is much more uncertain…the damage now occurring as water continues to erode the dam under the gaping hole which has split the main concrete spillway:

One dam engineer who has worked on similar dams is worried that this is a structural threat to the dam.

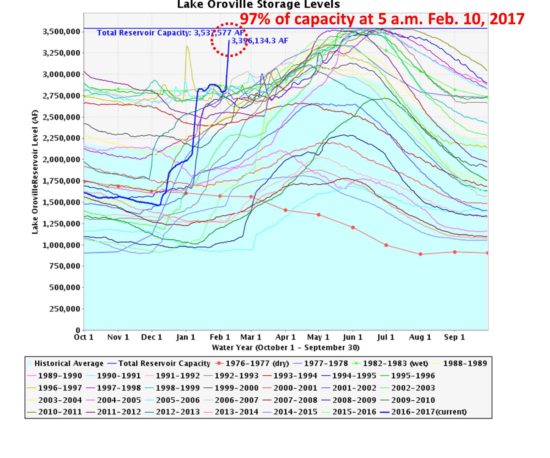
Furthermore we haven’t even entered snow melt season yet, and already Lake Oroville has exceeded its 100% capacity (here’s yesterday’s plot, at 97%):

Lake Oroville water levels in different years, showing the current level is unprecedented for so this date, and rapidly approaching a 100% full state.

So, I am merely raising the question: if engineers were reluctant to predict the current topping of the emergency spillway — a relatively benign event that was rather easily predicted — how much confidence can we have that the damage to the main spillway won’t compromise the dam?

I think engineers are going to have to be a little more forthcoming about whether such a failure — which threatens thousands of people immediately downstream — is indeed possible in the coming weeks and months as the massive mountain snowpack melts and continues to fill the lake — and continues to erode the spillways.

Lake Oroville 100% Full; Emergency Spillway Use Hours Away?

February 11th, 2017

UPDATE: As of 9 a.m. PST, the water level has increased to 901.24 ft., and water is overflowing the 1,700 ft. long emergency spillway.

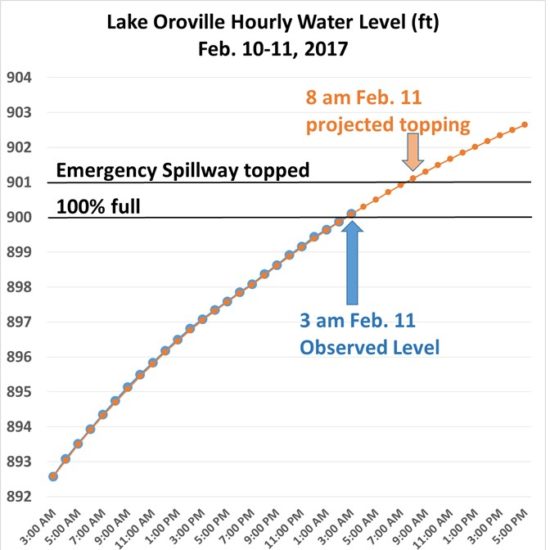
For the first time in the 50 year history of Oroville Dam, Lake Oroville has exceeded its design limit as of 3 a.m. PST this morning, reaching 900.1 ft. elevation.

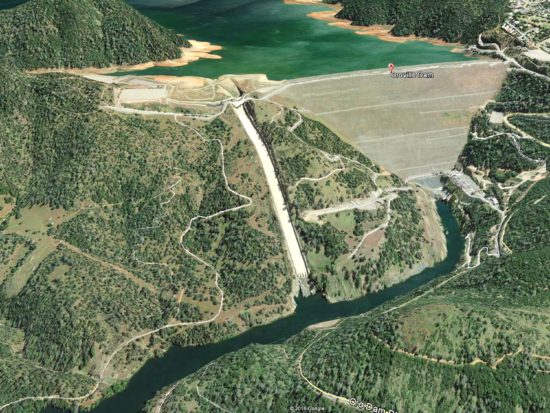
The inflow rate into the reservoir continues to exceed the outflow rate, increasing the probability of the first-ever use of the emergency spillway. This would cause massive erosion of the hillside, which in this Google Earth image is to the left of the narrow concrete spillway (2015 imagery, reservoir 50% full):

I have made an estimate of when the emergency spillway might be breached based upon rates of inflow and outflow; the following chart suggests around 8 a.m. this morning:

Observed (blue) and model-estimated (orange) Lake Oroville water levels.

These (unofficial) model-projected levels in the above chart assume measured inflow into the reservoir continues its steady decrease, and the outflow remains the same as it has been since 8 p.m. last night, when engineers reduced the flow through the damaged concrete spillway to avoid damage to power line towers:

Even if flow through the concrete spillway is increased to full-flow, the topping of the emergency spillway would only be delayed by an hour or so (9 a.m.). Lake levels would not keep increasing afterward, as suggested in the above chart… the model estimates are just meant to suggest we are likely headed to a breach of the emergency spillway, which will then provide an additional outflow channel for the lake.

I have no idea whether engineers have any “tricks up their sleeve” to avoid the emergency water release. The electricity generating turbines have been shut down due to debris in the water. I suspect we will be seeing some rather dramatic (and very muddy) video later today.

(Oroville Mercury Register live news updates.)

(Follow the hourly updates of water flow and lake level.)

Lake Oroville Near 100% Full, Emergency Overflow Imminent

February 10th, 2017

With a winter of phenomenal heavy rains and snow (over 400 inches so far at some Sierra Nevada locations), Lake Oroville 65 miles north of Sacramento is literally entering uncharted territory in its 50 year history.

As the following chart shows, the reservoir is rapidly approaching its design capacity:

Lake Oroville water levels in different years, showing the current level is unprecedented for so early in the year, and rapidly approaching a 100% full state.

While the reservoir has been nearly full in some previous years, note that this occurred in early summer, after mountain snowmelt. We have not even reached snowmelt season yet, suggesting a continuing flooding problem in the coming months.

A few days ago engineers reassured us there was still 20% of the reservoir unfilled. Then yesterday morning it was 90% full. This morning at 5 a.m. it was 97% full, and at the rate it is filling, tonight or tomorrow it will likely overflow the emergency spillway for the first time ever. Here’s a Google Earth image of the dam in April 2015 (when the reservoir was only 50% full); the wooded area to the left of the narrow concrete spillway is where the water will likely overflow this weekend:

To make matters worse, the concrete spillway has been badly damaged due to partial failure, which will likely get only worse as it is used to avoid the emergency spillway for as long as possible:

If water overflows down the emergency spillway, there will be a mess created in the Feather River due to soil, rock, and tree debris, threatening young salmon. The Feather River then flows into the Sacramento River farther downstream. Emergency officials are beginning to discuss evacuation preparations downstream.

UAH Global Temperature Update for January, 2017: +0.30 deg. C

February 1st, 2017

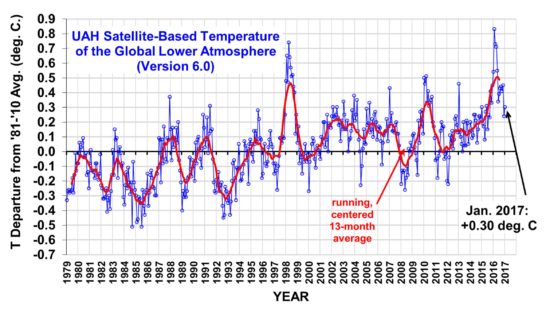
The Version 6.0 global average lower tropospheric temperature (LT) anomaly for January 2017 was +0.30 deg. C, up a little from the December value of +0.24 deg. C (click for full size version):

The global, hemispheric, and tropical LT anomalies from the 30-year (1981-2010) average for the last 25 months are:

YEAR MO GLOBE NHEM. SHEM. TROPICS
2015 01 +0.30 +0.44 +0.15 +0.13
2015 02 +0.19 +0.34 +0.04 -0.07
2015 03 +0.18 +0.28 +0.07 +0.04
2015 04 +0.09 +0.19 -0.01 +0.08
2015 05 +0.27 +0.34 +0.20 +0.27
2015 06 +0.31 +0.38 +0.25 +0.46
2015 07 +0.16 +0.29 +0.03 +0.48
2015 08 +0.25 +0.20 +0.30 +0.53
2015 09 +0.23 +0.30 +0.16 +0.55
2015 10 +0.41 +0.63 +0.20 +0.53
2015 11 +0.33 +0.44 +0.22 +0.52
2015 12 +0.45 +0.53 +0.37 +0.61
2016 01 +0.54 +0.69 +0.39 +0.84
2016 02 +0.83 +1.16 +0.50 +0.99
2016 03 +0.73 +0.94 +0.52 +1.09
2016 04 +0.71 +0.85 +0.58 +0.93
2016 05 +0.54 +0.65 +0.44 +0.71
2016 06 +0.34 +0.51 +0.17 +0.37
2016 07 +0.39 +0.48 +0.30 +0.48
2016 08 +0.43 +0.55 +0.32 +0.49
2016 09 +0.44 +0.49 +0.39 +0.37
2016 10 +0.41 +0.42 +0.39 +0.46
2016 11 +0.45 +0.40 +0.50 +0.37
2016 12 +0.24 +0.19 +0.30 +0.21
2017 01 +0.30 +0.27 +0.33 +0.07

The UAH LT global anomaly image for January, 2017 should be available in the next several days here.

The new Version 6 files should be updated soon, and are located here:

Lower Troposphere: http://vortex.nsstc.uah.edu/data/msu/v6.0/tlt/uahncdc_lt_6.0.txt
Mid-Troposphere: http://vortex.nsstc.uah.edu/data/msu/v6.0/tmt/uahncdc_mt_6.0.txt
Tropopause: http://vortex.nsstc.uah.edu/data/msu/v6.0/ttp/uahncdc_tp_6.0.txt
Lower Stratosphere: http://vortex.nsstc.uah.edu/data/msu/v6.0/tls/uahncdc_ls_6.0.txt

The Trump Climate Dump: Why It Doesn’t Matter if Even 100% of Scientists Agree on Global Warming

January 20th, 2017

Given current technologies, it makes no sense to destroy $100 Trillion in wealth this century for an unmeasurable reduction in warming.

Bjorn Lomborg.

Everything humans do requires energy. Everything.

The more efficiently we can do those things, the greater humanity prospers. Affordable energy is part of that efficiency.

But when human prosperity suffers, people die.

So, can it really be called “anti-science” that the moment Trump was inaugurated, the White House deleted all references to climate change on their web pages?

No, I don’t consider it anti-science. Because science has nothing to say about what it would cost in terms of human suffering to avert climate change. What to do about climate change is a matter of engineering and economics… not science.

As a lukewarmist I believe (but can’t prove) that humans are probably responsible for some of the recent warming (which has been mostly benign).

I further believe (but can’t prove) that humans will cause somewhat more warming in the future…. I’d put my best guess at maybe another 1 deg. C this century, based upon our (and others) research into climate sensitivity.

But until some new energy technology comes along (probably from the private sector) we are stuck with fossil fuels for the foreseeable future. The oil industry’s use of fracking has already reduced carbon dioxide emissions — through a switch from coal to natural gas — by more than any government command-and-control efforts.

As Bjorn Lomborg has recently estimated, efforts to “fight” global warming under the U.N.’s Paris Agreement could cost the world $100 Trillion in lost wealth by the end of this century.

That, I guarantee you, will lead to (preventable) deaths, due to poverty and all problems stemming from poverty.

And for what gain? An unmeasurable decrease in further warming of maybe 0.1 deg. C at best (and that’s assuming climate sensitivity is high and that we are in for several deg. C of future warming — which I don’t). As someone who knows how temperatures trends are measured on the ground (I’ll bet none of the thermometer climate data “experts” passed NWS weather observer certification exams like I did) and by satellite (I’m the co-inventor), I can say that this level of future temperature reduction is unmeasurable by any system we have.

So, while the White House deletion of “climate change” references from their website might be met with accusations that the new administration is anti-science, what I suspect it really means is that President Trump does not want to waste time and destroy prosperity just for those who want to feel good about their efforts to Save The World™.

Because the price for them feeling good might well mean the premature deaths of millions.

And that’s the way I would argue this issue. Poverty kills millions. As far as we know, human carbon dioxide emissions have killed no one. In fact, it has saved millions of lives and increased prosperity. For example, I’ve blogged before on the fact that more CO2 has increased corn crop productivity more than rising temperatures have hurt it, and that climate models have badly botched forecast warming post-1960 in the U.S. Corn Belt.

Eventually, we will probably run out of fossil fuels. We will probably have replacements before that ever happens, anyway. Those replacements will arise through market forces, not governmental fiat.

I don’t really care where our energy comes from. As long as those sources benefit humanity.
Trump’s NOAA Administrator Must Address the Temperature Record Controversy

January 18th, 2017

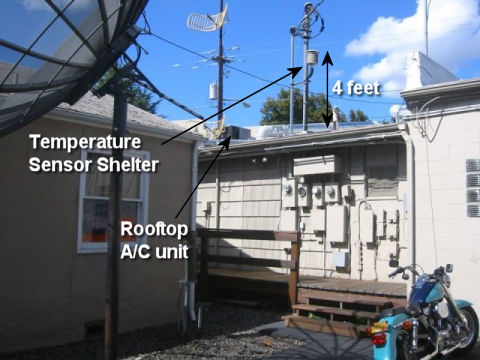
Roseburg, Oregon official USHCN temperature monitoring site shows examples of spurious heat influences that accumulate over the years, spuriously exaggerating the “global warming” signal.

An article appeared in the Washington Post yesterday entitled, “Who Will Lead NOAA Under President Trump?“. Written by the Capitol Weather Gang’s Jason Samenow, it lists three top contenders:

Scott Rayder, senior adviser for development and partnerships at the University Corporation for Atmospheric Research
Barry Myers, chief executive of AccuWeather in State College, Pa.
Jonathan White, president and chief executive of the Consortium for Ocean Leadership

The article addresses important issues facing NOAA in the coming years, such as making our weather forecasting capability the best in the world while still respecting the role of the private sector in adding value to the data collection and modelling role the government has taken leadership in.

Yet, something is missing….

You see, the names mentioned are part of the existing establishment, and we all know that President Trump is interested in “draining the swamp”.

They might be perfectly fine candidates — if Hillary Clinton had won the election.

What is missing is NOAA’s controversial role in promoting the U.N. plan to use global climate change as a way for the U.N. to oversee the redistribution of the world’s wealth and deindustrialize the West. (Note that’s not my claim…it’s their claim). It is well known that most of the countries that signed on to the Paris Agreement did so because they hope to gain from those transfers of wealth.

And we also know the result of CO2 emissions reduction will be a huge amount of pain (up to $100 Trillion loss of wealth this century) for no measurable impact on global temperatures, even using the U.N.’s over-inflated warming predictions.

NOAA has been actively “adjusting” the thermometer record of global temperatures over the years by making the present warmer, and the past colder, leading to an ever increasing upward temperature trend. This supports the global warming narrative the current administration, and the U.N., favors.

In my opinion, NOAA needs leadership that will reexamine these procedures. It took a TV meteorologist, Anthony Watts, to spearhead a site inspection of nearly all of the temperature monitoring locations in the U.S., even forcing NOAA to admit that many of their temperature monitoring stations were simply of no use for monitoring climate trends, when parking lots and air conditioning exhaust fans gradually encroached on these sites, causing spurious warming. Watts’ research has suggested that, after removing the contaminated stations, a substantial fraction of the reported warming in the U.S. simply disappears.

Why did it take an outsider — with no funding — to do what NOAA should have done to begin with?

Yes, providing data and analysis addressing the global warming issue is only one part of NOAA’s responsibility (which includes ocean research as well).

But it is by far the most important part of NOAA’s mission when it comes to the future health of the U.S. economy.

The new NOAA Administrator needs to address this issue head on, and not whitewash it. I seriously doubt any of the three candidates listed above will do that.