UAH Global Temperature Update for Jan. 2015: +0.35 deg. C

February 3rd, 2015

The Version 5.6 global average lower tropospheric temperature (LT) anomaly for January, 2015 is +0.35 deg. C, little changed from the December 2014 value of +0.32 deg. C (click for full size version):
UAH_LT_1979_thru_January_2015_v5

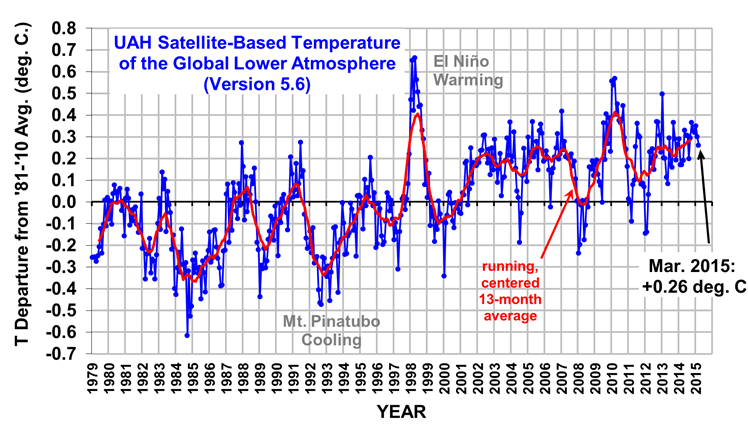
The global, hemispheric, and tropical LT anomalies from the 30-year (1981-2010) average for the last 13 months are:

YR MON GLOBAL NH SH TROPICS
2014 01 +0.291 +0.387 +0.194 -0.029
2014 02 +0.170 +0.320 +0.020 -0.103
2014 03 +0.170 +0.338 +0.002 -0.001
2014 04 +0.190 +0.358 +0.022 +0.092
2014 05 +0.326 +0.325 +0.328 +0.175
2014 06 +0.305 +0.315 +0.295 +0.510
2014 07 +0.304 +0.289 +0.319 +0.451
2014 08 +0.199 +0.244 +0.153 +0.061
2014 09 +0.294 +0.187 +0.401 +0.181
2014 10 +0.365 +0.333 +0.396 +0.189
2014 11 +0.329 +0.354 +0.303 +0.247
2014 12 +0.322 +0.465 +0.178 +0.296
2015 01 +0.351 +0.551 +0.152 +0.126

The global image for January, 2015 should be available in the next day or so here.

Popular monthly data files (these might take a few days to update):

uahncdc_lt_5.6.txt (Lower Troposphere)
uahncdc_mt_5.6.txt (Mid-Troposphere)
uahncdc_ls_5.6.txt (Lower Stratosphere)

Pinapple Express to Bring 2 ft. Rain, 10 ft. Snow to N. Cal.

February 2nd, 2015

In the next week a series of vigorous Pacific storms fueled partly by the current weak El Nino conditions will bring phenomenal amounts of rain and snow to Northern California: over 2 feet of rain and up to 10 feet of snow in the higher elevations.

After a record dry month in San Francisco, the precipitation is much needed in order to recharge the state’s reservoirs, most of which are still well below their seasonal normal levels.

Here’s the Hawaii-to-California “atmospheric river” that is forecast to set up in the next week, typical of El Nino conditions (forecast graphics courtesy of Weatherbell.com, click to enlarge):

GFS-7-day-precip-fcst-feb02-09-2015-W-Coast

As can be seen, even the Bay area can expect 5+ inches of rain. The snowfall portion of the precipitation will be in the Sierra Nevada, with up to 10 feet of new snow forecast:

GFS-7-day-snow-fcst-feb02-09-2015-NoCal

Most of the heavy precipitation, except for extreme N. California, won’t begin until Thursday of this week.

The “Historic” Blizzard of 2015 Ranked #41

February 1st, 2015

The numbers are in at the National Climate Data Center, and out of the top 55 snowstorms impacting the major population centers of the Northeast U.S., the January 2015 blizzard that blasted Boston ranked #41, or a weak “Category 2”.

Here’s the storm total snowfall map:

NESIS-20150125-20150128-2.62

By comparison, here’s the snowfall total map for the #1 storm, which occurred in mid-March 1993, a Cat 5 storm….note the map is zoomed out to encompass the amazingly large geographic extent of the heavy snowfall in that storm:

NESIS-19930312-19930314-13.20

The ranking is based upon societal impacts, so if the worst storm on Earth in the last 10,000 years hit where no one lived, it would not even rank.

So, the NESIS scale for Northeast snowstorms isn’t well suited for talking about climate change. It’s not clear that more snowstorms in recent decades aren’t just from a slight shift in the storm track bringing Northwest Atlantic winter storms (of which there are many…Greenland routinely gets clobbered) closer to New England.

Super Snow Sunday Chicago

January 31st, 2015

A vigorous low pressure tracking eastward from Colorado will intensify and bring up to a foot of new snow and near-blizzard conditions to Chicago by tomorrow afternoon.

Similar conditions will occur across central Iowa, northern Illinois, Indiana, Ohio, southern Lower Michigan and Detroit, and then spread eastward with 6-12 inches of snow for New York City through Boston by Tuesday morning (all graphics courtesy of Weatherbell.com, click for full size):

Total snow accumulation by Tuesday morning, Feb. 3, 2015, forecast by the GFS model.

Total snow accumulation by Tuesday morning, Feb. 3, 2015, forecast by the GFS model.

The low pressure and precipitation areas forecast for Super Bowl game time suggest that being parked in front of the TV will be a safer activity than being out driving in a car:

gfs_ptype_slp_east2_8

Northeast Snowstorms & Atlantic Water Vapor: No Connection in Last 27 Years

January 30th, 2015

One of the theories of how snowstorms can be made worse is that warming oceans provide more moisture for fuel.

While the theory sounds logical and even attractive, there are many ingredients that go into snowstorm formation. There has to be a synoptic scale disturbance feeding off the temperature contrast between the land and ocean, and since the land-ocean temperature contrast has actually DECREASED in the last several decades (if you believe the thermometer data), this would reduce the energy available for storm formation. (The “more-wavy” jet stream theory is highly suspect…without a greater temperature contrast, there is not as much thermal energy available for “baroclinic instability”).

Nevertheless, there do seem to have been more snowstorms in the Northeast U.S. in the last decade, so what might be the cause? As a meteorologist, my first inclination is to blame, in effect, “chaos”. Weather and climate variations are chaotic, there ARE weather patterns that can get set up and then persist. But these regional influences are basically disconnected from whether the global average temperature happens to be 1 deg. warmer or cooler. They are instead being driven by temperature contrasts of many tens of degrees.

But we can examine with observational data Kevin Trenberth’s hypothesis that increased Northeast snowstorms are the result of more water vapor from the North Atlantic.

For the last 27 years we have had the SSM/I and SSMIS instruments monitoring total water vapor content over the oceans every day. I took the Northwest Atlantic area from 30N to 50N, and 50W to 80W and examined the monthly average water vapor over this area versus the NESIS (Northeast Snowfall Impact Scale) index.

The results suggest basically no relationship between available water vapor and snowstorm events over the last 27 years:

There is little if any  relationship between Northeast U.S. snowstorms and atmospheric water vapor over the Northwest Atlantic between 1988-2014.

There is little if any relationship between Northeast U.S. snowstorms and atmospheric water vapor over the Northwest Atlantic between 1988-2014.

In fact, while warm season water vapor has increased, cold season water vapor (if anything) has decreased on average over the region, making less vapor available for storms. The net trend through all seasons is about +0.5% per decade over the 27 year period.

There is always abundant water vapor available for U.S. snowstorms to feed off of, just as there is always abundant tropical water vapor available for hurricanes and typhoons. But that’s not the limiting factor in storm formation. What is necessary is the variety of conditions which can support the formation of low pressure centers….sufficient water vapor is usually ready and waiting to play its part.

It has more to do with the necessary temperature contrast between air masses (and in the case of tropical cyclones, vertical wind shear). And since global warming (no matter the cause) will lead to the continents warming faster than the ocean (reducing the energy for incipient storms), there is no convincing way to blame global warming for increasing snowstorm activity in the Northeast U.S.

“Peak Food”? No, the Average Person Has More Food to Eat

January 29th, 2015

There’s an article in yesterday’s Independent entitled, Have we reached ‘peak food’? Shortages loom as global production rates slow.

From reading the article, which is based upon a new report from two American universities and a German environmental institute, you would think that global food production is going down, while global population continues to rise.

WRONG. The rate of raise in production has apparently slowed for some commodities.

Now, imagine if peak oil was defined in this way? (It’s not). Or “peak global temperature”?

As far as I can tell, this is one more example of environmental fear-mongering.

First of all, food production is not limited by available land…it depends upon demand. If demand rises, so does food production. Hunger, malnourishment, and starvation are not due to a lack of food. They are almost always due to governmental policies which hinder farming or hinder the prosperity needed to import food.

What really matters is per capita food production. Not whether the rate of growth in just food production is slowing, because the rate in growth of the global population is also slowing:

worldgr

The real question is: As global population rises, is our food production keeping pace?

Not only is it keeping pace, it is speeding up.

You really don’t need to keep track of certain meats as the study did (such as chickens, eggs), just the staple grains which start the food supply. For example, the doubling of global soybean production in the last 20 years is primarily due to increased consumption of pork in an increasingly prosperous China, which requires soybeans for feed.

Here’s a plot I put together from U.N. statistics regarding the top staple foods the world consumes. As you can see, not only has global food production increased in recent years (as has global population), the ratio of the two shows the average person in the world has more food available to eat, not less:

global-food-production-by-year-top-6

So, how do studies like this ever get published? Lies, damn lies, and statistics.

But…but…isn’t global warming reducing crop production?

So far, there is no sign of that. As I’ve shown before, climate model predictions have essentially failed. Warming and precipitation changes in America’s heartland have failed to materialize…despite predictions to the contrary. The Earth as a whole has instead responded to increasing CO2 in the atmosphere with “global greening”.

But, without the threat of climate change and reduced food supply, universities and environmental institutes wouldn’t be able to get the money they need to survive, would they?

New York City Gets a Taste of the Precautionary Principle

January 28th, 2015

The New England blizzard that hit yesterday infamously missed its primary target: New York City. In fairness to the forecasters, there were as many weather model forecasts supporting an historic NYC storm as there were just a significant snowstorm.

For areas well east of NYC, this snowstorm storm (dubbed “Juno” by The Weather Channel) was remarkably similar to Snowstorm Nemo (remember him?) that hit approximately the same area during Feb. 8-9, 2013, with peak accumulations of about 3 feet and peak winds over 70 mph.

But the NYC mayor overreacting to the storm with subway closures and orders to stay off the streets and sidewalks is, ultimately, counterproductive.

Overwarning Leads to Complacency
Whether it’s weather warning, or warning of what global warming will do to us, it creates a “crying wolf” situation. What happens when a real crisis arises if every snowstorm is painted as the worst crisis?

Similarly, will scientists be believed anymore after decades of failed predictions regarding overpopulation, global crop failures, global cooling, global warming, etc.?

climate-change-warnings-over-the-years

Overwarning Leads to Reduced Economic Activity
When people can’t provide goods and services for each other, poverty results. Poverty, in turn, is just a step away from early death.

A storm (or just the threat of a storm) might disrupt economic activity for a day or two, but years of economic downturn will result from politicians forcing everyone to pay more for everything just so that boutique energy sources (mostly wind and solar) line the pockets of crony capitalists.

People who claim that “whether the global warming science is right or wrong we should still embrace renewable energy” don’t understand basic economics, the obscene cost of those energy sources, and the immense scale of global energy demand.

It’s like saying that shutting down NYC every time there is the threat of bad weather is the right thing to do, anyway. You know…just to be on the safe side.

We could call it the ‘Precautionary Principle’.

About that Drone that Crashed at the White House…

January 27th, 2015

With my photography hobby, I’ve been interested in the amazingly stable video that small quadcopters can now provide. You might have heard about the drone which crashed on the White House lawn in the last couple of days.

Well, according to Nick Gillespie at Reason.com, it was a drunk government employee who couldn’t control his toy who was responsible.

So, since the government can’t control it’s own employees’ use of the things, the President says we therefore need the public’s use of them to be regulated.

Actually, I do think there need to be regulations and maybe even specific laws governing their use. Maybe owners should take a training class to get some sort of nominal certification, non-certified use would lead to fines, and the owner’s name and contact information should be on the things.

I don’t really know, maybe these are bad ideas. But unchecked irresponsible use could end up being bad for all users.

The Little Blizzard that Couldn’t

January 27th, 2015

2015-blizzard-that-couldntIt was going to be epic. The worst evah. Two feet of snow or more for New York City with blizzard conditions.

But as I blogged about yesterday, the forecast uncertainty with this particular storm was unusually large. As early as yesterday noon it was looking like NYC might only get 6-12 inches.

Yes, we probably will see some snowfall records for the date broken well east of NYC, which is not that hard to do. But it’s now looking like the 12+ inch snowfalls will be restricted to eastern Massachusetts, Rhode Island, Connecticut, portions of Long Island, Vermont, New Hampshire, and Maine. All-time record snowfalls look unlikely.

Nantucket had winds gusting to 70 mph overnight, but that’s normal weather for those hardy souls. Blizzard conditions are occurring over much of the area just listed above.

So, a winter nor’easter with snow. How unusual!

Global Warming Causes Whatever We Feel Like it Causes

Despite the official IPCC view that there is no obvious connection between winter storms and Climate Change(TM), several of the usual suspects couldn’t even wait for the storm to hit before they blamed the calamity on your SUV. Bill Nye the Bow Tied Wise Guy. Kevin Trenberth.

Bill Nye even used the opportunity to blame (relatively weak) Santa Ana winds in California on global warming. Really, Bill? He also made it sound like he was the first to dream up the “weather-is-now-climate-change” meme. I guess TV really is only for entertainment now. If Bill was a real scientist, he’d be sporting a pocket protector, not a bow tie.

This morning, after being buried by literally several inches of snow (now up to about 8 inches in in Central Park), the Big Apple is picking up the pieces. Stay off the roads! Stay off the sidewalks!

Earlier this morning, Weather.com was claiming Islip, NY got 18 inches, but I find that hard to believe. Maybe in a snowdrift somewhere.

Yes, heavy precip events have become more frequent in the Northeast U.S. Yes, the North Atlantic is warm right now. But that’s mostly natural climate variability, folks. It’s probably related to some combination of the North Atlantic Oscillation (NAO) and Atlantic Multidecadal Oscillation (AMO).

But extraordinary claims related to human causation and people driving their SUVs require extraordinary evidence. So far, what we’ve seen is still in the range of natural variability. Our weather records are relatively short (only 100 years or so, at best), and it is entirely expected that storms in some regions will result in “all-time” records.

But it looks like the 2015 Blizzard that Couldn’t won’t be one of them.

And until climate scientists decide whether global warming causes more snow or less snow, don’t trust them. They will probably decide on “both”, which then makes it an untestable hypothesis, which is what climate science (and the politicians) love.

3 Feet on Long Island? How Epic will this Snowstorm Be?

January 26th, 2015

UPDATED 11 a.m. EST with GFS model forecast.

There is no question the snowstorm just entering New England will be a big one, and that local snowfall totals will set daily records in many locations.

But are we looking at an all-time storm snowfall record event?

There have been only a couple of New York City storm snowfalls which have exceeded 2 feet (24 inches). This one looks like it might exceed that, but with every 6-hourly weather forecast model cycle the story has changed from an epic storm, to a noteworthy one, then back to epic.

For example, last night’s GFS model run looked like maybe a foot or so of snow for NYC. A major inconvenience, but not an all-time record-setter.

Then, this morning’s higher-resolution NAM model is giving Long Island as much as 3 feet of snow by Tuesday evening, and at least 2 feet in NYC (first two graphics courtesy of Weatherbell.com):

Total accumulated snowfall by 10 p.m. Tuesday (Jan, 27, 2015), forecast by the NAM model on Monday morning.

Total accumulated snowfall by 10 p.m. Tuesday (Jan, 27, 2015), forecast by the NAM model on Monday morning.

Then, the GFS model came out with only 6-12 inches for the NYC area.

This indecision by the computer models has been going on for the last few days. All we know for sure is that the most recent forecast is usually the most accurate, but we now have wildly conflicting forecasts from the two most recent model runs. The GFS model has the heaviest snow total — approaching 2 feet — over southeast Massachusetts. Much of the rest of coastal New England is forecast to get about 1 foot of snow:

Total snowfall forecast by Tuesday night Jan. 27 2015 from the Monday morning run of the GFS model.

Total snowfall forecast by Tuesday night Jan. 27 2015 from the Monday morning run of the GFS model.

Which model is usually better? For this kind of event, the GFS model (less snow) is usually (but not always) more accurate.

Finally, we have the NWS multi-model product (using over 50 different models and model ensemble members…even using ECMWF) which comes up with sort of a best-estimate of the total snowfall (click for full-size):

57-model member "best" forecast of total snowfall ending Thursday morning, Jan. 29, 2015.

57-model member “best” forecast of total snowfall ending Thursday morning, Jan. 29, 2015.

Note that it is calling for 15-18 inches for the NYC-Long Island area, increasing to 2 feet around Boston.

The Long Island snowfall record was smashed on Dec. 20, 2009 when just over 2 feet of snow piled up.

In New York City, many snowstorms have produced 15 inch snowfalls, but only a couple have produced 2-foot snowfalls. In Feb. 2006, the all-time record was set at just under 27 inches. In 2nd place, December 26-27, 1947 saw a 26 inch snowfall.

High winds will make the current storm worse than normal for a snowstorm, with winds easily gusting over 30 mph in NYC, but Long Island and portions of coastal New England can expect 50+ mph gusts. In this kind of weather situation, it is also likely that lightning and thunder will occur in some locations. Most of the snow will fall tonight and early tomorrow.

What I’m dreading is for the next week reporters are going to be asking me about the role of global warming in all of this. Well, if the weather conditions were only 5 deg. or so warmer, we would be talking about a wind and rain non-event. But with colder air, it will be a major snowstorm.

Now, if you really believe global warming causes colder conditions, I have a snow-covered bridge in Brooklyn I’d like to sell you.

With the media now in full-panic mode, over three thousands flights cancelled, and Connecticut banning all auto travel after 9 p.m., it will be interesting to see how all this plays out. Say, with tomorrow’s photos of the stranded cars:

stranded-car