Earliest Snow in Columbia, SC

November 1st, 2014

As I predicted two days ago, the earliest snows on record are beginning to occur in the Carolinas.

Columbia, SC has just experienced their earliest snow in 125 years of weather records, beating the Nov. 9, 1913 earliest snow record by 8 days. Current South Carolina weather shows it’s still snowing in Greenville, SC.

The Christian Science Monitor is reporting Greenville was especially hard hit with downed trees and power outages. The Smokey Mtns received up to 16 inches overnight. The current U.S. snow cover map shows 18 states with some amount of snow this morning.

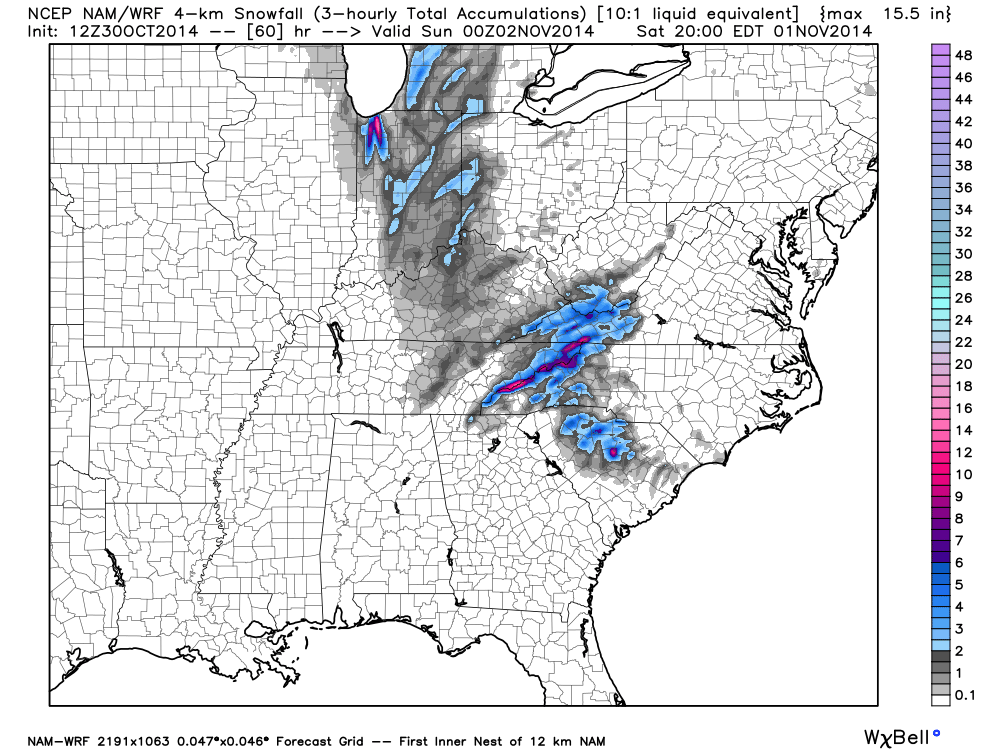
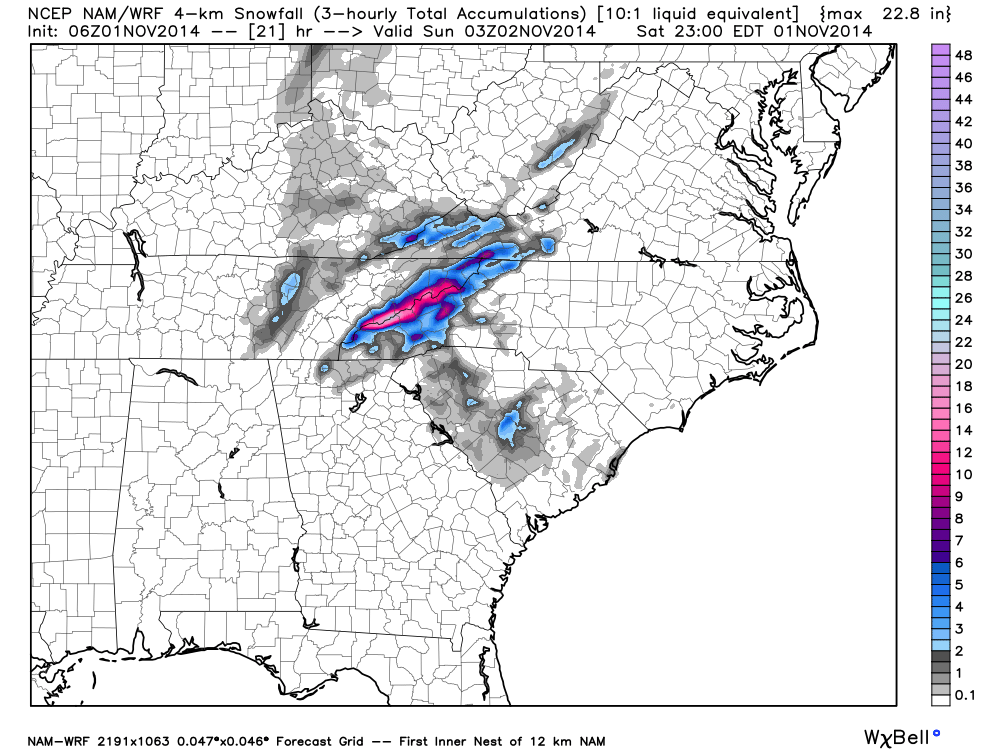
Here is the latest model forecast of total snowfall ending at midnight tonight (graphic courtesy of Weatherbell.com):
hires_snow_acc_nc_7

Early indications are that next Sunday the “polar express” will arrive in the northern plains and Great Lakes with bitterly cold air currently sitting over northern Siberia.

Do Satellite Temperature Trends Have a Spurious Cooling from Clouds?

October 30th, 2014

The validity of the satellite record of global temperature is sometimes questioned; especially since it shows only about 50% of the warming trend as do surface thermometers over the 36+ year period of satellite record.

The satellite measurements are based upon thermal microwave emissions by oxygen in the atmosphere. But like any remote sensing technique, the measurements include small contaminating effects, in this case cloud water, precipitation systems, and variations in surface emissivity.

A new paper by Weng et al. has been published in Climate Dynamics, entitled “Uncertainty of AMSU-A derived temperature trends in relationship with clouds and precipitation over ocean”, which examines the influence of clouds on the satellite measurements.

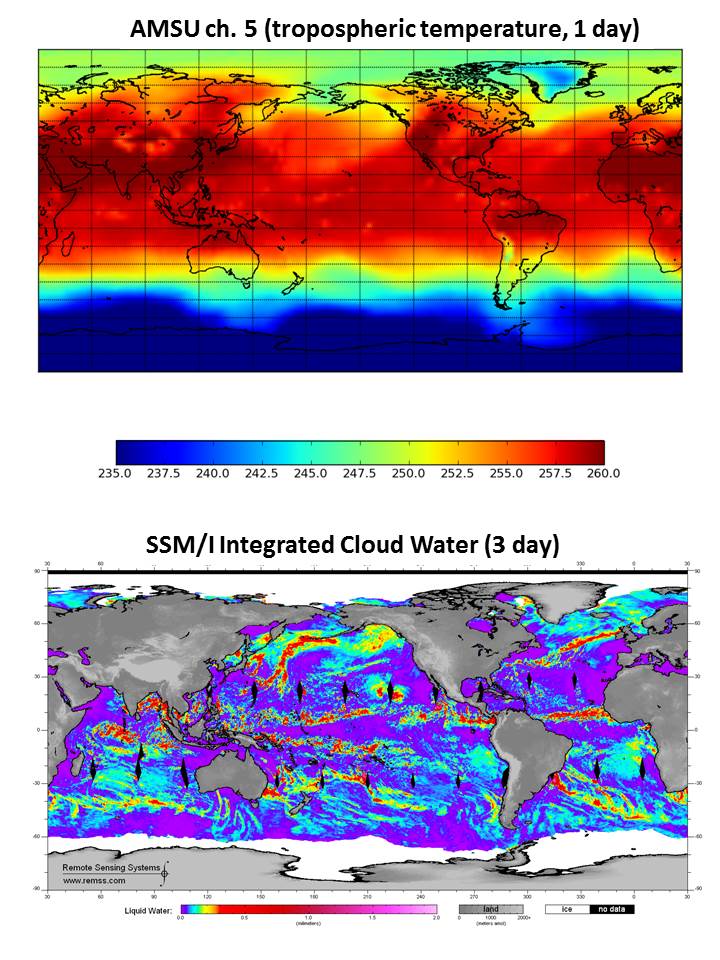
To see how clouds and precipitation can affect the satellite temperatures, here’s an example of one day (August 6, 1998) of AMSU ch. 5 data (which is used in both our mid-tropospheric and lower-tropospheric temperature products), and the corresponding SSM/I-derived cloud water for the same day:

Fig. 1. One day of AMSU limb-corrected ch. 5 brightness temperatures (top), and the corresponding SSM/I cloud water retrievals centered on the same day (August 6, 1998).

Fig. 1. One day of AMSU limb-corrected ch. 5 brightness temperatures (top), and the corresponding SSM/I cloud water retrievals centered on the same day (August 6, 1998).

As can be seen, the contamination of AMSU5 by cloud and precipitation systems is small, with slight cooling in deep convective areas, and no obvious cloud water contamination elsewhere (cirrus clouds are essentially transparent at this microwave frequency).

And even if there is contamination, what matters for tropospheric temperature trends isn’t the average level of contamination, but whether there are trends in that contamination. Below I will discuss new estimates of both the average contamination, as well as the effect on tropospheric temperature trends.

The fact that our monthly gridpoint radiosonde validation shows an extremely high level of agreement with the satellite further supports our assumption that such contamination is small. Nevertheless, it is probably worth revisiting the cloud-contamination issue, since the satellite temperature trends are significantly lower than the surface temperature trends, and any potential source of error is worth investigating.

What Weng et al. add to the discussion is the potential for spurious warming effects in AMSU ch. 5 of cloud water not associated with heavy precipitation, something which we did not address 18 years ago. While these warming influences are much weaker than the cooling effects of precipitation systems (as can be seen in the above imagery), cloud water is much more widespread, and so its influence on global averages might not be negligible.

The Weng et al Results Versus Ours (UAH)

I’m going to go ahead and give the final result up front for those who don’t want to wade through the details.

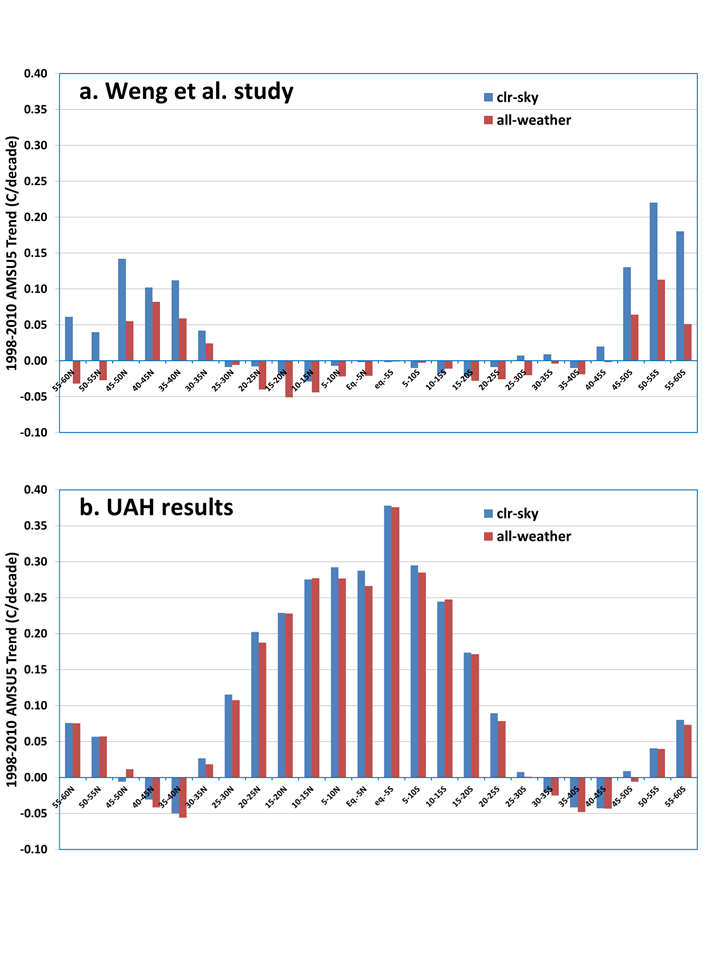
Weng et al. restrict their analysis to 13 years (1998-2010) of data from one satellite, NOAA-15, and find a spurious cooling effect from cloud contamination in the middle latitudes, with little effect in the tropics. (They don’t state how they assume their result based upon 13 years, even if it was correct, can be applied to 35+ years of satellite data.) I’ve digitized the data in their Fig. 8, so that I can compare to our results (click image for full size):

Oceanic trends by latitude band in AMSU5 during late 1998 to mid-2010 in the Weng et al. study (top) and our own calculations (bottom), for "all-weather" and "clear-sky" conditions.

Fig. 2. Oceanic trends by latitude band in AMSU5 during late 1998 to mid-2010 in the Weng et al. study (top) and our own calculations (bottom), for “all-weather” and “clear-sky” conditions.

There are two main points to take away from this figure. First, the temperature trends they get at different latitudes for 1998-2010 are VERY different from what we get, even in the “all-weather” case, which is simply including all ocean data whether cloud-contaminated or not. The large warming signal we get in the tropics is fully expected for this limited period, which starts during a very cool La Nina event, and ends during a very warm El Nino event.

I have spent most of this week slicing and dicing the data different ways, and I simply do not see how they could have gotten the near-zero trends they did in the tropics and subtropics. I suspect some sort of data processing error.

The second point (which was the main point of their paper) is the difference in “clear-sky” versus “all-weather” trends they got in the middle latitudes, which is almost non-existent in our (UAH) results. While they estimate up to a 30% spurious cooling of warming trends from cloud contamination, we estimate a global ocean average spurious cooling of only -0.006 deg. C/decade for 1998-2010 from not adjusting for cloud-contaminated data in our operational product. Most of this signal is probably related to the large change in cloud conditions going from La Nina to El Nino, and so it would likely be even less for the 36+ year satellite record.

While I used a different method for identifying and removing cloud contamination (I use localized warm spots in AMSU ch. 3, they use a retrieval scheme using AMSU ch. 1 & 2), I get about the same number of data screened out (40%) as they do (20%-50%), and the geographic distribution of my identified cloud and precip. systems match known regional distributions. So I don’t see how different cloud identification methodologies can explain the differences. I used AMSU prints 10-21 (like our operation processing), as well as their restricted use of just prints 15 & 16, and got nearly the same results, so that can’t explain the discrepancy, either.

I have many more plots I’m not showing relating to how cloud systems in general: (1) do indeed cause a small average warming of the AMSU5 measurements (by up to 0.1 deg. C); (2) less frequent precipitation systems cause localized cooling of about 1 deg. C; (3) how these effects average out to much smaller influences when averaged with non-contaminated data; and most importantly (4) the trends in these effects are near zero anyway, which is what matters for climate monitoring.

We are considering adding an adjustment for cloud contaminated data to a later version of the satellite data. I’ve found that a simple data replacement scheme can eliminate an average of 50% of the trend contamination (you shouldn’t simply throw away all cloud-influenced data…we don’t do that for thermometer data, and it could cause serious sampling problems); the question we are struggling with is whether the small level of contamination is even worth adjusting for.

Polar Vortex Charleston

October 30th, 2014

A cold airmass plunging out of Canada and a coastal low developing off the Carolinas by Saturday is the kind of weather event you expect in January — not November 1.

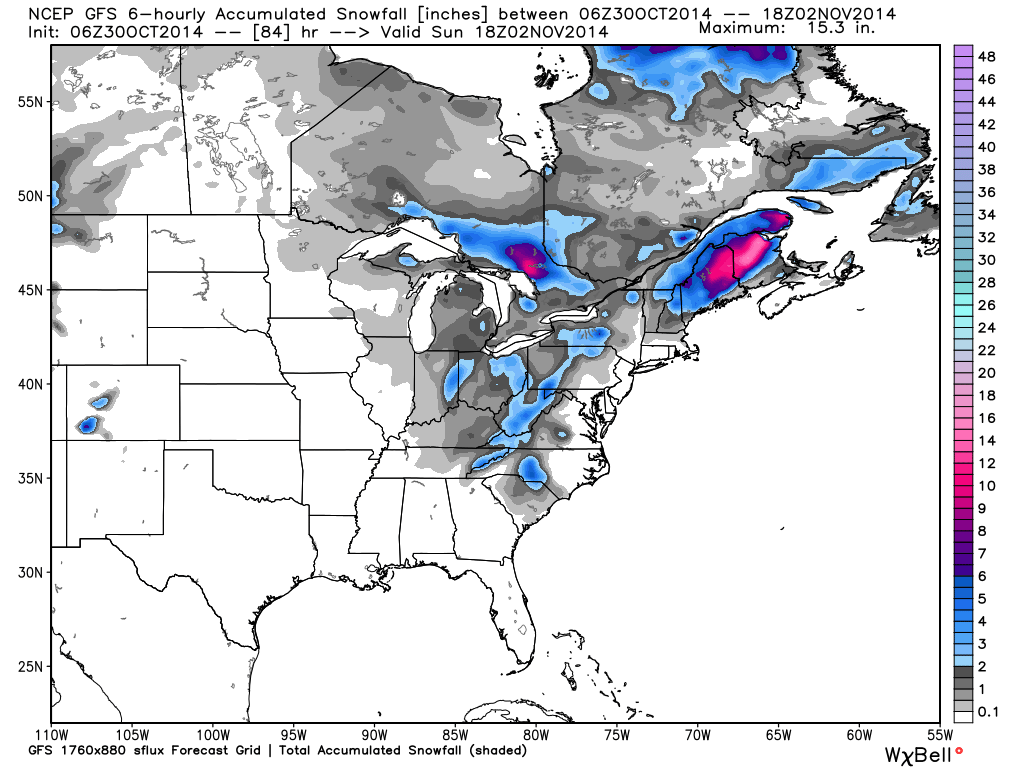
Snow is expected to fall over portions of 18 eastern states over the next 3 days, with the potential for earliest-ever snowfall in portions of the Carolinas by noon on Sunday (all forecast graphics courtesy of WeatherBell.com):

Total snowfall forecast by noon, Sunday, Nov. 2, 2014.

Total snowfall forecast by noon, Sunday, Nov. 2, 2014.

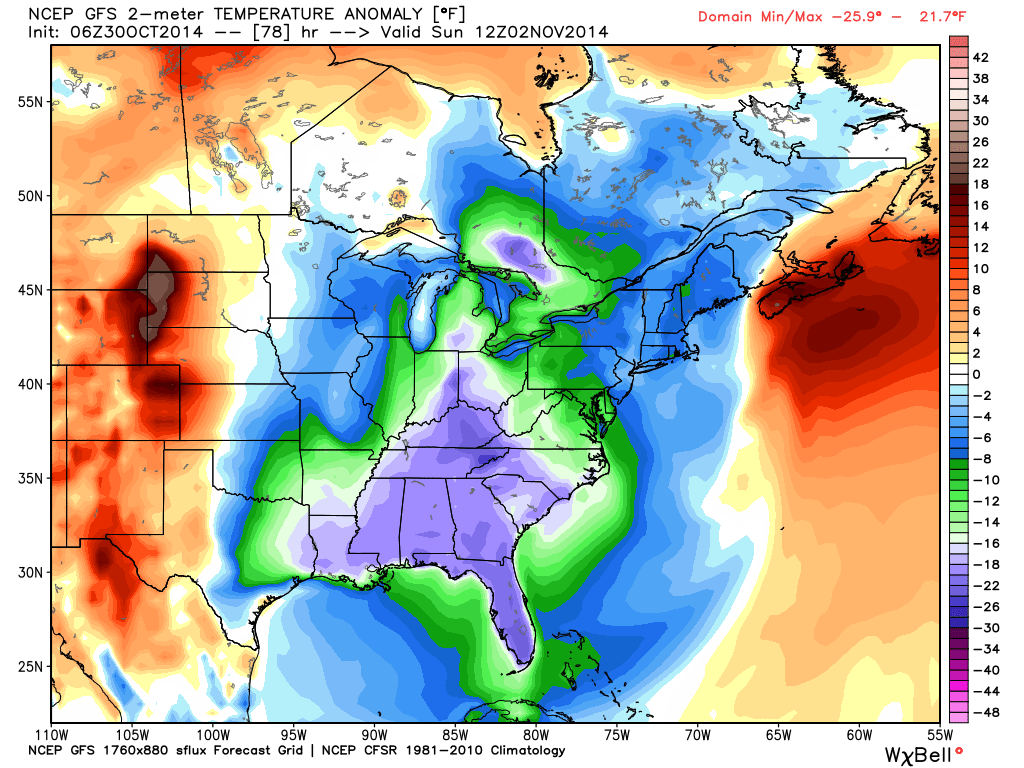
The surface air temperature departures from normal show this cold event pushing unusually far south for this time of year, with 20 deg. F below normal over much of the southeast, including all of Florida by Sunday morning:

Surface temperature departures from normal forecast at sunrise, Sunday, Nov. 2, 2014.

Surface temperature departures from normal forecast at sunrise, Sunday, Nov. 2, 2014.

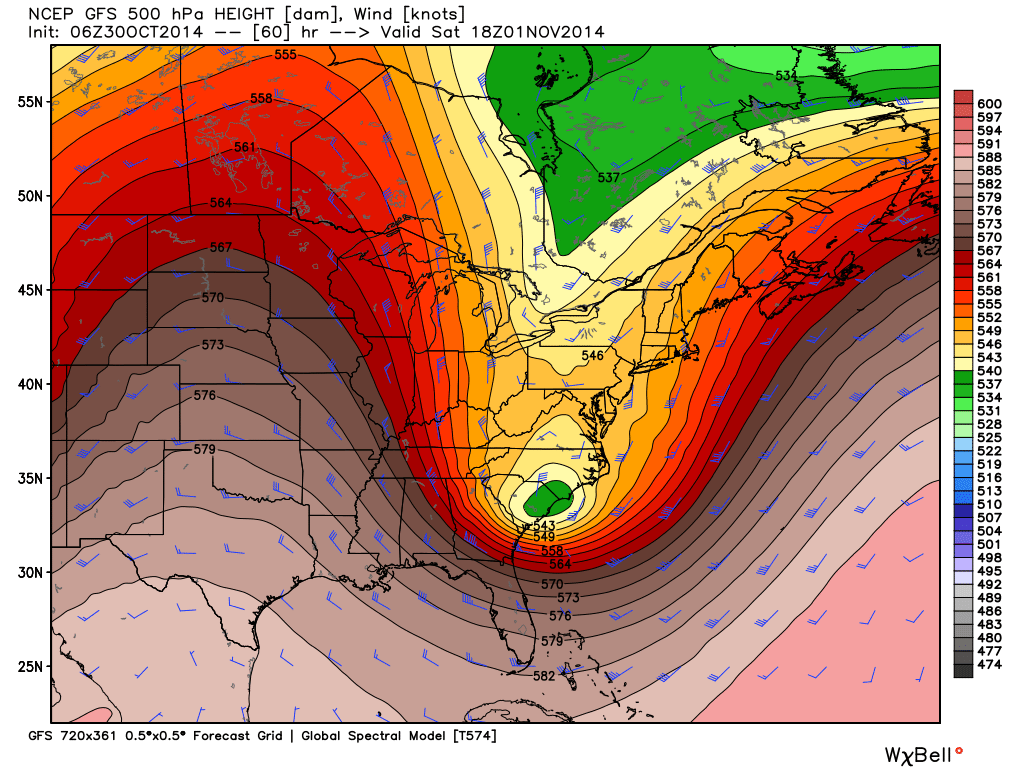
The deep, cold airmass is what causes the “polar vortex”, which is the swirling of upper-air winds around the airmass. By noon on Saturday, the rapidly moving vortex will be centered near Charleston, SC:

"Polar vortex" pattern at 18,000 ft altitude forecast to be centered near Charleston at noon, Saturday, Nov. 1, 2014.

“Polar vortex” pattern at 18,000 ft altitude forecast to be centered near Charleston at noon, Saturday, Nov. 1, 2014.

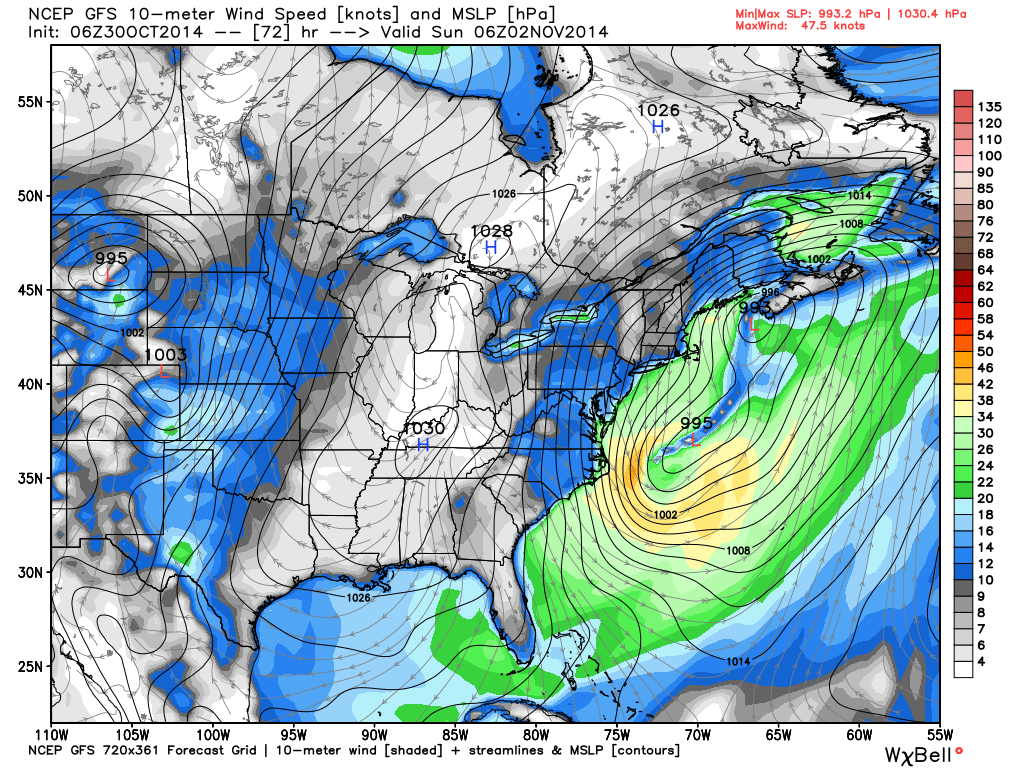
Luckily, the deepening low pressure off the coast is expected to stay offshore, with northerly winds at Cape Hatteras around 50 mph Saturday night:

Surface pressure and wind patterns forecast for Saturday night.

Surface pressure and wind patterns forecast for Saturday night.


By Sunday evening, the low is forecast to be centered over the Gulf of St. Lawrence, and by Tuesday morning total snow accumulations of 1 to 2 feet or more are expected over portions of Maine and the Canadian Maritimes.

UPDATE (11:30 a.m. EDT Oct. 30):
Here’s the latest high-resolution model forecast of snowfall ending Saturday evening, showing flurries reaching scattered coastal areas of the Carolinas, and 6″-12″ snowfalls in the Smokey Mountains and to the lee of Lake Michigan in NW Indiana:
hires_snow_acc_ky_20

Sunspot 2192 Time Lapse Video

October 25th, 2014

I missed Thursday’s solar eclipse due to clouds, but here’s a sunset time lapse video I created from last evening which clearly shows sunspot 2192, the largest sunspot group in 18 years. This was taken 1 hour after the sunspot released an X-class solar flare:

Sunset time lapse with giant sunspot 2192 from Roy Spencer on Vimeo.

Green Meme Friday

October 24th, 2014

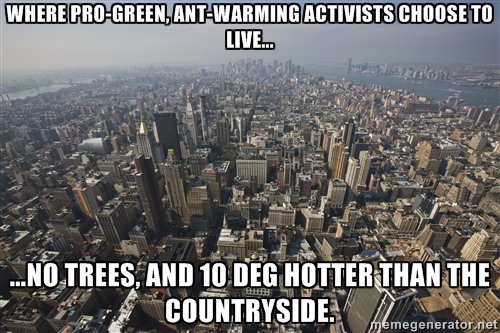
In commemoration of green hypocrisy.

One-does-not-simply

so-your-actors-can-have-jets

NYC-where-greens-live

green-energy-doo-doo

take-rich-peoples-money-thatd-be-great

Our Initial Comments on the Abraham et al. Critique of the Spencer & Braswell 1D model

October 23rd, 2014

Our 1D forcing-feedback-mixing model published in January 2014 (and not paywalled, but also here) addressed the global average ocean temperature changes observed from the surface to 700 m depth, with the model extending to 2,000 m depth.

We used the 1D model to obtain a consensus-supporting climate sensitivity when traditional forcings were used (mostly anthropogenic GHGs, aerosols, and volcanoes), but a much smaller 1.3 deg. C climate sensitivity if the observed history of ENSO was included, which was shown from CERES satellite measurements to modulate the Earth’s radiative budget naturally (what we called “internal radiative forcing” of the climate system).

Abraham et al. recently published an open source paper addressing the various assumptions in our model. While we have only had a couple days to look at it, in response to multiple requests for comment I am now posting some initial reactions.

Abraham et al. take great pains to fault the validity of a simple 1D climate model to examine climate sensitivity. But as we state in our paper (and as James Hansen has even written), in the global average all that really matters for the rate of rise of temperature is (1) forcing, (2) feedback, and (3) ocean mixing. These three basic processes can be addressed in a 1D model. Advective processes (horizontal transports) vanish in the global ocean average.

They further ignore the evidence we present (our Fig. 1 in Spencer & Braswell, 2014) that a 1D model might actually be preferable from the standpoint of energy conservation, since the 3D models do not appear to conserve energy – a basic requirement in virtually any physical modelling enterprise. Some of the CMIP3 models’ deep ocean temperature changes in apparent contradiction to whether the climate system is being radiative forced from above. Since the 3D models do not include a changing geothermal heat flux, this suggests a violation of the 1st Law of Thermodynamics. (Three of the 13 models we examined cooled most of deep ocean since 1955, despite increasing energy input from above. How does that happen?)

On this point, how is it that Abraham et al. nitpick a 1D model that CAN explain the observations, but the authors do not fault the IPCC 3D models which CANNOT explain the observations, and possibly don’t even conserve energy in the deep ocean?

Regarding their specific summary points (in bold):

1. The model treats the entire Earth as ocean-covered.
Not true, and a red herring anyway. We model the observed change in ocean heat content since 1955, and it doesn’t matter if the ocean covers 20% of the globe or 100%. They incorrectly state that ignoring the 30% land mass of the Earth will bias the sensitivity estimates. This is wrong. All energy fluxes are per sq. meter, and the calculations are independent of the area covered by the ocean. We are surprised the authors (and the reviewers) did not grasp this basic point.

2. The model assigns an ocean process (El Nino cycle) which covers a limited geographic region in the Pacific Ocean as a global phenomenon…
This is irrelevant. We modeled the OBSERVED change in global average ocean heat content, including the observed GLOBAL average expression of ENSO in the upper 200 m of the GLOBAL average ocean temperature.

3. The model incorrectly simulates the upper layer of the ocean in the numerical calculation.
There are indeed different assumptions which can be made regarding how the surface temperature relates to the average temperature of the first layer, which is assumed to be 50 m thick. How these various assumptions change the final conclusion will require additional work on our part.

4. The model incorrectly insulates the ocean bottom at 2000 meters depth.
This approximation should not substantially matter for the purpose the model is being used. We stopped at 2,000 m depth because the results did not substantially depend upon it going any deeper.

5. The model leads to diffusivity values that are significantly larger than those used in the literature.

We are very surprised this is even an issue, since we took great pains to point out in our paper that the *effective* diffusivity values we used in the model are meant to represent *all* modes of vertical mixing, not just diffusivity per se. If the authors read our paper, they should know this. And why did the reviewers not catch this basic oversight? Did the reviewers even read our paper to see whether Abraham et al. were misrepresenting what it claimed? Again, the *effective* diffusivity is meant to represent all modes of vertical heat transport (this is also related to point #8, below). All the model requires is a way to distribute heat vertically, and a diffusion-type operator is one convenient method for doing that.

6. The model incorrectly uses an asymmetric diffusivity to calculate heat transfer between adjacent layers, and
7. The model contains incorrect determination of element interface diffusivity.

The authors discuss ways in which the implementation of the diffusion operator can be more accurately expressed. This might well be the case (we need to study it more). But it should not impact the final conclusions because we adjust the assumed effective diffusivities to best match the observations of how the ocean warms and cools at various depths. If there was a bias in the numerical implementation of the diffusion operator (even off by a fact of 10), then the effective diffusivity values will simply adjust until the model matches the observations. The important thing is that, as the surface warms, the extra heat is mixed downward in a fashion which matches the observations. Arguing over the numerical implementation obscures this basic fact. Finally, a better implementation of diffusivity calculation still must then be run with a variety of effective diffusivities (and climate sensitivities) until a match with the observations has been obtained, which as far as we can tell the authors did not do. The same would apply to a 3D model simulation…when one major change is implemented, other model changes are often necessary to get realistic results.

8. The model neglects advection (water flow) on heat transfer.
Again, there is no advection in the global average ocean. The authors should know this, and so should the reviewers of their paper. Our *effective* diffusivity, as we state in the paper, is meant to represent all processes that cause vertical mixing of heat in the ocean, including formation of cold deep water at high latitudes. Why did neither the authors nor the reviewers of the paper not catch this basic oversight? Again, we wonder how closely anyone read our paper.

9. The model neglects latent heat transfer between the atmosphere and the ocean surface.
Not true. As we said in our paper, processes like surface evaporation, convective heat transfer, latent heat release, while not explicitly included, are implicitly included because the atmosphere is assumed to be in convective equilibrium with the surface. Our use of 3.2 W/m2 change in OLR with a surface temperature change of 1 deg. C is the generally assumed global-average value for the effective radiating temperature of the surface-atmosphere system. This is the way in which a surface temperature change is realistically translated into a change in top-of-atmosphere OLR, without having to explicitly include latent heat transfer, atmospheric convection, temperature lapse rate, etc.

Final Comments
If our model is so far from reality, maybe Abraham et al. can tell us why the model works when we run it in the non-ENSO mode (mainly greenhouse gas, aerosol, and volcanic forcing) , yielding a climate sensitivity similar to many of the CMIP models (2.2 deg. C). If the model deficiencies are that great, shouldn’t the model lead to a biased result for this simple case? Again, they cannot obtain a “corrected” model run by changing only one thing (e.g. the numerical diffusion scheme) without sweeping the other model parameters (e.g. the effective diffusivities) to get a best match to the observations.

These are our initial reactions after only a quick look at the paper. It will take a while to examine a couple of the criticisms in more detail. For now, the only one we can see which might change our conclusions in a significant way is our assumption that surface temperature changes have the same magnitude as the average temperature change in the top (50 m) layer of the model. In reality, surface changes should be a little larger, which will change the feedback strength. It will take time to address such issues, and we are now under a new DOE contract to do climate model validation.
Solar Eclipse Today and the Largest Sunspot in 18 Years

October 23rd, 2014

Just a reminder of the partial solar eclipse today, Thursday October 23, which will provide eastern U.S. watchers with the best display near sunset. Do not view the sun without eye protection! (even multiple sunglasses are unsafe)

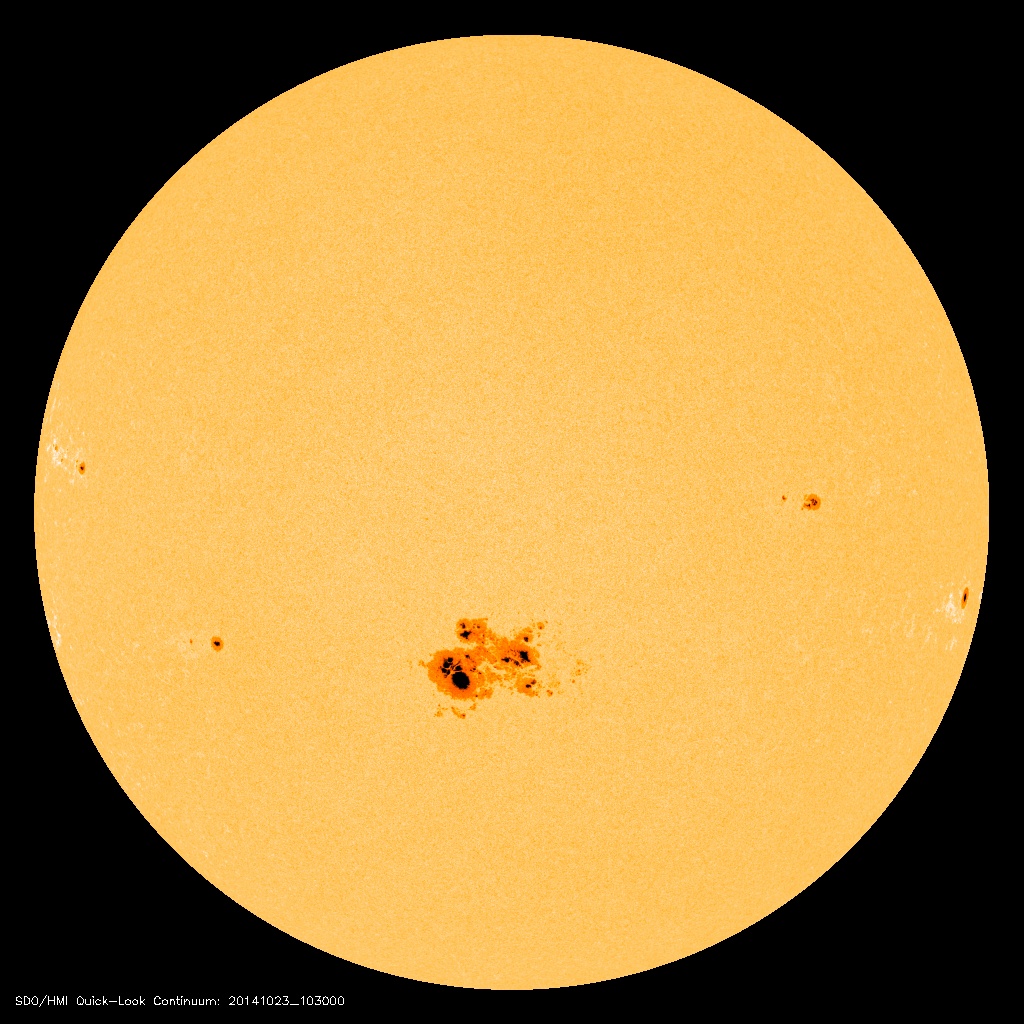
Giant sunspot group 2192, the largest since 1996, will also be pointed toward Earth. This spot has been “crackling” with flares, and it is a little mystifying that a large coronal mass ejection (CME) event has not yet occurred. Here’s a self-updating movie of the solar disk through today, as sunspot 2192 rotates into an Earth-pointing position:

A major CME event in the next few days from Sunspot 2192 could produce auroral displays into the middle latitudes a few days after the CME.

Over the eastern U.S. the eclipse will peak near sunset, and over the western U.S. the eclipse will occur during the afternoon and end before sunset. Weather will allow viewing over much of the country, but cloudy and rainy weather will exist at eclipse time over the Pacific Northwest, Wisconsin, and New England. Here’s a cloud forecast movie for the U.S.

I’ll be doing a time lapse video of the setting sun, weather permitting, when the partial eclipse will peak at about 40% at sunset at my location. I hope to also catch the sunspot group, which currently looks like this in visible light:

Sunspot group 2192 on October 23, 2014, as seen by the Solar Dynamics Observatory.

Sunspot group 2192 on October 23, 2014, as seen by the Solar Dynamics Observatory.

Here’s an eclipse calculator simulation for your location.

DO NOT view the sun with the naked eye! Advice on methods for safely viewing the sun are provided by Astro Bob at UniverseToday.com.

Why 2014 Won’t Be the Warmest Year on Record

October 21st, 2014

Much is being made of the “global” surface thermometer data, which three-quarters the way through 2014 is now suggesting the global average this year will be the warmest in the modern instrumental record.

I claim 2014 won’t be the warmest global-average year on record.

..if for no other reason than this: thermometers cannot measure global averages — only satellites can. The satellite instruments measure nearly every cubic kilometer – hell, every cubic inch — of the lower atmosphere on a daily basis. You can travel hundreds if not thousands of kilometers without finding a thermometer nearby.

(And even if 2014 or 2015 turns out to be the warmest, this is not a cause for concern…more about that later).

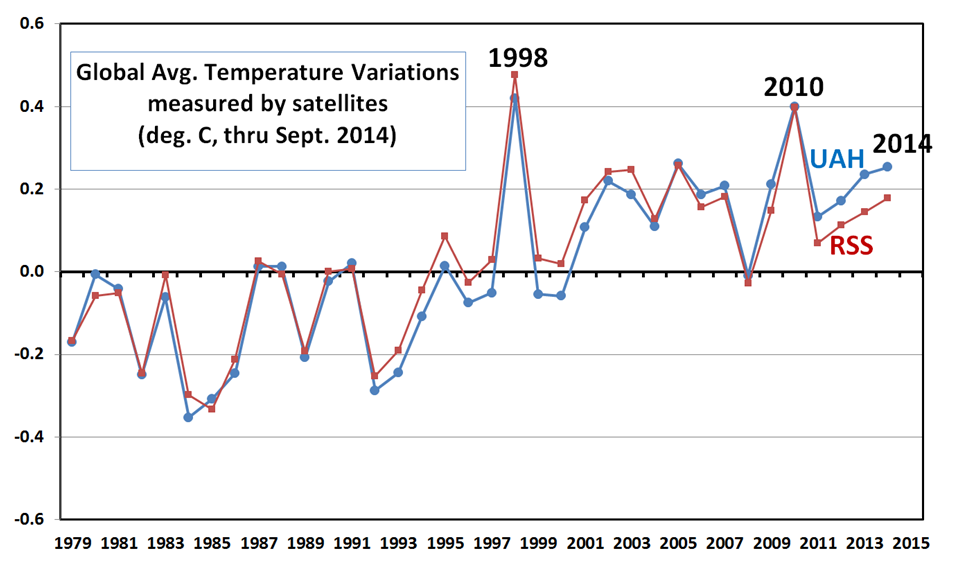
The two main research groups tracking global lower-tropospheric temperatures (our UAH group, and the Remote Sensing Systems [RSS] group) show 2014 lagging significantly behind 2010 and especially 1998:

Yearly-global-LT-UAH-RSS-thru-Sept-2014

With only 3 months left in the year, there is no realistic way for 2014 to set a record in the satellite data.

Granted, the satellites are less good at sampling right near the poles, but compared to the very sparse data from the thermometer network we are in fat city coverage-wise with the satellite data.

In my opinion, though, a bigger problem than the spotty sampling of the thermometer data is the endless adjustment game applied to the thermometer data. The thermometer network is made up of a patchwork of non-research quality instruments that were never made to monitor long-term temperature changes to tenths or hundredths of a degree, and the huge data voids around the world are either ignored or in-filled with fictitious data.

Furthermore, land-based thermometers are placed where people live, and people build stuff, often replacing cooling vegetation with manmade structures that cause an artificial warming (urban heat island, UHI) effect right around the thermometer. The data adjustment processes in place cannot reliably remove the UHI effect because it can’t be distinguished from real global warming.

Satellite microwave radiometers, however, are equipped with laboratory-calibrated platinum resistance thermometers, which have demonstrated stability to thousandths of a degree over many years, and which are used to continuously calibrate the satellite instruments once every 8 seconds. The satellite measurements still have residual calibration effects that must be adjusted for, but these are usually on the order of hundredths of a degree, rather than tenths or whole degrees in the case of ground-based thermometers.

And, it is of continuing amusement to us that the global warming skeptic community now tracks the RSS satellite product rather than our UAH dataset. RSS was originally supposed to provide a quality check on our product (a worthy and necessary goal) and was heralded by the global warming alarmist community. But since RSS shows a slight cooling trend since the 1998 super El Nino, and the UAH dataset doesn’t, it is more referenced by the skeptic community now. Too funny.

In the meantime, the alarmists will continue to use the outdated, spotty, and heavily-massaged thermometer data to support their case. For a group that trumpets the high-tech climate modeling effort used to guide energy policy — models which have failed to forecast (or even hindcast!) the lack of warming in recent years — they sure do cling bitterly to whatever will support their case.

As British economist Ronald Coase once said, “If you torture the data long enough, it will confess to anything.”

So, why are the surface thermometer data used to the exclusion of our best technology — satellites — when tracking global temperatures? Because they better support the narrative of a dangerously warming planet.

Except, as the public can tell, the changes in global temperature aren’t even on their radar screen (sorry for the metaphor).

Of course, 2015 could still set a record if the current El Nino ever gets its act together. But I’m predicting it won’t.

Which brings me to my second point. If global temperatures were slowly rising at, say, a hundredth of a degree per year and we didn’t have cool La nina or warm El Nino years, then every year would be a new record warm year.

But so what?

It’s the amount of temperature rise that matters. And for a planet where all forms of life experience much wider swings in temperature than “global warming” is producing, which might be 1 deg. C so far, those life forms — including the ones who vote — really don’t care that much. We are arguing over the significance of hundredths of a degree, which no one can actually feel.

Not surprisingly, the effects on severe weather are also unmeasurable …despite what some creative-writing “journalists” are trying to get you to believe. Severe weather varies tremendously, especially on a local basis, and to worry that the average (whatever than means) might change slightly is a total misplacement of emphasis.

Besides, once you consider that there’s nothing substantial we can do about the global warming “problem” in the near term, short of plunging humanity into a new economic Dark Age and killing millions of people in the process, its a wonder that climate is even on the list of the public’s concerns, let alone at the bottom of the list.

Ode to Misinterpretations of the Second Law

October 21st, 2014

Inspired by a couple comments from my solar eclipse post.

He said an object that was cold
Could not make something warm still warmer
So he donned his coat, went out the door
To prove the truth of former.

“See?” he said, “the sky is cold”
“and so it cannot warm”
Then back inside he merrily went,
Removing the cold coat he’d worn.

-Burma-Shave

Solar Thursday USA: An Eclipse AND a Massive Sunspot Group

October 20th, 2014

Residents of the eastern U.S. will be in a particularly good location to see a partial solar eclipse which will peak near sunset on Thursday, Oct. 23, and as a bonus the giant sunspot group 2192 should also be visible.

Here’s what sunspot 2192 looks like in recent days as it slowly rotates toward the central portion of the solar disk:

Sunspot 2192 has been pumping out solar flares on a daily basis, and has a good chance of producing an Earth-directed coronal mass ejection (CME) over the next week, which would lead to auroral displays.

As of right now, the best viewing of the eclipse looks like it will be in a general swath from the Upper Plains and Great Lakes (~60% solar disk coverage) through the Midwest and Ohio Valley toward the southeast U.S. The northeast U.S. viewing will depend on how much cloud cover remains from a slowly retreating low pressure system…some breaks in the clouds will allow at least scattered viewing there. Over the western U.S. the eclipse will occur during the afternoon and end before sunset.

Here in north Alabama I’ll be doing a time lapse video of the setting sun, weather permitting, when the partial eclipse will peak at about 40% at sunset.

Here’s an eclipse calculator simulation for your location.

DO NOT view the sun with the naked eye! Advice on methods for safely viewing the sun are provided by Astro Bob at UniverseToday.com.